depositional environments of sam-bis oil field reservoir ... · pdf filedepositional...
TRANSCRIPT

Available online at www.pelagiaresearchlibrary.com
Pelagia Research Library
Advances in Applied Science Research, 2012, 3 (3):1624-1638
ISSN: 0976-8610 CODEN (USA): AASRFC
1624 Pelagia Research Library
Depositional environments of sam-bis oil field reservoir sands, Niger Delta, Nigeria
1Oyanyan, R. O., 2Soronnadi-Ononiwu, C. G. and 1Omoboriowo, A. O
1Department of Geology, University of Port Harcourt, Port Harcourt, Nigeria
2Department of Geology, Niger Delta University, Wilberforce Island, Bayelsa, Nigeria ______________________________________________________________________________ ABSTRACT Geological analysis of core samples and qualitative interpretation of wireline log shapes aided the identification of seven depositional environments of various sand units in Sam-Bis oil field. These include distributary channels, mouth bar, point bar, tidal channel, tidal flat, middle shoreface and lower shoreface. Percentage volume of shale calculated and documented flowage and storage properties of typical sand units show that the environments of deposition formed very good reservoirs with few exceptions. The sedimentary core log of two cored hydrocarbon bearing intervals showing depositional interpretation and key sedimentary structures observed in core samples reflects heterogeneities associated with sedimentary processes; that can have impact on hydrocarbon recovery. ______________________________________________________________________________
INTRODUCTION
A reservoir rock may be defined as a formation that has the capacity to store fluid and have the ability to release the fluid when tapped as a resource (Etu –Efeotor, 1997). Such fluid can be oil, gas or water. Therefore, the exploration for oil and gas in the Niger Delta is actually, the search for hydrocarbon bearing reservoir which is either carbonates or clastics (sandstone and conglomerate). Studies by geologists such as Short and Stauble (1967), Weber and Daukoru (1975), Doust and Omatsola (1990), Reijer (2011), etc reveal that the reservoir rocks in Niger Delta are mainly sandstone. The exploration and development of a reservoir requires reasonable understanding of its occurrence and morphology. Sandstone occurs in different sedimentary environments, which is a part of the earth’s surface that is physically, chemically and biologically distinct from adjacent terrains. (Selley, 1985). The variation in sedimentary environments may be attributed to differences in energy levels, flow velocity and climate, resulting in differences in morphologies and qualities of sandstone reservoir. The environment of deposition of sediment is the sum of the physical, chemical and biological condition under which it was deposited. These conditions are recorded in the form of sedimentary facies, which is a mass of sedimentary rock that can be defined and distinguished from others by observed rock properties such as lithology, texture, sedimentary structures, geometry, fossils and paleocurrent pattern displayed in sequence on core samples and some in wireline logs. From observed succession of these rock properties in sandstone, a judgment can be made of the transporting medium, the condition of flow at the time of deposition, the nature of the depositional site and then qualitatively predict the quality of the reservoir sand body. According to Tyler et al. (1991), average recovery efficiency of oil could be tied closely to depositional environments and recovery mechanism. Weber and Daukoru (1975), Evamy (1978), Ekweozor and Okoye (1980) have reported in their works on Niger Delta reservoir rocks, that the quality of the sandstones as initially deposited is a function of the source area, the depositional processes and the environment in which the deposition takes place. To advance this knowledge, the depositional characteristics of reservoir sands of “Sam-Bis” field, Niger delta were studied using core and logs of

Oyanyan, R. O., et al Adv. Appl. Sci. Res., 2012, 3(3):1624-1638 _____________________________________________________________________________
1625 Pelagia Research Library
“Sam 4” well which is considered the type well because it contains the only core of Sam-Bis field. The materials were supplied by Agip oil company Port Harcourt with the Permission of Department of Petroleum Resources, Federal ministry of petroleum Nigeria.
Fig 1: (A) Map of Niger delta showing study field location. (B) Base map of Sam-Bis field.
Core and wireline logs are combined for both depositional environment interpretations. Archer et al. (1986) defined a core as a sample of rock from a well section generally obtained by drilling into the formation with a hollow section drill pipe or bit. While wireline logs, is a down hole record of rock properties made during drilling or after the drilling of a well. It measures the electrical, radioactive and acoustic properties, which are, used to derive information on lithology, grain size, density, porosity and the pore fluids. (Readings, 1996). Their combination is necessary as the interpretation of a cored section can be correlated to the response of the same section on well logs. With the knowledge of depositional environment from the cored section, differences in well log patterns can generally be attributed to lateral changes in rock character, which in turn, can be identified in relation to the section interpreted. Therefore, the use of core in this study, giving direct knowledge of the rock, increases the reliability of wireline logs. Objectives Of Study The objectives of this study are to use core and wireline logs to investigate the lithological, textural and structural characteristics of sand bodies in the cored intervals and correlate them with wireline log pattern, to establish their probable environments of deposition and also identify and interpret depositional characteristics of non-cored interval using wireline log shape.
Study field
YENOGOA
PORTHARCOURT
OML 61
TOWN
50 6 E0 7 E0
WARRI
E
6 N0
5 N0
4 N0
6 N0
5 N0
4 N0
8 E0
A
B

Oyanyan, R. O., et al Adv. Appl. Sci. Res., 2012, 3(3):1624-1638 _____________________________________________________________________________
1626 Pelagia Research Library
Field Location The oil field in Niger delta used for this study is personally named “Sam-Bis” for the purpose of confidentiality. Sam-Bis field is situated in the eastern part of Greater Ughelli depobelt and in north eastern part of Bayelsa State of Nigeria. It is located within OML 61 and lies between the latitudes 50 and 50 30I north of Equator and longitudes 60 and 60 45I East of Greenwich Meridian (Fig. 1a). The field is bounded on the west by River Niger. The oil wells on the field are located on elongated rollover anticline bounded to the north against a large east- west trending growth fault and to the east by north west-south east trending fault (Fig.1b) Geologic Setting. Niger delta basin, is located within the Gulf of Guinea and covers an area of about 75,000km2 and has an average sediment thickness of about 12,000m (Reijers, et al., 1997). The geologic evolution of the Niger Delta basin transcends and predates the Paleocene regressive clastic wedge that is conventionally ascribed to the delta (Frankl and Cordry, 1967; Short and Stauble 1967; Weber and Daukoru, 1975). It is connected to the tectonic setting of the southern Benue Trough, which is the Mega structure whose coastal and oceanward part lies the Niger Delta. Benue Trough is a NE – SW folded rift basin that runs diagonally across Nigeria.It represents a failed arm of a triple junction associated with the opening of the Gulf of Guinea and the equatorial Atlantic in Aptian-Albian times when the equatorial part of Africa and South America began to separate. (Benkhelil, 1987). The formation of the Niger delta basin began after second depositional cycle (Campanian-Maastrichtian) of Benue trough that formed the proto-Niger Delta. The third and last depositional cycle of the southern Nigerian basin formed the Niger delta formations. According to Reijers (2011), the evolution of this basin was and is controlled by allocyclic and autocyclic processes. Autocyclic cycles result from natural redistribution of energy within a depositional system such as channel meandering or switching and delta avulsion. While allocyclic cycles results from changes in sedimentary system as a result of an external cause such as eustatic sea level change, tectonic basin subsidence and climate change. The combined effect of the two processes resulted in delta-wide sediment distribution and progradation of siliciclastic system over the pre-existing continental slope into the deep sea during the late Eocene and is still active today. (Burke, 1972). According to Short and Stauble (1967), the stratigraphy of the Niger Delta can be divided into three major units. Ranging in age from Eocene to Holocene: (1)The Akata Formation , which includes at least 6500 m (21,400 ft) of marine clays with silty and sandy interbeds. (Whiteman,1982). (2) The Agbada Formation, which is characterized by paralic to marine coastal and fluvial-marine deposits mainly composed of sandstones and shale organized into coarsening-upward off-lap cycles (Weber, 1971). (3) The Benin Formation, which consists of continental and fluvial sands, gravel, and back swamp deposits (2500m (8250ft) thick)(Reijers, 2011). This three diacchroneous formation occur within growth fault bounded sedimentary units called depobelts or depo centres that succeed each other in a southward direction (Doust and Omatsola, 1990; Stacher; 1995 and Tuttle et al., 2006) (Fig.4). The sedimentation in each depobelts shown in figure 4 was a function of rate of deposition and rate of subsidence with syn-sedimentary growth fault upsetting the balance (Evamy et al., 1978). The growth faults are generated by rapid sedimentation and gravitational instability, during the accumulation of Agbada deposits and continental Benin sands over mobile and under-compacted Akata prodelta shales. Lateral flowage and extrusion is also responsible for the diapiric structures on the continental slope of Niger delta (Reijers et al. 1997).
MATERIALS AND METHODS
Sam- Bis field has three oil wells: Sam 4, Sam 3 and Bis 4 (Fig 1), with only Sam 4 well cored. Therefore, only the wireline logs and 40m core samples of Sam 4 well were acquired for this research to have a general understanding of the reservoir sands in Sam-Bis field. The wireline logs (gamma and resistivity) of Sam 4 well were first of all, qualitatively analyzed. The qualitative interpretation entails visual analysis of log shapes for the identification of reservoir sands, development patterns, hydrocarbon bearing, and prediction of probable environment of deposition and correlating prominent features, such as sharp bases on logs with the corresponding features on the cores. Quantitatively, gamma ray (GR) value greater than 75 API was taken as impermeable zone, while GR value equal to or less than 30 API and less than 75 API was taken as clean sand and permeable zone respectively (Dewan, 1983). The volume of shale (Vsh) (percent mudstone relative to sandstone), of each reservoir units was estimated using the formula below.

Oyanyan, R. O., et al Adv. Appl. Sci. Res., 2012, 3(3):1624-1638 _____________________________________________________________________________
1627 Pelagia Research Library
Gamma ray index (IGR) = GR Value (log) – GR (Min.) …..(1) GR (Max.) – GR (Min.) (Adopted from Schlumberger, 1974) The volume of shale was then calculated using one of the Dresser Atlass (1979) formulas For pre-Tertiary consolidated rocks: Vsh = 0.33 [(22* IGR) – 1] …………. (2) For Tertiary unconsolidated rocks like those evaluate in this research. Vsh = 0.083 [(23.7*I
GR)-1] ………………………………… (3) The core sample which are undisturbed samples that represent subsurface layers penetrated in well drilling, were observed and described based on descriptive parameters, which include rock colour, grain size trend, texture (sorting, and roundness), ichnofossils, lithology, primary and secondary sedimentary structures. Lithology and sedimentary structure were used to name the lithofacies. The importance of sedimentary structures on oil recovery is well documented by Kortekaas (1985) and Weber (1986). It makes the important link between the history of sedimentation, processes (a record of variation that produces characteristic rock fabric signatures) and the dynamic characteristics of reservoir (Hurst et al. (2000).
Fig 2: G.R and resistivity Log Response of Reservoir Sands in Sam 4 Well showing cored intervals and
reservoirs indicated with red coloured alphabets. Bioturbation - reworking of sediments by an organism and bioturbation structure - a biogenic sedimentary structure that reflects the disruption of biogenic and physical stratification features or sediment fabrics by the activity of an organism: tracks, burrows, and similar structures (Frey and Pemberton, (1985), was classified according to the scheme of Reineck(1967)(table1). Grain sizes and shapes were based on the scale of Wentworth (1922). The environments of deposition were determined using both the association of lithofacies and wireline log shapes. The core was depth-match with the log using the depth of the obvious erosive base on the core with that of gamma ray log. Wireline log shapes of Schlumberger (1985) and that adopted from Shell petroleum development company (SPDC)’s document were used to identified the environment of deposition of the non-cored intervals.

Oyanyan, R. O., et al Adv. Appl. Sci. Res., 2012, 3(3):1624-1638 _____________________________________________________________________________
1628 Pelagia Research Library
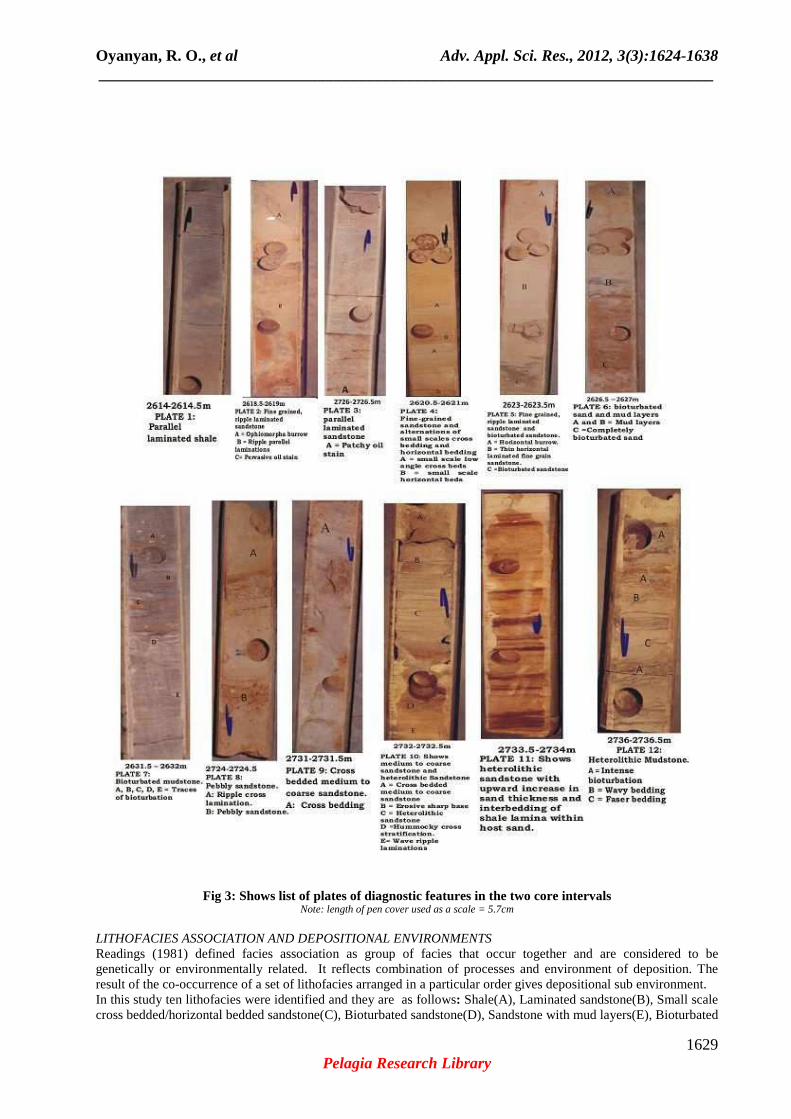
GEOLOGICAL CORE AND WIRELINE LOG ANALYSIS Up to twenty one reservoir sand bodies were identified in Sam 4 well and they are labelled “A” to “U1,2 “ as shown in wireline logs (Fig.2: A and B.) However, only reservoir sand sand “O” and “U1,2” are within the cored intervals, which lie within 2614-2634m and 2719-2739m depth intervals respectively. The facies identified in the two core intervals are described in tables 2 and 3, while the plates of the diagnostic feature of the two intervals are presented in Fig.3.
Table 2: Description and interpretation of identified facies in Core interval 2614-2634m
CODES TYPES DESCRIPTIONS INTERPRETATIONS
A
Shale (Also in interval 2719-2739m)
Greater than 80% shale and silty shale with dark grey colouration. Very slightly bioturbated. Characterized by well-defined parallel and horizontal laminations(Plate1)
The lamination and very fine grain size of this facies indicate Suspension deposits, overbank or abandoned channel associated with low energy condition. The dark grey colouration, indicates high organic matter.
B Laminated sandstone
Thin horizontally laminated and very poorly sorted sandstone with up to 20% clay. Light grey in colour and contains mica flakes and carbonaceous detritus (Plate 2, 3). Slightly bioturbated and characterized by traces of Ophiomorpha burrow
Mica flakes and carbonaceous detritus suggest fluvial influenced deltaic environment. The parallel thin laminations indicate deposition in an upper flow regime, and planar bed flow combined with deposition from suspension. The Ophiomorpha –burrow in particular is said to indicate lower deltaic/ shallow marine environment or sandy shore. This deposit is typical of top channel deposition.
C
Small scale cross bedded /horizontal bedded Sandstone
Fine-grained and greyish brown. Moderate to well sorted (Plate 4). An alternation of low angle cross bedded sandstone (a) With horizontal bedded sandstone (b), both of bed thickness between 1 and 3cm. It is unbioturbated
The alternation of cross beddings with flat beddings can be interpreted as a product of marked fluctuation between normal sedimentation and periods of greater energy. This lithofaceis can occur in all environments of low to moderate energy with variable current velocity such as in tidal settings
D Bioturbated sand stone
Fine to medium grained sand stone, moderately to well sorted and greyish brown in colour. Intensely to complete bioturbated, but with some thin undisturbed intervals showing fine inorganic structures (plate 5 an 6)
Bioturbation indicates low energy conditions, with high oxygen content due to shallow depth, and abundance of nutrient within the substrate and slower rate of deposition. An alternation of bioturbated intervals with intervals showing fine inorganic structures indicates periodic rapid deposition of thick interval which burrowers are unable to penetrate. Typical environment is tidal flat
E Sandstone with mud layers
Fine grained sandstone, well sorted, with mud occurring as layers (between 2 and 3cm thick), and in some cases as flasers and pebbles (Plate5). There is an occasional planolite mottling and burrow
The interlamination of sand, silt and clay point to sedimentation from gentle current of pulsating velocity, which alternatively caused sand, ripples to migrate and then halted to allow clay to settle out of suspension. That is suspension settling in low flow regime. Typical tidal flat heteroliths.
F Bioturbated mudstone
Silty clay with streaks of very fine grain sand and silts. Moderately to intensely bioturbated (Plate 7).
The fine grained nature of the sediment indicate low energy environment. The grey to black colouration also shows high organic matter. Typical environments are tidal flat, lagoon and overbank or abandoned channel.
Table 3: Description and interpretation of identified facies in Core interval 2719-2739m
CODES FACIES DESCRIPTIONS INTERPRETATIONS
G Pebbly Sandstone
Coarse sandstone with gravels and pebbles. Very poorly sorted. The pebbles are very angular to sub angular. Little sideritic concretions observed at the bottom. 5m thick, and appears massive in most cases with occasional ripple cross lamination. (Plate 8). Bioturbation is zero percent.
The coarse grained character and the angularity of the grains indicate short distance of travel and low basinal processes. The very poor sorting and massive nature suggests deposit of episodic flooding, too concentrated to be mobilized by basinal processes.
H
Cross Bedded Medium To Coarse Grained Sandstone
Medium to coarse grained sandstone with cross bedding and unbioturbated (Plates 9). Grayish brown. Moderately sorted. Grains are angular to sub angular. It is bounded at the base by sharp erosive basal contact (Plate 10). 2m thick.
Sharp erosive base indicates a sequence boundary or stream flow deposit. The sedimentary structures record deposition by high-energy flow. The texture is typical of fluvial sourced sand.
I Heterolithic sandstone
Interbedded sand and shale. 5-20cm thick parallel ripple laminated fine to medium grained sandstone separated by thin (0.1-1.1cm) layers of shale. There is an occasional hummocky cross stratification. The sand units are well sorted. Vertically, there is a progressive increase in sand/shale ratio, sand grain size and thickness of bed (plate 1I). Bioturbation is zero percent.
The interbedded sand and shale represents alternation of high and low energy condition. The upward increased in bed thickness, sand shale ratio, and bed thickness indicates progradation. The degree of sorting of sand is due to the strong wave interaction. Deposit associated with suspension settling or sediment fallout to low flow regime, possibly in diurnal or semidiurnal tidal rythmicity. Typical sub-environments of deposition are distal middle shoreface and tidal flat.
J Heterolithic Mudstone
Clay rich sediment (Mud) alternating with fine sand and silt. The mud layers in the mixture occur as continuous drapes forming flaser and wavy bedding. The colour ranges from grey to black depending on the percentage of clay. Bioturbation is common and moderate to intense (Plate 12).
The lithofacies indicate low energy environment in which suspended load dominate over bed load. Hence, greater percentage of mud. The common to intense bioturbation indicate shallow environment with high oxygen content and very slow rate of sedimentation. Typical environment is lower shore face.
Oyanyan, R. O., et al Adv. Appl. Sci. Res., 2012, 3(3):1624-1638 _____________________________________________________________________________
1629 Pelagia Research Library
Fig 3: Shows list of plates of diagnostic features in the two core intervals
Note: length of pen cover used as a scale = 5.7cm LITHOFACIES ASSOCIATION AND DEPOSITIONAL ENVIRONMENTS Readings (1981) defined facies association as group of facies that occur together and are considered to be genetically or environmentally related. It reflects combination of processes and environment of deposition. The result of the co-occurrence of a set of lithofacies arranged in a particular order gives depositional sub environment. In this study ten lithofacies were identified and they are as follows: Shale(A), Laminated sandstone(B), Small scale cross bedded/horizontal bedded sandstone(C), Bioturbated sandstone(D), Sandstone with mud layers(E), Bioturbated

Oyanyan, R. O., et al Adv. Appl. Sci. Res., 2012, 3(3):1624-1638 _____________________________________________________________________________
1630 Pelagia Research Library
mudstone(F), Pebbly sandstone (G), Cross bedded medium to coarse grained sandstone(H) Heterolithic sandstone(I) and Heterolithic mudstone(J) The stacking of the above listed lithofacies aided the reconstruction of the sub-environments of deposition of the reservoir sands within the cored intervals. The interpretations of the stacked lithofacies are tied with the interpretations of wireline log shapes of the sand units. Log interpretation only was used to interpret the environment of deposition of reservoir sands not within the cored intervals. LOWER AND MIDDLE SHOREFACE LITHOFACIES ASSOCIATION Heterolithic sandstone lithofacies (I) and heterolithic mudstone lithofacies (J) are interpreted as that of middle shoreface and lower shoreface respectively. The stacking pattern (fig.4) indicates a coarsening upward sequence in a prograding shoreface. Lower shoreface: This is an area were the wave starts to feel bottom (shoaling zone). It is an area of low energy (in comparison to the rest of the seaward system), so it consist of fine grained sand interspersed with thin layers of mud, moderate to intense bioturbation and burrowing. The lithofacies is dominantly muddy, due to the prevalence of low energy condition in lower shoreface. In this study, the vertical facies sequence is shown in the sedimentary core log (Fig.4 ). The sedimentary structures encountered include, flaser bedding, very thin laminations, wavy bedding, hummocky cross stratification and moderate to intense bioturbation structures. All these structures characterized rock deposited in an open marine setting with reduced sedimentation rate and low energy condition. The log curve is characterized on top and bottom by highest gamma ray response with repeated serration, indicating alternations of sand and shale as well as upward coarsening and thickening sequence of lower shoreface (fig. 2, 4and 5). The unit also shows high resistivity due to the occurrence of hydrocarbon on the sandy parts of the heterolithic facies. Middle shoreface: This is an area overlying the lower shoreface described above. This area is subject to higher wave energy due to wave breaking. Therefore, it is characterized by sand domination, cleaner fine to medium sand and rare bioturbation or unbioturbation. (Reineck 1967). Due to strong wave interaction, the sands are well sorted. Intermittent periods of water quiescence allow suspended fined grained sediment to be deposited as thin layers of shale or mud alternating with thicker sand layers. As a result of landward increase of wave energy, there is an upward coarsening and thickening sequence. The unit also shows very high resistivity similar to that of the lower shoreface due to the occurrence of hydrocarbon in the sand units of the heterolithic facies. In major depositional settings of Barrier Island System, the seaward side is made up of the lower shoreface, middle shoreface, upper shoreface, foreshore and back shore. In this study, it is observed that the progradation of middle shoreface to foreshore/backshore was interrupted as indicated by an overlying erosive base or minor sequence boundary (Plate 10 of figure 3, Figs. 4 and 5). The proximal part of the middle shoreface was possibly eroded. This is based on the fact that a complete sequence of middle shoreface rocks is also characterized by multi directional cross bedding due to changing wave direction which changes direction of the long shore current and also, trough which are scoured by long shore current (Readings, 1981). The absence of these structures prove that heterolithic sandstone lithofacies (I) is most possibly that of distal part of middle shoreface. DISTRIBUTARY CHANNEL LITHOFACIES ASSOCIATION The stacking of shale (A), laminated sandstone (B), cross bedded medium to coarse grained sandstone (H) and pebbly sandstone (G) lithofacies, as shown in Figs. 4 below, are interpreted as distributary channels associations 1 and 2. The two channels are stacked together but separated by an overbank deposit. The fining upward sequence of distributary channel (1) is made up of pebbly sandstone, that looks massive with occasional ripple laminations and upward fining matrix, and lastly, overlain by shale. The distributary channel (2) starts with an erosive base cross-bedded medium to coarse-grained sandstone, followed by laminated sandstone overlain by shale. Mica flakes, carbonaceous detritus and wood materials indicating fluvial sourcing, were identified (Fig.4). The overall fining upward sequence reflects decrease in flow. The GR log curve(U1 and U2 figure 2) of the two distributary channels (fig.5) are both characterized by sharp basal contact and gradational upper contacts to give a bell shape that corresponds to distributary channel in Schlumberger (1985) electrofacies classification models for deltaic environments (Figs. 5a, and 5b). Since the G.R log shapes of the two distributary channels reservoir units (U, and U2) are similar to that of sand units Q, R and S, it is assumed

Oyanyan, R. O., et al Adv. Appl. Sci. Res., 2012, 3(3):1624-1638 _____________________________________________________________________________
1631 Pelagia Research Library
they are made up of the same lithofacies association (either 1 or 2). Therefore, they are all interpreted as distributary channels.
Fig. 4: Sedimentary core log of 2719-2739m
TIDAL FLAT AND TIDAL CHANNEL LITHOFACIES ASSOCIATION TIDAL FLAT: The stacking of sandstone with mud layers (E) and bioturbated sandstone (D) as shown in figure 6 below is interpreted as tidal flat. The sandstone is generally between very fine and fine, while the mud is made up of clay and silt. These lithologies represent variations in energy of depositional environment. The mud is deposited during low energy, associated with low tide, while the sand is deposited during high energy associated with high tide, and bioturbated when the energy reduces. The upward gradation from bioturbated sandstone to sandstone with mud layers indicates a fining upward sequence. This reflects the decreasing wave action or energy condition from the subtidal to intertidal zone of the tidal flat. The subtidal zone is made up of the bioturbuted sandstone, while the intertidal zone is made up of sand and mud layers. The upward fining facies sequence is underlained by bioturbated mudstone facies (F), which can possibly be interpreted as marsh or shelf mud. The G.R log shape (O of fig. 2 and fig.7 below) is characterised by high scaled serrations similar to the tidal flat electrofacies model of Schlumberger (1985) (fig.9).

Oyanyan, R. O., et al Adv. Appl. Sci. Res., 2012, 3(3):1624-1638 _____________________________________________________________________________
1632 Pelagia Research Library
Tidal Channel Lithofacies Association: The stacking of shale (A), laminated sandstone (B) and small scale cross bedded/horizontal bedded sandstone (C) lithofacies as shown in figure 10 is interpreted as tidal channel lithofacies association. As shown in the sedimentary core log, the facies sequence is made up of sand grains that grade from fine to very fine. The alternations of millimeter scaled cross beds with millimeter scaled flat beds are attributed to pulsating flow tidal current in tidal channel (Figs.6 and 7).
Fig.5: log shape of interpreted environment 1, 2 and 3: Shorefaces and Distributary channel
Tidal channel deposit is normally characterized by herringbone cross stratification. However, it only develops in regions where the ebb and flood flow pathway overlap. When the region is made up of multiple pathways with some channels experiencing only one dominant flow, the ebb and flood tidal current commonly follow different pathways, with some channels experiencing only one dominant flow. The non-identification of herringbone cross- stratification in tidal channel lithofacies association in this study can be attributed to this phenomenon. The log shape of this unit shows a general fining upward sequence with a sharp basal contact and large-scale serrations from edge to the top. The log shape is similar to Schlumberger (1985) electrofacies model for tidal channel. Since the G.R. log shape of tidal channel reservoir unit (“O”) is similar to that of sand unit A, D, E, H, J, M, and N. (Fig),------- it is assumed they are all made up of the same lithofacies association. Therefore, they are all interpreted as tidal channels. DISTRIBUTARY MOUTH BAR The reservoir unit T encountered between 2675-2700m did not fall within the cored intervals. However, the environment of deposition was interpreted based on the wireline log shape pattern. Comparing the G.R. log shape below (Fig.12), with log shape models of Schlumberger (1985) and those adopted from SPDC’s documents (Figs.9), it is observed that the G.R. curve is a funnel shape, characterized by sharp upper contact and gradational lower contact, indicating coarsening upward sequence and correspond to mouth bar. Sand unit T, B, C, F, G, K, L, and P have similar log shapes (Fig.5). Therefore, they are all interpreted as mouth bar reservoir sand bodies in Sam 4 well of Sam-Bis field.
G.R Curve Resistivity curve
Lower Shoreface
Dist. Channel 2
Dist. Channel 1
Middle Shoreface

Oyanyan, R. O., et al Adv. Appl. Sci. Res., 2012, 3(3):1624-1638 _____________________________________________________________________________
1633 Pelagia Research Library
Fig.6: Sedimentary core log of 2614-2634.
Fig.7: log shape of interpreted environment 3: Tidal flat and tidal channel
C
E
B
A
D
F
Resistivity curve
Tidal flat
Tidal
channel
G.R Curve

Oyanyan, R. O., et al Adv. Appl. Sci. Res., 2012, 3(3):1624-1638 _____________________________________________________________________________
1634 Pelagia Research Library
Fig.7: log shape of interpreted environment 4: Distributary Mouth bar POINT BAR The reservoir units I encountered between 2430-2450m did not fall within the cored intervals. However, the environment of deposition was interpreted based on the wireline log shape pattern. Comparing the wireline log shape below, (Fig.13 ) with the log shape models of Schlumberger (985) and those adopted From SPDC’s document (Figs.9), it is observed that the G.R curve is bell shape, characterized by sharp lower contact and a gradational upper contact and correspond to fining upward sequence. It has smooth blocky edge at the bottom typical of lateral accretion deposit in point bar depositional environment.
Fig. 8: Log shape of interpreted environment 5
DISCUSSION
A sedimentological study/analysis of 40m cored samples was integrated with qualitative analysis of wire line logs of Sam 4 well to understand the depositional environments characteristics of the reservoir sands in Sam-Bis field. Analysis of the grain size, lithology, physical primary sedimentary structures, biogenic structures and gamma ray (Gr) log shapes were integrated to recognize the following four sub environments of deposition. Lower and Middle Shoreface: Shoreface is defined as the interval between the mean sea-level and the mean fair-weather wave base (FWWB, Walker & Plint 1992). FWWB is the depth to which the typical daily waves affect the sea bottom. (Howell et al., 2008). According to Oomkeens (1974), “in regressive sequences, deeper-water sediments are successfully overlain by sediments deposited in progressively shallower water. In the Niger Delta, the basal member of the regressive marine sequence consists generally of sandy clays. The topmost part of the regressive sequence is composed of predominantly horizontally bedded sands that showed an upward increase in grain size.” The unit described as lower and middle shoreface rocks in this study is similar to the regressive sediment described above. However, the normal sequence of prograding clastic shoreline which grades from lower shoreface to upper shoreface made up of barrier bars and beaches was interrupted. The interruption is represented by an erosive
Distributary
Mouth Bar
G.R Curve Resistivity curve
Point Bar
G.R Curve Resistivity curve

Oyanyan, R. O., et al Adv. Appl. Sci. Res., 2012, 3(3):1624-1638 _____________________________________________________________________________
1635 Pelagia Research Library
boundary overlying the middle shoreface rocks. It shows that a barrier bar was eroded by the distributary channel described below. The characteristics of the lower shoreface are also in line with that documented by Davies et al., (1988). However, lower shoreface was divided into proximal lower shoreface and distal lower shoreface based on their strata thickness, log response and reservoir quality. Proximal lower shoreface was identified with sandstone dominated heterolithic facies, while distal lower shoreface was identified with mud dominated heterolithic facies. His proximal lower shoreface is slightly similar to the distal middle shoreface identified in this study. Also, the lithofacies association of these sub-environments is similar to the facies of shallow marine siliciclastic deposit described by Reading (1981). He described shoreline siliciclastic deposit as made up of sand facies, sand dominated heterolithic facies, and mud dominated heterolithic facies and mud facies. This corresponds to a gradation from foreshore to offshore facies. In addition, the characteristics of the lower shoreface identified in this study are also in-line with those identified in the Niger Delta by Weber (1971). He stated that there is a gradual change of sedimentary characteristics from bioturbated clays with occasional silt and sand lenses (transition zone), which passes upwards into interbedded muds, silts and sand (lower/distal middle shoreface). Towards the top of the sequence, there is either a gradational passage into well sorted parallel-laminated sands of beach face, or the sequence is cut by a distributary channel. The middle shoreface facies can be taken as proximal fluviomarine or barrier foot and lower shoreface as distal fluviomarine of Weber (1971). In this light, the very high gamma ray value of this sand unit could be attributed to high clay content and high percentage silt size zircon. Distributary Channel : Oomkens (1974) reported that cores in the Rhone and Niger Delta reveals an erosive based sequences with basal lag followed by a passage from trough cross-bedded sand, upwards into ripple laminated finer sands with silt and clay pervaded by rootlets. Some are composite sequence, which either reflects repeated cut or filled within the channel or minor fluctuation in channel location. The overall fining upward sequence of the channel deposit result from either lateral migration of the channel or more commonly from channel abandonment. The lithofacies association of distributary’s channel identified in this study is similar to that of Oomkens (1974), unless the planner crosses bedded sand identified, instead of trough cross-bedded sand. Also, composite sequences were also identified, and also attributed to fluctuation in velocity of flow or minor fluctuation in channel location TIDAL FLAT AND TIDAL CHANNEL: Readings (1981) stated that tidal flat comprises almost featureless plains dissected by networks of tidal channels and creeks. Tidal flat tends to produce a fining upward sequence, which reflects transition from low tide level sand flat, upward into high tide level mudflat and eventually into supratidal flats. In other words, a reflection of a decreasing wave action in the progression from subtidal to intertidal to supratidal parts of the tidal flat; indicates a regressive process. This sequence may be cut at any level and in some case completely replaced by erosive tidal channel sequences. However, Thompson (1975) reported that the tidal flats in the Gulf of California are dominated by fine grained sediments and the facies changes from subtidal to supratidal, and therefore occur within a silt clay sequence with no fining upward trend. The facies sequence of tidal flat in this study which grades from bioturbated sand to sand stone with mud layers is a fining upward sequence. Also, the sequence in similarity with that described by Reading (1981) is cut by a tidal channel. Oomkens (1974) reported that tidally influenced distributary channels in the Niger Delta commence with coarse intraformational lag with a fragmented marine fauna overlain by sands which exhibit a transition from decimeter scale trough cross bedding into small scale cross lamination. The sand becomes finer upward and there is also an increase in the clay content and the number of burrows. The lithofacies associations of tidal channel identified in this study is similar to that described above, except the absence of coarse intraformational lag. However, all the sedimentary structures encountered are also of centimeter to decimeter scale. Upward increase of burrows (planolite and Ophiomorpha burrow) and clay content were also observed. Using wire line logs and core analysis, a total of seven tidal channel deposits were identified based on Schlumberger (1985) electrofacies classification scheme. The numerousity of tidal channel deposits in Sam 4 well supports the findings of Allen, (1965), that in the Niger Delta areas, interdistributary areas are dominated by mangrove swamp (vegetated inter-tidal flats) dissected by tidal distributary channels and a complex pattern of meandering tidal creeks, each served by numerous small scale dentritic drainage systems
Oyanyan, R. O., et al Adv. Appl. Sci. Res., 2012, 3(3):1624-1638 _____________________________________________________________________________
1636 Pelagia Research Library
Distributary Mouth Bar: Mouth bar reservoir is formed in an area where sediment laden fluvial current (river waters) enter basin and are disperse while interacting with basinal processes (Readings, 1981). It is characterised by upward decreasing gamma-ray values (labourdette et al., 2004). In Sam-Bis field, mouth bar deposits were only recognized with wire line logs. Apart from the similarities of log shapes with that of Schlumberger (1985) for distributary mouth bar, the gamma ray (GR) log shaped of distributary mouth bars encountered in this study are similar to that described by Adedokun (1981). The funnel shape log profile corresponds to gradational lower contacts and abrupt upper contact, as well as upward increase in grain size. Point Bar: Point bar is a meandering river deposits. According to Allen (1990), the sequence of a point bar consists of in-channel deposits (Lateral accretion) followed by over bank fines (vertical accretion). The lag deposits cover a near horizontal erosional surface and are capped by trough cross bedding (sands) which is overlain by small scale trough cross-laminations (silts). Horizontal lamination occurs at several places within the sequence. The deposit of point bar was only identified in this study with wire line log. Though the sub-environment was initially identified using Schlumberger (1985), electrofacies classification for deltaic environments from gamma ray logs, the log profile of point bar in this study is similar to that proposed by Galloway and Hobday (1996). It is characterized by a sharp contact at the bottom and gradational contact towards the top. Generally, it is a bell shape, which reflects a general fining upward sequence. Also, Adedokun (1981), identified point bar deposit in an oil well located at North Eastern Sector of Nigerian’s Niger Delta Ossu-Izombe oil field. The log profile similar to the one encountered in this study is also characterized by a sharp basal contact, a decrease in S.P amplitude and more serrate curve upward. These features correspond to decrease in grain size and increase in interstitial clay upward. The only difference is that less serration is observed on the top of the log profile in this study. RESERVOIR QUALITY AND HETEROGENEITY. The quality of reservoirs in an oil field is influenced by the distribution of facies and the external geometry of the reservoirs. In a depositional system, facies, facies assemblage distribution and spatial portioning within sandstone result to reservoir heterogeneity, which is the lateral and vertical change in rock properties. Few traps contain reservoir that are uniform in thickness, porosity, permeability; most are heterogeneous (Selley, 1998). Thus, Galloway and Hobbday (1996) identified five levels or sales of reservoir heterogeneity: gigascopic, megascopic, macroscopic, mesoscopic, and microscopic. Gigascopic heterogeneity is shown at the scale of depositional systems, while megascopic heterogeneity deals with the geometry of permeable and impermeable units-a scale applied in identifying reservoir units and for correlation between outcrops and borehole, and for depositional interpretation (Keyu et al., 2004). Macroscopic heterogeneity is at the facies scale and help to understand depositional processes. Mesoscopic heterogeneity occurs at the scale of lithofacies and stratification; while microscopic heterogeneity is expressed at the scale of individual grains and pores. In this study, heterogeneities of reservoirs in Sam-Bis field were analyzed down to mesoscopic level, taking into consideration of the limitation of one dimensional (1D) data of just one oil well. On a megascopic level, heterogeneity of permeability is reflected by gamma ray differentiating sand bodies (permeable zones) and shale (impermeable zones). Also, the volume of shale of each sand unit indicates that most of Niger delta Agbada paralic sands form good reservoir on a megascopic scale. On macroscopic-mesoscopic scale, shale(facies A) and mud(facies F) occurring as isolated muddy and silty beds, flaser bedding, mud drapes and overbank deposits are taken as baffles or permeability barriers and where they are continuous can form several flow units within the sand bodies. The analysis of lithofacies and stratification aided the separation of tidal flats from tidal channel and middle shoreface from lower shoreface. Galloway and Hobbday, (1996) documented the vertical connectivity and lateral continuity of various reservoir sequence; which was used to predict the areal quality of reservoirs in Sam-Bis field. Tidal flat reservoirs are characterized by moderate lateral continuity and poor vertical continuity as a result of mud layers that creates vertical permeability barrier. On a lithofacies and stratification scale, tidal flat is taken as poor reservoir as a result of finer-grained sediment, lots of disruptive bioturbation and burrow lining or filling with clay. Similarly, tidal channel reservoir also formed moderate lateral continuity but with also moderate vertical connectivity. The vertical connectivity is moderate as a results silty clay breaks and mud beds that punctuate the reservoir. According to Serra (1989), point bars potentially form good reservoirs with porosity of up to 30% and permeability up to thousand millidarcys. However, shale beds or clay lamina and mud drapes on foreset bed boundaries and

Oyanyan, R. O., et al Adv. Appl. Sci. Res., 2012, 3(3):1624-1638 _____________________________________________________________________________
1637 Pelagia Research Library
lateral accretion surfaces can create permeability barriers. Similarly, mouth bar generally have a good reservoir with porosity up to 35% and permeability up to thousands millidarcys in relation to good sorting(Serra, 1989), and this is evidenced with the low percentage volume of shale in all the mouth bar sand units in Table I. According to Galloway and Hobbday (1996), channel mouth bar reservoirs have an excellent vertical connectivity and moderate lateral continuity. The quality however decreases seaward. Shoreface reservoirs, generally exhibit moderate to excellent lateral continuity but poor to moderate vertical connectivity. I this study, the lithocacies separation of middle shoreface from lower shoreface, provide and evidence of mesoscopic level of heterogeneity. Middle shoreface form better reservoir than lower shorefore, but have limited volume. The horizontal flow properties of middle shoreface reservoir may be good, but vertical flow between beds is limited due to high frequency of mud interbedding that can really pose serious developmental challenges. Lower shoreface, form poor reservoir because of finner grained sediment, intense to complete bioturbation and lots of mud drapes that create permeability barriers. Distributary channel reservoirs have a lower porosity in comparison to mouth bar due to poor sorting but the permeability is still good in relation to the coarser grain (Serra1989). I this study, the erosive contact between distributary channel “U1 and the middle shoreface could possibly be an evidence of a discontinuous or pods of marine sand locally cut by channel shoestring.
CONCLUSION
The determination of the environments of deposition of reservoir sands within the cored intervals was achieved by careful examination of the log shape, grain size trend, suit of sedimentary structures (physical and biogenic), as contained in each lithofacies, and lithofacies association. While those not within the cored intervals were determined using log shapes, based on Schlumberger (1985) electrofacies classification scheme for deltaic formation. Ten lithofacies were identified on the cored samples, and the association of the lithofacies aided in reconstructing five sub-environments of deposition. They are; lower shoreface, middle shoreface, and distributary channel, tidal flat and tidal channel. The sedimentary core logs of the two cored intervals showing depositional interpretation and key sedimentary structures observed in core samples reflects heterogeneities associated with sedimentary processes; that can have impact on hydrocarbon recovery. Through the analysis of log shapes of reservoir sands not within the cored intervals, point bar and mouth bar were identified. Therefore, the reservoir sands in Sam-Bis field are deposited in seven aforementioned sub deltaic environments. Acknowledgement The Authors are very grateful for Nigerian Agip Oil Company for supplying the data materials for this research work.
REFFERENCES
[1] Adedokun, O.A., Journal of petroleum geology, 1981, 4 , 35. [2] Allen, J.R., Am. Assoc. Pet Geol. Bull,1965, 49,547. [3] Allen, P.A., and Allen, J. R., Blackwell science Publ. 1990,141-228 [4] Benkhelil, J., J. Afri. Earth Sci. 1987, 8, 251. [5] Burke, K., Am. assoc. Pet. Geol. , 1972, 56, 1975. [6] Cohen, H. A., and K. R. McClay, J. Marine and Petroleum Geology, 1996, 13, 313. [7] Davies, H. Onuigb,L.S.D., Cruts, S.,Blaauw, M. Meijneken, C.,.Shell international Exploration and production, 1998,97,504 [8] Dewan, J.T., 1983. Essentials of modern open hole log interpretation. Pennwell publishing company Oklahoma,1983 36pp. [9] Doust, H. and Omatsola, E., 1990. Am. Assoc. Pet. Geol. Tulsa, American.1990,Memoir 48. [10] Dresser, Atlas., Log interpretation charts. Houston, Dresser Atlas industries inc,1979,107pp. [11] Ekweozor, C. W. and Okoye, N.V., Am. Assoc. Pet. Geol. Bull.,1980, 64,1251. [12]Etu–Efeotor, J.O., Fundamentals of petroleum geology. Paragraphic publications, Port Harcourt, Nigeria,1997,135pp. [13]Evamy , B. D. , Haremboure , J., Kamerling , P., Knaap, W.A, Molloy, F. A. and Rowlands, p. H, 1978. Am. Assoc. Pet. Geol Bull.,1978, 62,1 [14] Frey, R. W. and S. G. Pemberton, Bulletin of Canadian Petroleum Geology, 1985,33,72. [15] Galloway, W.E & Hobday, D.K., Terrigenous clastic depositional systems: Applications to fossil fuel and ground water resources, springer-verlag, Berlin,1996.

Oyanyan, R. O., et al Adv. Appl. Sci. Res., 2012, 3(3):1624-1638 _____________________________________________________________________________
1638 Pelagia Research Library
[16] Howell, J. A., Skorstad, A., MacDonald, A., Fordham, A., Flint,S., Fjellvoll, B. And Manzocchi, T., Petroleum Geoscience, 2008,14 ,17. [17] Keyu, L., Topham, B., Paterson, L., Eadington, P.and Xiongqi,P., Petroleum Science,2004, l,8. [18] Kortekaas, Th. F. M., SPE, Journal, 1985,00, 917. [19] Labourdette, R. Casas, J. and Imbert, P., Journal of petroleum geology. , 2008, 31(2), 135. [20] Nichols G., 1999. Sedimentology and stratigraphy, Blackwell science Ltd public,1999, 355pp. [21] Oomkens, S.E., Journal of sed. 1974,21, 195 [22] Readings, H.G., Sedimentary environments and facies. Blackwell science publications, 1981, 569pp. [23] Readings, H.G., 1996. Sedimentary environment processes, facies and stratigraphy. 3rd edition. Blackwell science Publ.1996,18pp. [24] Reijers, J. J. A., Petters S. W., and Nwajide C. S., 1997, The Niger Delta Basin. Elsevier Publication, New York, 1997,150pp. [25]Reineck, H.E. , Geologischen Rundschau, 1967,56,420. [26] Schlumberger, log interpretation manual applications, Houston Schlumberger Well Services Inc,1974. [27] Selley, R.C., 1985. Ancient Sedimentary environment and their subsurface diagnosis. Third edition. 317 pp. published by Chapman and Hall Ltd. II new Fetter lane London,1985,317pp. [28] Selley, R.C., 1998, Element of petroleum geology. Academic Press Publication USA. 1988, 55pp [29 ] Serra, O., Sedimentary environments from wire line logs Schlumberger publications,1989, 243pp. [30] Short, K.C., and Stauble, A.J., Am. Assoc. Pet. Geol. Bull.,1967, 51,716. [31] Tyler, N. and Finley, R.J., SEPM concepts in sedimentology and paeleontology,1991, 3, 3. [32] Weber, K.J., 1971. Geologic en Mijnbouw,1971 ,50, 559. [33] Weber, K.J., and Daukoru, E.M.,, Petroleum Geology of Niger Delta. Proc. 9th world petrol. congr, Tokyo,1975, 2,209. [34] Weber, K.J., How heterogeneitie affect oil recovery. Academic press,1986,487pp