dept. of medical equipment huriamila community college king saud university 1428 / 1429 introduction...
TRANSCRIPT

Dept. Of Medical EquipmentDept. Of Medical Equipment
Huriamila Community CollegeHuriamila Community College
King Saud UniversityKing Saud University
14281428 / / 14291429
Introduction to Introduction to Medical EquipmentMedical Equipment
(MED 201)(MED 201)
Instrument CharacteristicsInstrument Characteristics
Specific Ch/sSpecific Ch/s General Ch/sGeneral Ch/s
(a) An input signal which exceeds the dynamic range.(b) The resulting amplified signal is saturated at 1 V.
Specific Characteristics:
Input Signal Dynamic range

(a) An input signal without dc offset. (b) (b) An input signal with dc offset.
Specific Characteristics:
DC Offset Voltage
Frequency response of the electrocardiograph.
Specific Characteristics:
Frequency Response

SpecificationSpecification ValueValue
Input signal dynamic rangeInput signal dynamic range ±5 mV±5 mV
Dc offset voltageDc offset voltage ±300 mV±300 mV
Slew rateSlew rate 320 mV/s320 mV/s
Frequency responseFrequency response 0.05 to 150 Hz0.05 to 150 Hz
Input impedance at 10 HzInput impedance at 10 Hz 2.5 M2.5 M
Dc lead currentDc lead current 0.1 0.1
Return time after lead switchReturn time after lead switch 1 s1 s
Overload voltage without damageOverload voltage without damage 5000 V5000 V
Risk current at 120 VRisk current at 120 V 10 10
Specific Characteristics: An Example
ECG Instrument:

(a) (b)
(a) A linear system fits the equation y = mx + b. (b) A nonlinear system does not fit a straight line.
General Characteristics :
Linearity
(a) (b)
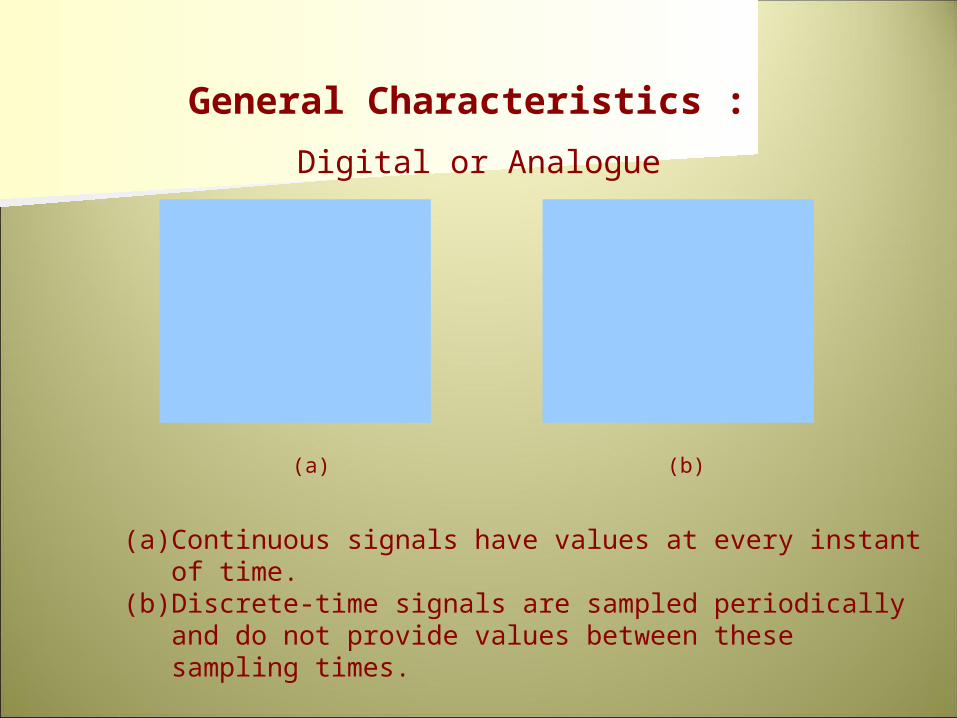
(a) Continuous signals have values at every instant of time. (b) Discrete-time signals are sampled periodically and do not provide
values between these sampling times.
General Characteristics :
Digital or Analogue
(a)
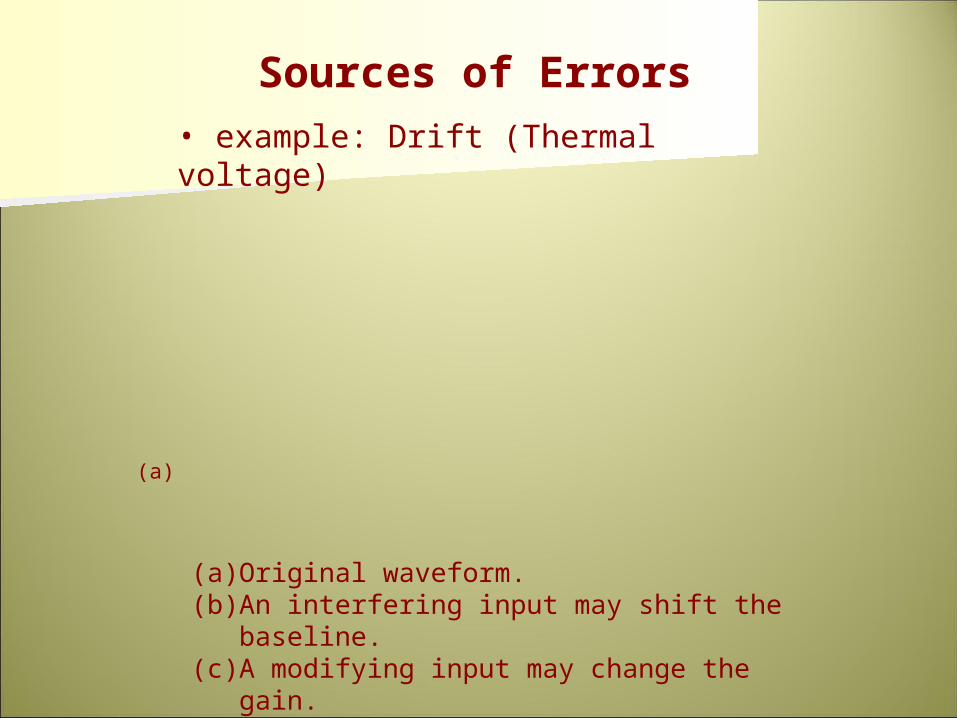
(a) Original waveform. (b) An interfering input may shift the baseline. (c) A modifying input may change the gain.
Sources of Errors• example: Drift (Thermal voltage)

(a) (b)
Data points with (a) low precision and (b) high precision.
Precision
Data points with (a) low accuracy and (b) high accuracy.
(a) (b)
Accuracy

(a) (b)
(a) The one-point calibration may miss nonlinearity.(b) The two-point calibration may also miss nonlinearity.
Calibration

A hysteresis loop. The output curve obtained when increasing the measurand is different from the output obtained when decreasing the measurand.
Sensors: Sensors: HysteresisHysteresis

(a) A low-sensitivity sensor has low gain. (b) A high sensitivity sensor has high gain.
(a) (b)
Sensors: SensitivitySensors: Sensitivity

(a) (b)
(a) Analog signals can have any amplitude value. (b) Digital signals have a limited number of amplitude values.
Sensors: Analogue Versus Sensors: Analogue Versus Digital Digital

Measurement Range Freq., Hz Method
Blood flow 1 to 300 mL/s 0 to 20 Electromagnetic or ultrasonic
Blood pressure 0 to 400 mmHg 0 to 50 Cuff or strain gage
Cardiac output 4 to 25 L/min 0 to 20 Fick, dye dilution
Electrocardiography 0.5 to 4 mV 0.05 to 150 Skin electrodes
Electroencephalography 5 to 300 V 0.5 to 150 Scalp electrodes
Electromyography 0.1 to 5 mV 0 to 10000 Needle electrodes
Electroretinography 0 to 900 V 0 to 50 Contact lens electrodes
pH 3 to 13 pH units 0 to 1 pH electrode
pCO2 40 to 100 mmHg 0 to 2 pCO2 electrode
pO2 30 to 100 mmHg 0 to 2 pO2 electrode
Pneumotachography 0 to 600 L/min 0 to 40 Pneumotachometer
Respiratory rate 2 to 50 breaths/min 0.1 to 10 Impedance
Temperature 32 to 40 °C 0 to 0.1 Thermistor
Common Medical Measurands

Specification Value
Pressure range –30 to +300 mmHg
Overpressure without damage –400 to +4000 mmHg
Maximum unbalance ±75 mmHg
Linearity and hysteresis ± 2% of reading or ± 1 mmHg
Risk current at 120 V 10 A
Defibrillator withstand 360 J into 50
Sensor specifications for a blood pressure sensor are determined by a committee composed of individuals from academia, industry, hospitals, and government.
Sensors
Example: Blood pressure sensor