derivation and experimental validation of a power-split ...hying/images/ieee vehicular technology...
TRANSCRIPT
IEEE TRANSACTIONS ON VEHICULAR TECHNOLOGY, VOL. 55, NO. 6, NOVEMBER 2006 1731
Derivation and Experimental Validation of aPower-Split Hybrid Electric Vehicle Model
Fazal U. Syed, Ming L. Kuang, John Czubay, Member, IEEE, and Hao Ying, Senior Member, IEEE
Abstract—Hybrid electric vehicles (HEVs) have attracted a lotof attention due to environmental and efficiency reasons. Typically,an HEV combines two power trains, a conventional power sourcesuch as a gasoline engine, a diesel engine, or a fuel cell stack, andan electric drive system (involving a motor and a generator) toproduce driving power with a potential of higher fuel economythan conventional vehicles. Furthermore, such vehicles do not re-quire external charging and thus work within the existing fuelinginfrastructures. The power-split power train configuration of anHEV has the individual advantages of the series and parallel typesof HEV power train configurations. A sophisticated control sys-tem, however, is required to manage the power-split HEV powertrains. Designing such a control system requires a reasonably ac-curate HEV system plant model. Much research has been done fordeveloping dynamic plant models for the series and parallel types,but a complete and validated dynamic model for the power-splitHEV power train is still in its infancy. This paper presents a pow-er-split power train HEV dynamic model capable of realisticallyreplicating all the major steady-state and transient phenomenaappearing under different driving conditions. A mathematicalderivation and modeling representation of this plant model andits components is shown first. Next, the analysis, verification, andvalidation through computer simulation and comparison with thedata actually measured in the test vehicle at the Ford Motor Com-pany’s test track is performed. The excellent agreements betweenthe model and the experimental results demonstrate the fidelityand validity of the derived plant model. Since this plant model wasbuilt by integrating the subsystem models using a system-orientedapproach with a hierarchical methodology, it is easy to changesubsystem functionalities. The developed plant model is usefulfor analyzing and understanding the dominant dynamics of thepower train system, the interaction between subsystems and com-ponents, and system transients due to the change of operationalstate and the influence of disturbances. This plant model can alsobe employed for the development of vehicle system controllers,evaluation of energy management strategies, issue resolution, andverification of coded algorithms, among many other purposes.
Index Terms—Electronic-continuously variable transmission(e-CVT), derivation, hybrid electric vehicle (HEV), modeling,power-split, simulation, validation.
Manuscript received March 31, 2005; revised August 29, 2005. The reviewof this paper was coordinated by Prof. A. Emadi.
F. U. Syed is with the Department of Electrical and Computer Engineering,Wayne State University, Detroit, MI 48202 USA, and also with the HybridVehicle Program, Sustainable Mobility Technologies Laboratory II, Ford MotorCompany, Dearborn, MI 48120 USA.
M. L. Kuang and J. Czubay are with the Hybrid Vehicle Program, SustainableMobility Technologies Laboratory II, Ford Motor Company, Dearborn, MI48120 USA (e-mail: [email protected]).
H. Ying is with the Department of Electrical and Computer Engineer-ing, Wayne State University, Detroit, MI 48202 USA (e-mail: [email protected]).
Color versions of Figs. 1 and 12–18 are available online at http://ieeexplore.ieee.org.
Digital Object Identifier 10.1109/TVT.2006.878563
I. INTRODUCTION
THE AUTOMOTIVE industry’s focus has been shiftingtoward an emphasis on environmentally clean, more ef-
ficient, and safe products [1], [2]. This shift in the focus hascaused major automotive companies to set the environment andefficiency as two of their most important goals and are workingtoward achieving them. They are actively developing variousnew technologies such as electric vehicles (EVs), hybrid EVs(HEVs), and fuel cell hybrid vehicles (FCHVs). FCHVs willnot likely be ready for mass production in the next five to tenyears because of the unavailability of the desired infrastructureand relative immaturity of the technology. Similarly, EVs arenot in demand because of their shortfall in terms of perfor-mance, relatively short driving range, long battery chargingtimes, and the lack of a battery charging infrastructure.
HEVs have attracted a great deal of attention in the lastfew years since they do not necessarily require external bat-tery charging or new infrastructure. HEVs also provide greatpotential for better fuel economy and lower emissions withoutcompromising performance. Generally, there are two types ofHEVs, namely 1) the series hybrid system [3], [4] and 2) theparallel hybrid system [3], [4]. The more recent type of complexHEV [5], i.e., the power-split hybrid system [5]–[8], combinesthe benefits of both the parallel- and series-type hybrid systemswithout sacrificing the cost effectiveness of this hybrid system.This system consists of two kinds of power sources, a gasolineengine, a motor, a generator, and a high-voltage battery. Thissystem also has the capability of driving the vehicle on electricpower as well (a full HEV) [5]–[8].
Fig. 1 describes the power-split HEV configuration and itscontrol system. This power train system consists of four sub-systems/components, namely 1) the engine subsystem, 2) thetransaxle subsystem, 3) the brake subsystem, and 4) the batterysubsystem. They are connected to the driveline through a com-bination of engine and generator subsystems using a planetarygear set to connect each other and the electric drive system(motor, generator, and battery subsystems) to construct twopower sources to propel the vehicle. Each subsystem requiresits own controller. It can be noted that the transaxle subsys-tem controller module (TCM) is integrated with this transaxlesubsystem where both electric machines, i.e., the motor andthe generator, are housed to provide electrical functionalityand are used for different purposes, depending on the drivingconditions. It can also be noted that the brake subsystem isan electrohydraulic brake system, which provides the seam-less integration of the friction brakes and regenerative brakingfunctionality. In order to ensure that all these controllers work
0018-9545/$20.00 © 2006 IEEE

1732 IEEE TRANSACTIONS ON VEHICULAR TECHNOLOGY, VOL. 55, NO. 6, NOVEMBER 2006
Fig. 1. Power-split-type HEV configuration.
together to meet the driver’s demand and provide the desiredenergy management and functionality, a supervisory vehiclesystem controller (VSC) is essential. For a given driver de-mand and vehicle operation conditions, this VSC maintains thevehicle at its most efficient operating point by managing thepower among the various components of the vehicle and coor-dinating the operating state of the engine, generator, motor, andbattery. In addition, the VSC will ensure the required vehicle’sperformance and drivability. Clearly, a very complicated andsophisticated VSC [7]–[10] is required to achieve better fueleconomy, emissions, and energy management without compro-mising vehicle performance.
The plant modeling of the power train is very critical andcrucial to the VSC effective design [11], [12]. Efforts havebeen made to develop experimentally validated HEV plantmodels for the series- or parallel-type hybrid systems [12]–[20].Furthermore, there are various ADVISOR-based [21]–[25]validated vehicle models that use mostly backward facingapproaches [21]. While such models are good predictors ofvehicle performance and energy usage, and their simulationstimes are up to eight times faster than forward facing ap-proaches [21], the drawback of the backward facing approachis that it imposes a specific speed cycle. Imposing a speed cyclein the backward facing approach results in the forces actingon the wheel, and then the simulation goes backward throughthe drivetrain up to the primary energy source. Therefore, inthe backward facing approach, the driver’s behavior does notget reflected, since cycles are followed precisely and, hence,cannot be used for detailed control system development [21],[40], [41]. In conclusion, this method is not suited for controlsystem development that requires controlling and studying rea-sonably accurate behavior of drivetrain performances. Further-more, since this approach uses steady-state test data along withimposing a speed cycle, dynamics affects cannot be studiedeither. Few results [26]–[28], however, exist in the literatureregarding mathematical dynamics plant model of a power-
split transmission (transaxle) that can be used for studyingand simulating dynamics related to speed, torque, and powerbehavior of this subsystem.
The objective of this work was to develop a complete plantmodel of a power-split HEV, which is also validated againstthe experimental results. Indeed, as described later in thispaper, the objective was achieved through the theoretical deriva-tion and experimental vehicle validation. The results clearlydemonstrate that the developed power-split HEV plant model iscapable of producing dynamics of both steady-state phenomenaand transient phenomena that are related to driveline/wheeltorque, vehicle speed, engine torque, engine speed, generatortorque, generator speed, motor torque, motor speed, and high-voltage battery power. This demonstration is accomplished bydescribing the power train system (Fig. 1) and detailing thederivation of key subsystem mathematical representations andthe model architecture. Finally, the plant model behaviors cor-responding to the experimental conditions for different drivingconditions, including transient phenomena, are compared withthe experimental vehicle data.
II. MODELING OF A POWER-SPLIT HEV DYNAMICS
The modeling of the power-split HEV dynamics can bebroken down into the power plant dynamics model, the brakesystem dynamics model, the driveline dynamics model, and thevehicle dynamics model. In order to proceed further into the de-velopment of the HEV dynamics plant model, a brief introduc-tion to the power-split power train operation is first provided.
A. Introduction to Power-Split Power Train Operation
As shown in Fig. 1, the power-split HEV power train con-sists of two power sources, namely 1) combination of engine,generator, and planetary gear set and 2) a combination of motorand battery [6]–[8], [26]–[28]. The planetary gear set providesinterconnection between the engine, generator, and motor. This
SYED et al.: DERIVATION AND EXPERIMENTAL VALIDATION OF A POWER-SPLIT HEV MODEL 1733
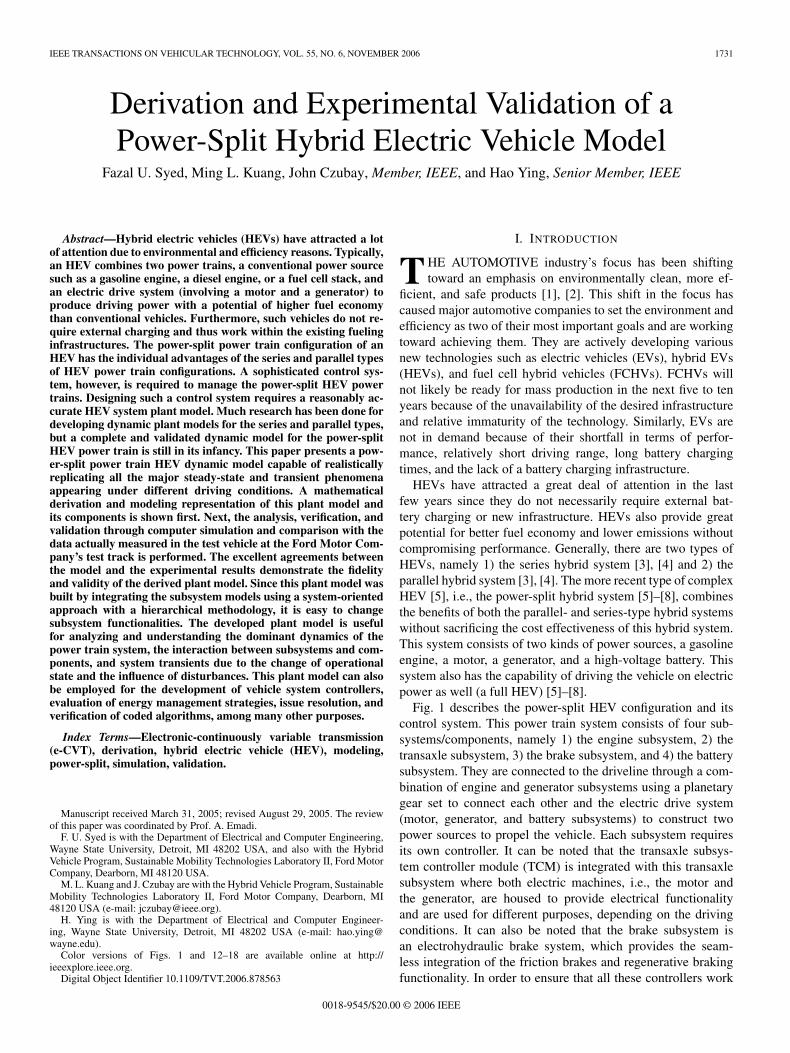
Fig. 2. Power-split HEV system power flow diagram.
planetary gear configuration provides decoupling of the enginespeed from the vehicle speed, which provides a great potentialto achieve better engine efficiency. Fig. 2 shows the power flowdiagram of the power-split HEV system. In an electric-onlydrive mode (EV mode), where the engine is turned off, theelectric motor draws the power from the battery and providespropulsion to the vehicle for forward and reverse motions. Inthe EV mode, the generator can also be used as a motor to drawpower from the battery to assist the vehicle’s forward launchdue to the one-way clutch at the carrier (engine) shaft. Notethat during an EV mode for reverse launch, the generator cannotprovide assistance since there is no reaction torque available totransmit the generator torque.
In a hybrid–electric drive mode, as is evident in Fig. 2, theengine output power can be split into two paths by controllingthe generator [6]–[8], [26]–[28], namely 1) mechanical pathτrωr (from the engine to the carrier to the ring gear to countershaft) and 2) electrical path τgωg to τmωm (from the engineto the generator to the motor to the counter shaft). Due tothe kinematics property of planetary gear set, this split inengine power is accomplished by controlling the engine speedto a desired value, independent of the vehicle speed, therebyproviding an opportunity for decoupling the engine speed fromthe vehicle speed by varying the generator speed accordingly. Itis noted that the generator can rotate in either directions (i.e.,clockwise or counterclockwise). The changing generator orengine speed varies the engine power split between its electricalpath and mechanical path. The generator provides reactiontorque to the engine output torque for control of the enginespeed and transmits the engine output torque to the ring gearof the planetary gear set and, finally, to the wheels.
For a given driver demand and vehicle operating conditions,if the generator speed that results from the desired engine speedis in the opposite direction of its torque, the generator behavesas an electric generation unit, and this power train operation iscalled the positive split mode. This mode of operation usuallyoccurs when the driver demands more power (e.g., a driverpedal tip in maneuver) or when battery requires charging.Due to the kinematics property of the planetary gear set, thegenerator can possibly rotate in the same direction of its torque,which reacts to the engine output torque (e.g., a driver pedaltip out maneuver). In this operation, the generator inputs power(like the engine) to the planetary gear set to drive the vehicle.This operation mode is called the negative split mode. Similarto the positive split mode, the generator torque produced by thegenerator speed control in the negative split mode reacts to the
engine output torque and conveys the engine output torque tothe wheels. In these two operation modes, the motor operationis coordinated with the generator to transmit the engine outputpower to the driven wheels to meet the driver’s demand. Thiscombination/coordination operation among generator, motor,and planetary gear set can be regarded as a continuous variabletransmission (CVT) function.
When the generator brake (as shown in Fig. 1) is actuated(called parallel mode), the sun gear is locked from rotating, andthe generator braking torque provides the reaction torque to theengine output torque. In this operation, like a parallel HEV, allthe engine output power is transmitted to the drivetrain onlythrough the mechanical path with a fixed mechanical ratio. Insummary, under all hybrid electric drive modes, the engine re-quires either the generator torque or the generator brake torqueto transmit its output power through both its electrical andmechanical paths (split modes) or only through its mechanicalpath (parallel mode) to the drivetrain for propulsion.
When the vehicle is decelerated, the system operation in thismode is similar to the positive split mode. In other words, thegenerator is controlled according to the decrease of vehiclespeed to function as a generator to make sure that the engineis being operated in the desired and allowable region. In thismode, the electric motor not only provides regenerative brakingtorque to meet the driver’s demand but also absorbs the torquefrom the engine.
In summary, this power-split power train system providesa CVT [27] like functionality through the planetary gear setand generator control to decouple the engine speed from thevehicle speed and through the motor transmitting the part ofthe engine power from the engine electrical path (generator)to the wheel. This CVT functionality provides great potentialto achieve better engine efficiency and lower emissions. Inaddition, with the electric drive capability and regenerativebraking, the power-split power train provides a great potentialto achieve better overall fuel economy without compromisingvehicle performance.
In order to study the dynamics of this power train systemand to design and develop control strategies for this type ofHEV, it is essential to model the dynamics of the subsystemsof this power-split HEV power train plant and then integratethese subsystems to obtain the complete plant model of thepower-split HEV power train. The main subsystems of thispower-split HEV power train are power plant, brake system,driveline, and vehicle.
B. Power Plant Dynamics Model
There are two different sources of power, namely 1) engineand 2) electric machines (motor and generator). Furthermore,the high-voltage battery is the energy storage device for thistype of vehicle. Therefore, the power plant dynamics model canbe broken down into the engine dynamics model, the electricmachine dynamics model, the one-way clutch and generatorbrake dynamics model, the planetary gear sets system dynamicsmodel, and the battery dynamics model.
1) Engine Dynamics Model: The engine modeling is es-sential to the power-split power train modeling and can be
1734 IEEE TRANSACTIONS ON VEHICULAR TECHNOLOGY, VOL. 55, NO. 6, NOVEMBER 2006
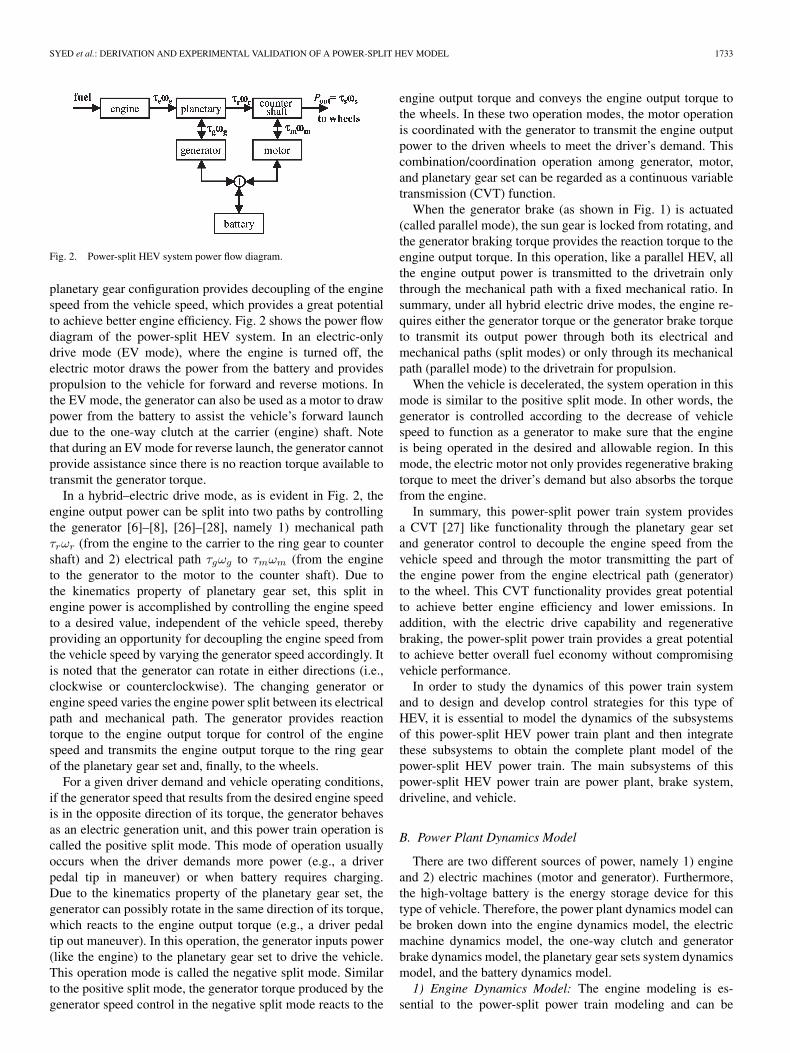
Fig. 3. Engine dynamics model block diagram.
very complicated since it is a complex system and has varioussubsystem levels that need to be modeled [18], [19]. However,since studying vehicle emissions is not the goal of this modelingtool, and the driveline dynamics and the interactions amongsubsystems are of primary interest, the engine model can besimplified such that a first- or second-order transfer functionis used to characterize the following engine torque outputresponse:
Teng_act =1
τs + 1Teng_desired
or
Teng_act =ω2
n
s2 + 2ςωns + ω2n
Teng_desired (1)
where τ is the time constant (in seconds) of a first-order system,ς and ωn are the damping ratio and undamped natural frequency(in radians per second) of the second-order system, respectively,1/ςωn represents the time constant of the second-order system,Teng_act is the actual delivered engine torque (in newton me-ters), and Teng_desired is the desired engine torque (in newtonmeters). Note that the selection of appropriate time constantand damping ratio is very important since these parametersreflect the response of the engine to the desired engine torque.An iterative process is employed to determine the appropriatevalues for these parameters under specific driving conditions,where these parameters are also calibrated under a simulationenvironment to match the experimental data. In this process, anengine or the subsystem is used on a dynamometer to study theengine torque response to a desired torque at different enginespeeds. These experimental data are then used to determineappropriate values of time constant and damping ratio. Later,simulations are done with this engine subsystem to see if thedesired response is achieved, and these parameters are furthertuned to match the desired response. This process is repeateduntil the desired response is achieved. The decision to choosethe type of transfer function depends on the type of enginetorque, speed response, or behavior desired. The engine modelis shown in Fig. 3. In order to maintain the properties suchas engine losses, engine torque, or power delivery for fueleconomy studies, empirical data for the maximum–minimumengine torque curves along with the engine loss curves areused to characterize the engine under steady-state conditions.Similarly, the consumption (fuel or electrical) calculation isalso based on empirical data.
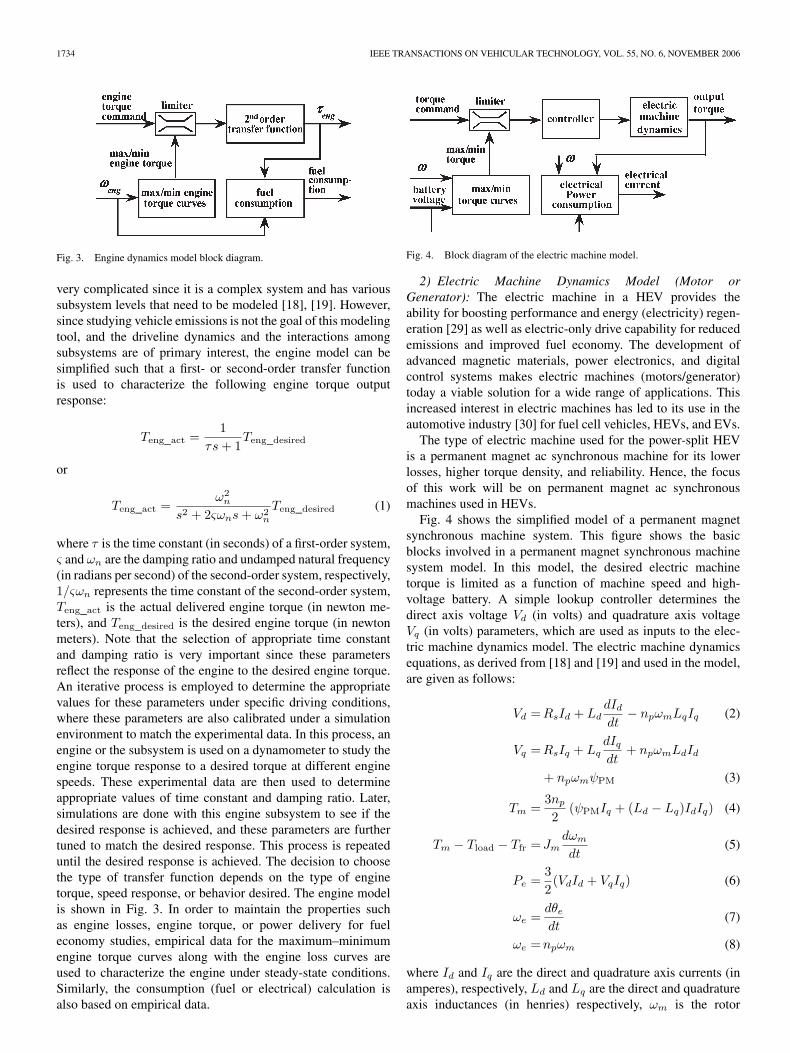
Fig. 4. Block diagram of the electric machine model.
2) Electric Machine Dynamics Model (Motor orGenerator): The electric machine in a HEV provides theability for boosting performance and energy (electricity) regen-eration [29] as well as electric-only drive capability for reducedemissions and improved fuel economy. The development ofadvanced magnetic materials, power electronics, and digitalcontrol systems makes electric machines (motors/generator)today a viable solution for a wide range of applications. Thisincreased interest in electric machines has led to its use in theautomotive industry [30] for fuel cell vehicles, HEVs, and EVs.
The type of electric machine used for the power-split HEVis a permanent magnet ac synchronous machine for its lowerlosses, higher torque density, and reliability. Hence, the focusof this work will be on permanent magnet ac synchronousmachines used in HEVs.
Fig. 4 shows the simplified model of a permanent magnetsynchronous machine system. This figure shows the basicblocks involved in a permanent magnet synchronous machinesystem model. In this model, the desired electric machinetorque is limited as a function of machine speed and high-voltage battery. A simple lookup controller determines thedirect axis voltage Vd (in volts) and quadrature axis voltageVq (in volts) parameters, which are used as inputs to the elec-tric machine dynamics model. The electric machine dynamicsequations, as derived from [18] and [19] and used in the model,are given as follows:
Vd =RsId + LddId
dt− npωmLqIq (2)
Vq =RsIq + LqdIq
dt+ npωmLdId
+ npωmψPM (3)
Tm =3np
2(ψPMIq + (Ld − Lq)IdIq) (4)
Tm − Tload − Tfr =Jmdωm
dt(5)
Pe =32(VdId + VqIq) (6)
ωe =dθe
dt(7)
ωe =npωm (8)
where Id and Iq are the direct and quadrature axis currents (inamperes), respectively, Ld and Lq are the direct and quadratureaxis inductances (in henries) respectively, ωm is the rotor

SYED et al.: DERIVATION AND EXPERIMENTAL VALIDATION OF A POWER-SPLIT HEV MODEL 1735
mechanical speed (in radians per second), ωe is the electricalrotor speed (in radians per second), Rs is the series resistance(in ohms), np is the number of pole pairs, ψPM is the permanentelectric machine flux (in webers), Jm is the electric machineinertia (in kilogram square meters), Tm is the mechanicalelectric machine torque (in newton meters), Tfr is the electricmachine friction torque (in newton meters), Tload is the loadtorque (in newton meters), Pe is the electrical power (in watts),and θe is the electrical rotor angle (in radians). Using theseequations, the final delivered torque, total power, and systemlosses can be calculated. Note that the system losses here referto combined losses in both the motor and the inverter and arefunction of electric machine speed, its delivered torque, andterminal voltage of the battery [19].
It is clear from the equations above that the electric ma-chine dynamic model developed requires knowledge of variousmachine parameters such as Rs, Ld, Lq, and ψPM. Theseparameters need to be calibrated under a simulation envi-ronment such that they closely match the experimental data.Use of such a complicated simulation model requires a lot ofcomputing power and slows down the simulation times; hence,a simpler model could be used for specific conditions andstudies, where empirical data relating to an electric machine’smaximum torque, speed, and power loss are available, and theimportance for very accurate transient behavior of system isovershadowed by the slow time constants of engine subsystem.Under such conditions, empirical data are used to representthe electric machine model [31] and, hence, a first- or second-order system, depending on the desired response or behavior,is used to represent the electric machine model. This way, themodeling for the inverter can be ignored, and inverter lossescan be combined with the electric machine losses. The follow-ing equations represent the approximate modeling of electricmachine when empirical data are available:
Tm =1
τs + 1Tm_desired
or
Tm =ω2
n
s2 + 2ςωns + ω2n
Tm_desired (9)
Pe =Tmωm + Ploss (10)
where Tm is the mechanical electric machine delivered torque(in newton meters), Tm_desired is the desired electric machinetorque (in newton meters), Pe is the total electric machinepower (in watts), Ploss is the electric machine power losses(in watts), and ωm is the electric machine speed (in radiansper second). Again, the selection of appropriate time constantand damping ratio is critical, as these parameters reflect theresponse of the electric machine to the desired electric machinetorque. The value selection for these parameters employs aniterative process where these parameters are calibrated under asimulation environment to match the experimental data. Again,this process is similar to the one described in Section II-B1,where an electric machine or the subsystem is used on adynamometer to study the electric machine torque responseto a desired torque at different electric machine speeds. These
experimental data are then used to determine appropriate valuesof time constant and damping ratio. Later, simulations aredone with this electric machine subsystem to see if the desiredresponse is achieved, and these parameters are further tunedto match the desired response. This process is repeated untilthe desired response is achieved. Under rare conditions, suchas studying driveline behavior at electric machine’s maximumcapabilities, where motor transient phenomenon [32] plays avery important role, the aforementioned first- or second-orderapproximation may not be used. In that case, the use of thepreviously mentioned detailed electric machine dynamic modelto study such phenomena is required.
3) One-Way Clutch and Generator Brake Model: The one-way clutch is modeled to provide reaction torque when enginespeed is negative, and zero when engine speed is positive. Thisis mathematically represented as follows:
Towc ={kωeng − Jeng
dωengdt , when ωeng < 0
0, when ωeng ≥ 0(11)
where Towc is the one-way clutch reaction torque (in newtonmeters), ωe is the engine speed (in radians per second), Jengis the engine inertia (in kilogram square meters), and k is aconstant that is tuned in the simulation environment.
We modeled the desired generator brake, which was used inparallel mode as mentioned in Section II-A, using a frictioncoefficient that is a function of the percentage of slip and aconstant normal force or torque as follows:
Tgenbrk_des = kfTk (12)
where kf is the friction coefficient, and Tk is the normalconstant torque (in newton meters). Appropriate values forthese parameters are selected under a simulation environmentin a manner that they match the experimental vehicle data.
Finally, we used a first-order system transfer function to rep-resent the dynamic response of the generator brake as follows:
Tgen_brake
={
1τs+1Tgenbrk_des, when in parallel mode operation0, when in nonparallel mode operation
(13)
where Tgen_brake is the generator brake torque (in newtonmeters). The generator brake torque response is achieved bycarefully selecting appropriate values for the time constant. Theappropriate time constant selection is done through various sim-ulations using different values of time constants and selectingthe value that closely matches the experimental data.
4) Planetary Gear Sets System Dynamics Model: The fol-lowing assumptions are made for the derivation of planetarygear set system dynamics equations:
1) All shafts within the power plant are assumed to be rigid.2) The inertia of the pinion gears is neglected because it
is relatively small, and there is no interest in the torqueacting on the pinion gears. The carrier inertia is lumpedwith engine inertia. The sun gear inertia is lumped withthe generator rotor inertia. The inertia of the ring gear and
1736 IEEE TRANSACTIONS ON VEHICULAR TECHNOLOGY, VOL. 55, NO. 6, NOVEMBER 2006
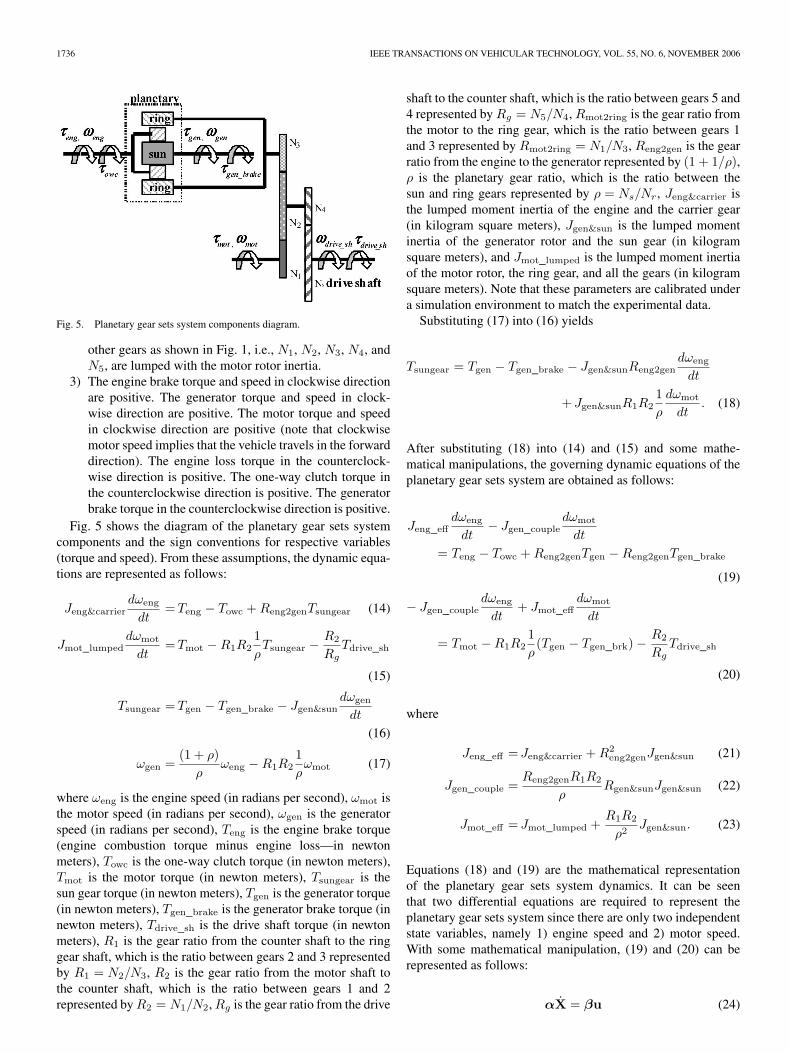
Fig. 5. Planetary gear sets system components diagram.
other gears as shown in Fig. 1, i.e., N1, N2, N3, N4, andN5, are lumped with the motor rotor inertia.
3) The engine brake torque and speed in clockwise directionare positive. The generator torque and speed in clock-wise direction are positive. The motor torque and speedin clockwise direction are positive (note that clockwisemotor speed implies that the vehicle travels in the forwarddirection). The engine loss torque in the counterclock-wise direction is positive. The one-way clutch torque inthe counterclockwise direction is positive. The generatorbrake torque in the counterclockwise direction is positive.
Fig. 5 shows the diagram of the planetary gear sets systemcomponents and the sign conventions for respective variables(torque and speed). From these assumptions, the dynamic equa-tions are represented as follows:
Jeng&carrierdωeng
dt=Teng − Towc + Reng2genTsungear (14)
Jmot_lumpeddωmot
dt=Tmot −R1R2
1ρTsungear − R2
RgTdrive_sh
(15)
Tsungear =Tgen − Tgen_brake − Jgen&sundωgen
dt
(16)
ωgen =(1 + ρ)
ρωeng −R1R2
1ρωmot (17)
where ωeng is the engine speed (in radians per second), ωmot isthe motor speed (in radians per second), ωgen is the generatorspeed (in radians per second), Teng is the engine brake torque(engine combustion torque minus engine loss—in newtonmeters), Towc is the one-way clutch torque (in newton meters),Tmot is the motor torque (in newton meters), Tsungear is thesun gear torque (in newton meters), Tgen is the generator torque(in newton meters), Tgen_brake is the generator brake torque (innewton meters), Tdrive_sh is the drive shaft torque (in newtonmeters), R1 is the gear ratio from the counter shaft to the ringgear shaft, which is the ratio between gears 2 and 3 representedby R1 = N2/N3, R2 is the gear ratio from the motor shaft tothe counter shaft, which is the ratio between gears 1 and 2represented by R2 = N1/N2, Rg is the gear ratio from the drive
shaft to the counter shaft, which is the ratio between gears 5 and4 represented by Rg = N5/N4, Rmot2ring is the gear ratio fromthe motor to the ring gear, which is the ratio between gears 1and 3 represented by Rmot2ring = N1/N3, Reng2gen is the gearratio from the engine to the generator represented by (1 + 1/ρ),ρ is the planetary gear ratio, which is the ratio between thesun and ring gears represented by ρ = Ns/Nr, Jeng&carrier isthe lumped moment inertia of the engine and the carrier gear(in kilogram square meters), Jgen&sun is the lumped momentinertia of the generator rotor and the sun gear (in kilogramsquare meters), and Jmot_lumped is the lumped moment inertiaof the motor rotor, the ring gear, and all the gears (in kilogramsquare meters). Note that these parameters are calibrated undera simulation environment to match the experimental data.
Substituting (17) into (16) yields
Tsungear = Tgen − Tgen_brake − Jgen&sunReng2gendωeng
dt
+Jgen&sunR1R21ρ
dωmot
dt. (18)
After substituting (18) into (14) and (15) and some mathe-matical manipulations, the governing dynamic equations of theplanetary gear sets system are obtained as follows:
Jeng_effdωeng
dt− Jgen_couple
dωmot
dt
= Teng − Towc + Reng2genTgen −Reng2genTgen_brake
(19)
− Jgen_coupledωeng
dt+ Jmot_eff
dωmot
dt
= Tmot −R1R21ρ(Tgen − Tgen_brk) − R2
RgTdrive_sh
(20)
where
Jeng_eff = Jeng&carrier + R2eng2genJgen&sun (21)
Jgen_couple =Reng2genR1R2
ρRgen&sunJgen&sun (22)
Jmot_eff = Jmot_lumped +R1R2
ρ2Jgen&sun. (23)
Equations (18) and (19) are the mathematical representationof the planetary gear sets system dynamics. It can be seenthat two differential equations are required to represent theplanetary gear sets system since there are only two independentstate variables, namely 1) engine speed and 2) motor speed.With some mathematical manipulation, (19) and (20) can berepresented as follows:
αX = βu (24)
SYED et al.: DERIVATION AND EXPERIMENTAL VALIDATION OF A POWER-SPLIT HEV MODEL 1737
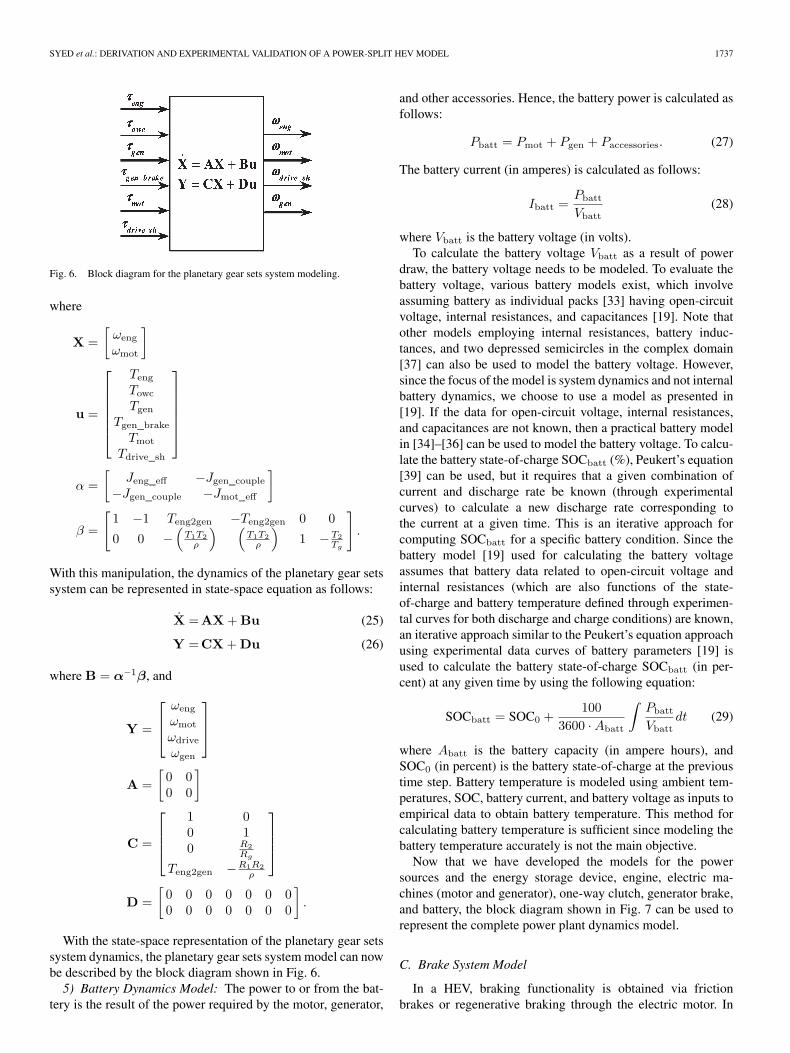
Fig. 6. Block diagram for the planetary gear sets system modeling.
where
X =[ωeng
ωmot
]
u =
TengTowcTgen
Tgen_brakeTmot
Tdrive_sh
α =[
Jeng_eff −Jgen_couple−Jgen_couple −Jmot_eff
]
β =
[1 −1 Teng2gen −Teng2gen 0 0
0 0 −(
T1T2ρ
) (T1T2
ρ
)1 −T2
Tg
].
With this manipulation, the dynamics of the planetary gear setssystem can be represented in state-space equation as follows:
X =AX + Bu (25)
Y =CX + Du (26)
where B = α−1β, and
Y =
ωeng
ωmot
ωdrive
ωgen
A =[
0 00 0
]
C =
1 00 10 R2
Rg
Teng2gen −R1R2ρ
D =[
0 0 0 0 0 0 00 0 0 0 0 0 0
].
With the state-space representation of the planetary gear setssystem dynamics, the planetary gear sets system model can nowbe described by the block diagram shown in Fig. 6.
5) Battery Dynamics Model: The power to or from the bat-tery is the result of the power required by the motor, generator,
and other accessories. Hence, the battery power is calculated asfollows:
Pbatt = Pmot + Pgen + Paccessories. (27)
The battery current (in amperes) is calculated as follows:
Ibatt =Pbatt
Vbatt(28)
where Vbatt is the battery voltage (in volts).To calculate the battery voltage Vbatt as a result of power
draw, the battery voltage needs to be modeled. To evaluate thebattery voltage, various battery models exist, which involveassuming battery as individual packs [33] having open-circuitvoltage, internal resistances, and capacitances [19]. Note thatother models employing internal resistances, battery induc-tances, and two depressed semicircles in the complex domain[37] can also be used to model the battery voltage. However,since the focus of the model is system dynamics and not internalbattery dynamics, we choose to use a model as presented in[19]. If the data for open-circuit voltage, internal resistances,and capacitances are not known, then a practical battery modelin [34]–[36] can be used to model the battery voltage. To calcu-late the battery state-of-charge SOCbatt (%), Peukert’s equation[39] can be used, but it requires that a given combination ofcurrent and discharge rate be known (through experimentalcurves) to calculate a new discharge rate corresponding tothe current at a given time. This is an iterative approach forcomputing SOCbatt for a specific battery condition. Since thebattery model [19] used for calculating the battery voltageassumes that battery data related to open-circuit voltage andinternal resistances (which are also functions of the state-of-charge and battery temperature defined through experimen-tal curves for both discharge and charge conditions) are known,an iterative approach similar to the Peukert’s equation approachusing experimental data curves of battery parameters [19] isused to calculate the battery state-of-charge SOCbatt (in per-cent) at any given time by using the following equation:
SOCbatt = SOC0 +100
3600 ·Abatt
∫Pbatt
Vbattdt (29)
where Abatt is the battery capacity (in ampere hours), andSOC0 (in percent) is the battery state-of-charge at the previoustime step. Battery temperature is modeled using ambient tem-peratures, SOC, battery current, and battery voltage as inputs toempirical data to obtain battery temperature. This method forcalculating battery temperature is sufficient since modeling thebattery temperature accurately is not the main objective.
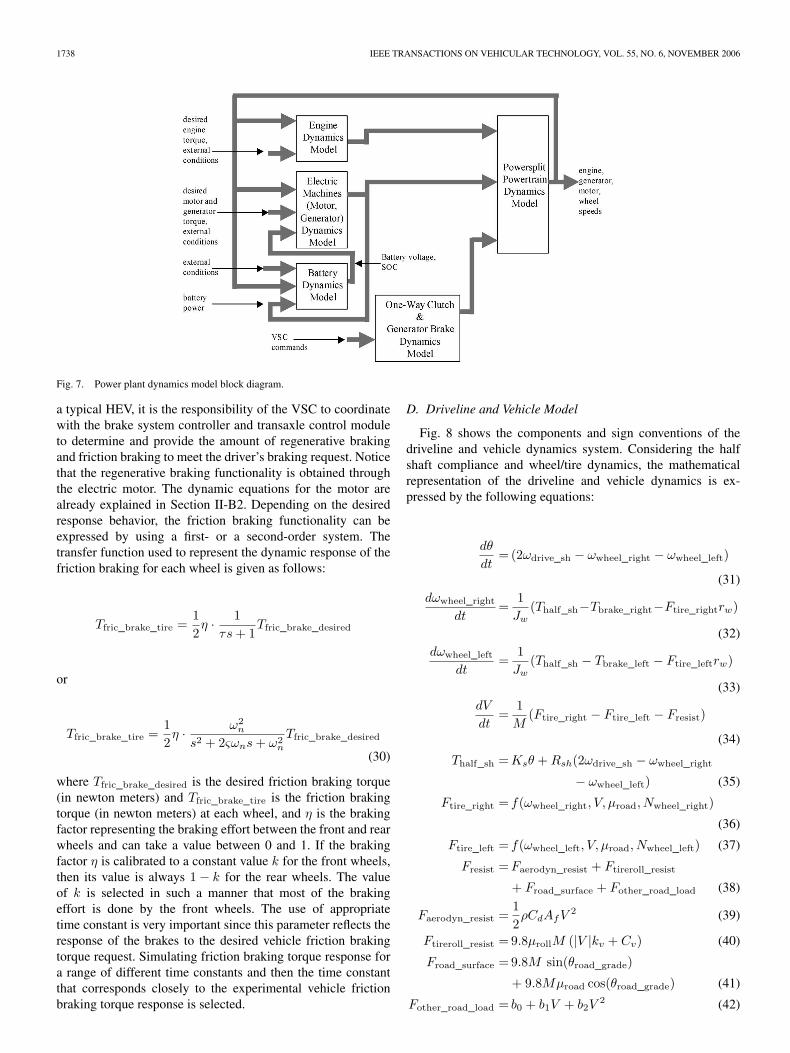
Now that we have developed the models for the powersources and the energy storage device, engine, electric ma-chines (motor and generator), one-way clutch, generator brake,and battery, the block diagram shown in Fig. 7 can be used torepresent the complete power plant dynamics model.
C. Brake System Model
In a HEV, braking functionality is obtained via frictionbrakes or regenerative braking through the electric motor. In
1738 IEEE TRANSACTIONS ON VEHICULAR TECHNOLOGY, VOL. 55, NO. 6, NOVEMBER 2006
Fig. 7. Power plant dynamics model block diagram.
a typical HEV, it is the responsibility of the VSC to coordinatewith the brake system controller and transaxle control moduleto determine and provide the amount of regenerative brakingand friction braking to meet the driver’s braking request. Noticethat the regenerative braking functionality is obtained throughthe electric motor. The dynamic equations for the motor arealready explained in Section II-B2. Depending on the desiredresponse behavior, the friction braking functionality can beexpressed by using a first- or a second-order system. Thetransfer function used to represent the dynamic response of thefriction braking for each wheel is given as follows:
Tfric_brake_tire =12η · 1
τs + 1Tfric_brake_desired
or
Tfric_brake_tire =12η · ω2
n
s2 + 2ςωns + ω2n
Tfric_brake_desired
(30)
where Tfric_brake_desired is the desired friction braking torque(in newton meters) and Tfric_brake_tire is the friction brakingtorque (in newton meters) at each wheel, and η is the brakingfactor representing the braking effort between the front and rearwheels and can take a value between 0 and 1. If the brakingfactor η is calibrated to a constant value k for the front wheels,then its value is always 1 − k for the rear wheels. The valueof k is selected in such a manner that most of the brakingeffort is done by the front wheels. The use of appropriatetime constant is very important since this parameter reflects theresponse of the brakes to the desired vehicle friction brakingtorque request. Simulating friction braking torque response fora range of different time constants and then the time constantthat corresponds closely to the experimental vehicle frictionbraking torque response is selected.
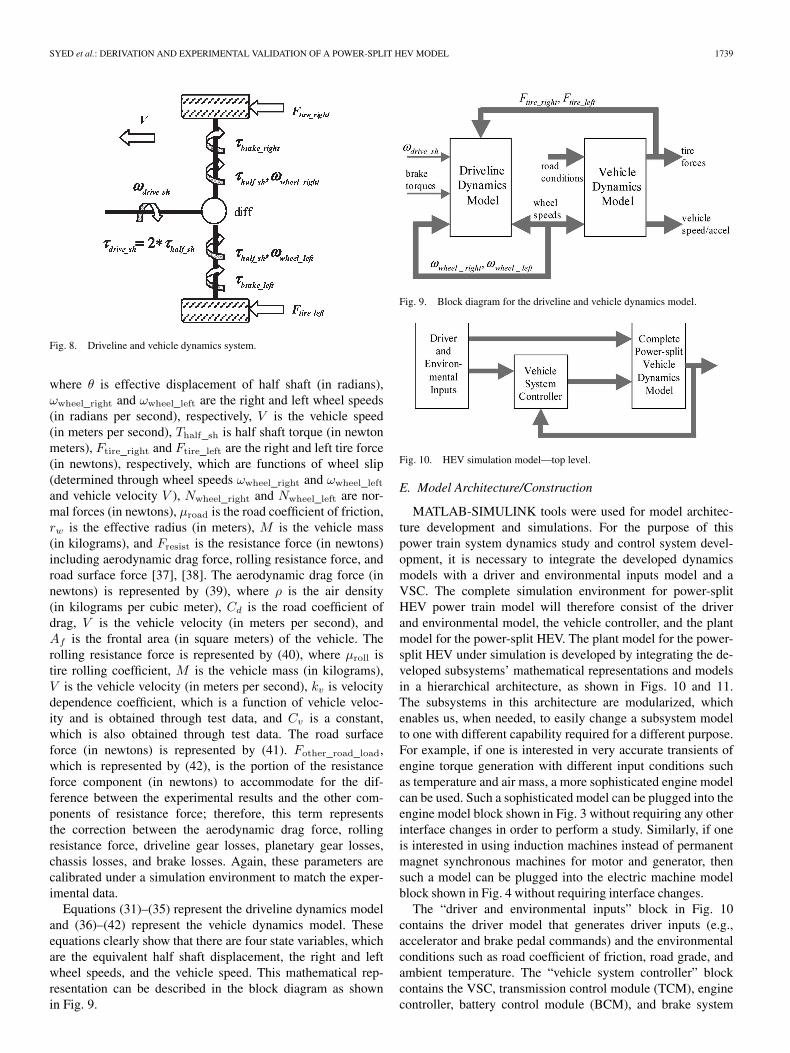
D. Driveline and Vehicle Model
Fig. 8 shows the components and sign conventions of thedriveline and vehicle dynamics system. Considering the halfshaft compliance and wheel/tire dynamics, the mathematicalrepresentation of the driveline and vehicle dynamics is ex-pressed by the following equations:
dθ
dt= (2ωdrive_sh − ωwheel_right − ωwheel_left)
(31)dωwheel_right
dt=
1Jw
(Thalf_sh−Tbrake_right−Ftire_rightrw)
(32)dωwheel_left
dt=
1Jw
(Thalf_sh − Tbrake_left − Ftire_leftrw)
(33)dV
dt=
1M
(Ftire_right − Ftire_left − Fresist)
(34)
Thalf_sh =Ksθ + Rsh(2ωdrive_sh − ωwheel_right
− ωwheel_left) (35)
Ftire_right = f(ωwheel_right, V, µroad, Nwheel_right)
(36)
Ftire_left = f(ωwheel_left, V, µroad, Nwheel_left) (37)
Fresist =Faerodyn_resist + Ftireroll_resist
+ Froad_surface + Fother_road_load (38)
Faerodyn_resist =12ρCdAfV
2 (39)
Ftireroll_resist = 9.8µrollM (|V |kv + Cv) (40)
Froad_surface = 9.8M sin(θroad_grade)
+ 9.8Mµroad cos(θroad_grade) (41)
Fother_road_load = b0 + b1V + b2V2 (42)
SYED et al.: DERIVATION AND EXPERIMENTAL VALIDATION OF A POWER-SPLIT HEV MODEL 1739
Fig. 8. Driveline and vehicle dynamics system.
where θ is effective displacement of half shaft (in radians),ωwheel_right and ωwheel_left are the right and left wheel speeds(in radians per second), respectively, V is the vehicle speed(in meters per second), Thalf_sh is half shaft torque (in newtonmeters), Ftire_right and Ftire_left are the right and left tire force(in newtons), respectively, which are functions of wheel slip(determined through wheel speeds ωwheel_right and ωwheel_leftand vehicle velocity V ), Nwheel_right and Nwheel_left are nor-mal forces (in newtons), µroad is the road coefficient of friction,rw is the effective radius (in meters), M is the vehicle mass(in kilograms), and Fresist is the resistance force (in newtons)including aerodynamic drag force, rolling resistance force, androad surface force [37], [38]. The aerodynamic drag force (innewtons) is represented by (39), where ρ is the air density(in kilograms per cubic meter), Cd is the road coefficient ofdrag, V is the vehicle velocity (in meters per second), andAf is the frontal area (in square meters) of the vehicle. Therolling resistance force is represented by (40), where µroll istire rolling coefficient, M is the vehicle mass (in kilograms),V is the vehicle velocity (in meters per second), kv is velocitydependence coefficient, which is a function of vehicle veloc-ity and is obtained through test data, and Cv is a constant,which is also obtained through test data. The road surfaceforce (in newtons) is represented by (41). Fother_road_load,which is represented by (42), is the portion of the resistanceforce component (in newtons) to accommodate for the dif-ference between the experimental results and the other com-ponents of resistance force; therefore, this term representsthe correction between the aerodynamic drag force, rollingresistance force, driveline gear losses, planetary gear losses,chassis losses, and brake losses. Again, these parameters arecalibrated under a simulation environment to match the exper-imental data.
Equations (31)–(35) represent the driveline dynamics modeland (36)–(42) represent the vehicle dynamics model. Theseequations clearly show that there are four state variables, whichare the equivalent half shaft displacement, the right and leftwheel speeds, and the vehicle speed. This mathematical rep-resentation can be described in the block diagram as shownin Fig. 9.
Fig. 9. Block diagram for the driveline and vehicle dynamics model.
Fig. 10. HEV simulation model—top level.
E. Model Architecture/Construction
MATLAB-SIMULINK tools were used for model architec-ture development and simulations. For the purpose of thispower train system dynamics study and control system devel-opment, it is necessary to integrate the developed dynamicsmodels with a driver and environmental inputs model and aVSC. The complete simulation environment for power-splitHEV power train model will therefore consist of the driverand environmental model, the vehicle controller, and the plantmodel for the power-split HEV. The plant model for the power-split HEV under simulation is developed by integrating the de-veloped subsystems’ mathematical representations and modelsin a hierarchical architecture, as shown in Figs. 10 and 11.The subsystems in this architecture are modularized, whichenables us, when needed, to easily change a subsystem modelto one with different capability required for a different purpose.For example, if one is interested in very accurate transients ofengine torque generation with different input conditions suchas temperature and air mass, a more sophisticated engine modelcan be used. Such a sophisticated model can be plugged into theengine model block shown in Fig. 3 without requiring any otherinterface changes in order to perform a study. Similarly, if oneis interested in using induction machines instead of permanentmagnet synchronous machines for motor and generator, thensuch a model can be plugged into the electric machine modelblock shown in Fig. 4 without requiring interface changes.
The “driver and environmental inputs” block in Fig. 10contains the driver model that generates driver inputs (e.g.,accelerator and brake pedal commands) and the environmentalconditions such as road coefficient of friction, road grade, andambient temperature. The “vehicle system controller” blockcontains the VSC, transmission control module (TCM), enginecontroller, battery control module (BCM), and brake system
1740 IEEE TRANSACTIONS ON VEHICULAR TECHNOLOGY, VOL. 55, NO. 6, NOVEMBER 2006
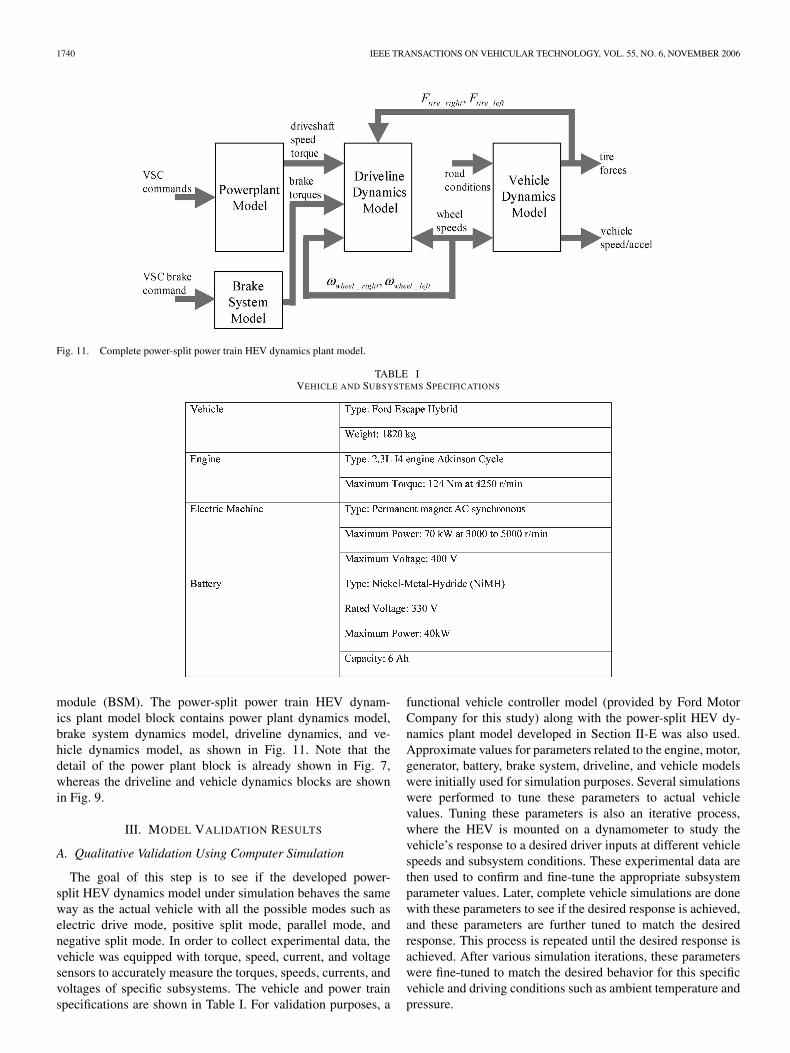
Fig. 11. Complete power-split power train HEV dynamics plant model.
TABLE IVEHICLE AND SUBSYSTEMS SPECIFICATIONS
module (BSM). The power-split power train HEV dynam-ics plant model block contains power plant dynamics model,brake system dynamics model, driveline dynamics, and ve-hicle dynamics model, as shown in Fig. 11. Note that thedetail of the power plant block is already shown in Fig. 7,whereas the driveline and vehicle dynamics blocks are shownin Fig. 9.
III. MODEL VALIDATION RESULTS
A. Qualitative Validation Using Computer Simulation
The goal of this step is to see if the developed power-split HEV dynamics model under simulation behaves the sameway as the actual vehicle with all the possible modes such aselectric drive mode, positive split mode, parallel mode, andnegative split mode. In order to collect experimental data, thevehicle was equipped with torque, speed, current, and voltagesensors to accurately measure the torques, speeds, currents, andvoltages of specific subsystems. The vehicle and power trainspecifications are shown in Table I. For validation purposes, a
functional vehicle controller model (provided by Ford MotorCompany for this study) along with the power-split HEV dy-namics plant model developed in Section II-E was also used.Approximate values for parameters related to the engine, motor,generator, battery, brake system, driveline, and vehicle modelswere initially used for simulation purposes. Several simulationswere performed to tune these parameters to actual vehiclevalues. Tuning these parameters is also an iterative process,where the HEV is mounted on a dynamometer to study thevehicle’s response to a desired driver inputs at different vehiclespeeds and subsystem conditions. These experimental data arethen used to confirm and fine-tune the appropriate subsystemparameter values. Later, complete vehicle simulations are donewith these parameters to see if the desired response is achieved,and these parameters are further tuned to match the desiredresponse. This process is repeated until the desired response isachieved. After various simulation iterations, these parameterswere fine-tuned to match the desired behavior for this specificvehicle and driving conditions such as ambient temperature andpressure.

SYED et al.: DERIVATION AND EXPERIMENTAL VALIDATION OF A POWER-SPLIT HEV MODEL 1741
Fig. 12. Acceleration from 0 to 26.82 m/s (0 to 60 mi/h) and deceleration to 0 m/s (0 mi/h)—simulation results.
Fig. 12 shows a simulation result using the following drivingscenario: a 0- to 26.82-m/s (0 to 60 mi/h) full acceleratorpedal takeoff, then a constant 26.82-m/s (60 mi/h) speed, andfinally, deceleration down to 0 m/s (0 mi/h). The reason forusing such a drive cycle over standard cycles is that this drivecycle ensures the operation of the vehicle under all its hybridmodes and, at the same time, is very effective to study speed,torque, and power responses of the hybrid vehicle. The topgraph in the figure shows the engine speed and generatorspeed in revolutions per minute and vehicle speed in metersper second (multiplied by 223.7 for scaling) or miles per hour(multiplied by 100 for scaling). The bottom graph shows theengine torque (in newton meters), generator torque (in new-ton meters), and motor torque (in newton meters) responses.Based on the driving scenario, the model responded appropri-ately and demonstrated the expected operating modes: electricdrive mode, positive split mode, parallel mode, and negativesplit mode. These modes are illustrated in the bottom graphof Fig. 12.
It can be seen in Fig. 12 that in the EV mode, the vehicleis propelled by the an electric motor powered by the battery,which is evident from the motor, generator, and engine torquesand speeds. After engine start, the generator provides negativeor reaction torque to transmit the engine output to the drivetrain.For the given vehicle speed and engine speed, the generator isrotating in the positive direction, which is in accordance withthe defined sign convention. The motor torque varies basedon the driver demand and engine/generator response. Thisoperation is the positive split mode. When the generator speedand torque are zero, which implies that the generator brake isactuated, the vehicle is in the parallel mode, and the motortorque depends on the engine torque output. In the negativesplit mode, the generator provides negative torque, as in thepositive split mode, but the generator is rotating in the negativedirection. Furthermore, the motor torque varies accordingly in
the negative split mode similar to the positive split mode. Noticealso that at around 60 s, the motor torque is compensating forthe desired driver demand to maintain the drive trace, resultingin a supplemental tractive force being provided through thebattery, thereby providing an opportunity for fuel economyimprovement by using the battery power instead of the enginetorque to provide the transient driver demand.
B. Quantitative Validation Using Test TrackExperimental Data
The developed power-split HEV dynamics plant model wasfurther validated by comparing critical power train and vehiclevariables of the model with those measured during the experi-mental vehicle testing on the Ford Motor Company’s test track.The first task was the selection of drive cycle for quantitativemodel validation. As a first test, the federal test procedure (FTP)city drive cycle was used for the validation of the developedpower-split HEV dynamics plant model. This drive cycle wasused mainly for fuel-economy-related validation. Using thisdrive cycle, our simulations using the developed plant modelpredicted the fuel economy of the vehicle to be 6.34 L/100 km(38.3 mpg) in the city test, which is very close to the experi-mental measured value of 6.32 L/100 km (38.4 mpg). Overall,analyzing various FTP results, the simulations using the de-veloped plant model predicted the fuel economy with a 90%confidence interval to be within 0.066 L/100 km (0.16 mpg)accuracy. We also compared the engine-on time under FTP citydrive cycle for both the model and experimental vehicle results.The engine-on time predicted was 54.9%, which is very close tothe experimental result of 54.4%. Similarly, the battery powerduring this cycle predicted was 7.72 kW, which is, again, veryclose to the experimental result of 7.41 kW. It is clear from thesetests that the behavior of the developed plant model was veryclose to the experimental vehicle under FTP city drive cycles.
1742 IEEE TRANSACTIONS ON VEHICULAR TECHNOLOGY, VOL. 55, NO. 6, NOVEMBER 2006
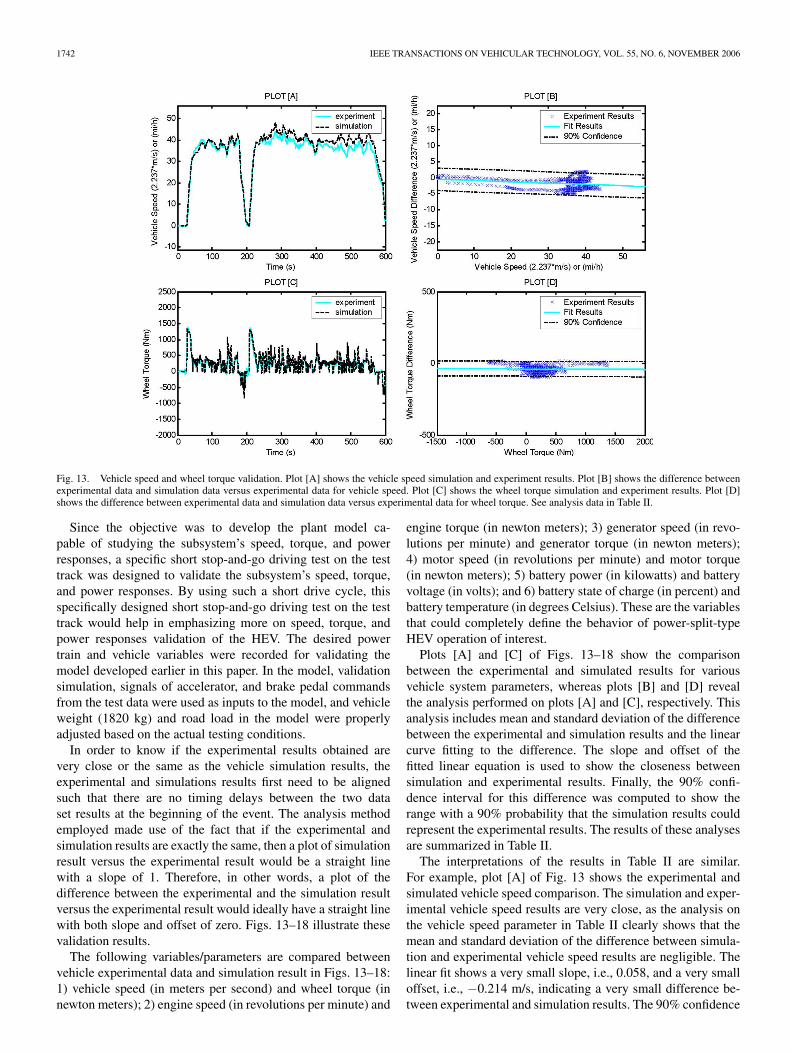
Fig. 13. Vehicle speed and wheel torque validation. Plot [A] shows the vehicle speed simulation and experiment results. Plot [B] shows the difference betweenexperimental data and simulation data versus experimental data for vehicle speed. Plot [C] shows the wheel torque simulation and experiment results. Plot [D]shows the difference between experimental data and simulation data versus experimental data for wheel torque. See analysis data in Table II.
Since the objective was to develop the plant model ca-pable of studying the subsystem’s speed, torque, and powerresponses, a specific short stop-and-go driving test on the testtrack was designed to validate the subsystem’s speed, torque,and power responses. By using such a short drive cycle, thisspecifically designed short stop-and-go driving test on the testtrack would help in emphasizing more on speed, torque, andpower responses validation of the HEV. The desired powertrain and vehicle variables were recorded for validating themodel developed earlier in this paper. In the model, validationsimulation, signals of accelerator, and brake pedal commandsfrom the test data were used as inputs to the model, and vehicleweight (1820 kg) and road load in the model were properlyadjusted based on the actual testing conditions.
In order to know if the experimental results obtained arevery close or the same as the vehicle simulation results, theexperimental and simulations results first need to be alignedsuch that there are no timing delays between the two dataset results at the beginning of the event. The analysis methodemployed made use of the fact that if the experimental andsimulation results are exactly the same, then a plot of simulationresult versus the experimental result would be a straight linewith a slope of 1. Therefore, in other words, a plot of thedifference between the experimental and the simulation resultversus the experimental result would ideally have a straight linewith both slope and offset of zero. Figs. 13–18 illustrate thesevalidation results.
The following variables/parameters are compared betweenvehicle experimental data and simulation result in Figs. 13–18:1) vehicle speed (in meters per second) and wheel torque (innewton meters); 2) engine speed (in revolutions per minute) and
engine torque (in newton meters); 3) generator speed (in revo-lutions per minute) and generator torque (in newton meters);4) motor speed (in revolutions per minute) and motor torque(in newton meters); 5) battery power (in kilowatts) and batteryvoltage (in volts); and 6) battery state of charge (in percent) andbattery temperature (in degrees Celsius). These are the variablesthat could completely define the behavior of power-split-typeHEV operation of interest.
Plots [A] and [C] of Figs. 13–18 show the comparisonbetween the experimental and simulated results for variousvehicle system parameters, whereas plots [B] and [D] revealthe analysis performed on plots [A] and [C], respectively. Thisanalysis includes mean and standard deviation of the differencebetween the experimental and simulation results and the linearcurve fitting to the difference. The slope and offset of thefitted linear equation is used to show the closeness betweensimulation and experimental results. Finally, the 90% confi-dence interval for this difference was computed to show therange with a 90% probability that the simulation results couldrepresent the experimental results. The results of these analysesare summarized in Table II.
The interpretations of the results in Table II are similar.For example, plot [A] of Fig. 13 shows the experimental andsimulated vehicle speed comparison. The simulation and exper-imental vehicle speed results are very close, as the analysis onthe vehicle speed parameter in Table II clearly shows that themean and standard deviation of the difference between simula-tion and experimental vehicle speed results are negligible. Thelinear fit shows a very small slope, i.e., 0.058, and a very smalloffset, i.e., −0.214 m/s, indicating a very small difference be-tween experimental and simulation results. The 90% confidence

SYED et al.: DERIVATION AND EXPERIMENTAL VALIDATION OF A POWER-SPLIT HEV MODEL 1743
Fig. 14. Engine speed and engine torque validation. Plot [A] shows the engine speed simulation and experiment results. Plot [B] shows the difference betweenexperimental data and simulation data versus experimental data for engine speed. Plot [C] shows the engine torque simulation and experiment results. Plot [D]shows the difference between experimental data and simulation data versus experimental data for engine torque. See analysis data in Table II.
Fig. 15. Generator speed and generator torque validation. Plot [A] shows the generator speed simulation and experiment results. Plot [B] shows the differencebetween experimental data and simulation data versus experimental data for generator speed. Plot [C] shows the generator torque simulation and experimentresults. Plot [D] shows the difference between experimental data and simulation data versus experimental data for generator torque. See analysis data in Table II.
interval indicates that there is a 90% probability that the dif-ference between the experimental and simulation results willbe between −2.82 and 1.38 m/s. Similar interpretation canbe made for the rest of the comparisons in Table II. Theconclusion for the analysis of each of them is the same—the
experimental and simulation results are reasonably close. Theonly exception is that if one closely looks at plot [D] of Fig. 14,he or she could interpret that an engine torque difference of20 Nm between experimental and simulation results is possible,but as this HEV operates engine at its most efficient point
1744 IEEE TRANSACTIONS ON VEHICULAR TECHNOLOGY, VOL. 55, NO. 6, NOVEMBER 2006
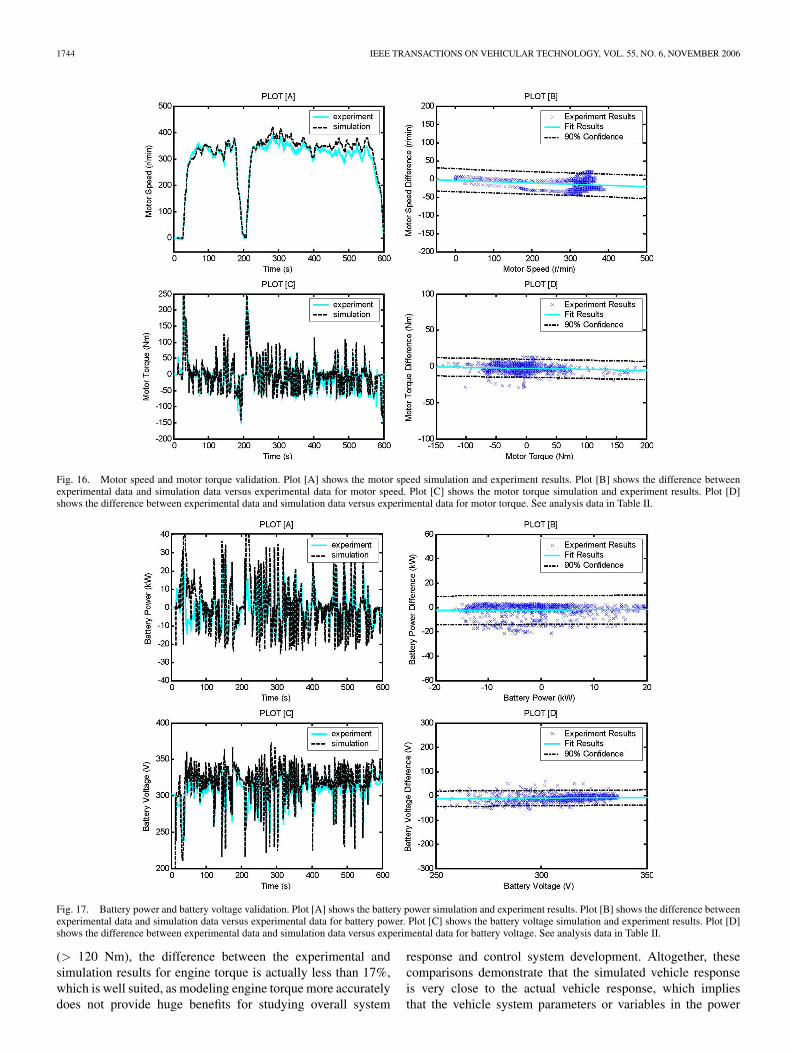
Fig. 16. Motor speed and motor torque validation. Plot [A] shows the motor speed simulation and experiment results. Plot [B] shows the difference betweenexperimental data and simulation data versus experimental data for motor speed. Plot [C] shows the motor torque simulation and experiment results. Plot [D]shows the difference between experimental data and simulation data versus experimental data for motor torque. See analysis data in Table II.
Fig. 17. Battery power and battery voltage validation. Plot [A] shows the battery power simulation and experiment results. Plot [B] shows the difference betweenexperimental data and simulation data versus experimental data for battery power. Plot [C] shows the battery voltage simulation and experiment results. Plot [D]shows the difference between experimental data and simulation data versus experimental data for battery voltage. See analysis data in Table II.
(> 120 Nm), the difference between the experimental andsimulation results for engine torque is actually less than 17%,which is well suited, as modeling engine torque more accuratelydoes not provide huge benefits for studying overall system
response and control system development. Altogether, thesecomparisons demonstrate that the simulated vehicle responseis very close to the actual vehicle response, which impliesthat the vehicle system parameters or variables in the power
SYED et al.: DERIVATION AND EXPERIMENTAL VALIDATION OF A POWER-SPLIT HEV MODEL 1745
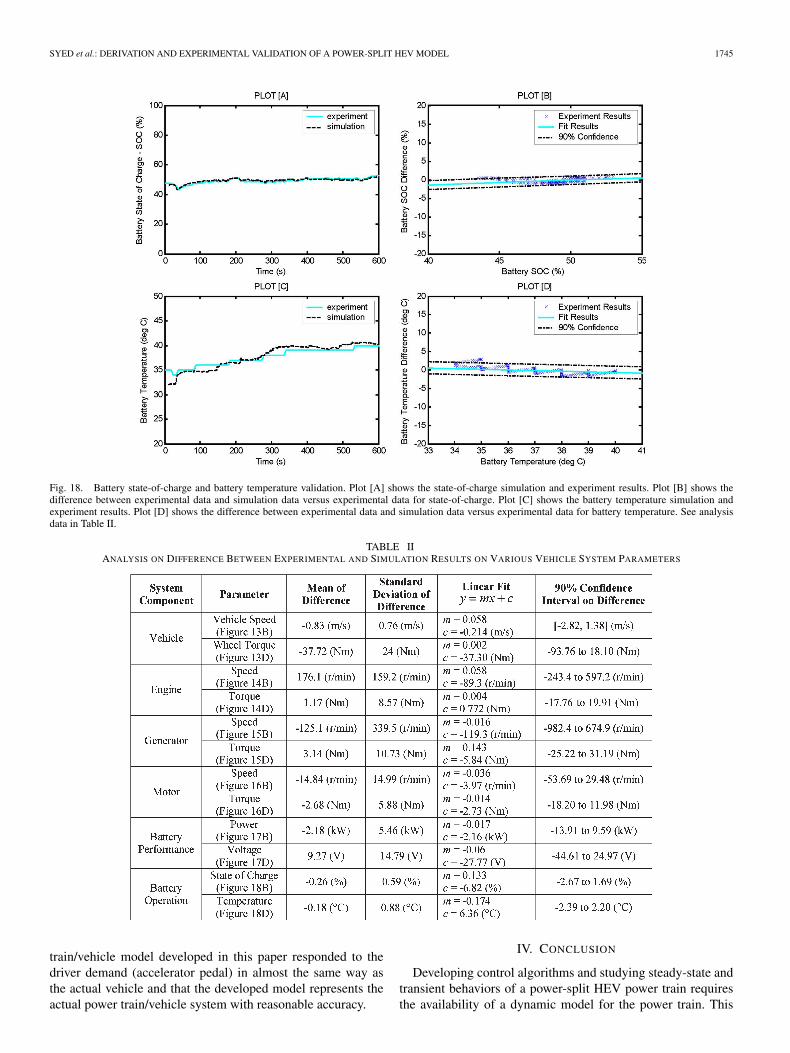
Fig. 18. Battery state-of-charge and battery temperature validation. Plot [A] shows the state-of-charge simulation and experiment results. Plot [B] shows thedifference between experimental data and simulation data versus experimental data for state-of-charge. Plot [C] shows the battery temperature simulation andexperiment results. Plot [D] shows the difference between experimental data and simulation data versus experimental data for battery temperature. See analysisdata in Table II.
TABLE IIANALYSIS ON DIFFERENCE BETWEEN EXPERIMENTAL AND SIMULATION RESULTS ON VARIOUS VEHICLE SYSTEM PARAMETERS
train/vehicle model developed in this paper responded to thedriver demand (accelerator pedal) in almost the same way asthe actual vehicle and that the developed model represents theactual power train/vehicle system with reasonable accuracy.
IV. CONCLUSION
Developing control algorithms and studying steady-state andtransient behaviors of a power-split HEV power train requiresthe availability of a dynamic model for the power train. This
1746 IEEE TRANSACTIONS ON VEHICULAR TECHNOLOGY, VOL. 55, NO. 6, NOVEMBER 2006
paper describes the mathematical modeling, analysis, modelarchitecture, simulation, and validation of a power-split powertrain HEV. This paper also describes the operation of thepower-split power train system along with the mathematicalrepresentations for modeling the major subsystems in thispower train system and its incorporation into a complete power-split power train HEV model. The complete power-split HEVmodel was built by integrating the subsystem models using asystem-oriented approach with a hierarchical methodology thatmakes it very convenient for updating or replacing subsystemfunctionality.
The simulation results demonstrate qualitatively that thedeveloped model represents the power-split power train oper-ation and the interaction among subsystems. Further simulationand experiment results presented illustrate quantitatively thefidelity of the model. The model was validated through thecomparison of the critical variables in the model with thoseactually measured in a test vehicle on the Ford test track. Thevalidation reveals that the developed model predicts the powertrain response with reasonable accuracy and has a relativelyhigh degree of fidelity.
In conclusion, the developed model is effective for simula-tion study and analysis of this power train operation and fordemonstrating the interaction among the various subsystems.The model can be used as a very effective tool for advancedcontrol system development for power-split HEVs. It can alsobe used for issue resolution, development of new control systemstrategies, and verification of coded algorithms, among manyother purposes.
REFERENCES
[1] C. C. Chan, “The state of the art of electric and hybrid vehicles,” Proc.IEEE, vol. 90, no. 2, pp. 247–275, Feb. 2002.
[2] R. Dettmer, “Hybrid pioneers [hybrid electric vehicles],” IEE Rev.,vol. 49, no. 1, pp. 42–45, Jan. 2003.
[3] G. Maggetto and J. Van Mierlo, “Electric and electric hybrid vehicletechnology: A survey,” in Proc. IEE Semin. Elect., Hybrid and Fuel CellVeh. (Ref. No. 2000/050), Apr. 11, 2000, pp. 1–11.
[4] F. A. Wyczalek, “Hybrid electric vehicles (EVS-13 Osaka),” in Proc.Northcon, Nov. 4–6, 1996, pp. 409–412.
[5] C. C. Chan and Y. S. Wong, “Electric vehicles charge forward,” IEEEPower Energy Mag., vol. 2, no. 6, pp. 24–33, Nov./Dec. 2004.
[6] R. Nesbitt, C. Muehlfeld, and S. Pandit, “Powersplit hybrid electric vehi-cle control with electronic throttle control (ETC),” presented at the SAEInt., Powertrain and Fluid Systems Conf. and Exhibition, Pittsburgh, PA,Oct. 2003, Paper 2003-01-3280.
[7] F. Syed and J. Czubay, “Improving the efficiency of production levelalgorithm development for an SUV HEV powertrain,” presented at theSAE Powertrain and Fluid Systems Conf. and Exhibition, San Antonio,TX, Oct. 2004, Paper 2004-01-3039.
[8] R. A. Mcgee, “Model-based control system design and verification for ahybrid electric vehicle,” presented at the SAE Tech. Paper Series, FutureTransportation Technology Conf., Costa Mesa, CA, Jun. 2003, Paper2003-01-2308.
[9] P. Caratozzolo, M. Serra, and J. Riera, “Energy management strategies forhybrid electric vehicles,” in Proc. IEEE IEMDC, Jun. 1–4, 2003, vol. 1,pp. 241–248.
[10] A. Piccolo, L. Ippolito, V. Galdi, and A. Vaccaro, “Optimisation of energyflow management in hybrid electric vehicles via genetic algorithms,” inProc. IEEE/ASME Int. Conf. Adv. Intell. Mechatronics, Jul. 8–12, 2001,vol. 1, pp. 434–439.
[11] G. Rizzoni, L. Guzzella, and B. M. Baumann, “Unified modeling of hybridelectric vehicle drivetrains,” IEEE/ASME Trans. Mechatronics, vol. 4,no. 3, pp. 246–257, Sep. 1999.
[12] G. A. Hubbard and K. Youcef-Toumi, “Modeling and simulation of ahybrid–electric vehicle drivetrain,” in Proc. Amer. Control Conf., Jun. 4–6,1997, vol. 1, pp. 636–640.
[13] S. R. Cikanek, K. E. Bailey, and B. K. Powell, “Parallel hybrid electricvehicle dynamic model and powertrain control,” in Proc. Amer. ControlConf., Jun. 4–6, 1997, vol. 1, pp. 684–688.
[14] B. Powell, X. Zhang, R. Baraszu, and P. Bowles, “Computer model for aparallel hybrid electric vehicle (PHEV) with CVT,” in Proc. Amer. ControlConf., Jun. 28–30, 2000, vol. 2, pp. 1011–1015.
[15] S. R. Cikanek, K. E. Bailey, R. C. Baraszu, and B. K. Powell, “Controlsystem and dynamic model validation for a parallel hybrid electric vehi-cle,” in Proc. Amer. Control Conf., Jun. 2–4, 1999, vol. 2, pp. 1222–1227.
[16] J. A. MacBain, J. J. Conover, and A. D. Brooker, “Full-vehicle simulationfor series hybrid vehicles,” presented at the SAE Tech. Paper, FutureTransportation Technology Conf., Costa Mesa, CA, Jun. 2003, Paper2003-01-2301.
[17] X. He and J. Hodgson, “Hybrid electric vehicle simulation and evaluationfor UT-HEV,” presented at the SAE Tech. Paper Series, Future Trans-portation Technology Conf., Costa Mesa, CA, Aug. 2000, Paper 2000-01-3105.
[18] K. E. Bailey and B. K. Powell, “A hybrid electric vehicle powertraindynamic model,” in Proc. Amer. Control Conf., Jun. 21–23, 1995, vol. 3,pp. 1677–1682.
[19] B. K. Powell, K. E. Bailey, and S. R. Cikanek, “Dynamic modeling andcontrol of hybrid electric vehicle powertrain systems,” IEEE Control Syst.Mag., vol. 18, no. 5, pp. 17–33, Oct. 1998.
[20] K. L. Butler, M. Ehsani, and P. Kamath, “A Matlab-based modeling andsimulation package for electric and hybrid electric vehicle design,” IEEETrans. Veh. Technol., vol. 48, no. 6, pp. 1770–1778, Nov. 1999.
[21] K. B. Wipke, M. R. Cuddy, and S. D. Burch, “ADVISOR 2.1: Auser-friendly advanced powertrain simulation using a combined back-ward/forward approach,” IEEE Trans. Veh. Technol., vol. 48, no. 6,pp. 1751–1761, Nov. 1999.
[22] T. Markel and K. Wipke, “Modeling grid-connected hybrid electric vehi-cles using ADVISOR,” in Proc. 16th Annu. Battery Conf. Appl. and Adv.,Jan. 9–12, 2001, pp. 23–29.
[23] S. M. Lukic and A. Emadi, “Effects of drivetrain hybridization on fueleconomy and dynamic performance of parallel hybrid electric vehicles,”IEEE Trans. Veh. Technol., vol. 53, no. 2, pp. 385–389, Mar. 2004.
[24] A. Emadi and S. Onoda, “PSIM-based modeling of automotive power sys-tems: Conventional, electric, and hybrid electric vehicles,” IEEE Trans.Veh. Technol., vol. 53, no. 2, pp. 390–400, Mar. 2004.
[25] J. M. Tyrus, R. M. Long, M. Kramskaya, Y. Fertman, and A. Emadi,“Hybrid electric sport utility vehicles,” IEEE Trans. Veh. Technol., vol. 53,no. 5, pp. 1607–1622, Sep. 2004.
[26] M. Schulz, “Circulating mechanical power in a power-split hybrid electricvehicle transmission,” Proc. Instrum. Mech. Eng.—Part D J. Automob.Eng., vol. 218, no. 12, pp. 1419–1425, Dec. 2004.
[27] G. Y. Liao, T. R. Weber, and D. P. Pfaff, “Modelling and analysisof powertrain hybridization on all-wheel-drive sport utility vehicles,”Proc. Instrum. Mech. Eng.—Part D J. Automob. Eng., vol. 218, no. 10,pp. 1125–1134, Oct. 2004.
[28] D. Zhang, J. Chen, T. Hsieh, J. Rancourt, and M. R. Schmidt, “Dynamicmodelling and simulation of two-mode electric variable transmission,”Proc. Instrum. Mech. Eng.—Part D J. Automob. Eng., vol. 215, no. 11,pp. 1217–1223, Nov. 2001.
[29] S. R. Cikanek and K. E. Bailey, “Regenerative braking system for a hybridelectric vehicle,” in Proc. Amer. Control Conf., May 8–10, 2002, vol. 4,pp. 3129–3134.
[30] L. U. Gokdere, K. Benlyazid, E. Santi, C. W. Brice, and R. A. Dougal,“Hybrid electric vehicle with permanent magnet traction motor: A simu-lation model,” in Proc. Int. Conf. IEMD, May 9–12, 1999, pp. 502–504.
[31] S. M. Lukic and A. Emado, “Modeling of electric machines for auto-motive applications using efficiency maps,” in Proc. Elect. Insul. Conf.and Elect. Manuf. Coil Winding Technol. Conf., Sep. 23–25, 2003,pp. 543–550.
[32] C. Shukang, P. Yulong, C. Feng, and C. Shumei, “The torque pulsa-tion analysis of a starter generator with concentrated windings basedhybrid electric vehicles,” in Proc. IEEE IEMDC, Jun. 1–4, 2003, vol. 1,pp. 218–221.
[33] E. Hansen, L. Wilhelm, N. Karditsas, I. Menjak, D. Corrigan, S. Dhar, andS. Ovshinsky, “Full system nickel-metal hydride battery packs for hybridelectric vehicle applications,” in Proc. 17th Annu. Battery Conf. Appl. andAdv., Jan. 15–18, 2002, pp. 253–260.
[34] X. He, “Battery modeling for HEV simulation model development,”presented at the SAE Tech. Paper Series, World Congr., Detroit, MI,Mar. 2001, Paper 2001-01-0960.
[35] X. He and J. W. Hodgson, “Modeling and simulation for hybrid electricvehicles—I: Modeling,” IEEE Trans. Intell. Transp. Syst., vol. 3, no. 4,pp. 235–243, Dec. 2002.
SYED et al.: DERIVATION AND EXPERIMENTAL VALIDATION OF A POWER-SPLIT HEV MODEL 1747
[36] ——, “Modeling and simulation for hybrid electric vehicles—II: Sim-ulation,” IEEE Trans. Intell. Transp. Syst., vol. 3, no. 4, pp. 244–251,Dec. 2002.
[37] A. C. Baisden and A. Emadi, “ADVISOR-based model of a battery andan ultra-capacitor energy source for hybrid electric vehicles,” IEEE Trans.Veh. Technol., vol. 53, no. 1, pp. 199–205, Jan. 2004.
[38] M. Ehsani, K. M. Rahman, and H. A. Toliyat, “Propulsion system designof electric and hybrid vehicles,” IEEE Trans. Ind. Electron., vol. 44, no. 1,pp. 19–27, Feb. 1997.
[39] Y. Yang, M. Parten, J. Berg, and T. Maxwell, “Modeling and control of ahybrid electric vehicle,” in Proc. 52nd IEEE VTS—Fall VTC, Sep. 24–28,2000, vol. 5, pp. 2095–2100.
[40] J. Van Mierlo and G. Maggetto, “Vehicle simulation program: A toolto evaluate hybrid power management strategies based on an innovativeiteration algorithm,” Proc. Instrum. Mech. Eng.—Part D J. Automob. Eng.,vol. 215, no. 9, pp. 1043–1052, Sep. 2001.
[41] ——, “Innovative iteration algorithm for a vehicle simulation program,”IEEE Trans. Veh. Technol., vol. 53, no. 2, pp. 401–412, Mar. 2004.
Fazal U. Syed received the B.S. degree in elec-trical engineering from the Technical University ofBudapest, Budapest, Hungary, in 1992 and the M.S.degree in electrical engineering from Wayne StateUniversity, Detroit, MI, in 1995, where he is cur-rently working toward the Ph.D. degree.
He joined Servotech Engineering in 1995 andworked on various vehicle, engine, electrical, andelectronic control design projects. He joined FordMotor Company’s Hybrid Electric Vehicle Programas a Lead Design Engineer in September 2002. He
has published technical papers in various conferences. He is the holder ofvarious U.S./European patents and patent pending in the area of diesel andhybrid electric vehicle controls.
Mr. Syed received the 2005 Henry Ford Technology Award, which is thehighest technical achievement recognition and most prestigious award in theFord Motor Company, for his work related to development of the hybrid electricvehicle control system.
Ming L. Kuang received the M.S. degree in mechan-ical engineering from the University of California,Davis, in 1991.
He joined Ford Motor Company’s Electric Ve-hicle Programs as a Control System Engineer inApril 1991, where he was responsible for electricvehicle (EV) and hybrid EV (HEV) system/powertrain control development. In 1995, he joined FordResearch Laboratory as a Research Engineer, con-ducting research on traction control, antilock brakes,and interactive vehicle dynamics (IVD) or vehicle
stability control. In 2000, he joined a production HEV program as an HEVControl Technical Expert, leading the vehicle control system development andimplementation for hybrid vehicle programs. He has published numerous tech-nical papers in ASME, ACC, AVEC, International Electric Vehicle Symposium,and International Modelica Conferences. He is the holder of 29 U.S./Europeanpatents and has a patent pending in the area of IVD and EV/HEV controls.
Mr. Kuang received the 2005 Henry Ford Technology Award, which is thehighest technical achievement recognition and most prestigious award in theFord Motor Company.
John Czubay (M’92–S’97–M’98) received the M.S.degree in control systems from Wayne State Univer-sity, Detroit, MI, in 1997.
He is a Research Engineer with the Research andInnovation Center, Ford Motor Company, Dearborn,MI. His research focuses on the development ofadvanced control algorithms for new power traintechnologies to continually reduce the impact thatautomobiles have on the environment. His interestsinclude the application of control theory to hybridelectric and clean-diesel-powered vehicles. His work
includes the use of simulation and rapid prototyping for the rapid and robustdevelopment of real-time control algorithms for embedded controllers.
Mr. Czubay is a member of the Society of Automotive Engineers.
Hao Ying (S’88–M’90–SM’97) received the B.S.and M.S. degrees in electrical engineering fromDonghua University (formerly China Textile Uni-versity), Shanghai, China, in 1982 and 1984,respectively, and the Ph.D. degree in biomedicalengineering from the University of Alabama atBirmingham in 1990.
He is a Professor with the Department of Electricaland Computer Engineering and a Full Member ofthe Barbara Ann Karmanos Cancer Institute, WayneState University, Detroit, MI. He was in the faculty
of the University of Texas Medical Branch at Galveston between 1992 and2000. He was an Adjunct Associate Professor with the Biomedical EngineeringProgram, University of Texas at Austin, between 1998 and 2000. He haspublished one research monograph/advanced textbook entitled Fuzzy Controland Modeling: Analytical Foundations and Applications (New York: IEEEPress, 2000), 72 peer-reviewed journal papers, and 102 conference papers.He is an Associate Editor of four international journals (International Journalof Fuzzy Systems, International Journal of Approximate Reasoning, Journalof Intelligent and Fuzzy Systems, and Dynamics of Continuous, Discrete &Impulsive Systems—Series B: Applications and Algorithms). He has been aGuest Editor for several journals. He was invited to serve as a Reviewer formore than 50 international journals, which are in addition to major internationalconferences and book publishers.
Prof. Ying is an elected Board Member of the North American FuzzyInformation Processing Society (NAFIPS). He served as the Program Chair forthe 2005 NAFIPS Conference as well as for the International Joint Conferenceof NAFIPS Conference, the Industrial Fuzzy Control and Intelligent SystemConference, and the NASA Joint Technology Workshop on Neural Networksand Fuzzy Logic held in 1994. He served as the Publication Chair for the2000 IEEE International Conference on Fuzzy Systems and as a ProgramCommittee Member for over 20 international conferences.