desario the roleofrapidcycle.ppt - neha cert online...
TRANSCRIPT

FS1201
NEHA 2012 AEC – June 2012 1
USING QUALITY IMPROVEMENT TOOLS TO DECREASE CRITICAL RISK FACTOR
VIOLATIONS IN RESTAURANTS
By Paul DeSario, MPH, RS
Cuyahoga County Board of Health
THERE WERE 3 IMPORTANT STEPS TO THIS PROCESS
1. Identify the weaknesses in the program2. Identify what is needed for improvement3. Identify effectiveness of the improvement
IDENTIFYING WEAKNESS
FS1201
NEHA 2012 AEC – June 2012 2
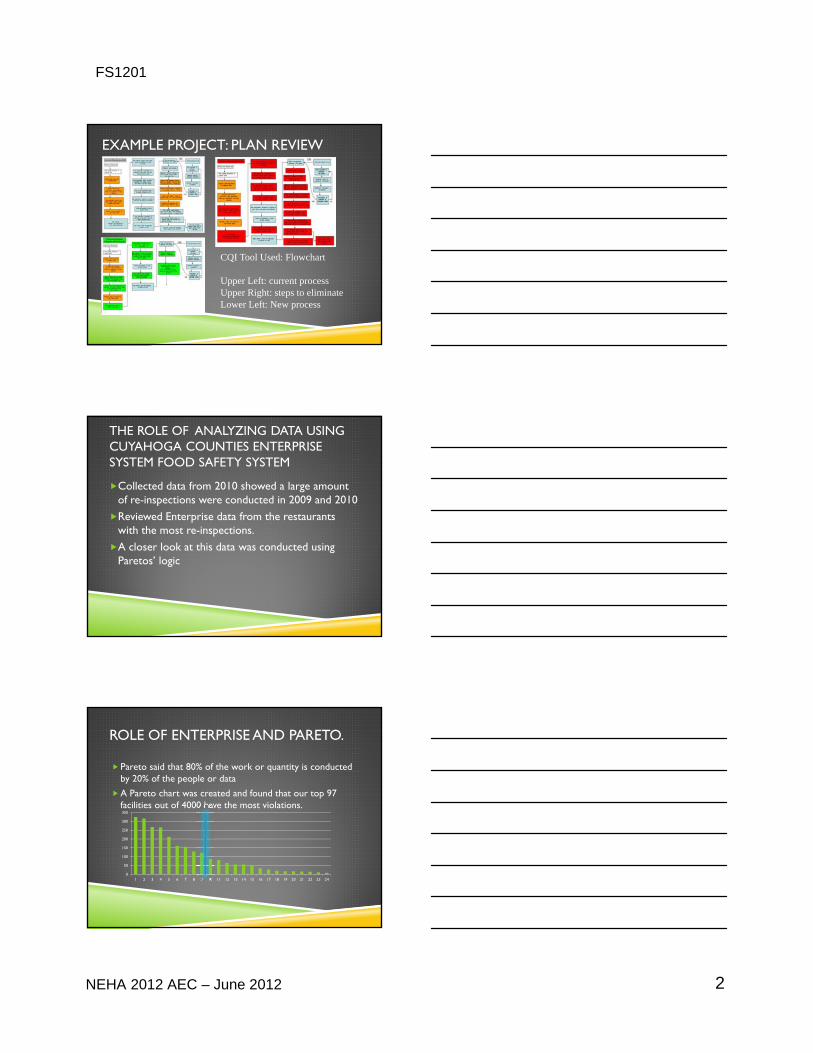
EXAMPLE PROJECT: PLAN REVIEW
CQI Tool Used: Flowchart
Upper Left: current processUpper Right: steps to eliminateLower Left: New process
THE ROLE OF ANALYZING DATA USING CUYAHOGA COUNTIES ENTERPRISE SYSTEM FOOD SAFETY SYSTEM
Collected data from 2010 showed a large amount of re-inspections were conducted in 2009 and 2010
Reviewed Enterprise data from the restaurants with the most re-inspections.
A closer look at this data was conducted using Paretos’ logic
ROLE OF ENTERPRISE AND PARETO.
Pareto said that 80% of the work or quantity is conducted by 20% of the people or data
A Pareto chart was created and found that our top 97 facilities out of 4000 have the most violations.
0
50
100
150
200
250
300
350
1 2 3 4 5 6 7 8 9 10 11 12 13 14 15 16 17 18 19 20 21 22 23 24

FS1201
NEHA 2012 AEC – June 2012 3
RECURRENT VIOLATIONS IDENTIFIED AS THE TARGET
Next step assemble a team and create some ground rules and a timeline because we received a grant from The Ohio Voluntary Accreditation Team.Tom Blackford
Brian Athey
Jim ArmstrongLavonne Lee
WHAT IS NEEDED FOR IMPROVEMENT?
QUALITY IMPROVEMENT TOOLSTEAM CHARTER
FS1201
NEHA 2012 AEC – June 2012 4
STORYBOARD
Risk factors identified
Conduct Inspection or re-inspection
yes
no
Review inspection with PIC and leave
Immediately corrected ?
yes
no
Using your professional judgment, are their enough factors to increase risk of illness?
no
yes
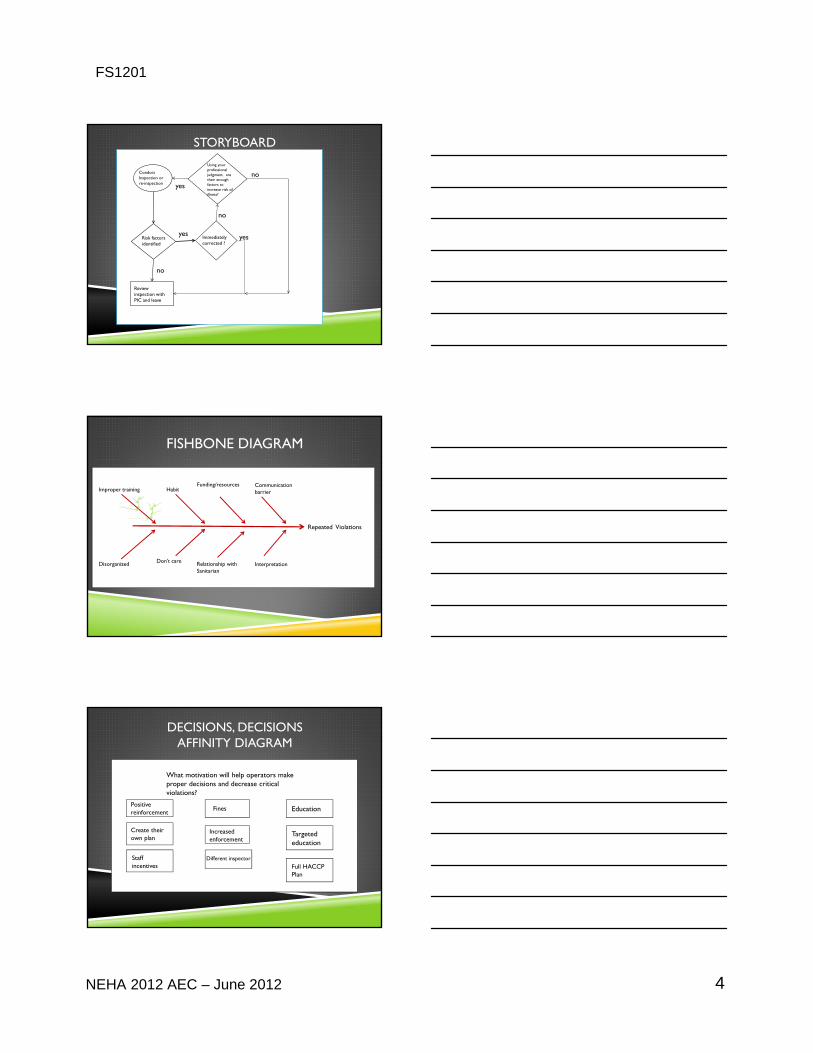
FISHBONE DIAGRAM
Repeated Violations
Improper training
Disorganized
Habit
Don’t care
Funding/resources
Relationship with Sanitarian
Communication barrier
Interpretation
DECISIONS, DECISIONSAFFINITY DIAGRAM
What motivation will help operators make proper decisions and decrease critical violations?
Positive reinforcement
Create their own plan
educationStaff incentives
Fines
Increased enforcement
Education
Targeted education
Different inspector
Full HACCP Plan

FS1201
NEHA 2012 AEC – June 2012 5
WHICH ONE DO WE CHOOSE?PRIORITIZATION MATRICES
Name Positive reinforcement
Create plan
Staff incentives
Fines Increased enforcement
Different inspector
Education Targeted education
Paul 10 100 1 1 1 100 10 100
Tom 1 10 1 1 1 10 10 100
Lavonne 100 10 100 10 10 100 1 10
Brian 1 10 1 100 100 100 1 1
Jim 10 100 1 1 1 10 1 100
Rick 1 100 10 1 10 100 10 100
123 330 114 114 123 420 33 411
RISK CONTROL PLAN
A written plan to reduce Foodborne Illness
1. Identify Critical Risk Factors & Corrective Actions
2. Create Risk Control Plan: Identify controls, Person(s) responsible, Record keeping, Training plan
3. Operator and staff sign-on to Risk Control Plan after review
4. Follow–up to ensure Risk Control Plan is utilized
TARGETED EDUCATION
Review history of their Inspections and create in house training based on their violations.
More in depth than a general In-ServiceGreat response from workers and managers
Future may mix this into the Risk Control PlanWE DID!!

FS1201
NEHA 2012 AEC – June 2012 6
RAPID CYCLE PROCESS
CREATING THE RAPID CYCLE PROJECT USING A GANTT CHART
Interventions created for measurementHACCP plan
Targeted Education
Risk Control Plan
Incentives
Limitations Time
Complexity
Power
STUDY DESIGN
3 groups pre and post intervention measurement
Rapid Cycle Improvement
Targeted Education Group
Risk Control Plan
Control
Chose top 100 facilities (Pareto Chart)
A single blind study
After the interventions, the re-inspecting sans were not be told which facilities were in the treatment group or control group.

FS1201
NEHA 2012 AEC – June 2012 7
WHAT WILL THIS DO FOR THE PROGRAM?
If found effective we will change the SOP’s in food to include either or both interventions.
If not?Back to the drawing board and explore those
interventions we ruled out initially
Thomas Edison
“I didn’t fail, I found 10,000
ways not to do it”!
RESULTS FROM RAPID CYCLE IMPROVEMENT STUDY
WHAT DID WE LEARN?
FS1201
NEHA 2012 AEC – June 2012 8
OVERALL…
Control Group
5% observed violation decrease
Targeted Education Group
33% decrease
Risk Control Plan Group
48% decrease
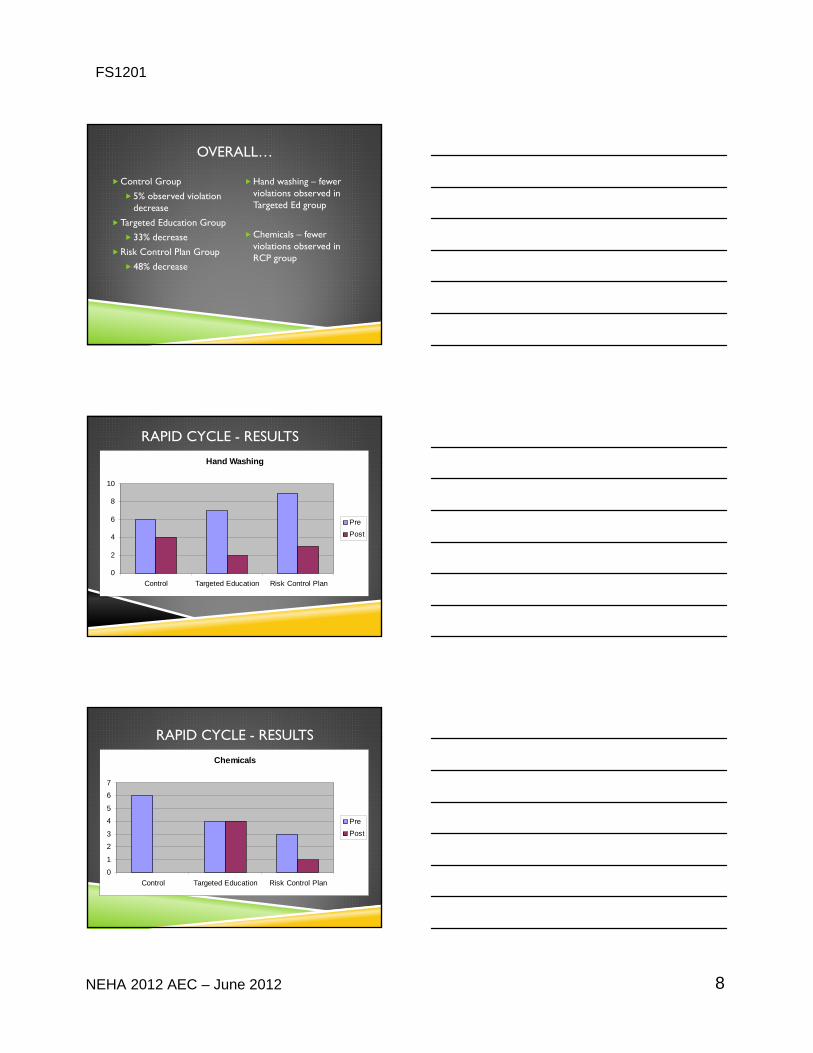
Hand washing – fewer violations observed in Targeted Ed group
Chemicals – fewer violations observed in RCP group
RAPID CYCLE - RESULTS
Hand Washing
0
2
4
6
8
10
Control Targeted Education Risk Control Plan
Pre
Post
RAPID CYCLE - RESULTS
Chemicals
0
1
2
3
4
5
6
7
Control Targeted Education Risk Control Plan
Pre
Post

FS1201
NEHA 2012 AEC – June 2012 9
RAPID CYCLE - RESULTS
Equipment
0
10
20
30
40
50
60
70
Control Targeted Education Risk Control Plan
Pre
Post
RAPID CYCLE - RESULTS
Food
0
10
20
30
40
50
60
70
80
Control Targeted Education Risk Control Plan
Pre
Post
SIGNIFICANCERisk Control Plan
The 48% decrease was calculated to have a p value of .08
The sample was not large enough to have the power that it needed. To have statistical power, I needed at least 100 facilities per group and not the study size.
Targeted education
The 33% decrease had a p value of .11
Although the statistics were not perfect they were strong enough to make a change to our system and create the enforcement group.
This will be the goal for the enforcement team.

FS1201
NEHA 2012 AEC – June 2012 10
LOOKING AT THE DATA
Data showed we needed to make a changeMany re-inspections did not show risk factor
improvementIf we are spending time at the facilities, we need to
show that that time was useful not wastedWe were operating under the definition of
“insanity”THIS HAS TO CHANGE
HOW DO WE CAPITALIZE ON THESE RESULTS?
SOP’s for the Targeted Education Plan and Risk Control Plan
TARGETED EDUCATION: STANDARD OPERATING PROCEDURE
Conduct file review – assess Critical Risk Factor’s (CRF)
Utilize Targeted Ed documentTailor info according to CRF’s observed
Address critical violations with staff and management
Kitchen walk-through showing what/how to correct the risky practices

FS1201
NEHA 2012 AEC – June 2012 11
RISK CONTROL PLAN: SOP
Conduct file review – assess CRF’s Fill out CRF Identified with PIC
Observation, Uncontrolled Process, Hazard, Critical Limits, Corrective Action
Risk Control SectionWhat needs controlled, how controlled, who is
responsible, records, and trainingPIC signs. Staff is to sign by follow-up dateCorrections made and RCP to be followed or bring in for a
hearing
CONCLUSIONWhat did this teach us?
THE CQI PROCESS:THIS IS HOW WE APPLIED CQI PRINCIPLES TO THE FOOD PROGRAM
Establish a FrameworkWhat do we want to do?
What do we want changed?
What is the current process?
How do we want to do it instead?
How much do we want to change?
Will there be data to support the change?
Does this change have any relevancy to agency goals?

FS1201
NEHA 2012 AEC – June 2012 12
WHAT’S NEXT IN THE CONTINUOUS QUALITY PLANNING PROCESS:
What will be measured?
Violations per restaurant
Violations per type of restaurantViolation number by sanitarian
Violation type by sanitarian
Facilities with food safety trainingType of training in facilities
DEMMING STATED
,
“It is not necessary to change, survival is not mandatory”