describe the graphs below as linear, non-linear, increasing decreasing
TRANSCRIPT

INTERPRETING GRAPHS
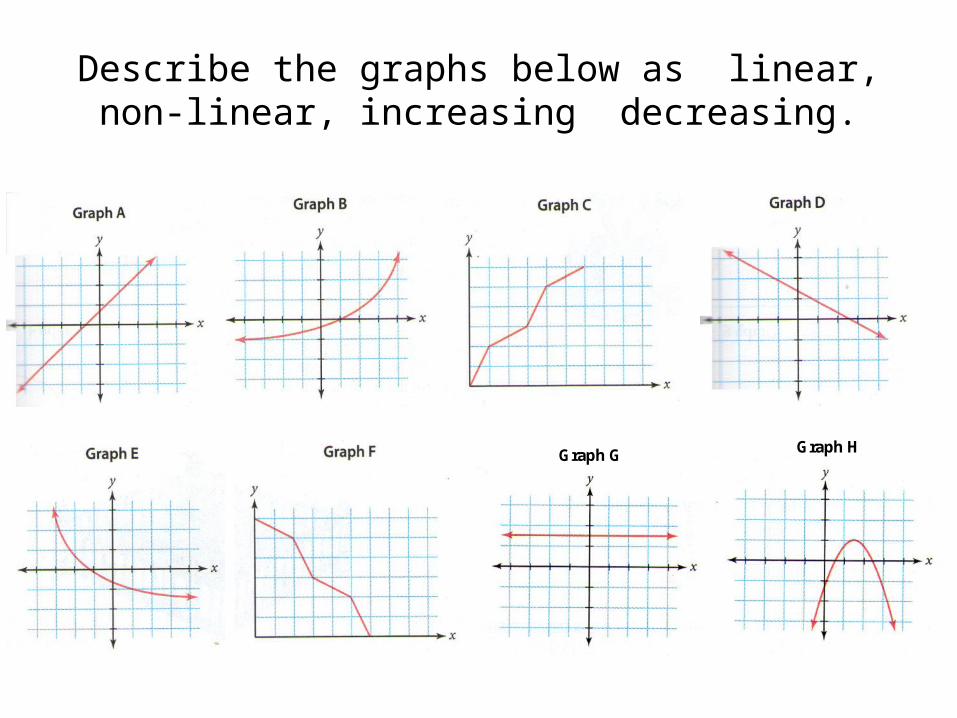
Describe the graphs below as linear, non-linear, increasing decreasing.
Graph G Graph H
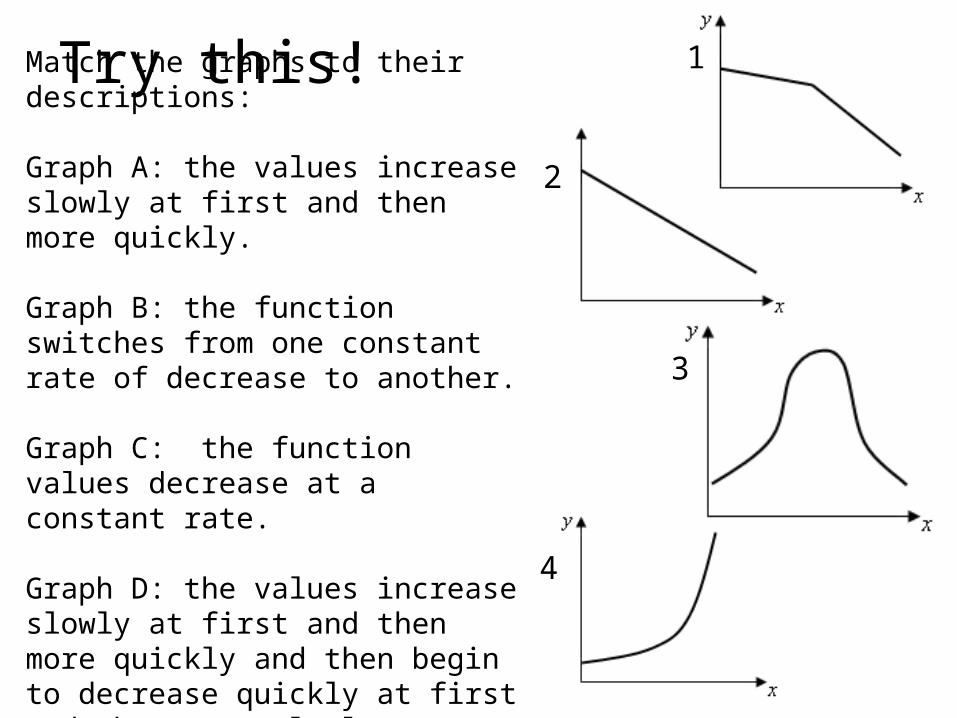
Try this!Match the graphs to their descriptions:
Graph A: the values increase slowly at first and then more quickly.
Graph B: the function switches from one constant rate of decrease to another.
Graph C: the function values decrease at a constant rate.
Graph D: the values increase slowly at first and then more quickly and then begin to decrease quickly at first and then more slowly.
1
2
3
4
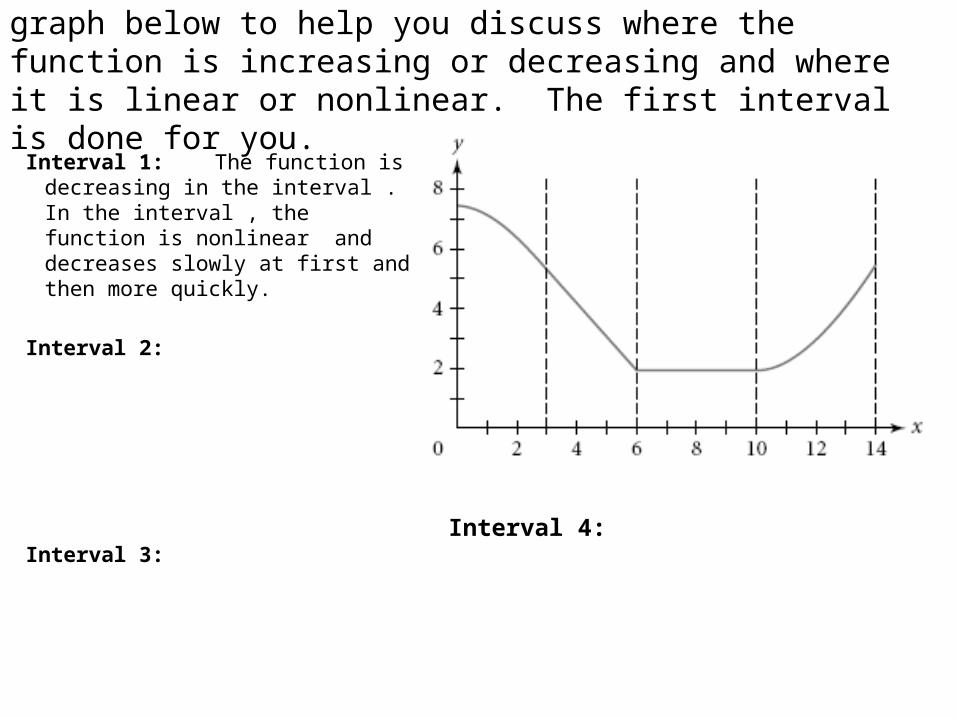
Use the intervals marked on the x-axis in the graph below to help you discuss where the function is increasing or decreasing and where it is linear or nonlinear. The first interval is done for you.
Interval 1: The function is decreasing in the interval . In the interval , the function is nonlinear and decreases slowly at first and then more quickly.
Interval 2: Interval 3:
Interval 4:
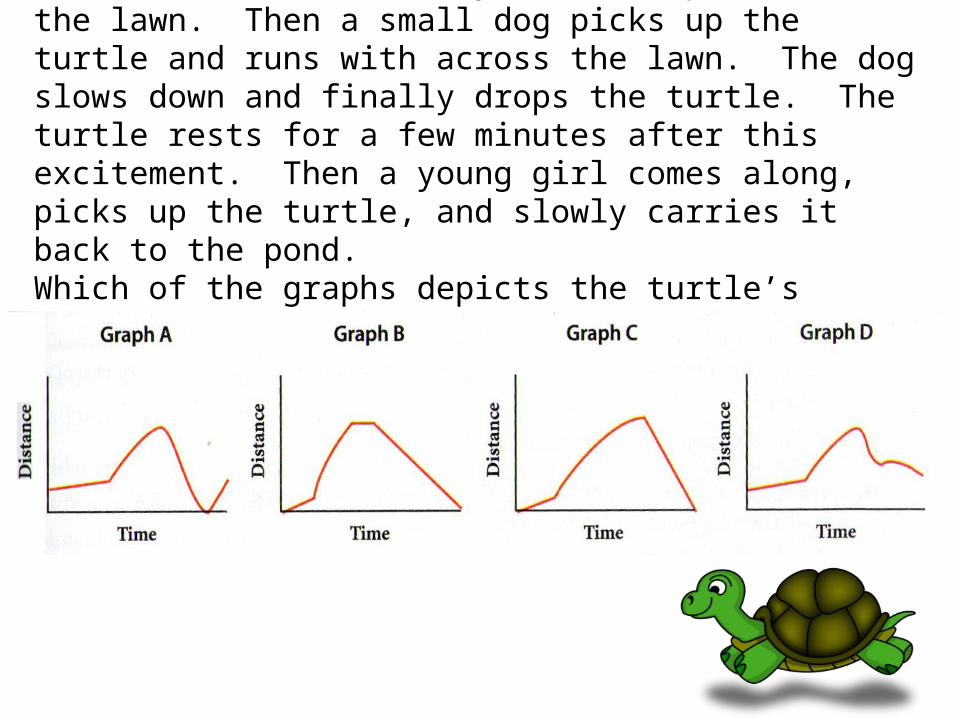
A turtle crawls steadily from its pond across the lawn. Then a small dog picks up the turtle and runs with across the lawn. The dog slows down and finally drops the turtle. The turtle rests for a few minutes after this excitement. Then a young girl comes along, picks up the turtle, and slowly carries it back to the pond. Which of the graphs depicts the turtle’s distance from the pond over time? Explain.
Sketch a Graph: VolleyballBefore a volleyball game starts, the people that can be found in the
school gym are the players, coaches, and the people working the event (ticket takers, officials, scorers, etc.) Slowly the fans arrive for the match. Just before the first game, the people are coming in as fast as the tickets can be sold. After the match is over, most of the parents and fans leave. Then more students arrive for the after-game dance. Most of the students leave after an hour. The people that remain are the ones who have been working at the gym all night long.
Sketch a graph that matches the story. Be sure to label the axes.
Compare and Share!
Is your graph discrete or continuous? Explain why you drew it that way.
Compare your graph to your partner’s graph. How are they alike? How are they different? Are both graphs reasonable?
Rate of ChangeEvery day we deal with quantities expressed as
ratios: miles per gallon of gas, cost per kilowatt of power, miles per hour that a car is travelling.
When working with functions that relate two quantities, we refer to these ratios as rate of change. Rate of change tells us how much one quantity is changing with respect to another quantity.
Example: A speed of 60 mph tells us that a vehicle travels 60 miles for each hour it is driven.
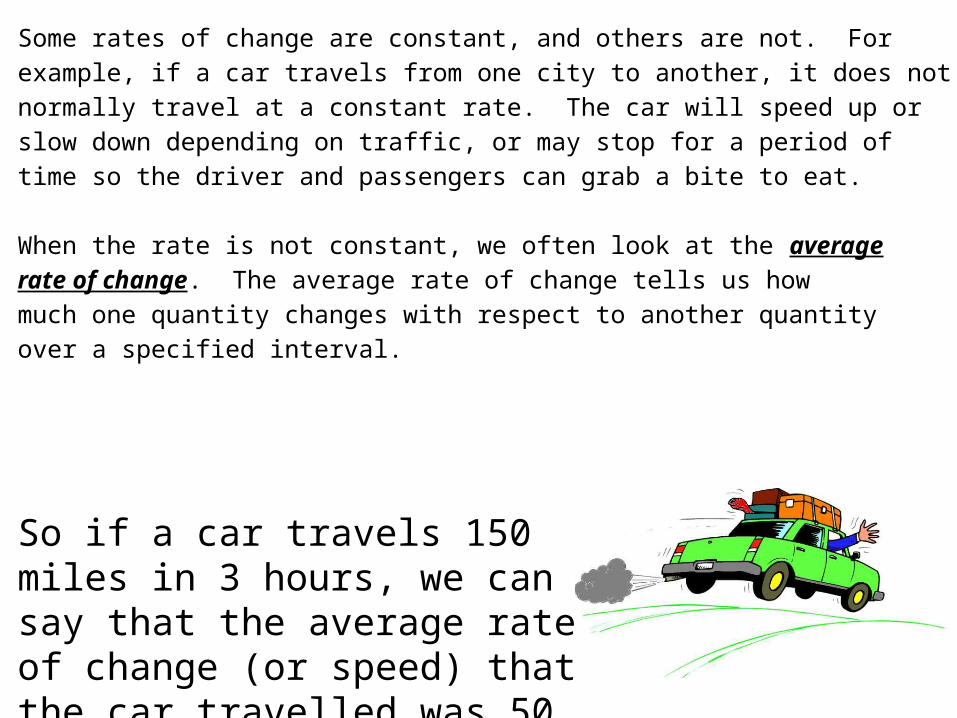
Some rates of change are constant, and others are not. Forexample, if a car travels from one city to another, it does notnormally travel at a constant rate. The car will speed up orslow down depending on traffic, or may stop for a period oftime so the driver and passengers can grab a bite to eat.
When the rate is not constant, we often look at the averagerate of change. The average rate of change tells us howmuch one quantity changes with respect to another quantityover a specified interval.
So if a car travels 150 miles in 3 hours, we can say that the average rate of change (or speed) that the car travelled was 50 miles per hour.
Eureka!This exclamation is most famously attributed to the
ancient Greek scholar Archimedes. He proclaimed "Eureka!" when he stepped into a bath and noticed that the water level rose—he suddenly understood that the volume of water displaced must be equal to the volume of the part of his body he had submerged. He then realized that the volume of irregular objects could be measured with precision, a previously unsolvable problem. He was so eager to share his discovery that he leapt out of his bathtub and ran through the streets of Syracuse naked.
Archimedes' insight led to the solution of a problem posed by Hiero of Syracuse on how to assess the purity of an irregular golden crown; he had given his goldsmith the pure gold to be used, and correctly suspected that the goldsmith had removed gold and adding the same weight of silver. Equipmentfor weighing objects already existed, and now thatArchimedes could also measure volume, their ratiowould give the object's density, an important indicatorof purity.
http://www.mathsonline.co.uk/nonmembers/gamesroom/sims/archi/archi4.html

Investigation: Average Rate of ChangeThe height, in feet, of a ball thrown into the air is modeled by theFunction , where the time, t, is measured inseconds. Fill in the table below and sketch a graph of the function on the grid provided by connecting the points with a smooth curve. t h(t)
0
1
2
3
4
5
6
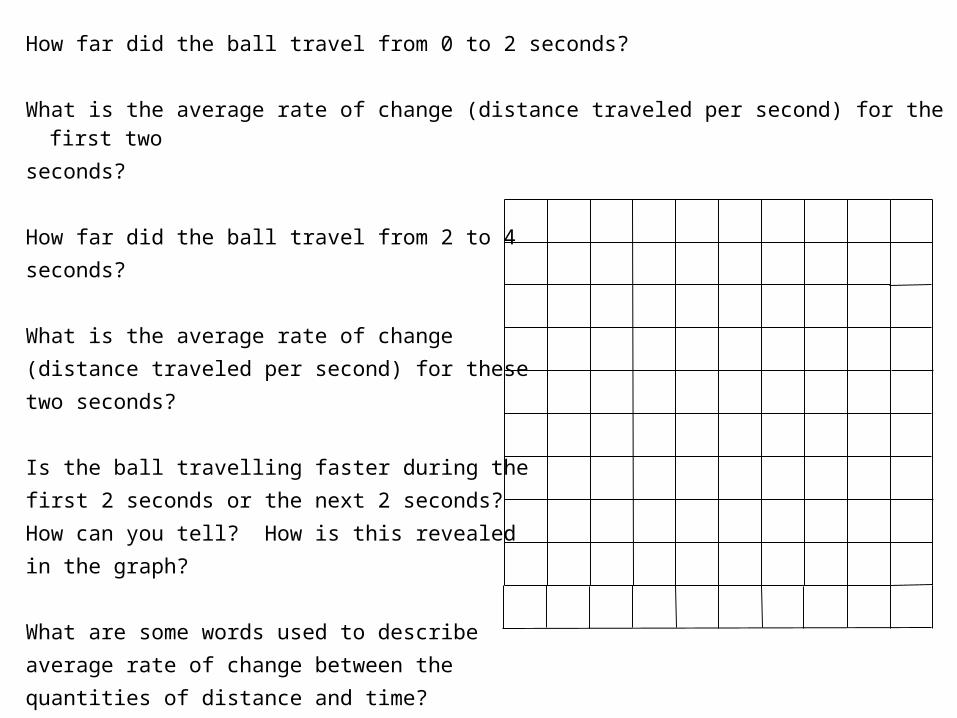
How far did the ball travel from 0 to 2 seconds? What is the average rate of change (distance traveled per second) for the first twoseconds? How far did the ball travel from 2 to 4 seconds? What is the average rate of change (distance traveled per second) for these two seconds? Is the ball travelling faster during the first 2 seconds or the next 2 seconds? How can you tell? How is this revealed in the graph? What are some words used to describe average rate of change between the quantities of distance and time?