describing quantitative data numerically
DESCRIPTION
Describing Quantitative Data Numerically. Symmetric Distributions Mean, Variance, and Standard Deviation. Symmetric Distributions. Describing a “typical” value for a set of data when the distribution is at least approximately symmetric allows us to choose our measure of center: - PowerPoint PPT PresentationTRANSCRIPT
Describing Describing Quantitative Data Quantitative Data
NumericallyNumerically
Symmetric Distributions
Mean, Variance, and
Standard Deviation
Symmetric DistributionsSymmetric Distributions
Describing a “typical” value for a set Describing a “typical” value for a set of data when the distribution is at of data when the distribution is at least approximately symmetric least approximately symmetric allows us to choose our measure of allows us to choose our measure of center:center:
We can use eitherWe can use either MeanMean MedianMedian
Finding the Mean of a Finding the Mean of a DistributionDistribution
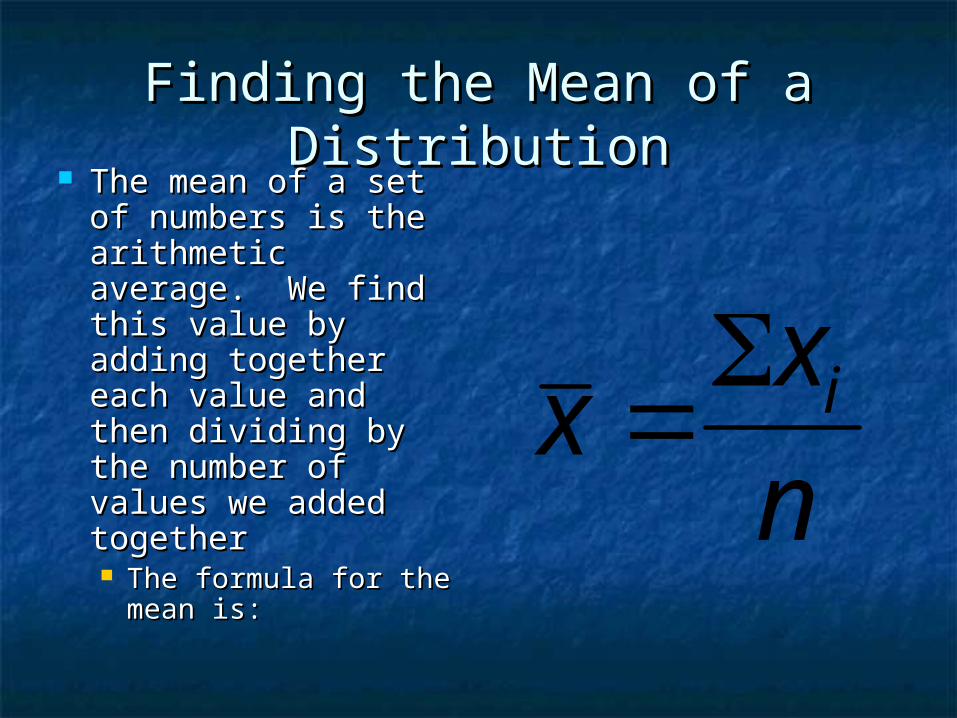
The mean of a set The mean of a set of numbers is the of numbers is the arithmetic average. arithmetic average. We find this value We find this value by adding together by adding together each value and each value and then dividing by then dividing by the number of the number of values we added values we added togethertogether The formula for the The formula for the
mean is:mean is:
n
xx i
Let’s see the Formula in Let’s see the Formula in ActionAction
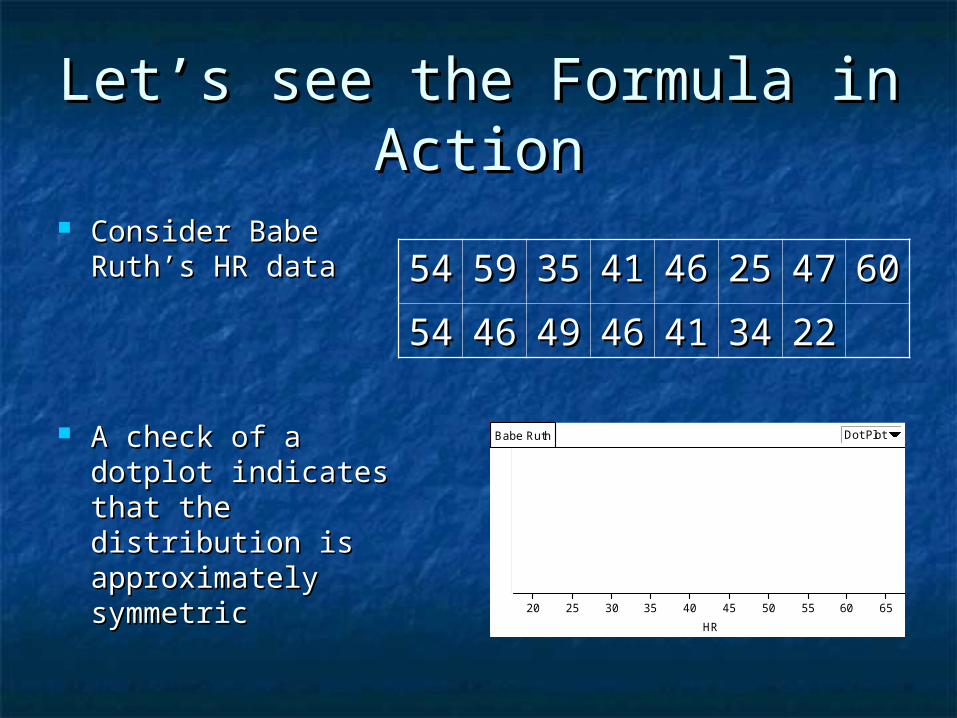
Consider Babe Consider Babe Ruth’s HR dataRuth’s HR data
A check of a A check of a dotplot indicates dotplot indicates that the that the distribution is distribution is approximately approximately symmetricsymmetric
5544
5599
3355
4411
4466
2255
4477
6600
5544
4466
4499
4466
4411
3344
2222
20 25 30 35 40 45 50 55 60 65HR
Babe Ruth Dot Plot
n
xx i
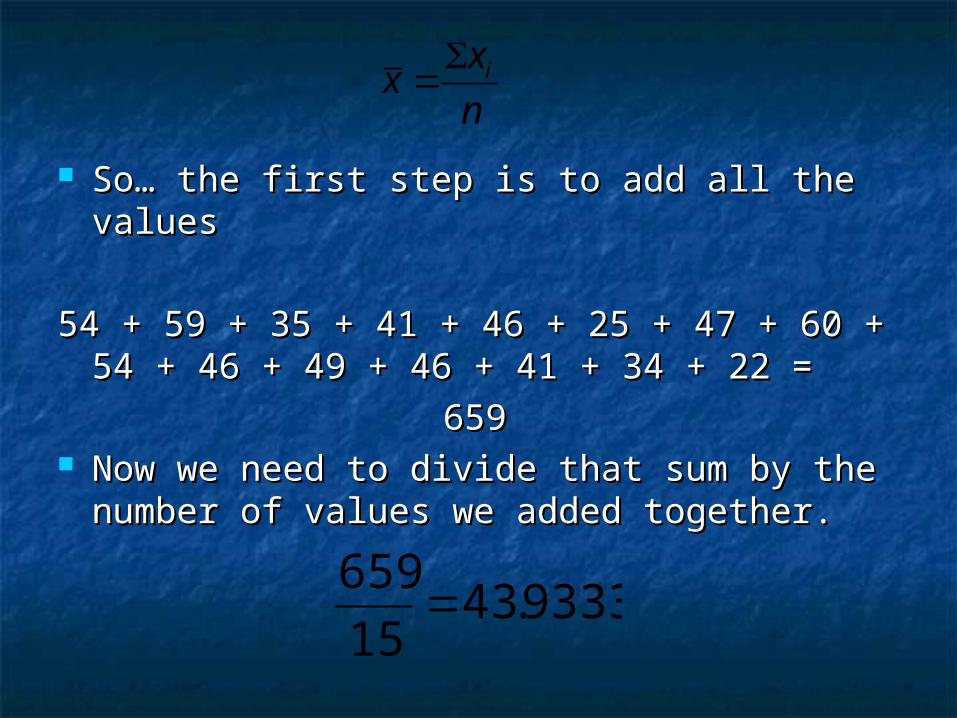
So… the first step is to add all the valuesSo… the first step is to add all the values
54 + 59 + 35 + 41 + 46 + 25 + 47 + 60 + 54 + 59 + 35 + 41 + 46 + 25 + 47 + 60 + 54 + 46 + 49 + 46 + 41 + 34 + 22 =54 + 46 + 49 + 46 + 41 + 34 + 22 =
659659 Now we need to divide that sum by the Now we need to divide that sum by the
number of values we added together.number of values we added together.
9333.4315
659
So the mean of the data is 43.9333. Now, if we So the mean of the data is 43.9333. Now, if we wish to talk about the “typical” number of home wish to talk about the “typical” number of home runs for Babe Ruth (and we ALWAYS wish to talk runs for Babe Ruth (and we ALWAYS wish to talk about the context of our data!), we could say about the context of our data!), we could say something like…something like…
On average, Babe Ruth hit approximately 44 home On average, Babe Ruth hit approximately 44 home runs per season during the 15 seasons he runs per season during the 15 seasons he played.played.
Remember that although the center is a Remember that although the center is a very important part of our description, very important part of our description, we also need to look at the spread of the we also need to look at the spread of the distribution.distribution.
When we use the mean as our measure When we use the mean as our measure of center, we use the standard deviation of center, we use the standard deviation as our measure of spread.as our measure of spread.
We can think of standard deviation as We can think of standard deviation as “an average distance of values from the “an average distance of values from the mean”mean”
To calculate the standard deviation by To calculate the standard deviation by hand, we’ll make a data table…hand, we’ll make a data table…
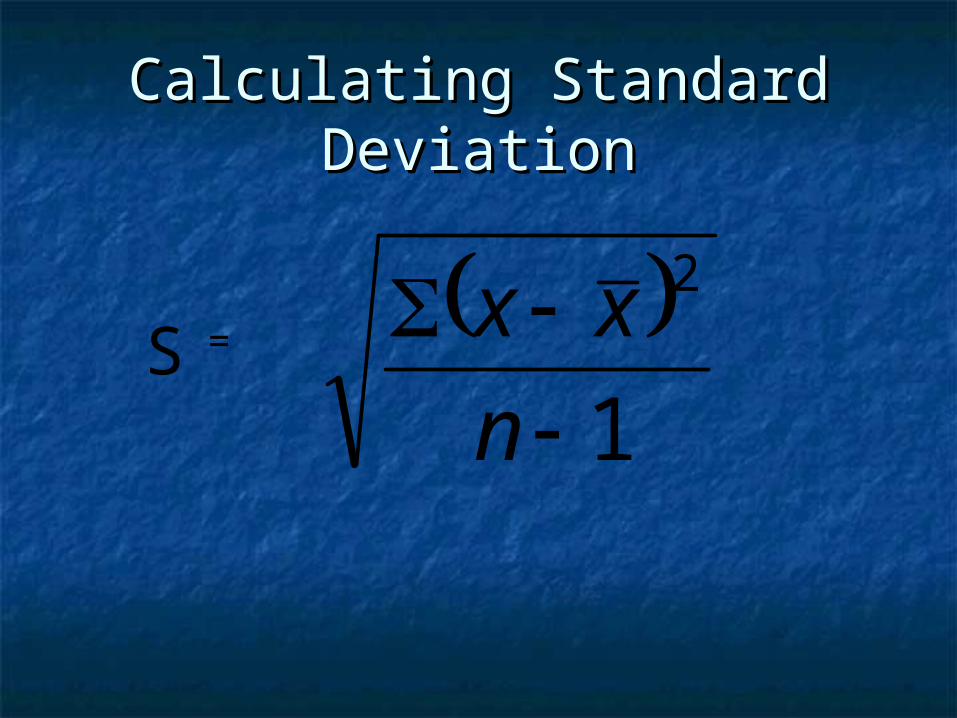
Calculating Standard Calculating Standard DeviationDeviation
1
2
n
xxS =
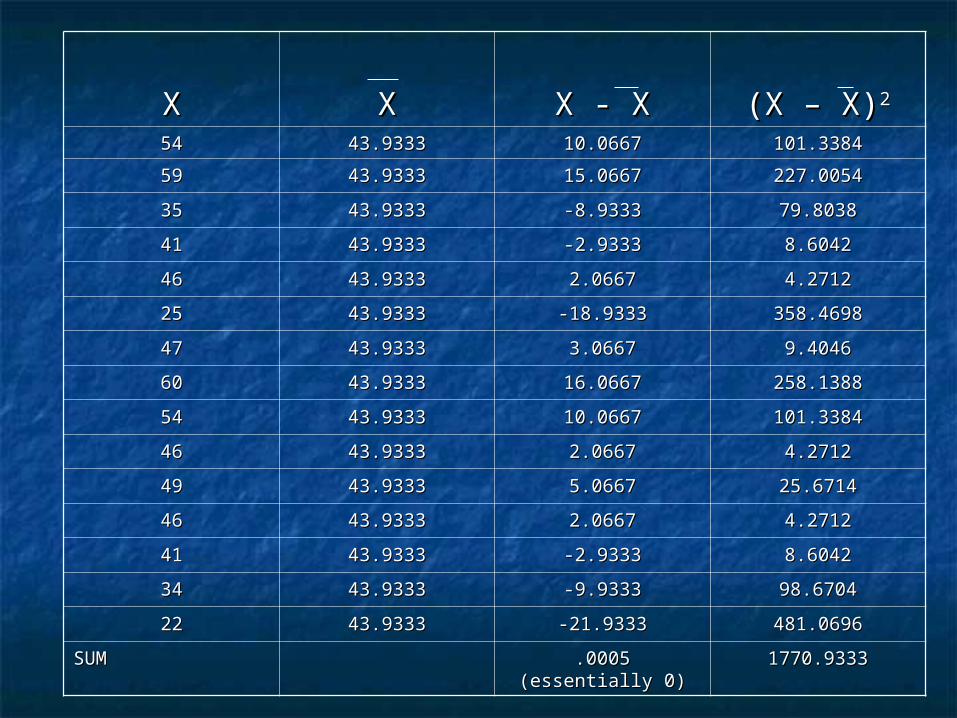
XX XX X - XX - X (X – X)(X – X)22
5454 43.933343.9333 10.066710.0667 101.3384101.3384
5959 43.933343.9333 15.066715.0667 227.0054227.0054
3535 43.933343.9333 -8.9333-8.9333 79.803879.8038
4141 43.933343.9333 -2.9333-2.9333 8.60428.6042
4646 43.933343.9333 2.06672.0667 4.27124.2712
2525 43.933343.9333 -18.9333-18.9333 358.4698358.4698
4747 43.933343.9333 3.06673.0667 9.40469.4046
6060 43.933343.9333 16.066716.0667 258.1388258.1388
5454 43.933343.9333 10.066710.0667 101.3384101.3384
4646 43.933343.9333 2.06672.0667 4.27124.2712
4949 43.933343.9333 5.06675.0667 25.671425.6714
4646 43.933343.9333 2.06672.0667 4.27124.2712
4141 43.933343.9333 -2.9333-2.9333 8.60428.6042
3434 43.933343.9333 -9.9333-9.9333 98.670498.6704
2222 43.933343.9333 -21.9333-21.9333 481.0696481.0696
SUMSUM .0005 (essentially 0).0005 (essentially 0) 1770.93331770.9333
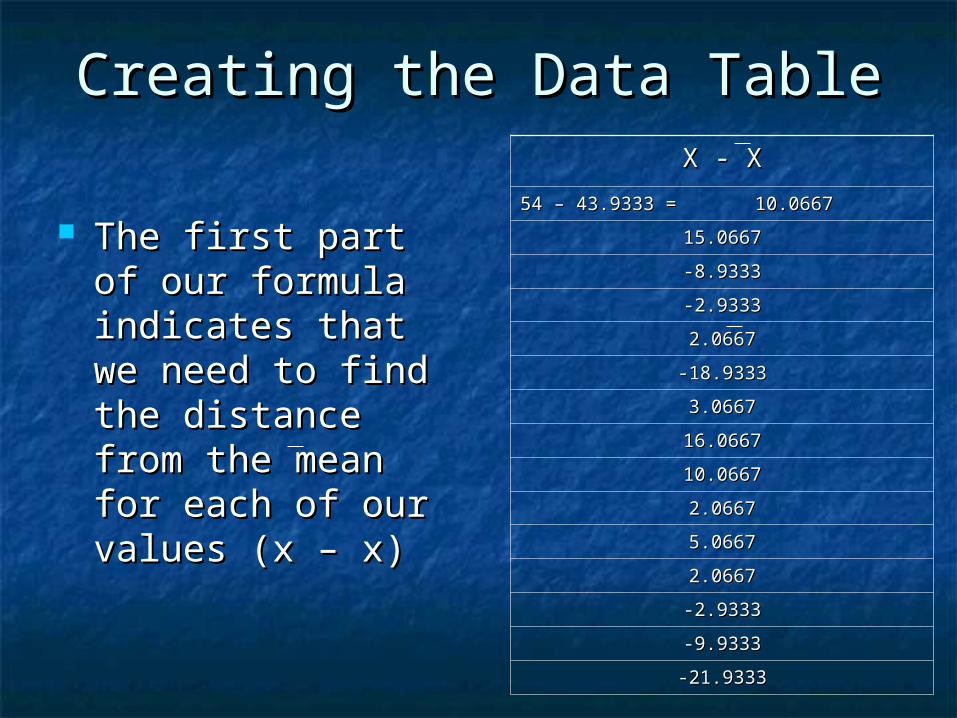
Creating the Data TableCreating the Data Table
The first part of our The first part of our formula indicates formula indicates that we need to that we need to find the distance find the distance from the mean for from the mean for each of our values each of our values (x – x)(x – x)
X - XX - X
54 – 43.9333 = 10.066754 – 43.9333 = 10.0667
15.066715.0667
-8.9333-8.9333
-2.9333-2.9333
2.06672.0667
-18.9333-18.9333
3.06673.0667
16.066716.0667
10.066710.0667
2.06672.0667
5.06675.0667
2.06672.0667
-2.9333-2.9333
-9.9333-9.9333
-21.9333-21.9333
Now that we know the individual distances Now that we know the individual distances for each value, we want to find an for each value, we want to find an “average” of those distances.“average” of those distances.
To find an average we have to add all the To find an average we have to add all the values togethervalues together
We find, though, that the sum of those We find, though, that the sum of those values is always zero.values is always zero.
Why? Because some of the values are Why? Because some of the values are above the mean (positive values) and above the mean (positive values) and some are below (negative). The positives some are below (negative). The positives and negatives cancel each other out.and negatives cancel each other out.
So what values can we use to find the So what values can we use to find the “average” distance from the mean for a “average” distance from the mean for a set of values?set of values?
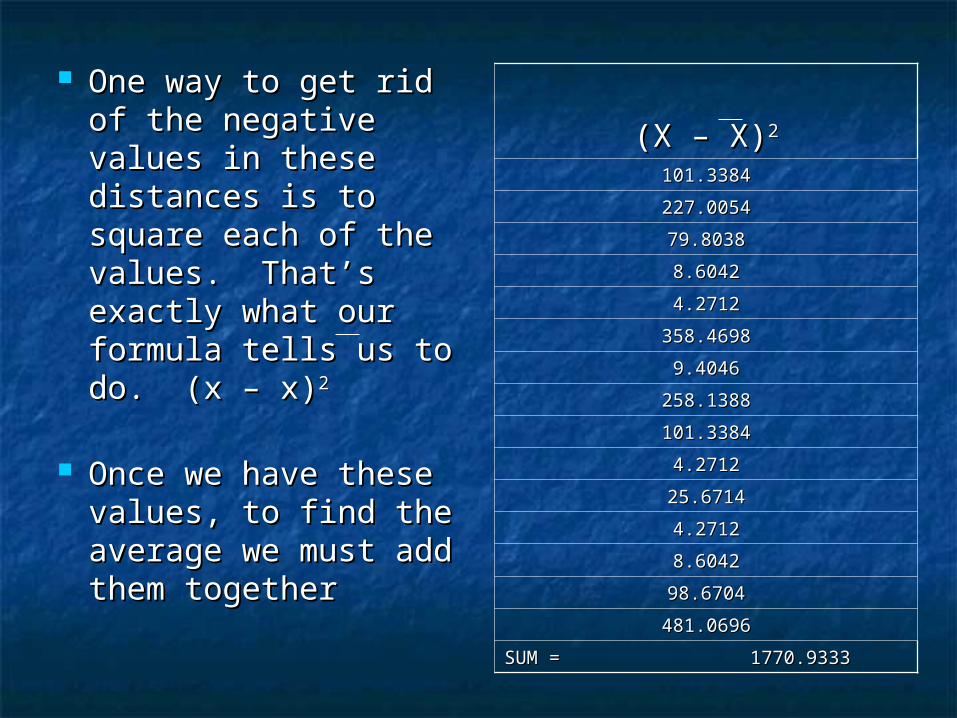
One way to get rid of One way to get rid of the negative values the negative values in these distances is in these distances is to square each of the to square each of the values. That’s values. That’s exactly what our exactly what our formula tells us to formula tells us to do. (x – x)do. (x – x)22
Once we have these Once we have these values, to find the values, to find the average we must average we must add them togetheradd them together
(X – X)(X – X)22
101.3384101.3384
227.0054227.0054
79.803879.8038
8.60428.6042
4.27124.2712
358.4698358.4698
9.40469.4046
258.1388258.1388
101.3384101.3384
4.27124.2712
25.671425.6714
4.27124.2712
8.60428.6042
98.670498.6704
481.0696481.0696
SUM = 1770.9333SUM = 1770.9333
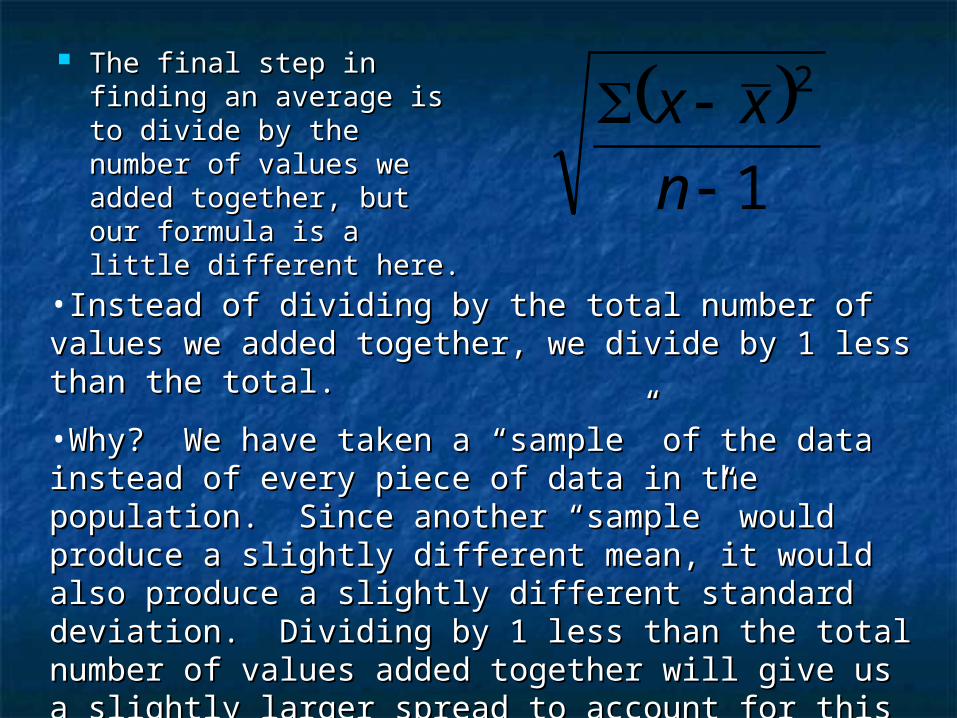
The final step in The final step in finding an average is finding an average is to divide by the to divide by the number of values we number of values we added together, but added together, but our formula is a little our formula is a little different here.different here.
1
2
n
xx
•Instead of dividing by the total number of values we Instead of dividing by the total number of values we added together, we divide by 1 less than the total.added together, we divide by 1 less than the total.
•Why? We have taken a “sample” of the data Why? We have taken a “sample” of the data instead of every piece of data in the population. instead of every piece of data in the population. Since another “sample” would produce a slightly Since another “sample” would produce a slightly different mean, it would also produce a slightly different mean, it would also produce a slightly different standard deviation. Dividing by 1 less than different standard deviation. Dividing by 1 less than the total number of values added together will give the total number of values added together will give us a slightly larger spread to account for this us a slightly larger spread to account for this sampling variation.sampling variation.
1
2
n
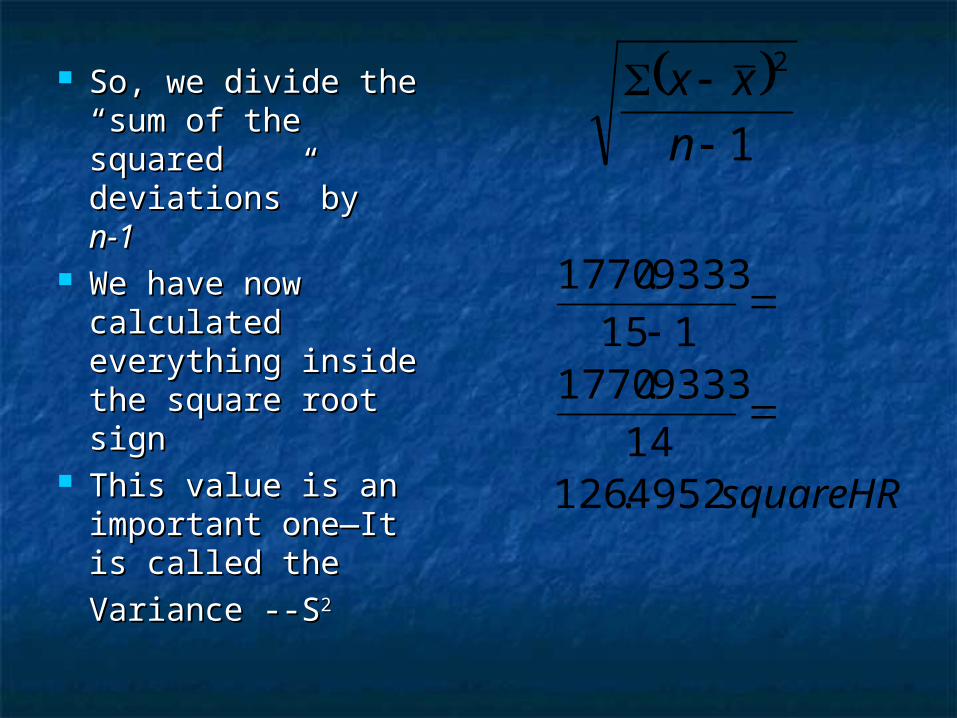
xx So, we divide the So, we divide the “sum of the squared “sum of the squared deviations” by deviations” by n-1n-1
We have now We have now calculated calculated everything inside everything inside the square root signthe square root sign
This value is an This value is an important one—It is important one—It is called thecalled the
Variance --SVariance --S22 HRsquare4952.12614
9333.1770115
9333.1770
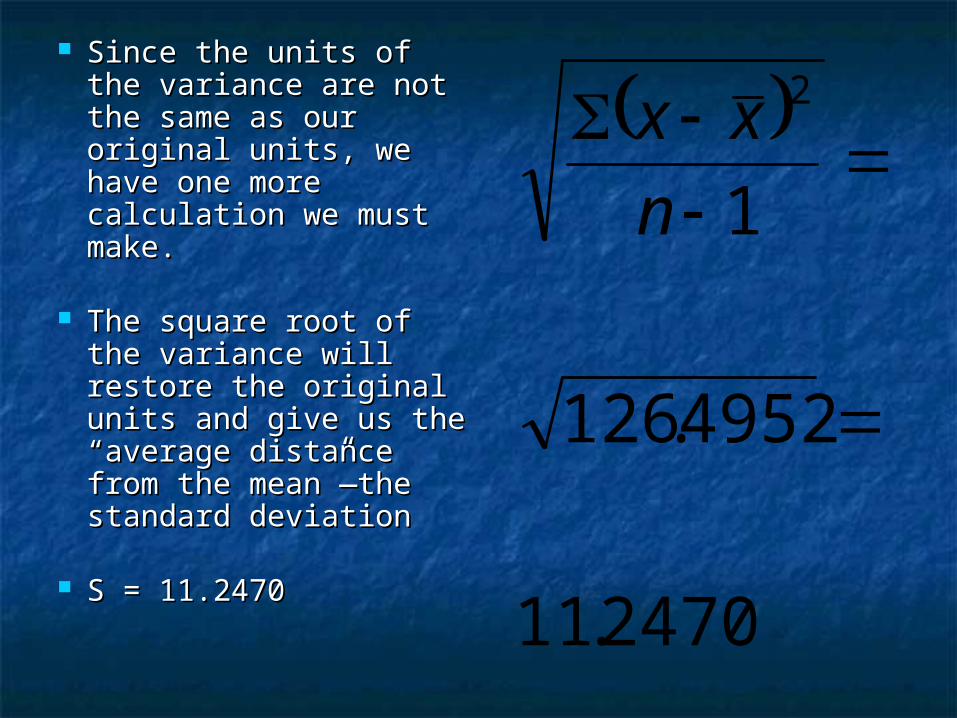
Since the units of the Since the units of the variance are not the variance are not the same as our original same as our original units, we have one units, we have one more calculation we more calculation we must make.must make.
The square root of the The square root of the variance will restore variance will restore the original units and the original units and give us the “average give us the “average distance from the distance from the mean”—the standard mean”—the standard deviationdeviation
S = 11.2470S = 11.2470
2470.11
4952.126
1
2
n
xx
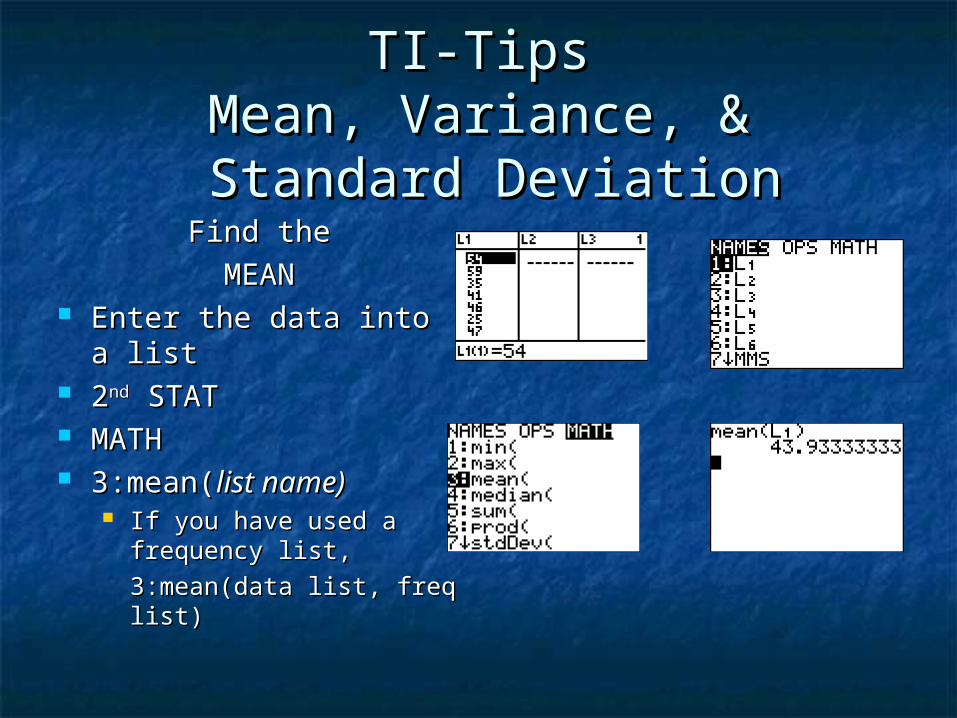
TI-TipsTI-TipsMean, Variance, &Mean, Variance, &
Standard Deviation Standard DeviationFind theFind the
MEANMEAN Enter the data into a Enter the data into a
listlist 22ndnd STAT STAT MATHMATH 3:mean(3:mean(list name)list name)
If you have used a If you have used a frequency list, frequency list,
3:mean(data list, freq 3:mean(data list, freq list) list)
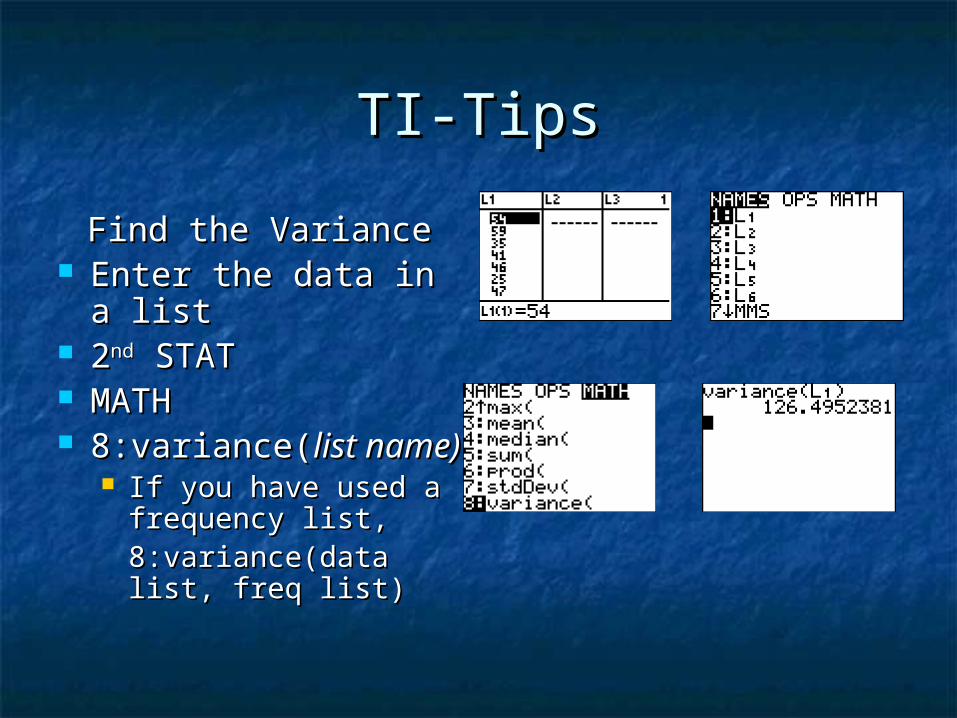
TI-TipsTI-Tips
Find the VarianceFind the Variance Enter the data in a Enter the data in a
listlist 22ndnd STAT STAT MATHMATH 8:variance(8:variance(list name)list name)
If you have used a If you have used a frequency list, frequency list, 8:variance(data list, 8:variance(data list, freq list)freq list)
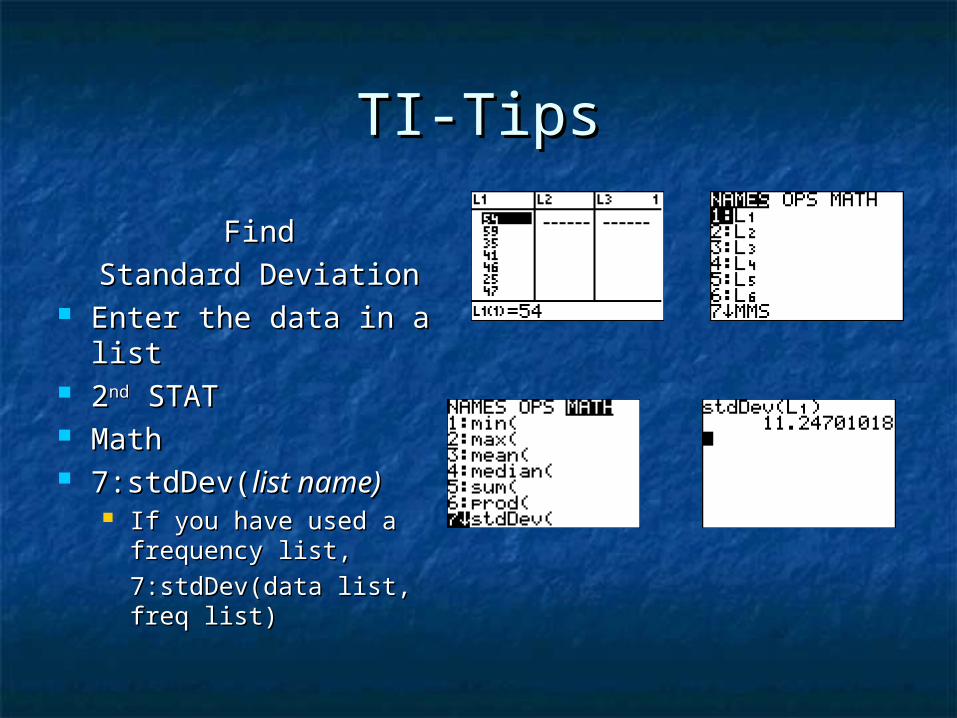
TI-TipsTI-Tips
FindFind
Standard DeviationStandard Deviation Enter the data in a listEnter the data in a list 22ndnd STAT STAT MathMath 7:stdDev(7:stdDev(list name)list name)
If you have used a If you have used a frequency list, frequency list,
7:stdDev(data list, freq 7:stdDev(data list, freq list)list)
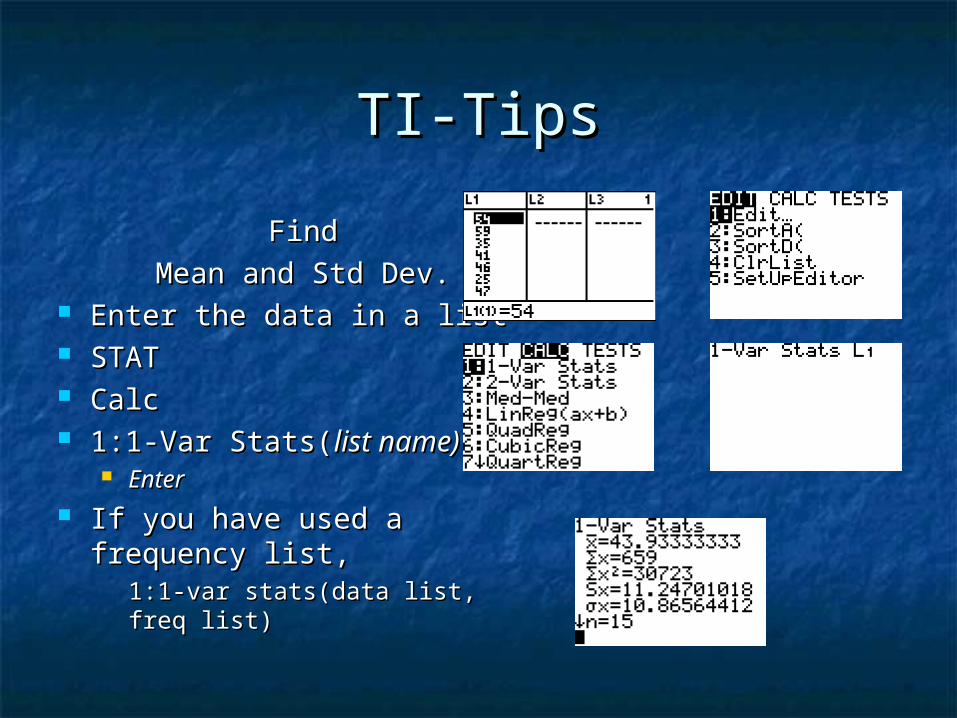
TI-TipsTI-Tips
FindFind
Mean and Std Dev.Mean and Std Dev. Enter the data in a listEnter the data in a list STATSTAT CalcCalc 1:1-Var Stats(1:1-Var Stats(list name)list name)
EnterEnter If you have used a frequency If you have used a frequency
list, list, 1:1-var stats(data list, freq list)1:1-var stats(data list, freq list)
Additional ResourcesAdditional Resources
Practice of Statistics: Pg 30-34, 43-Practice of Statistics: Pg 30-34, 43-4646