describing the auto-ignition quality of fuels in hcci engines
TRANSCRIPT
Describing the Auto-Ignition Quality of Fuels in HCCI Engines
Per Risberg Doctoral thesis School of Industrial Engineering and Management Royal Institute of Technology S-100 44 Stockholm
TRITA – MMK 2006:07 ISSN 1400-1179
ISRN/KTH/MMK/R-06/07-SE
TRITA – MMK 2006:07 ISSN 1400-1179 ISRN/KTH/MMK/R-06/07-SE
Describing the Auto-Ignition Quality of Fuels in HCCI Engines
Per Risberg
Doctoral thesis
Academic thesis, which with the approval of Kungliga Tekniska Högskolan, will be presented for public review in fulfilment of the requirements for a Doctorate of Engineering in Machine Design. The public review is held at Kungliga Tekniska Högskolan, Brinellv 64 in room M2 at 10.00 AM on the 22th of May 2006.
3
I. Abstract The Homogeneous Charge Compression Ignition (HCCI) engine is a promising engine concept that emits low concentrations of NOx and particulates and still has a high efficiency. Since the charge is auto-ignited, the auto-ignition quality of the fuel is of major importance. It has been shown in several studies that neither of the classical measures of auto-ignition quality of gasoline-like fuels, RON and MON, can alone describe this in all conditions in HCCI combustion. However, even in such cases it is possible to combine RON and MON into an octane index, OI, that describes the auto-ignition quality well in most conditions. The octane numbers are combined into the OI with the variable K according to the following equation:
OI = (1-K)RON + K MON = RON – K S
The OI of a sensitive fuel is the equivalent of the octane number of a primary reference fuel with the same resistance to auto-ignition in the tested condition. The K-value is dependent on the temperature and pressure history. A generic parameter Tcomp15, the temperature at 15 bar during the compression, was introduced to describe the temperature and pressure history. It was found that the K-value increases with increasing Tcomp15 and two linear equations have been suggested to describe this relationship. At high or low Tcomp15 it has been found that the sensitivity of the fuel octane quality on combustion phasing is small and the auto-ignition quality defined by the OI scale does no longer play a big role. NO affects the combustion phasing of gasoline-like fuels. This effect is most significant at low concentration where it advances the combustion phasing considerably. At higher conditions its influence is different for different fuels.
4
A sensitive fuel is considered a good HCCI fuel since its OI changes in the same direction as the octane requirement of the engine, which would make the engine management easier. It is also likely that a sensitive fuel will enable a wider operating range. The auto-ignition quality of diesel-like fuels was studied in tests with three different strategies of mixture formation. In these tests it was found that the ignition delay increased with lower cetane number and that the cetane number described the auto-ignition quality well, even for fuels of significantly different physical properties. The experiments were, however, made at a limited range of operating conditions and low load. A good diesel-like HCCI fuel should be easy to vaporize to facilitate homogeneity. It should have a high resistance to auto-ignition, not necessarily the highest, one that allows both high and low loads at a given compression ratio. Finally, it should also function well with the injection system without a significant decrease in injection system life length. Keywords: Auto-Ignition Quality, RON, MON, Cetane Number, HCCI, CAI and Fuels.
5
II. Sammanfattning HCCI (Homogeneous Charge Compression Ignition) motorn är ett lovande motorkoncept som släpper ut låga halter av partiklar och NOx och har hög verkningsgrad. Eftersom luft-bränsleblandningen självantänds är självantändningsegenskaperna hos bränslet mycket viktiga. Det har visats i flera studier att de klassiska måtten på självantändningskvalitet hos bensinliknande bränslen, RON och MON, inte ensamma kan beskriva självantändningsegenskaperna vid alla förhållanden vid HCCI förbränning. Även vid sådana förhållanden är det dock möjligt att kombinera RON och MON till ett oktanindex, OI, som beskriver självantändningsegenskaperna väl vid de flesta förhållanden. Oktantalen kombineras till oktanindexet med hjälp av variabeln K enligt följande ekvation:
OI = (1-K)RON + K MON = RON – K S
Oktanindexet för ett känsligt bränsle är ekvivalent med oktantalet hos ett PRF bränsle testat med samma självantändningskvalitet vid samma förhållande. K-värdet är beroende av temperatur- och tryckhistorien. En generell parameter som beskriver temperatur- och tryckhistorien har introducerats, Tcomp15, temperaturen vid 15 bar under kompressionen. Det konstaterades att K-värdet ökade med ett ökande Tcomp15 och två linjära ekvationer för att beskriva förhållandet har föreslagits. Vid ett högt eller ett lågt Tcomp15 har det konstaterats att beroendet av oktankvalitet på förbränningsfasning är liten och att självantändningskvalitet, definierat av OI skalan inte längre spelar någon större roll. NO påverkar förbränningsfasningen hos bensinliknande bränslen. Denna effekt är störst vid låga koncentrationer där förbränningsfasningen avanceras påtagligt. Vid högre koncentrationer påverkas olika bränslen olika.

6
Ett känsligt bränsle är betraktat som ett bra HCCI bränsle eftersom dess OI förändras i samma riktning som oktanaptiten hos motorn, vilket gör motorregleringen lättare. Det är också sannolikt att ett känsligt bränsle ger ett vidare operationsfönster. Självantändningskvaliteten hos diesel-liknande bränslen studerades i prov med tre olika strategier för luft-bränsle blandning. Från dessa prov drogs slutsatsen att tändfördröjningen ökade med ett lägre cetantal och att cetantalet beskrev självantändningskvaliteten väl även för bränslen med mycket olika fysikaliska egenskaper. Proven utfördes dock vid små variationer insugsförhållanden och vid låg last. Ett bra Diesel HCCI bränsle ska vara lätt att förånga för att göra homogenitet möjlig. Det skall ha ett högt motstånd mot självantändning, inte nödvändigt vis den högsta, men ett som tillåter både hög och låg last. Slutligen ska bränslet också fungera med insprutningssystemet utan att resultera i en märkbar sänkning av dess livslängd.
7
III. Acknowledgements The following people have contributed to this work and they are gratefully acknowledged: Gautam T. Kalghatgi My supervisor, who is the father of the octane index. Even though he is a busy man he has always time to answer all my questions. Gautam is impressively energetic, enthusiastic and still hungry for new knowledge. Hans-Erik Ångström My domestic supervisor who has given me the chance to finish my PhD without any finances. He has also been an amazing help in engine laboratory with the cell control system and calibration. David Johansson, Pehr Björnbom and Johan Andrae My colleagues at the Chemical Reaction Engineering department and co-authors on two of my papers. With these people I have had fruitful collaborations that have given my research another dimension. Anders Röj, Günter Kleinschek, Stefan Strömberg and Elna Strömberg The reference group in the Green Car project with whom I have had many interesting meetings and discussions. Eric Lycke, Tommy Tillman and Henrik Nilsson The technicians in the engine laboratory without whom I would never have succeeded with any tests. For these guys nothing is impossible.
8
Fredrik Wåhlin and Fredrik Agrell My friends and cell mates in the engine laboratory with whom I have shared engine during these years. The cooperation in the laboratory has been smooth and it has never been impossible to do some complementary tests when the engine has been possessed by someone else. They have also allowed me to use their expensive equipment whenever I have asked. Last but not least they have also shared some of their invaluable knowledge of the active valve train and injection systems, which have enriched my research. My old and new colleagues at the Internal Combustion Engine department With whom I have had many interesting discussions around the coffee and lunch table and shared many laughs. They have also given me respect even though I have not yet owned a car. Julio Rivera and David Gundén My master thesis candidates who probably helped me more than I helped them. The Administrational personnel That has always helped me out and made my days brighter. The Swedish Government, Volvo, SCANIA CV AB and Shell This work was financed by the Swedish Government and these companies under the “Green Car” Project and they are therefore gratefully acknowledged. Everybody else that I have not mentioned or might have forgotten.
9
List of papers This thesis includes the following publications, referred to by their Roman numerals. After the list, a brief summary of the appended papers is presented. The papers are appended at the end.
PAPER I. A Method of Defining Ignition Quality of Fuels in HCCI Engines
Kalghatgi, G.T. 1, Risberg P2 and Ångström H-E2 1Shell Global Solutions, UK 2Department of Machine Design, Internal Combustion Engines, Royal Institute of Technology, Sweden. Presented at the SAE Fuels & Lubricants Meeting, held May 19-22, 2003, in Yokohama, Japan. SAE 2003-01-1816
PAPER II. Auto-ignition quality of gasoline-like fuels in HCCI engines
Risberg, P. 1, Kalghatgi, G. 2 and Ångström H-E1 1Department of Machine Design, Internal Combustion Engines, Royal Institute of Technology, Sweden. 2Shell Global Solutions, UK Presented at the SAE Powertrain & Fluid Systems Conference & Exhibition, held October 2003, in Pittsburgh, PA, USA. SAE 2003-01-3215
PAPER III. The influence of EGR on auto-ignition quality of gasoline-like fuels in HCCI engines.
Risberg, P. 1, Kalghatgi, G. 2 and Ångström H-E1 1Department of Machine Design, Internal Combustion Engines, Royal Institute of Technology, Sweden. 2Shell Global Solutions, UK Presented at SAE Powertrain & Fluid Systems Conference & Exhibition, held October 2004, in Tampa, FL, USA. SAE 2004-01-2952, SAE Transactions

10
PAPER IV. Auto-ignition quality of Diesel-like fuels in HCCI engines
Risberg, P. 1, Kalghatgi, G. 2, Ångström H-E1 and Fredrik Wåhlin1 1Department of Machine Design, Internal Combustion Engines, Royal Institute of Technology, Sweden. 2Shell Global Solutions, UK Presented at SAE Brazil Fuels & Lubricants Meeting, held May 2005, in Rio De Janeiro, Brazil. SAE 2005-01-2127, SAE Transactions
PAPER V. The Influence of NO on the Combustion Phasing in an HCCI Engine
Risberg, P. 1, Johansson D 2, Andrae J 2, Kalghatgi, G.3 Björnbom P 1 and Ångström H-E1 1Department of Machine Design, Internal Combustion Engines, Royal Institute of Technology, Sweden. 2Department of Chemical Engineering and Technology, Chemical Reaction Engineering, Royal Institute of Technology, Sweden. 3Shell Global Solutions, UK Presented at SAE World Congress & Exhibition, held April 2006, in Detroit, MI, USA,. SAE 2006-01-0416
PAPER VI. Advantages of fuels with high resistance to auto-ignition in late-injection, low-temperature, compression ignition combustion
Kalghatgi, G.T. 1, Risberg P2 and Ångström H-E2 1Shell Global Solutions, UK 2Department of Machine Design, Internal Combustion Engines, Royal Institute of Technology, Sweden. Submitted to SAE Powertrain & Fluid Systems Conference & Exhibition, held October 2006, in Toronto, Ontario, Canada. SAE 2006-01-xxxx

11
Related Work (Not Included in the Thesis)
PAPER VII. Co-oxidation in the auto-ignition of primary reference fuels and n-heptane/toluene blends
Andrae J 1, Johansson D 1, Björnbom P 1, Risberg, P. 2, and Kalghatgi, G.3 1Department of Chemical Engineering and Technology, Chemical Reaction Engineering, Royal Institute of Technology, Sweden. 2Department of Machine Design, Internal Combustion Engines, Royal Institute of Technology, Sweden. 3Shell Global Solutions, UK Combustion and Flame, vol. 140, pp 267-286, 2005 Brief Summary of the appended papers
In PAPER I-III the auto-ignition quality of gasoline like fuels have been explored under different operating conditions. In PAPER I, the Octane Index, OI, for the description of auto-ignition quality of gasoline-like fuels in HCCI engines was introduced. In PAPER II the variable K, deciding the OI of sensitive fuels, was explored and its dependency on different engine parameters was studied. An equation dependent on in-cylinder temperature and mixture strength was proposed to describe the K-value. Furthermore, OI0 was introduced, which is a parameter that describes the octane requirement of the engine. In PAPER III the influence of internal and external EGR on auto-ignition quality was studied. In this work it was concluded that at high in-cylinder temperatures all fuels starts to behave similarly, regardless of octane quality. In PAPER V the influence of NO on the combustion phasing of gasoline-like fuels has been studied. In this work it was found that the influence of NO on the combustion phasing is most significant at low NO concentrations. At higher concentrations NO influenced different fuels differently. A more extensive summary of the work on gasoline-like fuels is presented in this thesis in chapter 5. In PAPER IV the relationship between the auto-ignition behaviour of diesel-like fuels and the fuel cetane number was investigated under different mixture preparation strategies. The tests show that the cetane number can describe the

12
auto-ignition quality of diesel-like fuels in HCCI combustion well, even for fuels of significantly different physical properties. In PAPER VI the potential of highly auto-ignition resistant fuels in late-injection, low temperature HCCI was studied. In this work it was found that at any given condition, gasoline has a significantly higher ignition delay for the same combustion phasing and hence results in very much lower NOx and smoke for a given load compared to diesel fuels. A more thorough summary of the work on diesel-like fuels is presented in chapter 6.
13
Table of Contents
1 INTRODUCTION ...................................................................... 15
2 BACKGROUND........................................................................ 17 2.1 The SI Engine ..................................................................................... 17 2.2 The CI Engine..................................................................................... 18 2.3 Engine Efficiency................................................................................ 19 2.4 Health and Environmental Effects of the Emissions....................... 22
2.4.1 NOx.......................................................................................... 22 2.4.2 Particulates .............................................................................. 23
2.5 Emission Legislation .......................................................................... 23 2.6 The HCCI Engine............................................................................... 24
3 AUTO-IGNITION....................................................................... 27 3.1 Auto-Ignition Chemistry ................................................................... 27 3.2 Empirical Auto-Ignition Modeling ................................................... 34 3.3 Auto-Ignition Quality Tests............................................................... 36
3.3.1 MON and RON ....................................................................... 36 3.3.2 The Cetane Number ................................................................ 38 3.3.3 IQT Test .................................................................................. 40 3.3.4 CAN Test ................................................................................ 40
4 EXPERIMENTAL DETAILS ..................................................... 42 4.1 The Test Bed ....................................................................................... 42 4.2 The Fuels............................................................................................. 44
4.2.1 Gasoline-Like Fuels ................................................................ 44 4.2.2 Diesel-Like Fuels .................................................................... 45
5 AUTO-IGNITION QUALITY OF GASOLINE-LIKE FUELS...... 47 5.1 Experimental Procedure.................................................................... 47 5.2 Limitations of RON and MON.......................................................... 50 5.3 The Octane Index. .............................................................................. 54 5.4 The Influence of Engine Parameters on OI ..................................... 58
5.4.1 Temperature and Pressure ....................................................... 58 5.4.2 Mixture Strength ..................................................................... 62 5.4.3 Engine Speed........................................................................... 63
5.5 Engine Octane Index Requirement .................................................. 65 5.6 The Sensitivity of the Fuel Octane Quality ...................................... 66 5.7 The Influence of NO........................................................................... 68
14
5.8 Requirements of a Gasoline-Like HCCI Fuel.................................. 69
6 THE AUTO-IGNITION QUALITY OF DIESEL-LIKE FUELS.... 72 6.1 Experimental Procedure.................................................................... 72
6.1.1 Port Fuel Injection................................................................... 72 6.1.2 Early Direct-Injection ............................................................. 73 6.1.3 Late Direct-Injection ............................................................... 74
6.2 The Cetane Number as a Measure of Fuel Auto-Ignition Quality. 75 6.2.1 Port Fuel Injection................................................................... 75 6.2.2 Early Direct-Injection ............................................................. 76 6.2.3 Late Direct-Injection ............................................................... 78
6.3 Limitations of the Cetane Number ................................................... 82 6.4 Requirements of a Diesel-Like HCCI Fuel ...................................... 83
7 CONCLUSIONS ....................................................................... 87
8 SYMBOLS AND ABBREVIATIONS......................................... 90
9 REFERENCES ......................................................................... 92
PAPER I ........................................................................................... I-1
PAPER II ......................................................................................... II-1
PAPER III ....................................................................................... III-1
PAPER IV .......................................................................................IV-1
PAPER V .........................................................................................V-1
PAPER VI .......................................................................................VI-1

Describing the Auto-Ignition Quality of Fuels in HCCI Engines
15
1 Introduction The world is completely dependent on the internal combustion engine today. It is difficult to imagine the world without the most common engines, the Diesel engine and the Otto engine, which take us where we want to go and deliver our daily bread. At the same time as the engines have made our lives more convenient, they have also contributed to problems such as smog, pollution, the more recently considered problems, the greenhouse effect and the scarce fuel resources. These issues have led to more stringent emission legislations, which the engines have difficulties meeting. The diesel engine has problems typical of mixing controlled combustion that result in high concentrations of NOx and particulates, which will require advanced after-treatment systems. The Otto engine and its premixed combustion suffers from low efficiency at part load due to throttled intake and low compression ratio, which will be very disadvantageous with increasing oil prices and new CO2 restricting legislations. This has forced the engine industry to look beyond the engine concepts of today. One engine concept that might be the solution to these problems is the Homogeneous Charge Compression Ignition (HCCI) engine. The lean homogeneous combustion of the HCCI engine gives low or no particulates and low NOx emissions and at the same time the efficiency can reach the same high levels as the diesel engine even on part load. The HCCI engine also has its share of problems. The fuel and the air are premixed as in the Otto engine, but auto-ignited as in the diesel engine. This results in a rather violent combustion since the entire cylinder volume burns almost simultaneously within a few crank angle degrees (CAD) which results in high pressure rise rates at high load. At low load the exhaust temperature is low, which makes abatement of HC and CO by means of a catalyst difficult. Another problem of the HCCI engine is the engine control, particularly related to transients. Much research is required in this area to solve this problem. The

P. Risberg
16
benefits of the HCCI engines are, however, very tempting and the Swedish vehicle industry (Scania CV, Volvo Car and Volvo Powertrain) together with the Swedish government therefore formed the Green Car project with the purpose of creating more environmentally friendly vehicles. One part of this project studied different aspects of the HCCI engine and my group studied how different fuel properties affect HCCI combustion. This is a significant field since the HCCI combustion is controlled by the chemical kinetics, which makes the engine very sensitive to differences in fuel properties. Since the fuel in the HCCI engine is compressed until it auto-ignites, the most central property of the fuel is its auto-ignition quality. Previous studies in HCCI engines have shown that it is difficult to explain the auto-ignition behaviour of different fuels with conventional measures of auto-ignition quality, RON (Research Octane Number) MON (Motor Octane Number) for gasoline and to some extent the cetane number for diesel. The purpose of this project was, therefore, to obtain a greater knowledge of how different fuel parameters (mainly auto-ignition quality) affect HCCI combustion. A deeper understanding in this area could facilitate control of the engine and allow higher engine loads and a wider operating range to be achieved. The goal of the project was to find a general way to describe the HCCI properties of different fuels in the form of equations. The work presented in this thesis is divided between gasoline-like fuels and diesel-like fuels. Gasoline-like fuels are defined as fuels with RON >60, cetane number <30 and diesel-like fuels are defined as fuels with cetane number >30.

Describing the Auto-Ignition Quality of Fuels in HCCI Engines
17
2 Background This chapter is intended to give an introduction to the function of the most common internal combustion engines, the Diesel and the Otto engine and their problems. Furthermore an introduction to the HCCI engine and its benefits and disadvantages is given.
2.1 The SI Engine In the Spark Ignited (SI) engine, which is also known as the Otto engine, the fuel and the intake air are mixed before ignition. The fuel-air mixture is compressed normally 8-12 times, and 10-40 crank angle degrees before the turning point of the piston the fuel-air mixture is ignited by an energy source, generally a spark plug. The ignition angle is set earlier when the engine speed is high, since the ignition phase is rather constant over time. The spark leaves a nucleus of fire in the center of the cylinder that initially expands slowly. After the initiating phase, a turbulent flame front develops that propagates faster through the cylinder during the expansion stroke, before quenching at the cylinder wall. The power output from a SI engine is controlled by a throttle that determines the airflow. The throttling of the airflow at low loads causes pumping losses that decrease the efficiency of the engine. The rather low compression ratio of the SI engine also limits the engine efficiency. [1-3] The combustion in a modern SI engine is at most times stochiometric – there is just enough air to theoretically convert all the fuel to water and carbon dioxide. This is controlled by a lambda sensor. The unwanted emissions from the SI-engine are HC, CO, NO and NO2. NO and NO2 are commonly named NOx. NOx formation is very temperature dependent and NOx is therefore formed behind the propagating flame front, where the temperature is highest. CO is formed in fuel rich areas, where there is not enough air to oxidize the fuel completely. HC has its origin in regions where the fuel avoids the flame front either by going down in the crevices between the piston and the cylinder wall, being adsorbed in the oil film on cylinder walls or being close to the cylinder wall where the flame front cannot reach before quenching. HC is also formed

P. Risberg
18
by incomplete combustion. However, the SI engine has an efficient after-treatment system in form of the three-way catalyst, which oxidizes HC and CO to CO2 and H2O and reduces NOx to N2. The function of the catalyst is made possible by the stochiometric combustion. This system ensures that these emissions are not a problem. The Achilles heel of the SI engine is instead the low efficiency, especially at part load and this issue is getting more important with decreasing fuel supply and global warming. [1 ,2]
2.2 The CI Engine In the Compression Ignited (CI) engine, or the diesel engine, the air is compressed much further than in the SI engine. The compression ratio in the CI engine is between 12 and 24. In the conventional diesel engine the fuel is injected directly into the cylinder and this is done at around 20 crank angle degrees (CAD) before top dead centre (TDC). The fuel ignites a few CAD after the injection has started. The early stage of combustion is rather violent, since a part of the fuel has had time to mix with the air, which results in a short premixed combustion phase. When the premixed fuel is consumed, the main part of the combustion starts, where the fuel goes through several different processes, atomization, vaporization, mixing with air and pre-flame reactions. The speed of the diesel combustion is limited by the mixing between the injected fuel and the air in the cylinder, which also limits the maximum engine speed. The combustion continues at a lower rate long into the expansion stroke. [1, 4] The load in the CI engine is controlled by varying the injected amount of fuel. The amount of air in the cylinder is constant at a given intake pressure. In the CI engine, the time between injection and ignition and the period of the premixed combustion is kept as short as possible. The combustion timing can then easily be controlled by the injection timing. [1] The charge in the diesel engine is lean overall – there is more air than required for full conversion of the fuel to water and CO2. The charge is, however, very

Describing the Auto-Ignition Quality of Fuels in HCCI Engines
19
heterogeneous due to the direct-injected fuel, which results in pure fuel at the exit of the nozzle and regions of pure air outside of the fuel spray. The diesel engine emits the same kind of pollutants as the SI engine along with a higher concentration of particulates. However, since the overall mixture strength is lean, the CO emissions are very low. As mentioned earlier, NOx formation is very temperature dependent. NOx is therefore formed at the stochiometric region that surrounds the flame. There are two major sources of unburned fuel, creating HC, in the CI engine, overleaning and undermixing. Overleaning causes regions with air fuel ratios that are lean beyond the combustion limit and occurs usually during the ignition delay. Undermixing has its origin in fuel injected late during the injection, that will not blend sufficiently with the excess air, which creates HC. The particulates consist mainly of carbon (soot) and the soot is formed by pyrolysis in the centre of the fuel spray. A particle is then formed when hydrocarbons, aerosols and sulphates are adsorbed to the soot nucleus. [1]
2.3 Engine Efficiency As mentioned earlier, the main problem with the SI engine is the low efficiency. This problem will likely become more serious as the supply of fossil fuel decreases. According to British Petroleum’s statistical review of World Energy June 2005, the time that the remaining oil reserves would last at the same production rate held today is only 40.5 years. [5] However, the prospected amount of fuel will increase as new distant and unstable areas in the world and oil of lower purity (Tar Sands, etc) will become more economically feasible to exploit. On the other hand the demand for fossil fuels will also increase. In Figure 1 the annual energy consumption in the world is plotted against time. [7]

P. Risberg
20
Figure 1: The annual energy consumption (in British thermal units (BTU = 1.055 kJ)) in the world plotted against time. [6, 7]
As it can be seen in Figure 1, the annual energy consumption in the world is increasing and this even though the energy consumption in Western Europe is rather stable. The main reason for the increasing energy demand in the world is the increase in Asia and their developing economies and there are no signs of any decrease in the growth of the Asian energy consumption. The oil demand in the world is calculated to increase by nearly 60 percent from 2001 to 2025. This will cause the oil price to increase according to the fundamental economic laws of supply and demand, which makes an engine with high efficiency very attractive. [7] Another severe global problem is that gases in the atmosphere, such as Carbon dioxide, CO2, dinitrogen oxide, N2O and methane, CH4 reflect some of the heat radiation from the earth back to the earth again. However, the gases do not stop the rays from the sun from reaching the earth. This results in an
0
20
40
60
80
100
120
140
1975 1980 1985 1990 1995 2000 2005Year
Ener
gy C
onsu
mpt
ion
[1015
BTU
]
0
50
100
150
200
250
300
350
400
450
Tota
l ene
rgy
Con
sum
ptio
n [1
015 B
TU]
North AmericaCentral & South AmericaWestern EuropeEastern Europe & Former U.S.S.R.Middle EastAfricaAsia & OceaniaTotal Energy consumption

Describing the Auto-Ignition Quality of Fuels in HCCI Engines
21
elevated global temperature. The gases have a similar effect as the glass in a green house, hence the name green house effect or global warming. [8] In Figure 2 the CO2 concentration in the atmosphere, measured at Mauna Loa, Hawaii and the measured average global temperature is plotted against time. [9, 10]
Figure 2: The CO2 concentration in the atmosphere, measured at Mauna Loa, Hawaii and the measured average global temperature plotted against time. [9, 10]
From Figure 2 it is evident that the CO2 concentration has increased by 20 % during the last 40 years and there are no signs that the rate is decreasing. In fact, since pre-industrial times (1750) the concentration of CO2 in the atmosphere has increased by 30 % and the concentrations of green-house gases in the atmosphere are higher now than at any other time during the last 420000 years. The increase of the CO2 concentration is mainly caused by the combustion of
310
320
330
340
350
360
370
380
1940 1950 1960 1970 1980 1990 2000 2010Year
CO
2 Con
cent
ratio
n [p
pm]
13,6
13,8
14
14,2
14,4
14,6
14,8
Ave
rage
Glo
bal T
empe
ratu
re [°
C]
CO2Temperature
P. Risberg
22
fossil fuel. In 2002, the Swedish transport sector’s share of the total greenhouse emissions was 30 %. [11, 12] From Figure 3 it is also clear that the global temperature has also increased significantly during the last 40 years. In the third assessment report of the Intergovernmental Panel on Climate Change (IPCC) it is concluded that the average temperature of the earth has been elevated by 0.6 °C since 1860 and the temperature increase during the last 100 years is likely to be the highest during the last 1000 years. According to different climate models that are presented, the average temperature will increase by 1.4 to 5.8 °C from 1990 to 2100. In Sweden the increase will be even more significant. According to IPCC a decrease in green house gases demands a more efficient energy use and new combustion concepts. [11]
2.4 Health and Environmental Effects of the Emissions
The CI engine has a higher efficiency than the SI engine. The main problem with the CI engine is the emissions of NOx and particulates that are harmful to both nature and human health.
2.4.1 NOx NO and NO2 impacts the environment and human health in many ways. When NO2 is photo-dissociated it can result in the formation of hazardous ground level ozone and smog. NOX also contributes to acid rain that damages nature and buildings. Nitrogen is also nutrient which contributes to the nutrient overload, eutrophication, of lakes and seas, which decreases the oxygen concentrations in lakes and ultimately results in the death of plants and animals. [13, 14]
Describing the Auto-Ignition Quality of Fuels in HCCI Engines
23
2.4.2 Particulates It has been shown that particulates can cause health problems such as asthma, decreased lung function, cardiovascular symptoms, lung cancer and ultimately premature death. Particulates also reduce visibility and stain and damage buildings.[15]
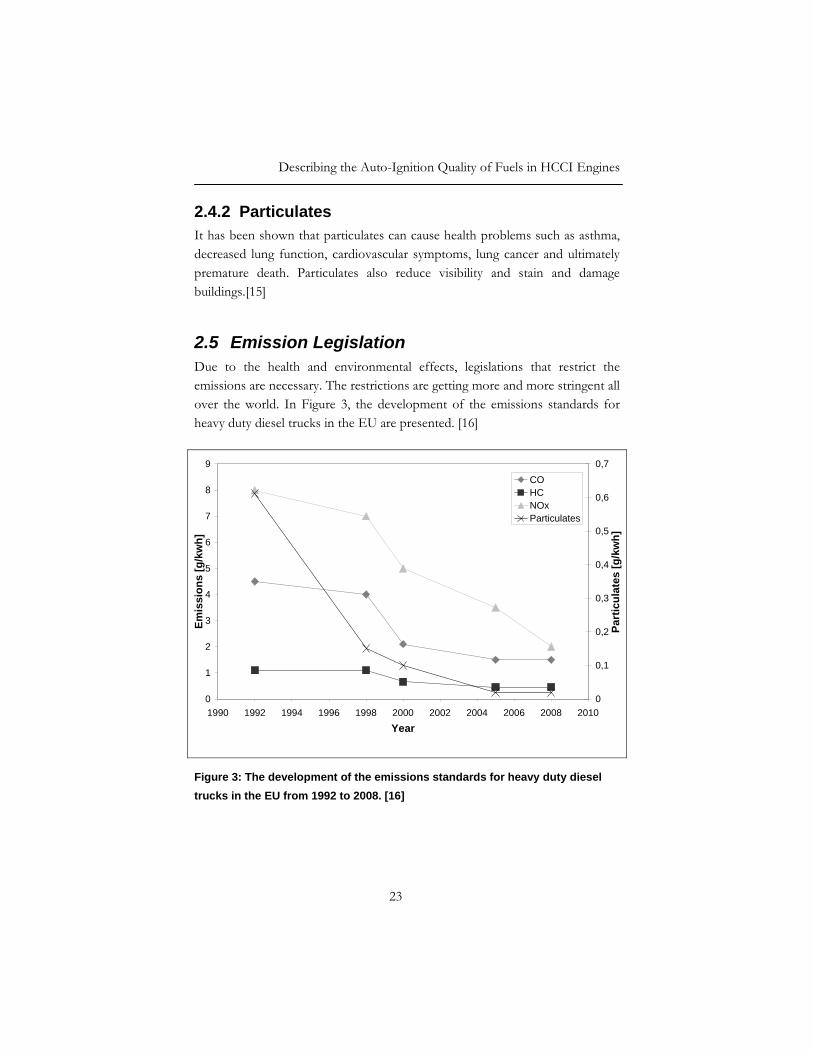
2.5 Emission Legislation Due to the health and environmental effects, legislations that restrict the emissions are necessary. The restrictions are getting more and more stringent all over the world. In Figure 3, the development of the emissions standards for heavy duty diesel trucks in the EU are presented. [16]
Figure 3: The development of the emissions standards for heavy duty diesel trucks in the EU from 1992 to 2008. [16]
0
1
2
3
4
5
6
7
8
9
1990 1992 1994 1996 1998 2000 2002 2004 2006 2008 2010
Year
Emis
sion
s [g
/kw
h]
0
0,1
0,2
0,3
0,4
0,5
0,6
0,7
Part
icul
ates
[g/k
wh]
COHCNOx Particulates

P. Risberg
24
The allowed emission level has decreased significantly during the last decade. In the so called Euro IV standard that was introduced in the European Union in 2005, the NOx and particulate levels are very low. Meeting them without some kind of after-treatment, such as a particulate filter or selective catalytic reduction (SCR), is very difficult. However, it is clear that the manufacturer that manages will have a big advantage, since the customer will in case of SCR be forced to refill a NOx reducing liquid and in case of particulate filters there can be problems with the regeneration of the filters. These advanced after-treatment systems are also quite expensive. [16] The emission levels in Euro V, that will be introduced in 2008, are so low that most diesel engines most likely will need SCR systems. These levels are similar to the emissions standards that will be introduced in the USA in 2007. This makes an engine concept that can reach these emission levels without any advanced after-treatment system very attractive. [16] Also the emission legislation restricting the emissions from the SI engine has become more stringent and in California the first rules restricting CO2 emissions has been accepted, beginning in 2009. Also in the EU there is an aim to reach an average CO2 emission figure of 120 g/km for all new passenger cars marketed in the Union by 2010 at the latest. [16, 17]
2.6 The HCCI Engine A promising engine concept that emits low concentrations of NOx and particulates and still has the potential of an efficiency comparable to the diesel engine is the Homogeneous Charge Compression Ignition (HCCI) engine. In the HCCI engine, the fuel and air are premixed like in the SI engine, but auto-ignited like in the diesel engine. This results in a rather violent combustion since the entire cylinder volume burns almost simultaneously within a few crank angle degrees. This limits the high load range of the engine, due to engine noise and extreme pressure rise rates that threaten to damage the engine. [18]

Describing the Auto-Ignition Quality of Fuels in HCCI Engines
25
The charge in the HCCI engine is homogenous and lean, which decreases the peak combustion temperature significantly. The benefit from the low temperature is that low concentrations of NOx are produced, much lower than the concentrations from the diesel engine and comparable concentration to the emissions from the catalytic treated exhaust gases from the SI engine. [19] The lean combustion offers not just benefits, the lower temperature decreases the combustion efficiency especially at low load and results in high emissions of CO and HC. However, like in the homogeneous charge of the SI engine, the boundary layer at the cylinder wall and the cold crevice volumes at the side of the piston are the major sources of unburned hydrocarbons from the HCCI engine. Another problem at low load is that the exhaust temperature can decrease below the working temperature of the catalyst resulting in problems to decrease the high emissions of HC and CO. [18 – 20] It is basically possible to run all types of liquid and gaseous fuels in an HCCI engine. However, it would be necessary to adjust the engine for different fuel types. The compression ratio must be adjusted to suit the auto-ignition quality of the fuel; high compression ratio for fuels that are difficult to auto-ignite to secure ignition and low compression ratio for fuels that are prone to auto-ignite to avoid too early ignition. The injection system must also be adjusted to fit the boiling characteristics of the fuel. Port fuel injection, PFI, is suitable for gaseous and light liquid fuels that there is no problem to vaporize at low temperatures and heavier fractions must be injected directly into the cylinder to avoid problems coupled to difficulties to evaporate fuel. When the fuel is injected directly into the cylinder there are also other parameters that can help to facilitate a premixed charge such as injection timing, multiple injection strategies, different injection nozzles, injection pressure and combustion chamber geometry. [18] The combustion in the HCCI engine is controlled by the chemical kinetics and is therefore very sensitive to temperature, pressure, charge composition and fuel properties. This makes the combustion difficult to control especially at transients. A lot of research is going on in this area with, for example, variable

P. Risberg
26
valve actuation systems. Today, it looks difficult to obtain a full range HCCI engine due to the problems at high and low load. Also a hybrid with either the Otto or the diesel engine is problematic. In the Otto engine the compression ratio is so low that it makes the operating range in the low load area very limited due to problems to ignite the charge by compression. However, it is in this area that it would be beneficial to work in HCCI mode due to the pumping losses of the SI engine at part load. If the compression ratio would be increased to extend the HCCI operating range on low load it would also result in problems with engine knock when using SI-mode on full load. In the diesel case, with its high compression ratio and fuel that is very prone to auto-ignite, the problem is inverted. The HCCI operating range at low load is increased. At high load however the high compression ratio leads to high pressure rise rates and early ignition. This limits this area where the problem with the smoke and NOx is at its worst in diesel mode. Still, the benefits of a high efficiency and low NOx and smoke are very tempting and with a fuel and a control system that can expand the operating range the HCCI concept could become a commercial success. [18]

Describing the Auto-Ignition Quality of Fuels in HCCI Engines
27
3 Auto-ignition In the HCCI engine the ignition occurs at several points at the same time and no flame front propagation, like in the SI engine, is developed. Since the charge is auto-ignited, the auto-ignition quality of the fuel is of major importance. There are different ways of describing the auto-ignition quality, the theoretical approach using the chemical kinetics to describe the reaction mechanism, the empirical approach using basic equations derived from experimental results and the experimental approach using a test engine or a pressure vessel to compare auto-ignition quality of different fuels. In this chapter an introduction to auto-ignition chemistry and the most common empirical approach is given and the most common measures of auto-ignition quality are introduced.
3.1 Auto-Ignition Chemistry The process of ignition of a commercial hydrocarbon fuel is complicated from a chemical point of view, hundreds of chemical species participating in thousands of reactions. The Lawrence Livermore National Laboratory (LLNL) mechanism of the combustion of a PRF fuel, which is one of the simplest, two component, model fuels existing, includes 1034 species and 4238 reactions. [21] The most important reactions in the ignition process of hydrocarbon fuels has, however, been recognized as the following reactions.1 [22]
H• + O2 + M → HO2• + M (R 1)
RH + HO2• → R• + H2O2 (R 2)
1 The point, •, denotes an unpaired electron and an atom or a molecule with an unpaired electron is a radical.
P. Risberg
28
H2O2 + M → OH• + OH• + M (R 3)
Where RH is an alkane, R• is an alkyl radical and M is a third body. The Reactions R1 and R2 are chain propagating reactions, reactions with the same number of radicals among both the reactants and the products, and reaction R3 is the important chain branching reaction, where the amount of radicals in the product are more than in the reactants. In this case one molecule creates two radicals. [22] H2O2 is produced during the compression stroke as the fuel molecules are degenerated and the concentration of H2O2 is accumulated and increases slowly at this stage, since H2O2 is rather stable when the temperature is low. When the temperature reaches 900 to 1000 K, mainly by compression, reaction R3 becomes dominating. R3 is fast at this temperature and H2O2 decomposes quickly to OH radicals and triggers the ignition of the main heat release. The temperature when the decomposition of H2O2 becomes dominating is the most important parameter in deciding the point of ignition. [22] Every reaction occurring during the compression is therefore very important since it will affect the temperature history and therefore also the combustion phasing. In Figure 4, the concentration of the most important radicals and the temperature during the auto-ignition process of a PRF fuel is plotted against crank angle degree, CAD. The figure is taken from unpublished work done by David Johansson.

Describing the Auto-Ignition Quality of Fuels in HCCI Engines
29
0,0E+00
5,0E-05
1,0E-04
1,5E-04
2,0E-04
2,5E-04
3,0E-04
3,5E-04
4,0E-04
4,5E-04
-20 -18 -16 -14 -12 -10 -8 -6 -4 -2 0Crank Angle [ATDC]
Mol
e Fr
actio
n
0
200
400
600
800
1000
1200
1400
1600
1800
2000
Tem
pera
ture
[K]
OHO2HH2O2Temperature
Figure 4: The concentration of OH, O2H and H2O2 and the temperature plotted against CAD during the auto-ignition process of a PRF fuel.
In Figure 4 it is apparent that the H2O2 concentration is accumulated during late part of the compression followed by a rapid decomposition at 6 CAD before TDC, which results in formation of OH radicals according to reaction R3. At the same point the temperature rises sharply indicating that ignition has occurred. The reactions R1-R3 are not only dominant in the ignition process in the HCCI engine, they also play a key role in the ignition process in the diesel engine and in the process causing engine knock in the SI engine. [22] The three reactions R1-R3 do not give any explanation to the differences in auto-ignition quality in different fuels. They just give information on how the auto-ignition is triggered. A few important reactions that can explain some of these differences occur early during the compression. These reactions result in a first stage of heat release at low temperatures and are often referred to as cool flames. Not all fuels show these cool flames and this low temperature heat release does not explain all differences in auto-ignition quality.

P. Risberg
30
The initiating reaction in the decomposition of the fuel molecules at low temperatures, early during the compression stroke, is that an alkane loses a hydrogen atom by simple fission forming an alkyl and a hydrogen radical. This is then followed by the addition of an oxygen molecule to the alkyl according to the following reaction.
R• + O2 + M = RO2• + M (R 4)
The reaction is prominent at low temperatures and decreases in intensity as the temperature increases since the equilibrium shifts towards dissociation at temperatures near 850K. The RO2 radical can be isomerized according to the reaction below.
RO2• → QOOH• (R 5)
Where Q is a R molecule stripped of a hydrogen atom. The QOOH radical can participate in several different chain propagating reactions such as the reactions below.
QOOH• → Q + HO2• (R 6)
QOOH• → QO + OH• (R 7)
Where one HO2 or OH radical is produced together with a stable olefin, Q, or a cyclic ether, QO. However, the QOOH radical can also react with another O2 molecule and isomerize further according to:
QOOH• +O2= O2QOOH• (R 8)
Describing the Auto-Ignition Quality of Fuels in HCCI Engines
31
O2QOOH• → OPOOH + OH• (R 9)
Where OPOOH is a ketohydroperoxide and P is a Q molecule stripped of a hydrogen atom. At temperatures near 800 K the ketohydroperoxide will decompose into several different species of which at least two are radicals that cause chain branching reactions. These extra chain branching reactions result in a small heat release, cool flames, which increases the temperature in the cylinder. As the temperature increase (also due the compression) the equilibrium of reaction R4 and R8 will shift and the production of ketohydroperoxides will decrease, leading to a reduction of cool flame heat release. [23] However, all fuels do not show this behaviour since the speed of the isomerization R5 is influenced by several factors such as carbon chain length and C-H bond type. In the isomerization the RO2 radical forms a ring-like transition state where the last oxygen atom approaches a hydrogen atom. This operation is fastest if the ring contains six or seven carbon atoms. Furthermore, the carbon hydrogen bond that breaks easiest is a tertiary C-H bond (The carbon atom is bonded to three other carbon atoms and just one hydrogen atom) and the strongest is a primary C-H bond (The carbon atom is bonded to just one carbon atom and three hydrogen atoms). [22] This means that long straight alkane chains, with many possible ring-like configurations and many reactive secondary bonds, are most prone to isomerization and short and branched alkane chains will not isomerizate to the same extent. If the isomerization is slow it will result in a lower amount of heat release at low temperatures. The reason for this is that it will favour other reactions, like oxidation of the alkane creating a HO2 radical and a stable olefin. The oxidation slows the ignition process down since the product of this reaction, HO2, is a very stable radical at low temperatures. The slow terminating reaction creating H2O2 according to the following reaction is almost the only path for this radical: [23, 24]

P. Risberg
32
2 HO2• → H2O2 + O2 (R 10)
This explains the auto-ignition quality of the reference fuels in the octane scale. The shorter and more branched isooctane, with the IUPAC2 name 2,2,4-tri-methyl-pentane (The longest carbon chain contains five carbon atoms), containing one tertiary C-H bond, two secondary C-H bonds and 15 primary C-H bonds, has a higher resistance to auto-ignition than the longer straight carbon chain of n-heptane (carbon chain contains seven carbon atoms) containing 10 secondary C-H bonds and six primary ones. The auto-ignition quality of the reference fuels in the cetane scale can be explained in the same way. Cetane (n-hexadecane) is a straight carbon chain containing 16 carbon atoms and it has a lower resistance to auto-ignition compared to hepta-methyl-nonane, a more branched molecule with the longest carbon chain containing just 9 carbon atoms. Another reaction pathway becomes dominant over 850K, as reaction R4 and R8 shifts towards dissociation and this terminates the first stage of combustion. In this path the alkyl radical will thermally decompose in a way that is similar regardless of fuel structure. The cool flame heat release is therefore not only dependent on fuel type but also engine condition. This can clearly be seen in Figure 5 where the rate of heat release is plotted against crank angle for a PRF 84 at the two operating conditions at 900 RPM. The operating conditions were Pin = 2 bar abs., Tin = 40 °C and λ = 4.0 and Pin = 1 bar abs., Tin = 100 °C and λ = 3.0.
2 IUPAC, the International Union of Pure and Applied Chemistry.

Describing the Auto-Ignition Quality of Fuels in HCCI Engines
33
0
100
200
300
400
500
600
700
-25 -20 -15 -10 -5 0 5 10 15Crank Angle Degrees [aTDC]
Rat
e of
Hea
t Rel
ease
[J/d
eg]
Boosted Intake Pressure
Atmospheric Intake Pressure
Main Heat Release
Cool Flames
Figure 5: The rate of heat release plotted against crank angle degree for the PRF 84 at the two operating conditions.
In Figure 5 it can be seen that the first stage heat release is much more prominent with boosted intake pressure. In this case the first stage of combustion starts around 20 CAD before TDC when the low temperature reactions become active. The low temperature heat release reaches its peak value three CAD later. The first stage of combustion ends at 14 CAD before TDC and the main heat release, triggered by the reactions R1-R3 starts a few CAD later. The peak cool flame heat release rate in the operating condition with atmospheric intake pressure is only around 15% of the peak cool flame heat release rate in the high pressure/low temperature operating condition. The knowledge of the two-stage ignition process also gives an understanding of the role of the tetra ethyl lead, previously used as an anti-knock additive in gasoline, where it inhibits the low temperature chemistry and by this prevents unwanted auto-ignitions. The ignition improvers in diesel fuels, such as 2-ethyl hexyl nitrate (2EHN) and di tertiary butyl peroxide (DTBP), work in the exact

P. Risberg
34
opposite manner and increase the heat release from the first stage combustion and thus decrease the ignition delay. [22, 24] As mentioned earlier, the chemistry of the auto-ignition process is very complicated. In the simple system hydrogen-oxygen, the reaction mechanism of the auto-ignition chemistry is well developed. The reaction mechanism contains 9 species participating in 32 reactions. As the complexity of the molecules increases, the more difficult it is to develop a model. It becomes more and more difficult to perform experimental studies of the reaction rates of certain reactions without the interference of other reactions. With small fuel molecules, such as methane, the reaction mechanism is rather well defined, but as the molecule size increases, the reaction rates in the reaction mechanism become more like educated guesses based on more familiar compounds of similar structure. In fact, the so called theoretical approach then becomes more of an empirical approach as the chemist estimates the reaction rates and verifies the hypothesis against experimental results. Simmie has written that “the design of reaction mechanism is still a black art with the majority being constructed on an ad hoc basis relying heavily on intuition, rules of thumb, etc. and building on previous sub-mechanism.”. This description is rather crude, but it describes the process quite well. [25, 26] Today the main reactions of the PRF mechanism are recognized. However, it will take years until the mechanism is fully understood and true predictive work can be done. A mechanism of a full boiling range fuel with hundreds of components with different chemical structures is far more complicated. Such a model is much further away in time, if it ever can be described properly. This is why an experimental or an empirical method is necessary.
3.2 Empirical Auto-Ignition Modeling In between the theoretical approach of kinetic modeling and the experimental auto-ignition tests there are also empirical approaches. A common empirical method used in engine modeling, both of engine knock in SI engines and combustion in the HCCI engine, is the method introduced by Livengood and

Describing the Auto-Ignition Quality of Fuels in HCCI Engines
35
Wu in 1955. In this method it is assumed that ignition occurs when the following integral reaches unity. [27]
( ) 1p,T
dtit
t i=
τ∫ (E 1)
Where τi is the induction time, t is the time of start of the reaction and ti is the time of ignition. The expression used for the induction time is based on the Arrhenius equation, but a term for the pressure dependence is added. The method was initially developed in tests in pressure vessels where the pressure and temperature was held constant during the ignition delay. In engine tests, this is however not the case, both the temperature and pressure increases with time and the following equation is used.
( ) ( )tTB
ni etpA −=τ (E 2)
For a PRF fuel Douand and Eyzat suggested the following parameters [28] A=0.01869(ON/100)3.4017 where ON is the octane number. n=1.7 B=3800 For toluene/n-heptane mixtures the pressure dependence is lower and n equal to 1.3 is suggested. Due to the more gasoline-like composition of the n-heptane/toluene mixture, it is likely that 1.3 is a good estimation for n also for conventional gasoline.[29] The Livengood and Wu approach basically tries to apply a single reaction rate to a global reaction, but as already mentioned the auto-ignition chemistry is very complicated. Already for a rather simple binary model fuel the reaction mechanism contains thousands of reactions where different reactions are dominating in different temperature and pressure regimes. The benefit with the Livengood and Wu method is that it is fast and it works rather well for a

P. Risberg
36
specified fuel in a limited pressure and temperature range, where the coefficients in the expression for the induction time were determined. Outside of this range the approach can be insufficient. This has recently been recognized by Yates et al [30] who have tried to express the ignition delay as a combination of a two stage, low temperature regime and a single stage high temperature regime and each stage is described by an Arrhenius equation. If instead a kinetic reaction mechanism would be used, the calculation could be time consuming and difficult to combine with engine simulation softwares. Perhaps the most important argument for the Livengood and Wu model is that a reaction mechanism for a full boiling range fuel does not exist.
3.3 Auto-Ignition Quality Tests There are different experimental methods used to describe the auto-ignition quality of real fuels. For gasoline-like fuels the octane tests, the Research Octane Number (RON) and the Motor Octane Number (MON), are universally accepted. For diesel-like fuels the cetane test is dominating, even though it may be replaced by the Ignition Quality Test (IQT) that has a better repeatability. A test called the Controlled Auto-ignition Number (CAN) describing the operating range of fuels in HCCI engines has been introduced by IFP. In this chapter these tests will be discussed further.
3.3.1 MON and RON In HCCI-combustion, a lean homogenous fuel-air mixture is compressed until it auto-ignites and the charge burns simultaneously without a flame front. An analogy can be made with engine knock in SI engines. Knock is an unwanted phenomenon that can cause severe engine damage and it is named after its characteristic knocking sound. In a knocking engine, the temperature and pressure in the premixed stochiometric fuel-air mixture ahead of the propagating flame front (also called the end-gas) become too high, which causes undesired auto-ignitions to occur. The auto-ignition processes in both the HCCI engine and knock in the SI-engine are controlled by the
Describing the Auto-Ignition Quality of Fuels in HCCI Engines
37
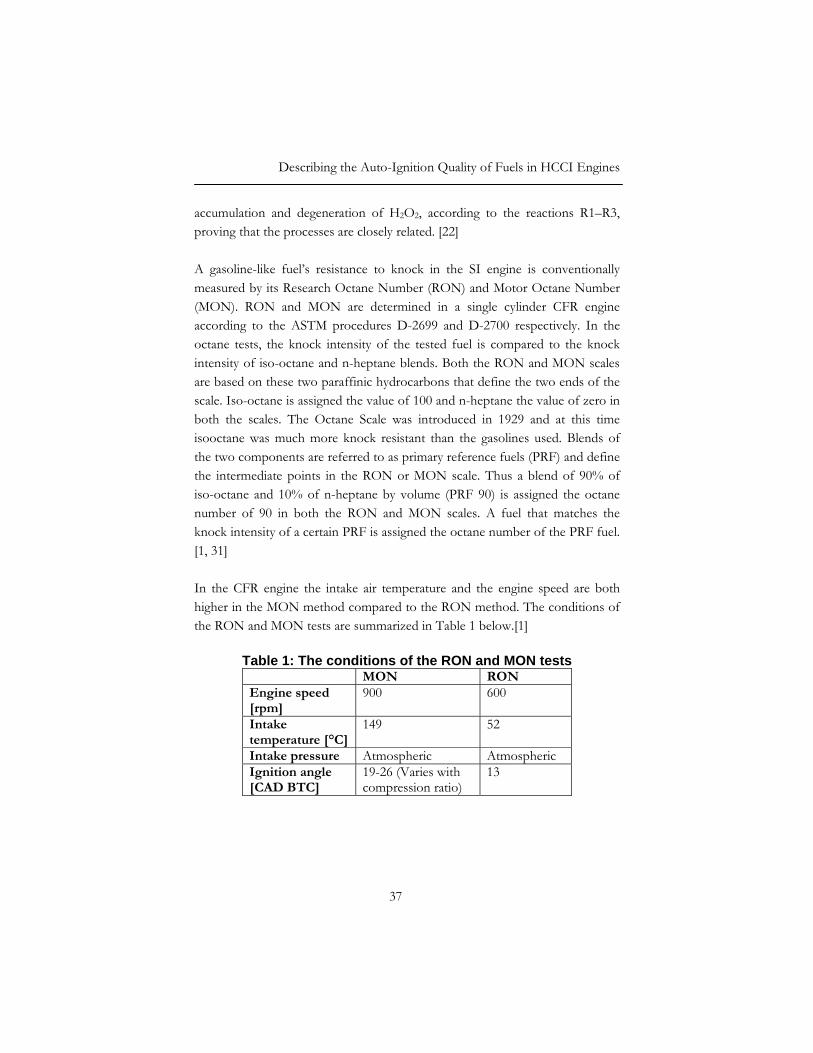
accumulation and degeneration of H2O2, according to the reactions R1–R3, proving that the processes are closely related. [22] A gasoline-like fuel’s resistance to knock in the SI engine is conventionally measured by its Research Octane Number (RON) and Motor Octane Number (MON). RON and MON are determined in a single cylinder CFR engine according to the ASTM procedures D-2699 and D-2700 respectively. In the octane tests, the knock intensity of the tested fuel is compared to the knock intensity of iso-octane and n-heptane blends. Both the RON and MON scales are based on these two paraffinic hydrocarbons that define the two ends of the scale. Iso-octane is assigned the value of 100 and n-heptane the value of zero in both the scales. The Octane Scale was introduced in 1929 and at this time isooctane was much more knock resistant than the gasolines used. Blends of the two components are referred to as primary reference fuels (PRF) and define the intermediate points in the RON or MON scale. Thus a blend of 90% of iso-octane and 10% of n-heptane by volume (PRF 90) is assigned the octane number of 90 in both the RON and MON scales. A fuel that matches the knock intensity of a certain PRF is assigned the octane number of the PRF fuel. [1, 31] In the CFR engine the intake air temperature and the engine speed are both higher in the MON method compared to the RON method. The conditions of the RON and MON tests are summarized in Table 1 below.[1]
Table 1: The conditions of the RON and MON tests MON RON Engine speed [rpm]
900 600
Intake temperature [°C]
149 52
Intake pressure Atmospheric Atmospheric Ignition angle [CAD BTC]
19-26 (Varies with compression ratio)
13

P. Risberg
38
The MON test has generally been considered to be the more severe of the two octane tests, due to the higher intake temperature and engine speed. [1, 31, 32] However, Leppard showed in his paper [33] that the “milder” RON test actually has higher maximum cylinder pressure, approximately 5 Bar higher peak pressure, than the MON test. The maximum temperature in the end-gas is however approximately 110 K higher in the MON test. Practical fuels have a higher RON value than MON value and the difference between RON and MON is called sensitivity. The fact that sensitive fuels are “degraded” in the MON test compared to the standard paraffinic PRF fuels has been taken as evidence that the MON test is more severe. [31, 32] However, if the auto-ignition scale would be based around a sensitive fuel: an aromatic, olefinic or oxygenate fuel, basically a fuel of any other chemistry than a paraffinic fuel, the paraffinic fuel would be considered to be super rated in the MON test. As mentioned earlier, there are many similarities between the auto-ignition process in the HCCI engine and knock in the SI engine, but there are also differences. In the HCCI engine the air fuel mixture is compressed by the piston. In the SI engine the end-gas is not only compressed by the piston, the compression from the propagating flame front also contributes to the pressure rise. The auto-ignition in knock takes place in a mixture that is close to stochiometric, while the mixture in the HCCI engine is lean. The question is therefore if RON and MON accurately can describe the auto-ignition quality of gasoline-like fuels in HCCI engines.
3.3.2 The Cetane Number Diesel fuels are far more prone to auto-ignition and less volatile than gasoline-like fuels and usually it is not possible to measure their RON and MON. The measure of auto-ignition quality of diesel-like fuels that is used today is the cetane number. In the cetane test, the fuel is direct-injected 13 CAD BTDC in the CFR test engine and the compression ratio is adjusted until the combustion starts at TDC. Since the fuel is direct-injected, not only the chemical properties

Describing the Auto-Ignition Quality of Fuels in HCCI Engines
39
affect the ignition delay, also the physical properties of the fuel affect play a significant role. In Table 2 the cetane test conditions are presented. [1]
Table 2: The conditions in the Cetane test Cetane Test Engine speed [rpm] 900 Intake temperature [°C]
65.6
Intake pressure Atmospheric Injetion Pressure [MPa]
10.3
The cetane scale is based on two paraffinic fuels, cetane (n-hexadecane) and isohexadecane, i.e. hepta methyl nonane (HMN), where cetane is assigned the cetane number 100 and hepta methyl nonane has the cetane number 15 (It replaced alfa-methylnaphtalene that originally represented cetane number zero). The cetane number can be calculated according to the following equation. [1, 31]
CN = % n-cetane + 0.15 × % HMN (E 3)
The tested fuel is then given the cetane number, calculated from equation E3, of the n-cetane/HMN mixture with the same ignition delay, resulting in combustion at TDC, with the same compression ratio. The cetane test has a poor repeatability, which has made the cetane index a common method of determining the auto-ignition quality of diesel fuels. The cetane index is calculated from the properties of the fuel, such as density and boiling point. [31] It is somewhat confusing when speaking of auto-ignition quality in a diesel and in a gasoline perspective. In a gasoline perspective, a high auto-ignition quality is a high resistance to auto-ignition and engine knock, which supposed to be a fuel with a high octane number. In a diesel perspective, high auto-ignition

P. Risberg
40
quality is a fuel with a low resistance to auto-ignition and a short ignition delay, which is a fuel with a high cetane number.
3.3.3 IQT Test The Ignition Quality Test (IQT), is gaining more and more ground, due to the poor repeatability of the cetane test. The IQT test is done in a constant volume pressure vessel. The fuel is injected into air with a controlled pressure and temperature. The charge air temperature is set to 545 ± 30 °C and the charge air pressure is 2.137 ± 0.007 MPa. A fuel sample of approximately 100 ml is required for a test. The ignition delay (ID), the time between the start of injection until the start of combustion, is measured and an average of 32 firings is calculated. The Derived Cetane Number (DCN) can be calculated from the ignition delay with the following equation. [34, 35]
DCN = 83.99(ID-1.512)-0.658 + 3.547 (E 4)
This method measures the ignition delay within the range 3.3-6.4 ms (60 to 33 DCN) with a good precision. The method also works outside of this region, but the accuracy may be affected. [34]
3.3.4 CAN Test The Controlled Auto-ignition Number (CAN) does not exactly describe the auto-ignition quality of a fuel at a certain operating condition as the classical auto-ignition numbers does. CAN is intended to describe the size of the operating range (Defined by limits in indicated mean effective pressure, IMEP, and engine speed range) in comparison with regular gasoline. The limits of the operating range are defined by the following criteria [36]:
• The maximum load is limited by the combustion noise. The limit is set at 90 db. (The combustion noise is closely related to the pressure rise

Describing the Auto-Ignition Quality of Fuels in HCCI Engines
41
rate combined with the engine speed.) Also a maximum NOx level is mentioned, but the level used is never displayed.
• The low load is limited by the combustion stability, where the coefficient of variation, CoV, of the IMEP should be below five percent to be considered acceptable.
The CAN number can be determined using both direct-injection and port fuel injection. The intake air temperature is set to 35 °C and the intake pressure to 980 mbar. Both external and internal EGR (Exhaust Gas Recycling) can be used in the test. [36] The operating range is split into four different areas to make the comparison between fuels more informative:
• Low engine speed/ low load • Low engine speed/ high load • High engine speed/ low load • High engine speed/ high load
There is no doubt that the operating range of the HCCI engine is an important area to study and the fuel plays a key role in expanding the operation window. However, the test procedure in determining the CAN is a bit unclear. There are several parameters that can be varied: injection system, injection angle, internal and external EGR concentration, which makes the comparison between different fuels tested at widely different engine configurations a bit vague. Clearly, the test considers not just the auto-ignition quality of fuels rather the entire concept of fuel and engine and its operating range, which of course also is important and interesting in a research perspective. However, the CAN test is a completely different test compared to the previously considered tests that describes the auto-ignition quality of fuels. Furthermore, it might also be necessary to introduce a maximum level for smoke that indicates that the charge is sufficiently homogenous in all cases. Also an efficiency level, restricting the operating range, would also be beneficial to make the comparisons of operating ranges more fair.
P. Risberg
42
4 Experimental Details In this chapter the test bed and the fuels used during the tests are briefly introduced.
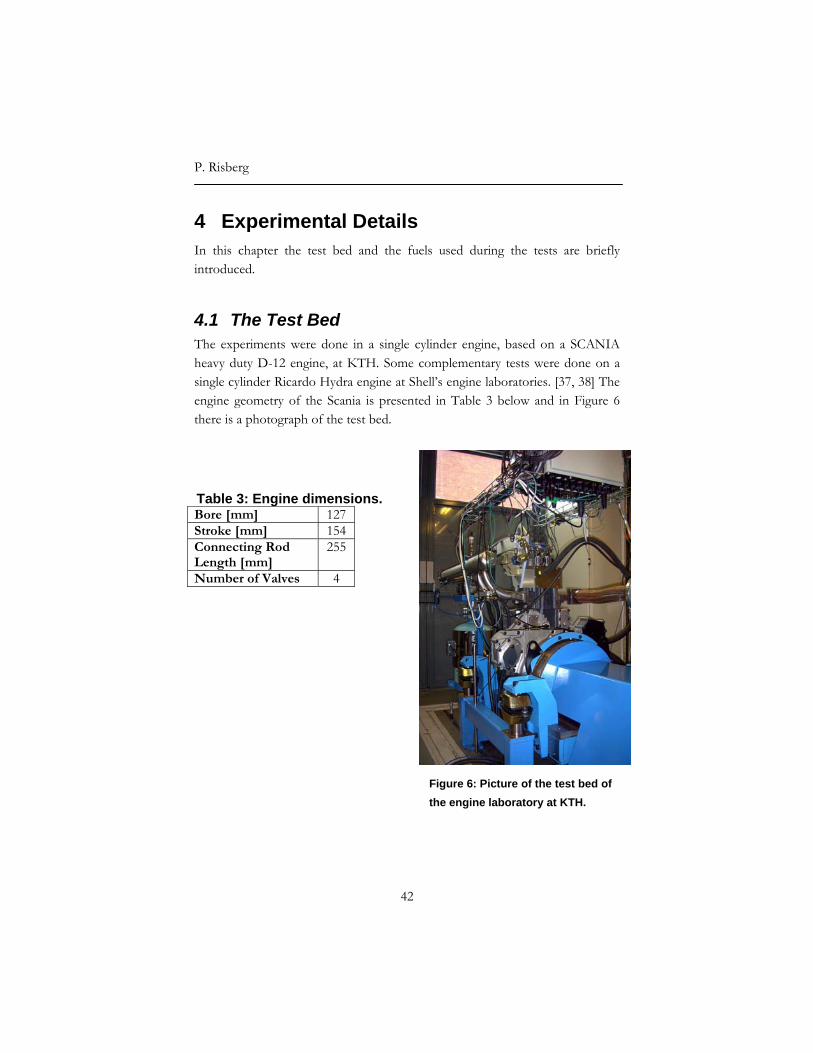
4.1 The Test Bed The experiments were done in a single cylinder engine, based on a SCANIA heavy duty D-12 engine, at KTH. Some complementary tests were done on a single cylinder Ricardo Hydra engine at Shell’s engine laboratories. [37, 38] The engine geometry of the Scania is presented in Table 3 below and in Figure 6 there is a photograph of the test bed.
Table 3: Engine dimensions. Bore [mm] 127Stroke [mm] 154Connecting Rod Length [mm]
255
Number of Valves 4
Figure 6: Picture of the test bed of the engine laboratory at KTH.

Describing the Auto-Ignition Quality of Fuels in HCCI Engines
43
The engine system is very flexible with a large set of parameters that can be changed and controlled. There are a set of changeable pistons of different compression ratios and geometries suitable for different injection strategies. For example, flat, shallow bowl and deep bowl pistons in the compression ratio range between 12 and 18. Furthermore, two different injection systems were used in these tests, port fuel injection and direct-injection with a common rail system together with a large range injection nozzles of different types. Boost pressure could be supplied, when desired, by an external compressor. The engine could also be equipped with a Lotus Active Valve Train System (AVT system) that made it possible to change valve profiles while the engine was running. The AVT system has, instead of the conventional camshafts, a hydraulically operated system controlled by a computer that contains a matrix of valve profiles that can include up to 255 predefined valve profiles. During tests with internal EGR, in PAPER III, this tool was used to change the valve profiles. External EGR could be supplied from a spark ignited SAAB B205R engine working at or close to stochiometric conditions. The exhaust gases from the SI engine working at stationary conditions were used instead of recycling the exhaust gases from the single cylinder engine. This was done to obtain a fast and stable system that makes it possible to blend the wanted gas composition without the EGR quality being affected by changes in lambda and combustion phasing. The external EGR gases went through a catalyst and were then cooled before mixing with the pure intake air. The cylinder pressure was measured with a water-cooled piezo electrical pressure transducer. The heat release was calculated from the collected pressure signal. The exhaust gas concentrations were measured with a Horiba EXSA 1500 exhaust gas analyzer. The opacity, for soot measurements, was measured with an AVL opacimeter 439.

P. Risberg
44
4.2 The Fuels
4.2.1 Gasoline-Like Fuels The gasoline-like fuels used in the experiments can be divided into five subgroups of different chemistries,
• Paraffinic fuels (Saturated hydrocarbons) blended from isooctane and n-heptane (so called Primary Reference Fuels, PRF)
• Aromatic fuels blended from toluene and n-heptane, • An olefinic (component containing a double bond) blend containing
diisobutylene (DIB), n-heptane and isooctane • An oxygenate blend of ethanol, n-heptane and isooctane • Full boiling range gasoline
In Table 4 some properties of the model fuel components and the unleaded gasoline are presented.
Table 4: Fuel properties
Unleaded Gasoline Isooctane n-
Heptane Toluene Di-iso-butylene Ethanol
IUPAC Name Unleaded Gasoline
2.2.4-tri-methyl-pentane
Heptane Methyl-benzene
2.4.4-tri metyl pentene
Ethanol
Summary formula C8H18 C7H16 C7H8 C8H16 C2H6O
Molecule weight [g/mol] 114.23 100.20 92.14 112.22 46.07
RON 94.7 100 0 116.9 103.5 120 MON 85.9 100 0 104.5 86.8 106
Boilingpoint [°C]
32.5-176.5 99.2 98.5 110.6 101 78.2
Density [kg/m3] 726.3 692 631.7 867 720 785
Stochiometric Air-Fuel ratio 14.59 15.13 15.18 13.50 14.78 9.00
Heat of stochiometric combustion [MJ/kg Air]
2.96 2.93 2.94 3.00 3.00 2.99
Heat of Vaporisation
[KJ/litre ] 263.6 213.2 290.9 357.6 205.3 724.2
Describing the Auto-Ignition Quality of Fuels in HCCI Engines
45
The final boiling points of the full boiling range fuels are below 180°C while the components used in the other blends all boil below 111°C. It is expected that the fuels would be fully vaporized and mixed with air before auto-ignition occurs. For the PRF fuels and the n-heptane toluene mixtures, RON and MON were determined by definition and by well established correlations. The octane numbers for the other fuels were measured in the standard tests. The fuels were blended so that several fuels have the same RON value, but different MON values. This is important so that both the effect of RON and the sensitivity can be studied independent of each other.
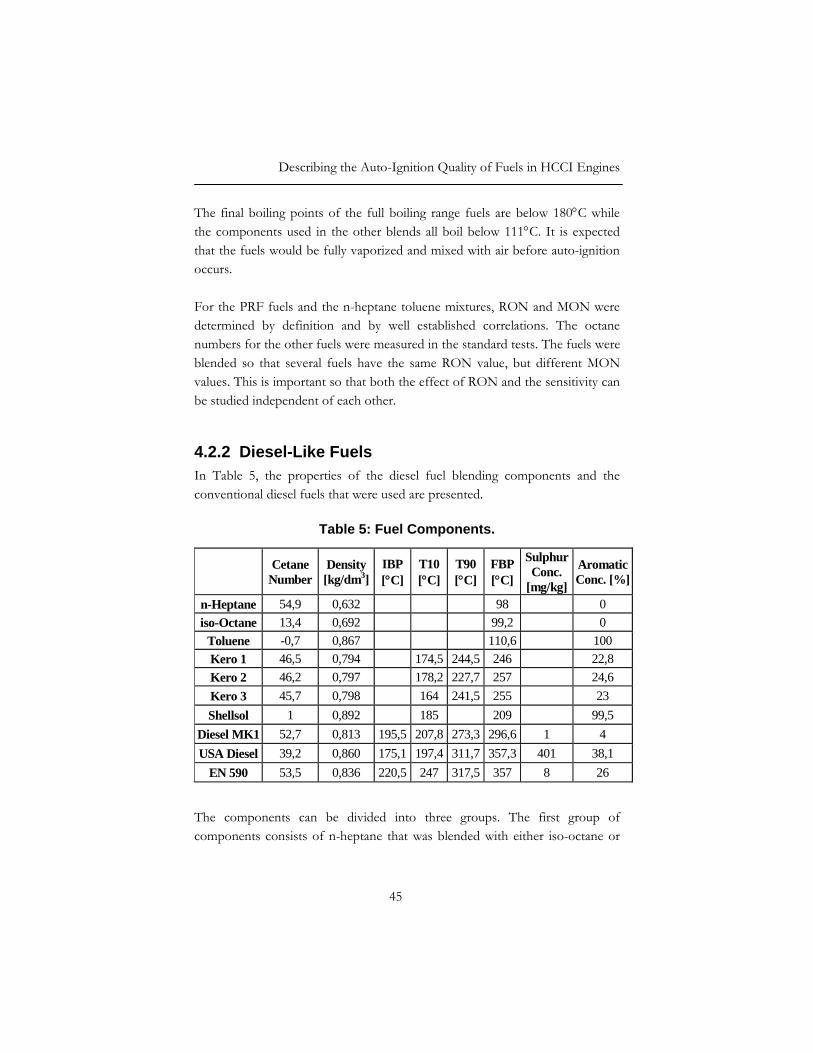
4.2.2 Diesel-Like Fuels In Table 5, the properties of the diesel fuel blending components and the conventional diesel fuels that were used are presented.
Table 5: Fuel Components.
The components can be divided into three groups. The first group of components consists of n-heptane that was blended with either iso-octane or
Cetane Number
Density [kg/dm3]
IBP [°C]
T10 [°C]
T90 [°C]
FBP [°C]
Sulphur Conc.
[mg/kg]
Aromatic Conc. [%]
n-Heptane 54,9 0,632 98 0 iso-Octane 13,4 0,692 99,2 0
Toluene -0,7 0,867 110,6 100 Kero 1 46,5 0,794 174,5 244,5 246 22,8 Kero 2 46,2 0,797 178,2 227,7 257 24,6 Kero 3 45,7 0,798 164 241,5 255 23 Shellsol 1 0,892 185 209 99,5
Diesel MK1 52,7 0,813 195,5 207,8 273,3 296,6 1 4 USA Diesel 39,2 0,860 175,1 197,4 311,7 357,3 401 38,1
EN 590 53,5 0,836 220,5 247 317,5 357 8 26
P. Risberg
46
toluene. Together they make up the light diesel-like fuels, fuels with low boiling points that can be blended to similar cetane numbers as conventional diesel fuels. The maximum boiling point of these components is toluene’s which is 110.6° C. The use of these light compounds guarantees a homogenous charge without the interference of the mixture formation; therefore just the auto-ignition quality is studied in tests with PFI. A lubricity additive was added to make it possible to use these fuels also in a common rail system. The second group of components are the kerosenes that were blended with Shellsol, an aromatic solvent, to obtain the required cetane numbers. The boiling point range of these fuels was between 150 °C and 250 °C. The final fuel group is made up of commercial diesel fuels, with boiling point ranging between 175 – 357 °C. These are represented here by Swedish diesel environmental class 1 (MK1), American diesel and European diesel (EN 590).

Describing the Auto-Ignition Quality of Fuels in HCCI Engines
47
5 Auto-Ignition Quality of Gasoline-like fuels
In this chapter a summary of the results with the experiments with gasoline-like fuels from PAPER I, PAPER II, PAPER III and PAPER V are presented.
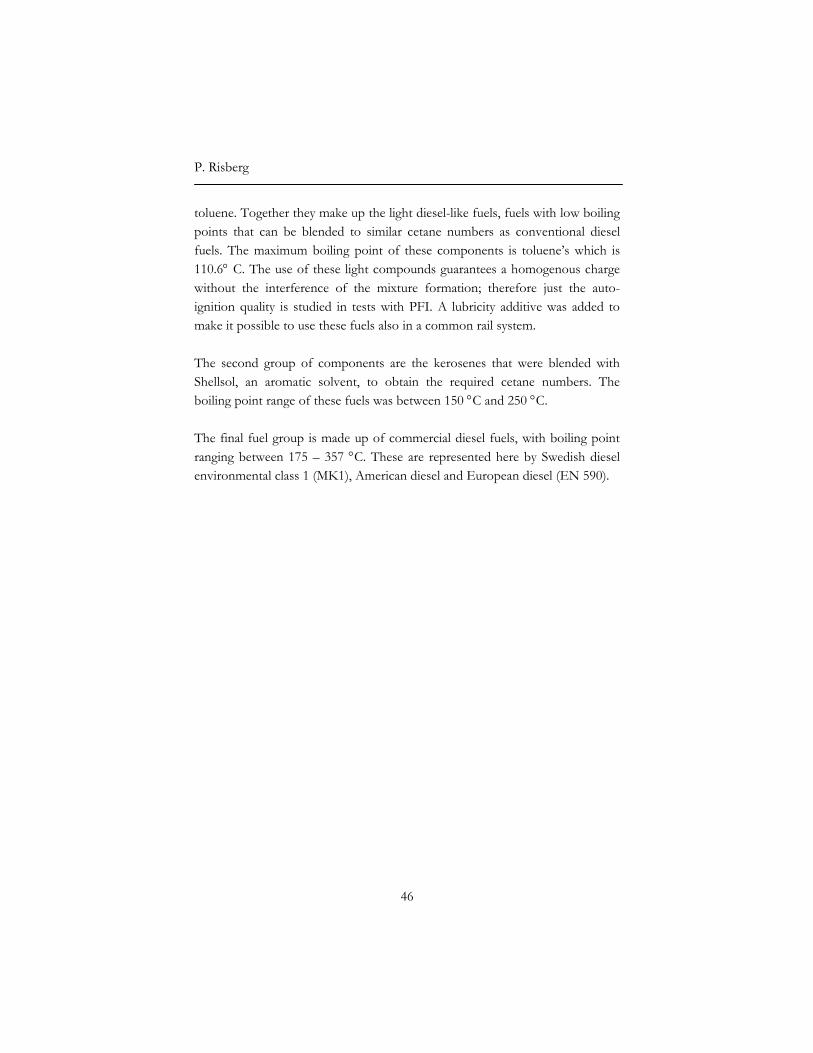
5.1 Experimental Procedure In the experiments with gasoline-like fuels, fuels of various chemistries and different RON and MON values were port fuel injected and made to experience the same temperature and pressure history. The time of ignition is then dependent on their resistance to auto-ignition. During an experiment, the engine speed, intake temperature and pressure were held constant, ensuring the same temperature and pressure history, and the fuel flow was increased until a determined lambda was obtained. This procedure was repeated for several different model fuels and full boiling range fuels. Figure 7 is a plot of cylinder pressure against CAD from tests, presented in PAPER II, with intake temperature 80 °C and 1 bar boost pressure, 900 rpm and lambda 3.5 with three different fuels, a PRF fuel of octane number 84, a toluene – n-heptane mixture (TRF fuel) with RON value 83.9 and MON value 73.2 and a full boiling range fuel with RON 83.6 and MON 77.1. In Figure 7 it can be seen that the pressure increases as the piston is moving towards TDC. It is also evident that the fuels have experienced the same pressure history until around 15 CAD before TDC where they ignite at different points. The temperature trace up to 15 CAD BTDC was the same for all tested fuels.
P. Risberg
48
0
20
40
60
80
100
120
-70 -60 -50 -40 -30 -20 -10 0Crank Angle [deg aTDC]
Cyl
inde
r Pre
ssur
e [B
ar]
Toluene/n-heptane
Full boiling range
PRF
Figure 7: Cylinder pressure plotted against CAD for three different fuels that experiences the same pressure history.
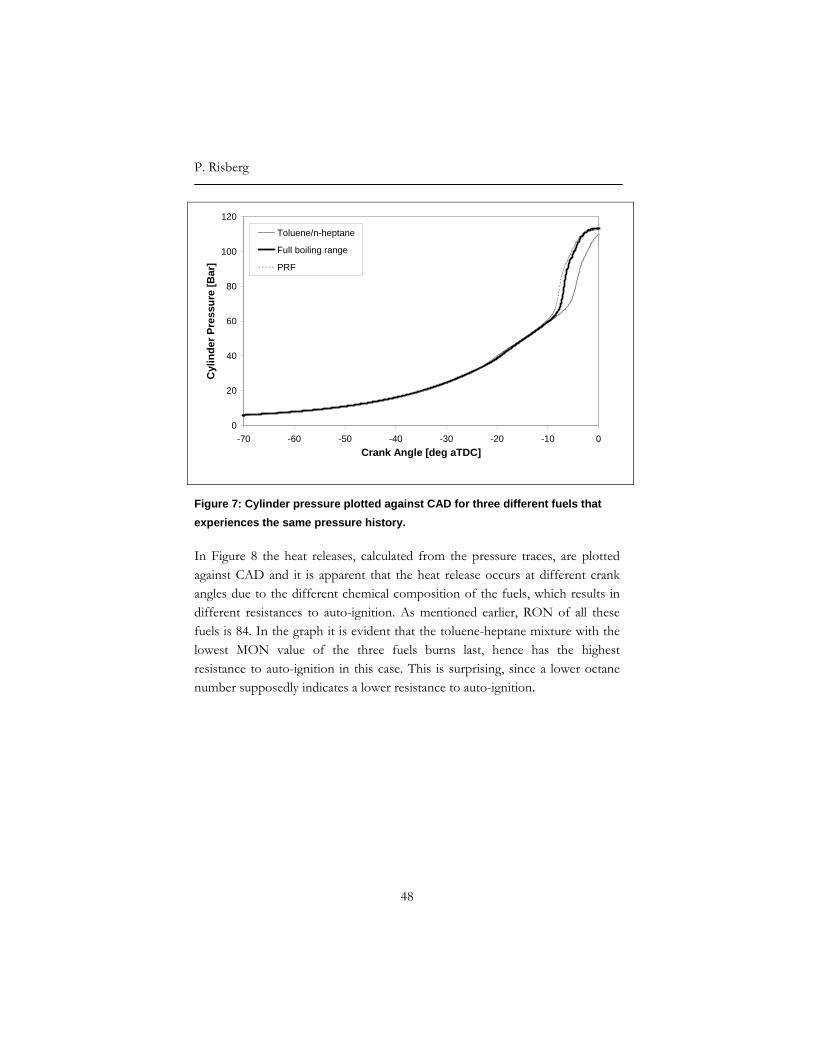
In Figure 8 the heat releases, calculated from the pressure traces, are plotted against CAD and it is apparent that the heat release occurs at different crank angles due to the different chemical composition of the fuels, which results in different resistances to auto-ignition. As mentioned earlier, RON of all these fuels is 84. In the graph it is evident that the toluene-heptane mixture with the lowest MON value of the three fuels burns last, hence has the highest resistance to auto-ignition in this case. This is surprising, since a lower octane number supposedly indicates a lower resistance to auto-ignition.
Describing the Auto-Ignition Quality of Fuels in HCCI Engines
49
Figure 8: Rate of heat release plotted against crank angle for three different fuels tested at the same intake conditions.
In this work CA50, the crank angle degree where 50 % of the accumulated heat release occurs, was chosen to represent the combustion angle and therefore also the auto-ignition quality of a fuel. CA50 rather than an earlier point like CA5 was chosen because it describes the overall heat release better, which corresponds to the engine performance. Another reason is that an earlier point will be much more influenced by the first stage reactions. In these tests, model fuels of different compositions have been used and the size of the cool flame is heavily influenced by the composition of the fuel. This makes it more appropriate to use CA50.
-100
0
100
200
300
400
500
600
700
800
-40 -30 -20 -10 0 10 20 30 40
Crank Angle [deg aTDC]
Rat
e of
Hea
t Rel
ease
[J/d
eg]
Toluene/n-heptaneFull boiling rangePRF

P. Risberg
50
5.2 Limitations of RON and MON In Figure 9, CA50 is plotted against MON for 8 fuels of different chemistries that have experienced the same temperature and pressure history. The condition during these tests was the same as in the case presented in Figure 7 and 8, 1 bar boost pressure 80 °C intake temperature, 900 rpm and lambda 3.5.
Figure 9: CA50 plotted against MON for 8 fuels of different chemistries that have experienced the same temperature and pressure history prior to ignition.
In Figure 9 it is obvious that CA50 varies randomly with MON i.e. MON does not describe the auto-ignition quality of the tested fuels at this condition. The coefficient of determination, R2 is 0. In Figure 10, the same data is plotted against RON instead.
R2 = 0,0296
-8
-7
-6
-5
-4
-3
-2
-1
0
1
60 65 70 75 80 85 90 95 100
MON
CA
50 [d
eg a
TDC
]
Describing the Auto-Ignition Quality of Fuels in HCCI Engines
51
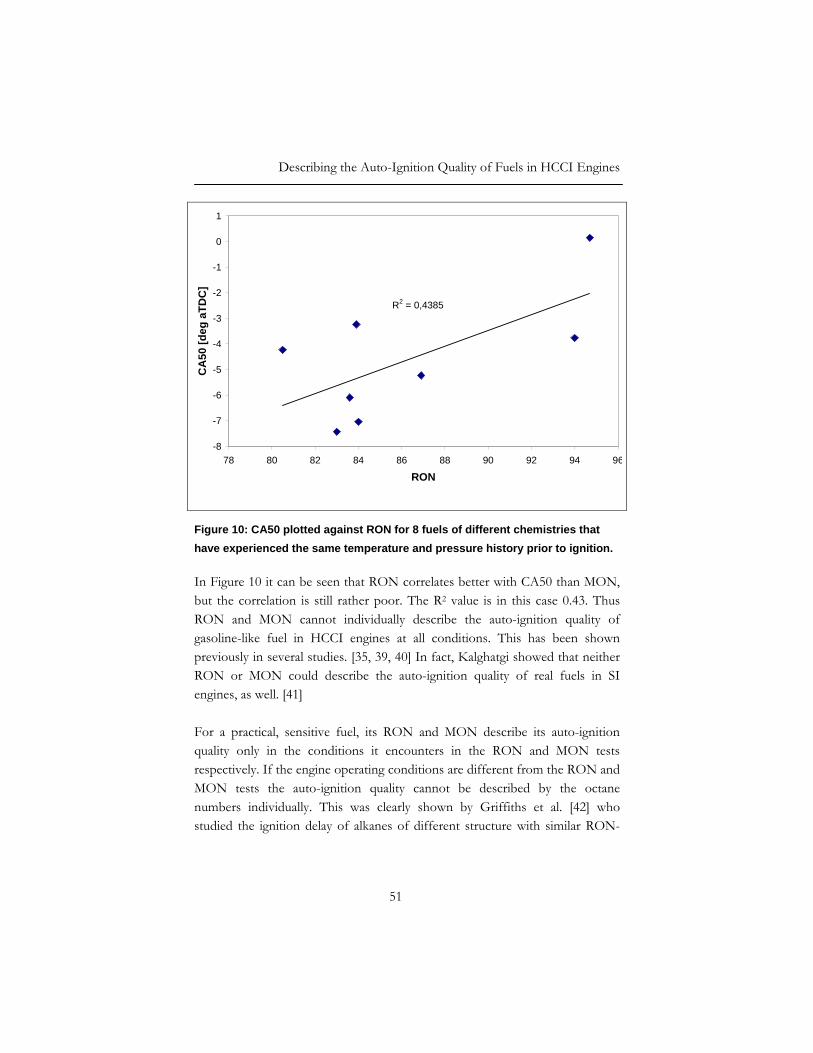
Figure 10: CA50 plotted against RON for 8 fuels of different chemistries that have experienced the same temperature and pressure history prior to ignition.
In Figure 10 it can be seen that RON correlates better with CA50 than MON, but the correlation is still rather poor. The R2 value is in this case 0.43. Thus RON and MON cannot individually describe the auto-ignition quality of gasoline-like fuel in HCCI engines at all conditions. This has been shown previously in several studies. [35, 39, 40] In fact, Kalghatgi showed that neither RON or MON could describe the auto-ignition quality of real fuels in SI engines, as well. [41] For a practical, sensitive fuel, its RON and MON describe its auto-ignition quality only in the conditions it encounters in the RON and MON tests respectively. If the engine operating conditions are different from the RON and MON tests the auto-ignition quality cannot be described by the octane numbers individually. This was clearly shown by Griffiths et al. [42] who studied the ignition delay of alkanes of different structure with similar RON-
R2 = 0,4385
-8
-7
-6
-5
-4
-3
-2
-1
0
1
78 80 82 84 86 88 90 92 94 96
RON
CA
50 [d
eg a
TDC
]

P. Risberg
52
values at different conditions in a rapid compression machine. Their results clearly showed that the ignition delay of the different fuels only were similar in certain regions. A single measure will therefore not describe the auto-ignition quality of gasoline-like fuels accurately at all conditions. The reason for this is that the auto-ignition chemistry of the paraffinic primary reference fuels, the backbone of the octane scale, is quite different from the auto-ignition chemistry of commercial fuels and model fuels containing aromatics, olefins or oxygenates. The auto-ignition chemistry of fuels of different chemistry has different temperature and pressure dependence. Paraffins are super rated in the MON test because of the phenomenon of Negative Temperature Coefficient (NTC) that is almost unique for fuels of paraffinic chemistry. (This phenomenon has also been observed in Olefinic auto-ignition chemistry, but to a much lesser extent.) According to classical Arrhenius kinetics the reaction rate increases with an increasing temperature, according to the following equation. [24].
( ) RTE
eATk−
= (E 5)
However, as shown earlier in Figure 5, paraffins exhibit a two-stage ignition with low temperature heat release at some conditions. This phenomenon is somewhat abnormal since their reaction rate decreases after the cool flames, even though the temperature still continues to increase during the compression. This behaviour is called NTC. Leppard showed in his paper that the NTC region became more pronounced with increasing temperature, lower pressure and higher engine speed. Aroonsrisopon et al. confirmed in their work that the cool flame heat release decreased with higher intake temperatures for paraffins. This is also the case in Figure 5 where the case with atmospheric intake pressure and high intake temperature show significantly less cool flames than the case with high pressure and low temperature. All of these factors point in the direction that the cool flames decrease and the NTC phenomena is more pronounced in the MON

Describing the Auto-Ignition Quality of Fuels in HCCI Engines
53
test than in the RON test, hence the paraffins are super rated in the MON test. [33, 39] Low temperature reactive fuels are mainly alkanes; however, fuels of all chemical composition can exhibit cool flames. For example, Tanaka showed that olefins also can exhibit cool flames. In fact, it is probable that fuels of all chemistries can exhibit cool flames as long as they are paraffin-like, such as alcohols or olefins containing long carbon chains or even aromatics coupled to long straight carbon chains. However, such compounds will be prone to auto-ignition and are therefore more diesel-like than gasoline-like. [24] Leppard showed that most paraffinic fuels have a low sensitivity- low value of RON - MON. He also showed that some olefins with long straight carbon chains, i.e. paraffinc structure, also have got a sensitivity close to zero. This indicates that the sensitivity could be seen as a measure of the low temperature reactivity of a fuel, where a low sensitivity would indicate a low temperature reactive fuel. [33] However, isooctane and n-heptane, the foundation of the octane scale, both have zero sensitivity by definition and their cool flame reactivity is clearly different from each other. According to the theory presented in chapter 3.1, the long straight carbon chain n-heptane is said to be more low temperature reactive than the shorter and more branched carbon chain of isooctane. This is confirmed by Sjöberg who did not find any cool flame reactivity for pure isooctane, but found significant low temperature activity for n-heptane isooctane mixtures, indicating a lower reactivity of isooctane at low temperatures. [43, 44] Tanaka ranked the cool flame reactivity of ten different fuels with different chemical composition: paraffins, olefins and aromats, in tests with a rapid compression machine. In these tests he proved that the six fuels with the lowest sensitivity, both alkanes and alkenes, including both isooctane and n-heptane, exhibited cool flames and the four other fuels of olefinic and aromatic chemistry did not exhibit a two-stage ignition. However, the low temperature
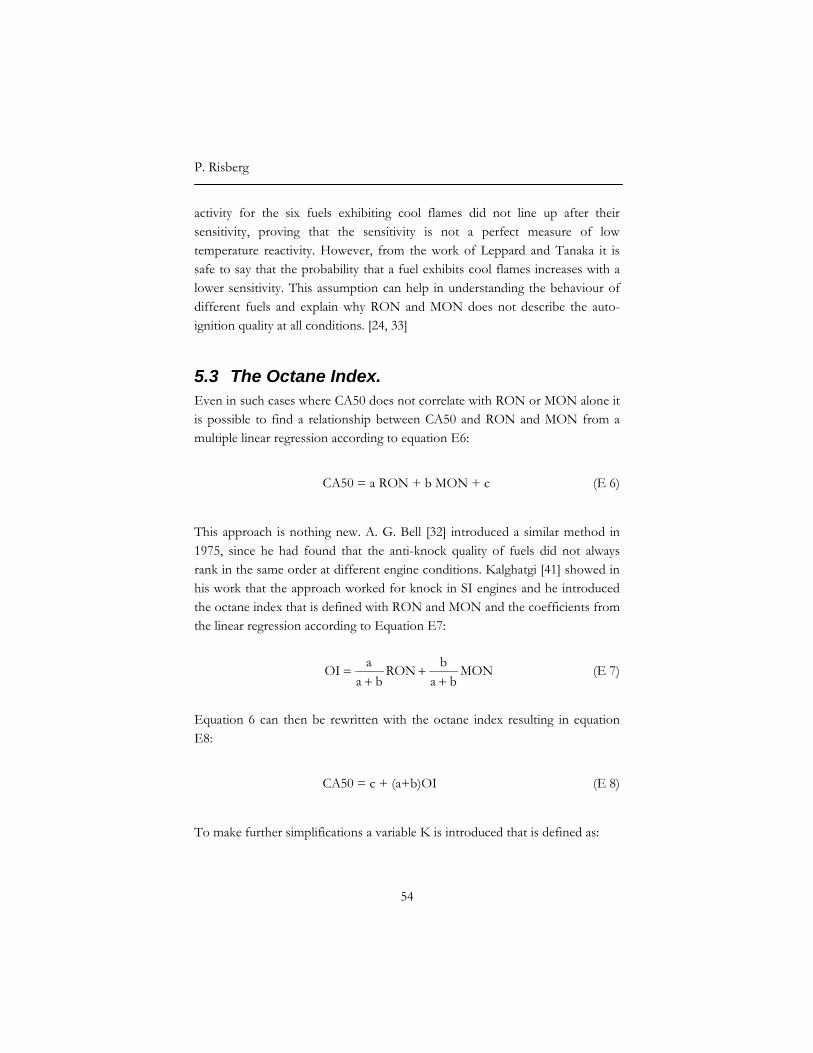
P. Risberg
54
activity for the six fuels exhibiting cool flames did not line up after their sensitivity, proving that the sensitivity is not a perfect measure of low temperature reactivity. However, from the work of Leppard and Tanaka it is safe to say that the probability that a fuel exhibits cool flames increases with a lower sensitivity. This assumption can help in understanding the behaviour of different fuels and explain why RON and MON does not describe the auto-ignition quality at all conditions. [24, 33]
5.3 The Octane Index. Even in such cases where CA50 does not correlate with RON or MON alone it is possible to find a relationship between CA50 and RON and MON from a multiple linear regression according to equation E6:
CA50 = a RON + b MON + c (E 6)
This approach is nothing new. A. G. Bell [32] introduced a similar method in 1975, since he had found that the anti-knock quality of fuels did not always rank in the same order at different engine conditions. Kalghatgi [41] showed in his work that the approach worked for knock in SI engines and he introduced the octane index that is defined with RON and MON and the coefficients from the linear regression according to Equation E7:
MONba
bRONba
aOI+
++
= (E 7)
Equation 6 can then be rewritten with the octane index resulting in equation E8:
CA50 = c + (a+b)OI (E 8)
To make further simplifications a variable K is introduced that is defined as:
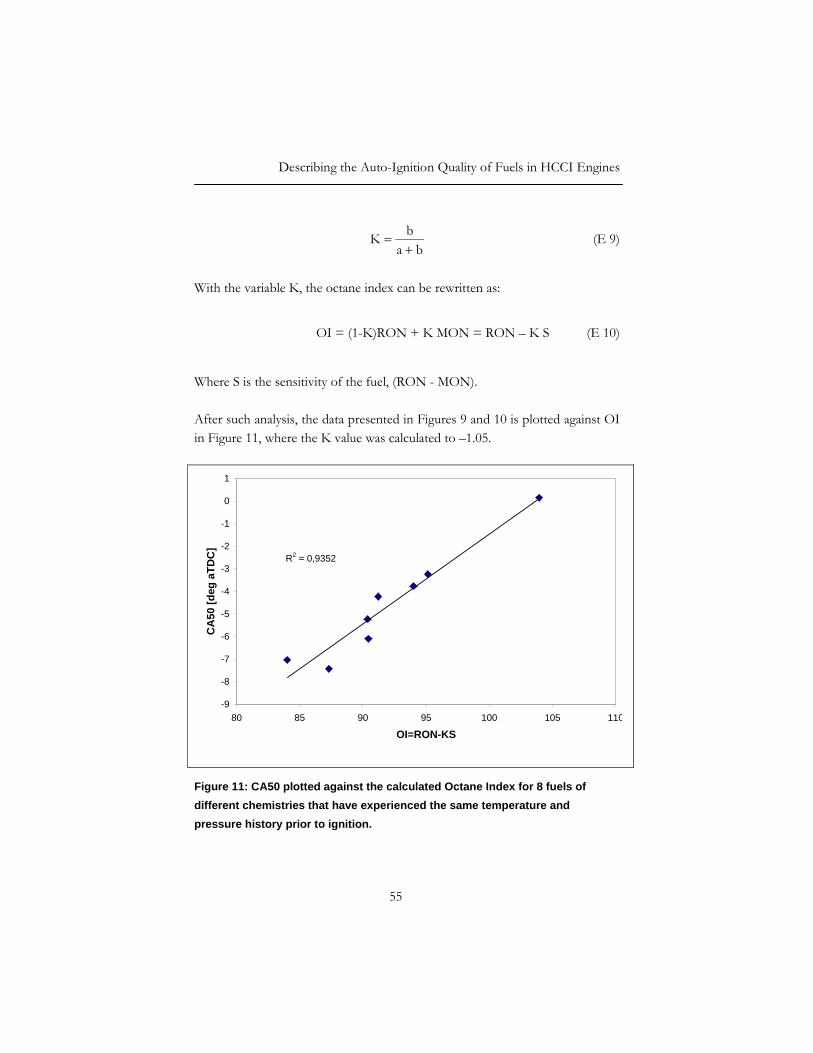
Describing the Auto-Ignition Quality of Fuels in HCCI Engines
55
babK+
= (E 9)
With the variable K, the octane index can be rewritten as:
OI = (1-K)RON + K MON = RON – K S (E 10)
Where S is the sensitivity of the fuel, (RON - MON). After such analysis, the data presented in Figures 9 and 10 is plotted against OI in Figure 11, where the K value was calculated to –1.05.
Figure 11: CA50 plotted against the calculated Octane Index for 8 fuels of different chemistries that have experienced the same temperature and pressure history prior to ignition.
R2 = 0,9352
-9
-8
-7
-6
-5
-4
-3
-2
-1
0
1
80 85 90 95 100 105 110
OI=RON-KS
CA
50 [d
eg a
TDC
]

P. Risberg
56
From Figure 11 it can be concluded that the correlation between CA50 and the OI is far superior to the correlation between CA50 and RON or MON. The R2 value in this case is 0.94. This shows that both RON and MON are necessary to describe a fuel’s resistance to auto-ignition at a certain engine condition. In Figure 12, the OI is plotted against K for the three fuels presented in the previous figures 7 and 8: a PRF of RON and MON of 84, a TRF with RON value 83.9 and MON value 73.2 and a full boiling range gasoline with RON 83.6 and MON 77.1.
Figure 12: The octane index plotted against K-value for three different fuels with different octane qualities.
Plotting the octane index of a fuel against the K-value results in a straight line, according to equation E10. The slope of the line is the negative sensitivity of the fuel and the line crosses the y-axis at the RON value of the fuel. For primary reference fuels, by definition, RON equals MON, in other words, the sensitivity equals zero, which results in a horizontal line in Figure 12. The OI of
60
65
70
75
80
85
90
95
100
105
110
-2,5 -2 -1,5 -1 -0,5 0 0,5 1 1,5 2 2,5K-value
Oct
ane
Inde
x
Full Boiling Range FuelRON 83,6MON 77,1
MON Conditions
RON Conditions
PRF RON 84 MON 84
TRFRON 83,9MON 73,2

Describing the Auto-Ignition Quality of Fuels in HCCI Engines
57
a PRF fuel does therefore not depend on the value of K and is the same as its RON or MON at all engine conditions. Also by definition, at RON test conditions the K-value equals zero and at MON test conditions the K-value equals one. However, the K-value can both be above one, beyond MON conditions, and below zero, beyond RON conditions. For a real fuel which is not a simple binary mixture of iso-octane and n-heptane, RON differs from its MON, and OI depends on the value of K as well as its RON and MON. The OI of a sensitive fuel is the equivalent of the octane number of a PRF with the equal auto-ignition quality at the tested condition. The TRF fuel has got the highest OI of the three fuels at the K-value -1.05, as it can be seen in Figure 12. This indicates that the TRF fuel has the highest resistance to auto-ignition at this condition, as confirmed by the results from the engine tests presented in Figure 8. In fact this fuel, with the same RON as the other fuels in this example and the lowest MON, has got the highest OI at all conditions beyond the RON test. When the K-value rises above one it is clear that the same fuel has got the lowest resistance to auto-ignition of the three fuels. However, to calculate the OI it is necessary to combine RON and MON in the right way, which requires knowledge of the K-value. If the value of K was to change randomly or unpredictably with engine conditions it would all be just a curiosity.

P. Risberg
58
5.4 The Influence of Engine Parameters on OI In Bell’s work trying to describe auto-ignition quality in the SI engine he did not use the term K-value, instead he wrote of engine severity. He considered the RON test the milder of the two octane tests, due to the lower engine speed and the lower intake temperature. According to Bell, the severity of the engine condition was mainly influenced by the engine speed. However, he also stated that an engine working at low engine speed with little or no inlet air heating can become even milder than in the research test, implying negative K-values. He also stated that an increased intake air heating can make the conditions more severe, i.e. increasing the K-value, hinting that the temperature and pressure history also influences the K-value. [32] Similarly, Kalghatgi found, in his work on knock in SI engines, that the K-value increased with higher engine speed. He also found that as the temperature in the end-gas decreased for a given pressure, the K-value also decreased, indicating that the K-value is varying with different engine conditions. [41]
5.4.1 Temperature and Pressure In Figure 13, the temperature during the compression is plotted against the corresponding pressure for five different cases, three representing HCCI tests and two representing the octane tests. Each of the lines in Figure 13 can be seen as an engine characteristic. The unburnt air-fuel mixture will move along one of these lines as it is compressed. The temperature and pressure history will deviate from the engine characteristic as the auto-ignition chemistry comes into play at different positions depending on the fuel. In the HCCI engine this compression takes place because of the movement of the piston, while in the knocking SI-engine the propagating flame front will also contribute to the increase in pressure.

Describing the Auto-Ignition Quality of Fuels in HCCI Engines
59
Figure 13: The temperature during the compression plotted against the corresponding pressure for five different cases.
Figure 13 shows that broadly, as the compression temperature for a given pressure decreases, the K value decreases. Of course, the various conditions considered in Figure 13 are for different engine speeds and mixture strengths. Nevertheless, a compression temperature at some fixed pressure in Figure 13 could be taken as a generic engine parameter describing the temperature and pressure history the air fuel mixture experiences during the compression. In this work the compression temperature at 15 bar, (Tcomp15), illustrated in Figure 13 as a vertical line, was chosen. In Figure 13, the temperature and pressure history is shown for just one fuel in the three HCCI operating conditions as an illustrative example. However, data from several fuels for each operating case have been collected. Tcomp15 has then been calculated for each fuel and an average for each operating case has been
450
550
650
750
850
950
1050
10 12 14 16 18 20 22 24 26 28 30Pressure [Bar]
Com
pres
sion
Tem
pera
ture
[ K
]
HCCI, K= +2.2
HCCI,K= +1.1
MON Test, K= +1.0
RON test, K= 0
HCCI, K= -1.6

P. Risberg
60
used. These values are reasonably repeatable, with the standard deviation being less than 5% of the average. Experiments have been done at many different conditions corresponding to different temperature and pressure histories. In PAPER I some initial tests were presented at two different intake conditions. The engine speed and mixture strength were also varied in these tests. In PAPER II the intake conditions were varied further and a lower compression ratio was used. In [37] some complementary tests were done in a smaller engine with higher intake temperatures and higher engine speeds. In the experiments discussed in PAPER III tests were done with internal EGR and external EGR using gasoline-like fuels. The internal EGR was obtained by retaining exhaust gases with the method of negative valve overlap (NVO). In Figure 14 the K-value is plotted against Tcomp15 for all experiments done in this project. Also shown are results from tests done in an entirely different engine in [37, 38] In Figure 14, it is evident that the K-value increases with an increasing Tcomp15. It is also apparent that the K-value does not increase linearly through the entire temperature regime. It is also interesting to see that the results from [37, 38] from the tests with the Ricardo engine at Shell are so well in line with the results from the work with the Scania engine at KTH. Even the results from the experiments with external EGR and internal EGR, with the exception of cases with high concentrations of internal EGR (not included in the figure) are well in line with results from the tests with pure intake air.

Describing the Auto-Ignition Quality of Fuels in HCCI Engines
61
-4
-2
0
2
4
6
8
400 500 600 700 800 900 1000
Tcomp15 [K]
K v
alue
Risberg et al., 2003Kalghatgi & Head, 2004Risberg et al., 2004. No EGRRisberg et al., 2004.Cooled EGRRisberg et al., 2004. NVOKalghatgi & Head, 2006Low Temp PredictionHigh Temp Prediction
Figure 14: The K-value plotted against the temperature at 15 bar, Tcomp15, during the compression for all experiments done in this project.
To generally describe the K-value as a function of Tcomp15 the following two linear equations are suggested. The linear equations are also illustrated in Figure 14. for Tcomp15 > 825 K
K = 0.0426(Tcomp15) – 35.2 (E 11)
And for Tcomp15 < 825 K,
K = 0.0056(Tcomp15) – 4.68 (E 12)
Here Tcomp15 is expressed in degrees Kelvin. As it can be seen in Figure 14 the two predictive equations, E11 and E12, describes the K-value reasonably well.

P. Risberg
62
5.4.2 Mixture Strength Apart from that the experiments were made at different intake temperature and intake pressures, the data in Figure 14 were collected at a wide range of engine speeds and mixture strengths. This could also affect the K-value. In Figure 15, the K-value is plotted against λ for five different series of different engine speeds at two slightly different intake temperatures, 160 and 120 °C.
Figure 15: K plotted against λ for five different series of different engine speeds at two slightly different intake temperatures, 160 and 120 °C.
It can be seen in Figure 15 that the K-value in most cases increases with decreasing lambda. When all the data in this project was analyzed it was found that the mixture strength had a significant effect on the K-value and it increased with a decreasing lambda. A possible explanation for the increase in K-value is that both the temperature of the combustion chamber surface, which reduces the heat losses, and the temperature of the residual gas increases with a decreasing lambda. This results in an increased in-cylinder temperature which, as it could be seen in Figure 14, increases the K-value.
-0,3
-0,2
-0,1
0
0,1
0,2
0,3
0,4
0,5
2 2,5 3 3,5 4 4,5 5 5,5
Lambda
K -
Valu
e
Tin 160 C - 900 rpmTin 160 C - 1200 rpmTin 160 C - 1500 rpmTin 120 C - 900 rpmTin 120 C - 1200 rpm

Describing the Auto-Ignition Quality of Fuels in HCCI Engines
63
Another factor that affects the ranking of different fuels and hence the behaviour of the K-value is the cool flame activity of fuels. Tanaka et al. [24] showed that the low temperature heat release increased with decreasing lambda. Sjöberg et al. [43, 44] proved that the intake temperature to keep the combustion at TDC for a low temperature reactive fuel was significantly lower compared to a non-cool flame active fuel at high equivalence ratios, but at low fuelling rates the required intake temperature was almost the same for both fuels. This indicates that fuels exhibiting cool flames will have a lower resistance to auto-ignition at low lambda values compared to non-low temperature reactive fuels. If it is assumed that a fuel with low sensitivity exhibits low temperature heat release and the fuels exhibiting cool flames will have a lower resistance to auto-ignition at low lambda values compared to the assumed non-low temperate reactive, sensitive fuels. This would result in a decrease in the K-value with a decreasing lambda which is the opposite of what was found in these tests. This indicates that lambda effect on the cool flame activity is not as important as the previously discussed temperature effect, at least in these tests.
5.4.3 Engine Speed The impact of engine speed is less clear than the influence of mixture strength. In Figure 15, it can be seen, in the test series with intake temperature 120 °C, that the K-value is lower in the series with lower engine speed. However, in contrast with the previous result, in the series with the slightly higher intake temperature, the K-value is at its highest for the series with the lowest engine speed. In fact, multiple linear regression shows that the dependence of the K-value on engine speed is not statistically significant. This is a surprising result since both Bell’s and Kalghatgi’s knock studies suggest that K increases with increasing engine speed. Aroonsrisopon et al. also showed in their investigation of the effect of fuel composition on HCCI combustion that four different fuels of different chemistries did not rank in the same way at different engine speeds, keeping all other conditions constant, hence showing that the engine speed affected the K-value. These tests were done at two different engine speeds 600 rpm and 1800 rpm, without any significant cool flames. [32, 39, 41]

P. Risberg
64
The reason that the K-value increases with increasing engine speed in the two knock studies could be that the in-cylinder temperature increases with an increasing engine speed due to less time for heat losses, hence a higher K-value. Another explanation for this could be, as Sjöberg et al. [43, 44] showed, that the cool flames became more pronounced when engine speed was decreased and that the cool flames was absent at high engine speeds. This was also shown by Leppard. [33] This occurs since the cool flame-chemistry is relatively slow and it is therefore dependent on time in the cool flame region and hence increases with lower engine speed. This means that low temperature reactive fuels, assumed to have a low sensitivity, will lose in auto-ignition quality at low engine speeds compared to a fuel that does not exhibit cool flames, assumed to be a sensitive fuel. This will also cause the K-value to increase with a higher engine speed. The explanation to why there was no effect in the tests done at KTH could be that the tests were done in a rather narrow engine speed range, 600 to 1500 rpm, and that the engine speed was rather low. A possible explanation for the influence in the SI-tests could be that the tests were done in a wider engine speed range with higher engine speeds and that the pressure rise rate in the SI engine also is influenced by the speed of the propagating flame front, which is influenced by the engine speed. Leppard showed [33], for example, that the end-gas in the MON test with an engine speed of 900 rpm produced the same time based pressure history as a motored engine with engine speed 1350 rpm. In the same way the 600 rpm in the RON test corresponded to a motored engine speed of 900 rpm. However, the HCCI tests done in Shell’s engine laboratories were done at higher engine speeds and in these tests no significant effect of the engine speed on the K-value was found either. [37] Nevertheless, when studying figure 14 and 15 it is safe to say that neither the engine speed or lambda have the same considerable effect on the K-value as intake pressure and intake temperature.

Describing the Auto-Ignition Quality of Fuels in HCCI Engines
65
5.5 Engine Octane Index Requirement Another important parameter introduced during the work with gasoline-like fuels is OI0, the octane index of a fuel required by the engine to keep the combustion at TDC at a particular operating condition. When the OI of a fuel is above OI0, the combustion phasing will be after TDC and with a lower OI, CA50 will be before TDC. It was shown in PAPER II that OI0 increases with increasing Tmaxcomp and Pmaxcomp, the temperature and pressure at TDC calculated without heat release, and decreases with increasing engine speed and lambda. The following equation was developed for the calculation of OI0 based on experimental results in the two different engines. [45]
OI0 = 59 + 0.015Tmaxcomp + 0.66Pmaxcomp – 2.6λ - 0.012 N (E 13)
An expression for OI0, like equation E13, can be, combined with an expression for OI, like equation E11 and E12, used as a tool in understanding the behaviour of the engine and its octane requirement and how this relates to the fuel octane quality, represented by the Octane Index, at different operating conditions. In Figure 16 the predicted OI0 calculated with equation E13 is plotted against the measured OI0, approximated from the linear relation between OI and CA50 in the experimental data, such as the data presented in Figure 11.

P. Risberg
66
50
60
70
80
90
100
110
120
130
50 60 70 80 90 100 110 120 130
Predicted OI0
Mea
sure
d O
I 0
SAE 2003-01-3215SAE 2004-01-1969SAE 2004-01-2952No EGRSAE 2004-01-2952Cooled EGRSAE 2004-01-2952 NVOKalghatgi and Head, 2006Equivalence Line
Figure 16: The experimentally determined Octane Index of a fuel with the combustion centered at TDC, OI0, plotted against the predicted OI0 from Equation 13.
As it can be seen in Figure 16, the OI0 from all the work done at KTH and Shell, where the OI approach is applicable, can be predicted rather well by equation E13, even for cases with internal and external EGR. The correlation is reasonable considering that the data comes from two very different engines working at a wide operating range.
5.6 The Sensitivity of the Fuel Octane Quality The Octane Index and OI0 relates to CA50 according to the following formula
CA50 = (a+b)[OI-OI0] (E 13)
Where a and b are coefficients from the linear regression between CA50 and RON and MON in equation E6. (a+b) is the sensitivity of the combustion
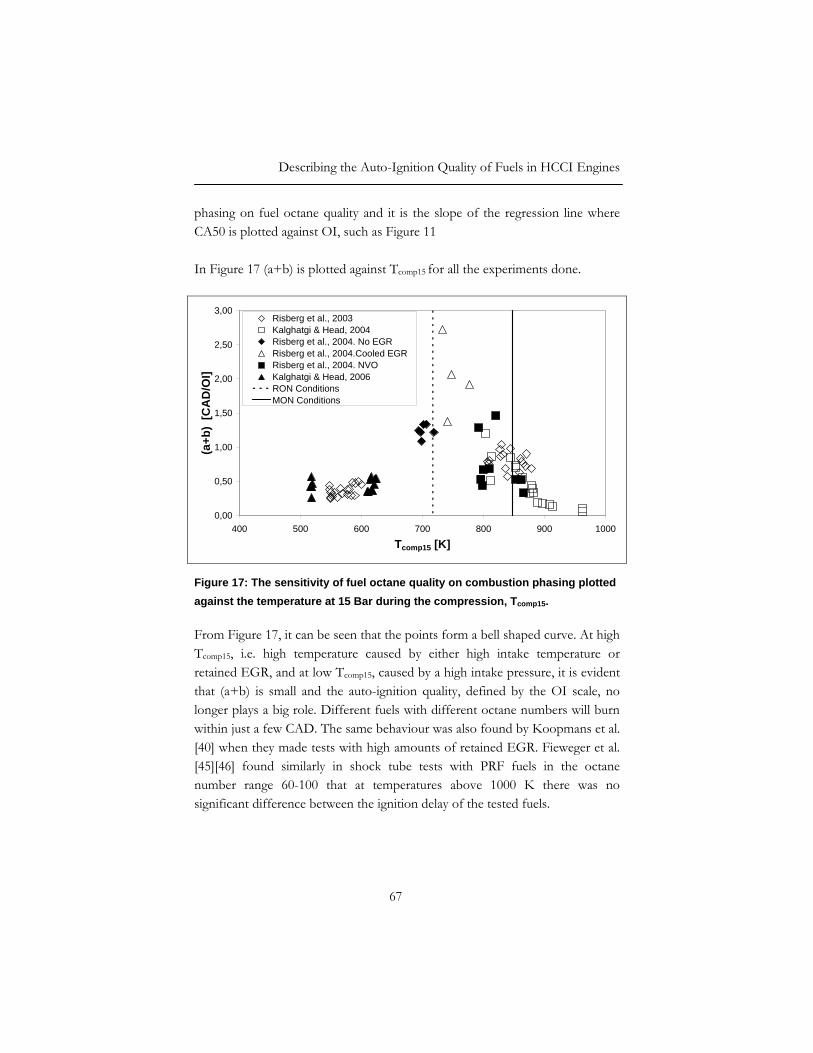
Describing the Auto-Ignition Quality of Fuels in HCCI Engines
67
phasing on fuel octane quality and it is the slope of the regression line where CA50 is plotted against OI, such as Figure 11 In Figure 17 (a+b) is plotted against Tcomp15 for all the experiments done.
0,00
0,50
1,00
1,50
2,00
2,50
3,00
400 500 600 700 800 900 1000
Tcomp15 [K]
(a+b
) [C
AD
/OI]
Risberg et al., 2003Kalghatgi & Head, 2004Risberg et al., 2004. No EGRRisberg et al., 2004.Cooled EGRRisberg et al., 2004. NVOKalghatgi & Head, 2006RON ConditionsMON Conditions
Figure 17: The sensitivity of fuel octane quality on combustion phasing plotted against the temperature at 15 Bar during the compression, Tcomp15.
From Figure 17, it can be seen that the points form a bell shaped curve. At high Tcomp15, i.e. high temperature caused by either high intake temperature or retained EGR, and at low Tcomp15, caused by a high intake pressure, it is evident that (a+b) is small and the auto-ignition quality, defined by the OI scale, no longer plays a big role. Different fuels with different octane numbers will burn within just a few CAD. The same behaviour was also found by Koopmans et al. [40] when they made tests with high amounts of retained EGR. Fieweger et al. [45][46] found similarly in shock tube tests with PRF fuels in the octane number range 60-100 that at temperatures above 1000 K there was no significant difference between the ignition delay of the tested fuels.

P. Risberg
68
Another conclusion from Figure 17 is that the sensitivity on auto-ignition quality is most significant around the RON and MON conditions and the peak sensitivity is from the tests with cooled external EGR.
5.7 The Influence of NO The composition of the charge has also an influence on the auto-ignition chemistry and therefore also on the combustion phasing. In PAPER V the influence of different concentrations of NO on the combustion phasing for three different fuels, a PRF, TRF and a full boiling range gasoline, all with the RON 84, was studied. In Figure 18, CA50 is plotted against the added NO concentration for the three fuels tested.
-10
-8
-6
-4
-2
0
2
4
6
8
0 100 200 300 400
NO [ppm]
CA
50 [a
TDC
]
Gasoline
PRF
TRF
Figure 18: CA50 and the CAD of the maximum cool flame heat release plotted against the added NO concentration for the three fuels tested at Pin = 1 bar abs., Tin = 100 °C, 900 RPM and λ = 3.0. From Figure 18 it is evident that the combustion phasing advances in the entire concentration range tested for both the full boiling range gasoline and the TRF
Describing the Auto-Ignition Quality of Fuels in HCCI Engines
69
fuel. CA50 is advanced by over 12 CAD for the full boiling gasoline at the peak concentration of added NO, 370 ppm. The combustion phasing is also advanced for the PRF fuel but not to the same extent. From the shape of the PRF curve it is not far fetched to assume that if the NO concentration would have been increased further the combustion phasing would have also started to retard. Low NO concentrations are the most relevant to the HCCI engine – as already mentioned, one of the biggest benefits of the HCCI engine is its low NOx emissions. According to Figure 18, the influence of NO on the combustion phasing is most significant in this area. This means that the combustion phasing in the HCCI engine is more sensitive to changes in NO concentration in the charge compared to knock onset in the SI-engine with typical NO concentrations of 200 ppm in the charge. This places the SI-engine in a more stable regime in Figure 18. However, this study was performed at lean air fuel ratios as opposed to the conditions in the SI-engine. On the other hand, the studies conducted at stochiometric conditions by Prabhu and Burluka show similar results, proving that the results appears to be independent of AFR [47, 48].
5.8 Requirements of a Gasoline-Like HCCI Fuel So what properties should a good gasoline-like HCCI fuel have? Since the Octane Index is influenced mainly by the temperature and pressure changes, a supercharged engine has been studied in this example. In Figure 19 the OI index has been plotted for three different fuels, two PRFs with octane index 84 and 95 and a TRF 65 with RON 83.9 and MON 73.2. Together with these three fuels, three points have been plotted that represents OI0 at different intake conditions where the intake pressure has been changed in three steps: atmospheric, 0.5 bar boost and 1 bar boost, resulting in different K-values. The engine speed, and air/fuel ratio were kept constant at 1200 rpm and lambda 4.

P. Risberg
70
Pin Atm Tin 120 C
Pin 0.5 bar Tin 80 C
Pin 1 bar Tin 80 C
82,0
84,0
86,0
88,0
90,0
92,0
94,0
96,0
98,0
100,0
-1,20 -1,00 -0,80 -0,60 -0,40 -0,20 0,00K value
Oct
ane
Inde
x
OI0PRF 84TRF 65PRF 95
Figure 19: The octane index of three fuels plotted against K-value and compared to three points of OI0, the OI of a fuel that burns at TDC.
The ideal fuel would always burn close to TDC, hence the OI would always match OI0. From Figure 19 it is evident that the OI0 increases as the K-value decreases. The OI of the TRF 65 and PRF 84 are close to OI0 at K-values close to zero. As the K-value decreases the OI of the sensitive TRF fuel is closer to the OI0 compared to the PRF 84 with the same RON value. The sensitive fuels have an advantage from an engine management point of view, since their fuel octane quality, OI changes in the same direction as the required octane quality by the engine, OI0. If the TRF fuel is compared to the PRF 95 with a higher octane number, it is evident that the OI of the PRF 95 fuel would match the OI of the TRF fuel at K-value –1 and the PRF 95 would be closer to OI0 at this point compared to PRF 84. However, when the intake pressure is decreased and the K-value decreases to 0 its OI is still 95 and that is much higher than the OI0 at this point. This could make the fuel difficult to ignite or might cause the engine to misfire.
Describing the Auto-Ignition Quality of Fuels in HCCI Engines
71
Sjöberg et al. [43, 44] found similarly that a fuel that exhibited cool flames, which is likely to be a fuel of low sensitivity, required large changes in intake temperature when operating condition was changed and they drew from this the conclusion that the engine management was likely to become more difficult with a fuel that was reactive during the low temperature chemistry. A comparable conclusion was drawn by Aroonsrisopon et al. [39] who stated that the interaction between in-cylinder temperature, pressure and engine speed becomes more difficult for a fuel that exhibits strong NTC behaviour. From this example it can also be concluded that a sensitive fuel has an advantage over a non-sensitive fuel in facilitating a wider operation window. To reach high loads it is likely that the engine will be supercharged and at higher pressures at a given temperature the K-value will decrease, which will be beneficial for sensitive fuels. The reason for this might be found in that the non-sensitive fuel is likely to exhibit cool flames. Leppard showed that the low temperature reactivity increases with an increasing pressure, which will decrease the auto-ignition quality of non-sensitive fuels at higher pressures and lower K-values. Another fuel property that would be beneficial for a HCCI fuel is resulting in lower pressure rise rates than other fuels. However, any evidence of any fuel with this property has not been found. The pressure rise rates of the different fuels tested at a similar air fuel ratio and combustion phasing do not differ significantly. From this discussion it can be concluded that an example of a good gasoline-like HCCI fuels is ethanol. Ethanol is a fuel with a high sensitivity, its RON is 109 and MON 90, hence a sensitivity of 19 and it does not exhibit any cool flame activity. This indicates that it is a really good fuel from engine management point of view and that it will have high resistance to auto-ignition at boosted conditions, which facilitates higher loads. Its boiling point is 78 °C, which implies that there are no problems in obtaining a homogenous charge. Another important benefit with ethanol is, of course, that it can be produced from renewable raw material.
P. Risberg
72
6 The Auto-ignition Quality of Diesel-like Fuels
In the work studying the auto-ignition quality of diesel-like fuels three different strategies of mixture formation have been used: port fuel injection (PFI) with light fuels, early direct-injection with a nozzle that created colliding sprays and late direct-injection in the presence of cooled EGR, similar to Nissan MK. This work was presented more thoroughly in PAPER IV.
6.1 Experimental Procedure
6.1.1 Port Fuel Injection The simple port fuel injection system is the best injection system for comparing auto-ignition quality of fuels due to its small influence on charge homogeneity and therefore also on combustion phasing. The problem with PFI with diesel-like fuels is that it is difficult to obtain a homogeneous charge when conventional diesel fuels are used, due to their high boiling point range that makes them difficult to vaporise. A high intake temperature is therefore required with PFI in order to fully vaporize them. This causes another problem, the diesel fuels are also very prone to auto-ignition and when the intake temperature is elevated the fuel will auto-ignite too early, even with a low compression ratio. The PFI system is therefore not suitable for HCCI with conventional diesel fuels. However, HCCI operation is possible with PFI with volatile diesel-like fuels, like TRFs and PRFs with cetane numbers in the diesel range and a low compression ratio. For heavier diesel-like fuels direct-injection systems are more appropriate. Even though light diesel-like fuels were used in these tests, the operation window with port fuel injected HCCI without the presence of EGR is narrow. The fuels are so prone to auto-ignite that it is not possible to boost the intake pressure or raise the inlet temperature much above the ambient, even though the compression ratio used in these tests was only 11.4.

Describing the Auto-Ignition Quality of Fuels in HCCI Engines
73
The strategy in the tests with PFI with diesel-like fuels was exactly the same as with the gasoline-like fuels, to let fuels of different chemistry and cetane quality experience the same pressure and temperature history. The intake conditions in the tests conducted in this case were atmospheric intake pressure and 40 °C intake temperature. During these tests no smoke was obtained and the NOx level was below 20 ppm indicating that the charge was close to fully homogeneous.
6.1.2 Early Direct-Injection One way of obtaining a premixed charge is to inject the fuel directly into the cylinder early during the compression stroke using a direct-injection system. The fuel has then the time from start of injection to ignition to generate a premixed charge. Such tests were made with a nozzle that created colliding sprays. The nozzle had ten holes of 0.12 mm diameter that produced 5 colliding sprays and the collision angle between the sprays was 60°. This nozzle was used because colliding sprays result in a shorter spray penetration and since the fuel is injected early, the time for penetration is long and the pressure in the cylinder during the fuel injection is low. This increases the penetration length and the risk of wall impingement, therefore is it important to secure a short spray penetration. In the experiments with early direct-injection, the intake temperature was held constant at 30 °C and the intake pressure was atmospheric. The injection pressure was 1500 bar and the global lambda was 5, which resulted in an IMEP that varied in the range 2 and 2.8 Bar. This low load was used to secure a long ignition delay, making a homogeneous charge possible without an overly advanced combustion phasing. The fuels used were made from all the components presented in Table 4, with the exception of n-heptane. The fuels were tested in injection angle sweeps that was varied between 10 – 50 CAD BTDC and pressure and emission data were collected at each injection timing.

P. Risberg
74
6.1.3 Late Direct-Injection The last injection strategy that was used to study the auto-igntion quality of diesel-like fuels was to inject the fuel late during the compression stroke or very early in the expansion stroke in the presence of EGR, similar to the Nissan MK concept. [49] When using late direct-injection it is somewhat misleading to speak about HCCI, (several other names have also been suggested) since there is so little time for mixing that a true homogenous charge is not possible. The goal is therefore to obtain an adequately premixed charge to avoid fuel-rich areas where smoke is formed. NOx emissions are suppressed by the globally lean and relatively homogeneous charge and the cooling effect of the EGR. In this type of combustion the fuel and air are mixed during the ignition delay and during this time it is necessary to create a sufficiently homogeneous charge. If the ignition delay is too short the charge will be stratified, which results in smoke and NOX emissions. To obtain a sufficiently homogeneous charge before ignition it is important to keep the injection duration as short as possible. This is done by using a high injection pressure. The ignition delay can be increased by adding EGR to the charge, decreasing the compression ratio and retarding the injection angle. Decreasing the mixing time is also a way to increase the homogeneity of the charge and in this work it was done by increasing the swirl ratio by blocking one of the intake ports. The tests with late direct-injection were done in a similar fashion as the tests with early direct-injection. Sweeps of injection angle were done with different kinds of fuels and the intake temperature pressure, engine speed and global lambda were held constant. The injection angle range in the sweeps varied from fuel to fuel depending on their auto-ignition quality and the injection angles that resulted in stable combustion. In the tests the intake pressure was boosted a half bar, the intake temperature was held constant at 60 °C and lambda was 4. IMEP varied in the range 3.1 - 4.2 Bar. This low load was used to secure a long ignition delay. The injection pressure was 1500 bar. The nozzle used was a standard diesel nozzle. This nozzle was used since the fuel was injected when the cylinder density was high
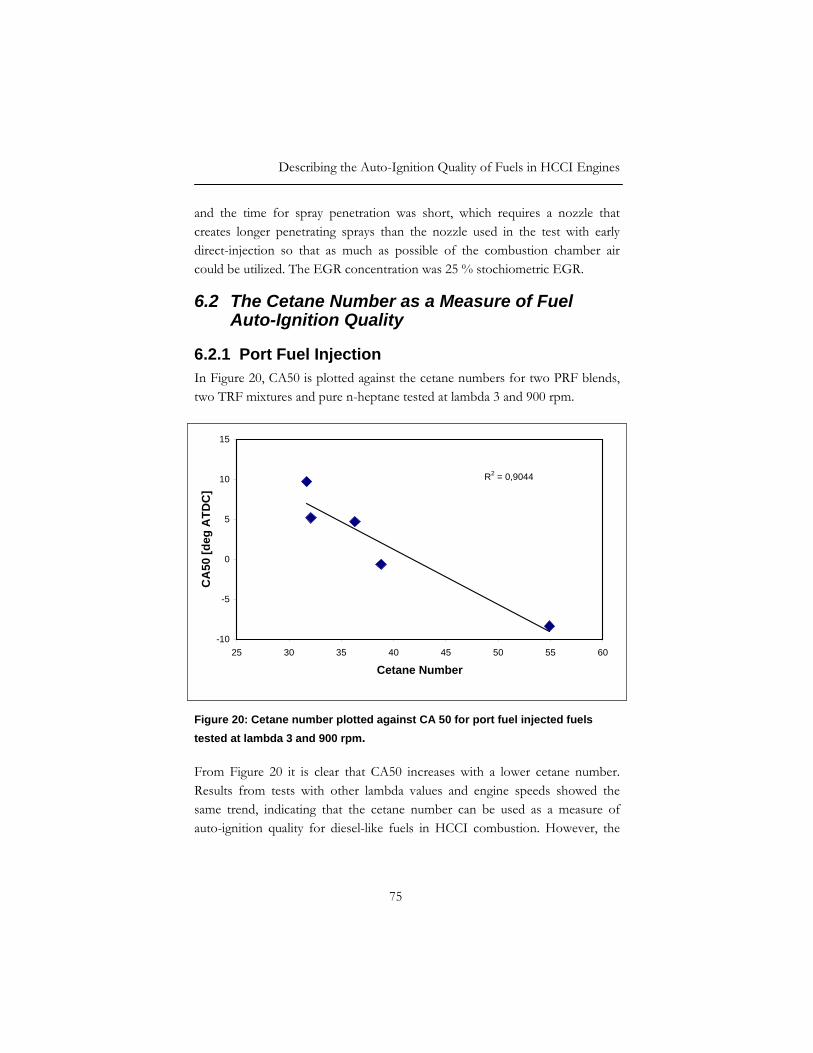
Describing the Auto-Ignition Quality of Fuels in HCCI Engines
75
and the time for spray penetration was short, which requires a nozzle that creates longer penetrating sprays than the nozzle used in the test with early direct-injection so that as much as possible of the combustion chamber air could be utilized. The EGR concentration was 25 % stochiometric EGR.
6.2 The Cetane Number as a Measure of Fuel Auto-Ignition Quality
6.2.1 Port Fuel Injection In Figure 20, CA50 is plotted against the cetane numbers for two PRF blends, two TRF mixtures and pure n-heptane tested at lambda 3 and 900 rpm.
R2 = 0,9044
-10
-5
0
5
10
15
25 30 35 40 45 50 55 60
Cetane Number
CA
50 [d
eg A
TDC
]
Figure 20: Cetane number plotted against CA 50 for port fuel injected fuels tested at lambda 3 and 900 rpm.
From Figure 20 it is clear that CA50 increases with a lower cetane number. Results from tests with other lambda values and engine speeds showed the same trend, indicating that the cetane number can be used as a measure of auto-ignition quality for diesel-like fuels in HCCI combustion. However, the
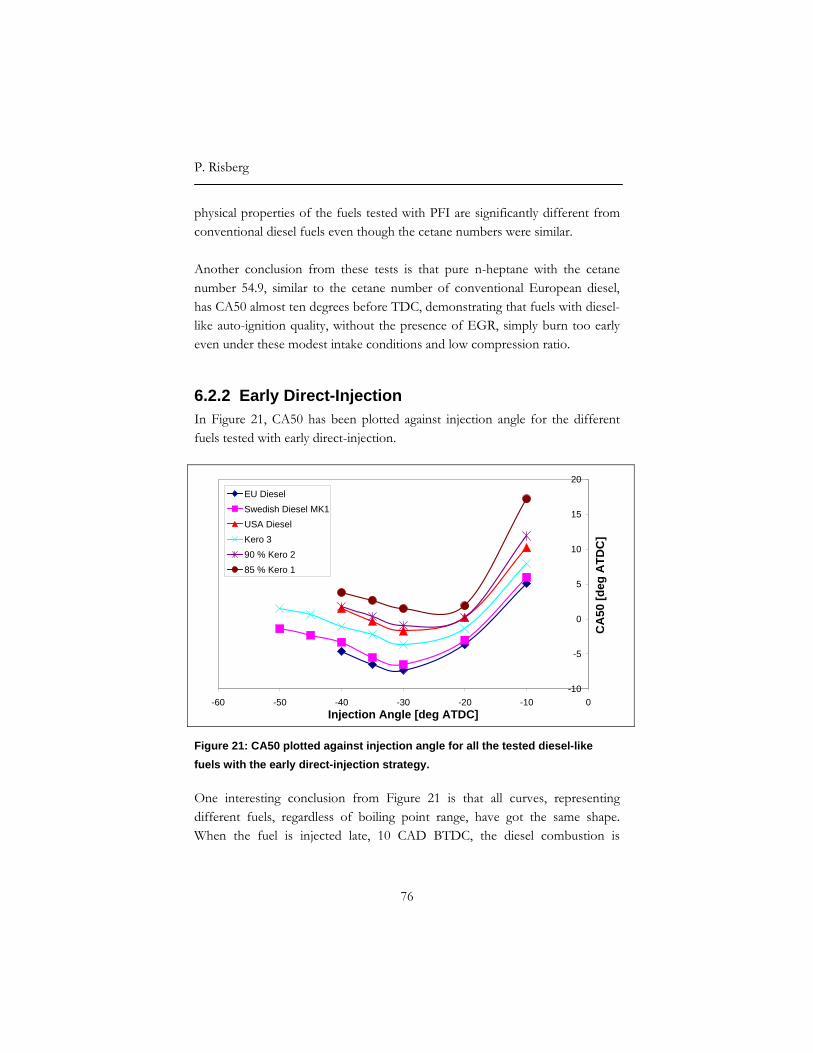
P. Risberg
76
physical properties of the fuels tested with PFI are significantly different from conventional diesel fuels even though the cetane numbers were similar. Another conclusion from these tests is that pure n-heptane with the cetane number 54.9, similar to the cetane number of conventional European diesel, has CA50 almost ten degrees before TDC, demonstrating that fuels with diesel-like auto-ignition quality, without the presence of EGR, simply burn too early even under these modest intake conditions and low compression ratio.
6.2.2 Early Direct-Injection In Figure 21, CA50 has been plotted against injection angle for the different fuels tested with early direct-injection.
-10
-5
0
5
10
15
20
-60 -50 -40 -30 -20 -10 0Injection Angle [deg ATDC]
CA
50 [d
eg A
TDC
]
EU DieselSwedish Diesel MK1USA DieselKero 390 % Kero 285 % Kero 1
Figure 21: CA50 plotted against injection angle for all the tested diesel-like fuels with the early direct-injection strategy.
One interesting conclusion from Figure 21 is that all curves, representing different fuels, regardless of boiling point range, have got the same shape. When the fuel is injected late, 10 CAD BTDC, the diesel combustion is
Describing the Auto-Ignition Quality of Fuels in HCCI Engines
77
dominating and CA50 decreases steeply as the injection angle is advanced. When the injection angle is advanced even further, CA50 increases indicating that the typical diesel combustion is replaced by HCCI combustion. The fuels are lined up fairly parallel and rather well after their cetane numbers and no fuel line crosses another fuel line, indicating that the ranking of the auto-ignition quality of the fuels are constant regardless of injection angle and homogeneity of the charge. How the auto-ignition quality of the fuels should be studied when the fuels are direct-injected is a difficult question, especially since the combustion phasing is not constant for the different fuels injected at the same timing. The difference in ignition delay for the different fuels also affects the emissions, which results in that the emission can not be used as an indication of the homogeneity. It would be best if the auto-ignition quality of the different fuels tested is studied when a homogenous charge has been obtained or at least when the homogeneities of the charges are comparable between the different cases. In Figure 22 CA50, when the fuel was injected at 40 CAD BTDC and the charge was considered to be homogeneous, has been plotted against the cetane number for all fuels tested.

P. Risberg
78
90% Kero 2
85% Kero1
Kero 3
EU Diesel
SwedishDiesel
USA DieselR2 = 0,9277
-6
-5
-4
-3
-2
-1
0
1
2
3
4
5
35 37 39 41 43 45 47 49 51 53 55Cetane Number
CA
50 [a
TDC
]
Figure 22: Combustion Angle when the fuel is injected 40 CAD BTDC plotted against Cetane number.
As it can be seen in Figure 22, CA50 clearly decreases with increasing cetane number and the correlation between CA50 and the cetane is good, hence the cetane number describes also the auto-ignition quality of direct-injected diesel-like fuels reasonably well.
6.2.3 Late Direct-Injection In Figure 23 CA50 is plotted against the injection angle for the seven different fuels that were tested with late direct-injection.

Describing the Auto-Ignition Quality of Fuels in HCCI Engines
79
Figure 23: CA50 plotted against the injection angle for all the diesel-like fuels tested with the late direct-injection strategy.
From Figure 23 it is clear that CA50 increases with retarded injection angle and that the different fuels line up rather parallel and the fuel lines do not cross each other, indicating that the ranking of the fuels is constant, regardless of injection angle and homogeneity of the charge. The fuels also line up well with the cetane number and it was possible to inject the two commercial European diesels and n-heptane later than the other fuels and still obtain a stable combustion. This is an indication that these three fuels have got a lower resistance to auto-ignition, as their high cetane numbers also point out. Another interesting fact from this figure is that the lines of n-heptane and European diesel, two fuels with similar cetane numbers, but with completely
-5
0
5
10
15
20
25
-25 -20 -15 -10 -5 0 5Injection Angle [deg ATDC]
CA
50 [d
eg A
TDC
]
USA DieselKero 390 % Kero 285 % Kero 1EU dieselDiesel MK1n-heptane

P. Risberg
80
different other properties, such as boiling point, aromatic concentration and viscosity, practically lay on top of each other. Not just the heat release for these two fuels are similar, also the emissions are comparable. Similarly, Pöttker et al. [50] found comparable results when they compared n-heptane and European diesel in a direct-injected HCCI engine. To understand the emission formation it is interesting to study the needle lift and heat release of these fuels in more detail and this is plotted in Figure 24.
Figure 24: The needle lift [arbitrary scale] and heat release of n-heptane and EU diesel plotted against CAD, when the fuels were injected at 2 ATDC.
In Figure 24 it is evident that the needle lift of the n-heptane is slightly longer. This might be due to that a somewhat lower injection pressure was used with this fuel. The needle lift is, however, just marginally longer and should not affect the emissions to any large extent. When the heat releases of the two fuels are studied it is evident that the only real difference between the heat releases are in peak value, which is somewhat higher for n-heptane. One of the reasons
-50
0
50
100
150
200
250
0 5 10 15 20 25 30
Crank Angle [deg ATDC]
Hea
t Rel
ease
[J/d
eg]
Heat Release n-heptaneNeedle lift n-heptaneHeat Release EU DieselNeedle Lift EU Diesel

Describing the Auto-Ignition Quality of Fuels in HCCI Engines
81
for this is that the heating value for n-heptane is a bit higher than the heating value of EU diesel. The phasing of the main heat release and the cool flames are, however, the same for the both fuels. This just confirms that the cetane number describes the auto-ignition quality of the fuels, also in HCCI combustion, accurately. It also indicates that the combustion phasing and ignition delay are more important in emission formation than the chemical composition of the fuel. In Figure 25, CA50 when the fuel was injected at 5 CAD BTDC, which is the last point were the combustion of all fuels was stable, has been plotted against the cetane number for all fuels tested.
EU DieselSwedish Diesel
n-heptane
Kero 3
90% Kero 2USA Diesel
85% Kero 1
R2 = 0,9082
6
7
8
9
10
11
12
13
14
15
16
37,5 40 42,5 45 47,5 50 52,5 55 57,5
Cetane Number
CA
50 [a
TDC
]
Figure 25: CA50 when the fuel was injected at 5 CAD BTDC has been plotted against the cetane number.
Once again it can be concluded that CA50 increases with decreasing cetane number and that the correlation is good, i.e. the cetane number describes the auto-ignition quality well.

P. Risberg
82
Another interesting point that can be made from Figure 25 is that the cetane number of the fuels line up against CA50 in the exact same way as in the tests with early direct-injection presented in Figure 22.
6.3 Limitations of the Cetane Number In all of the tests performed in the work with diesel-like fuels the cetane number described the auto-ignition quality well. Also Kitano et al [51] and Steinbach et al. [52] found that the ignition delay decreased with higher cetane numbers in HCCI combustion when they studied the effect of cetane number on combustion phasing with early direct-injected HCCI. However, the test conditions in this work with diesel-like fuels have been rather similar to each other, close to ambient intake temperature and pressure for the PFI and the early direct-injection tests and 60 °C intake temperature and a half bar boosted intake pressure in the late direct-injection tests. The engine loads have also been low. In the cases with PFI and early direct-injection the low loads were necessary mainly not to have an overly advanced combustion phasing. With late direct-injection the low load was required to increase the ignition delay to obtain a homogenous charge. If the intake conditions could be changed to higher intake pressures or higher inlet temperatures it is possible that other parameters than the cetane number also could contribute to the description of the auto-ignition quality of diesel-like fuels. For instance, Kobori et al. [53] showed in their work, in a rapid compression machine, that the effect of cetane number on the ignition delay decreases with an increasing ambient gas temperature and the relationship between the three tested diesel-like fuels was not constant at different temperatures. Other researchers have also shown that the cetane number does not describe the auto-ignition quality accurately. Wang et al. [54] showed that the ignition delay did not increase with a lower cetane number in diesel combustion at high loads, without pilot injection. However, it is not certain that this will be the case in HCCI combustion.
Describing the Auto-Ignition Quality of Fuels in HCCI Engines
83
The cetane scale is today based on n-hexadecane with cetane number 100 and hepta methyl nonane with cetane number 15. These are paraffinic compounds, which mean that the cetane scale, just as the octane scale, is based on paraffinic chemistry. This could mean that the cetane number describes the auto-ignition quality of fuels of paraffinic chemistry at all conditions well, but at conditions different to the conditions of the cetane test it may not describe the auto-ignition quality of fuels of any other chemical composition. This was the reason why a thermodynamic parameter describing the pressure and temperature history, the K-value, had to be introduced to make it possible to interpolate and extrapolate between RON and MON conditions resulting in the Octane Index in the approach with gasoline-like fuels. However, it has been shown in this work that the cetane number alone is an adequate measure of fuel auto-ignition quality within the range of conditions tested. The reason for this could be that diesel fuels are more similar to the cetane reference fuels than gasoline to the octane reference fuels. Diesel molecules are long and break down into radicals and auto-ignites easily. As mentioned earlier, long molecules are paraffinic and exhibit cool flames and in contrast to gasoline it is likely that all diesel-like fuels exhibit cool flames, which might be why they can be described by just one auto-ignition number.
6.4 Requirements of a Diesel-Like HCCI Fuel From the experiments presented in this chapter it is obvious that commercial diesel is one of the worst HCCI fuels imaginable. It is difficult to vaporize, which makes it complicated to obtain a homogeneous charge with direct-injection systems and nearly impossible with PFI. Its proneness to auto-ignition, which is such a blessing in diesel combustion, is more of a curse in HCCI combustion where it results in short ignition delays that complicate the procedure of achieving homogeneity even more. One interesting point to note is that American diesel with its poor auto-ignition quality in a diesel perspective is actually a better HCCI fuel than the European diesel fuels with higher cetane numbers.

P. Risberg
84
As it has been shown in the experiments with diesel-like fuels, a lower cetane number increases the ignition delay. With early direct-injection, a longer ignition delay means that more fuel can be injected without resulting in an overly advanced combustion phasing. With late direct-injection it will facilitate reaching higher loads with acceptable emissions due to more time for mixing the fuel and the air before ignition occur. Another benefit with fuels with higher resistance to auto-ignition is that pilot injections with these fuels will actually increase the ignition delay of the main injection, given that the same amount of fuel is injected, by making the main injection shorter and this is achieved without advancing the main combustion phasing. This is a contrast to the regular use of pilot injection with diesel fuel where the fuel from the pilot injection releases heat and radicals during the compression and is used to decrease the ignition delay and decreases the premixed combustion, NOx and combustion noise. In Figure 26 an example from the experiments made for PAPER VI is presented. In PAPER VI auto-ignition resistant fuels, such as gasoline, has been compared to diesel in terms of ignition delay, emissions and load. There it is shown that gasoline has potential of reaching far higher loads with acceptable emissions compared to diesel.

Describing the Auto-Ignition Quality of Fuels in HCCI Engines
85
-50
0
50
100
150
200
250
300
350
400
450
-150 -100 -50 0 50 100
Crank Angle [deg ATDC]
Rat
e of
Hea
t Rel
ease
[J/d
eg]
-0,05
0
0,05
0,1
0,15
0,2
0,25
0,3
0,35
0,4
0,45
Nee
dle
Lift
RoHR GasolineRoHR DieselNeedle Lift GasolineNeedel Lift Diesel
Figure 26: Diesel and Gasoline compared at the same condition, 1 bar boost, intake temperature 40 °C, 25% EGR, fuel flow 1.2 g/s and engine speed 1200 rpm. 1/3 of the fuel was injected in the pilot injection.
In Figure 26 diesel and gasoline are compared at the same condition. The needle lift curves are quite similar for the different fuels. The main injection is, however, two CAD earlier for the gasoline since the gasoline could not be injected later due to that the combustion phasing already is late. Also, the main injection for the diesel could not be advanced more, since the combustion phasing already was close to TDC. This resulted in alarmingly high pressure rise rates, which also can be seen in the figure where the heat release is oscillating from “knock”. The pilot injection starts at 150 CAD bTDC and it can be seen that the diesel fuel releases heat at 20 CAD bTDC, which shortens the ignition delay for the main injection. The main heat release of the diesel fuel starts almost at the same point that the main injection starts. This result in mixing controlled combustion with high smoke emissions – the NOx could be controlled by the use of EGR. The gasoline does not release any heat during
P. Risberg
86
the compression stroke and it is evident that there is a negative heat release during the main injection as the fuel evaporates. The ignition delay is also far longer for the gasoline which decreases the smoke emissions significantly. It is difficult to say which fuel that is the best diesel-like fuel. It is dependent on what the engine strategy is; is it a hybrid, which injection system is used, what is the compression ratio and what is the allowed pressure rise rate? Is the purpose to reach high loads or to have a large operation window? Some conclusions can, however, be drawn, the best fuel for diesel HCCI should be easy to evaporate to facilitate homogeneity. It should have a high resistance to auto-ignition, not necessarily the highest, one that allows both high and low loads at the given compression ratio and finally it should also function well with the injection system without a significant decrease in injection system life length.

Describing the Auto-Ignition Quality of Fuels in HCCI Engines
87
7 Conclusions The classical auto-ignition quality measurement MON and RON are also relevant also to HCCI combustion, since the auto-ignition process in the HCCI engine and knock in the SI engine are governed by the same reactions. RON or MON cannot alone describe the auto-ignition quality of gasoline-like fuels in HCCI combustion at all conditions. The reason for this is that the reactivity of fuels of different chemistries have different temperature and pressure dependences. Even in cases when RON or MON cannot describe the auto-ignition quality of gasoline-like fuels it is possible to combine RON and MON into an octane index, OI, that describes the auto-ignition quality well at most conditions. The octane numbers are combined into the OI with the variable K according to the following equation:
OI = (1-K)RON + K MON = RON – K S
The OI of a sensitive fuel is the equivalent of the octane number of a primary reference fuel with the same resistance to auto-ignition in the tested condition. The K-value is dependent on the engine condition. At RON conditions the K-value is by definition zero and the K-value equals one at MON conditions. The K-value can, however, be both above one and below zero. It was concluded in this work that the K-value depends on the temperature and pressure history. A generic parameter Tcomp15, the temperature at 15 bar during the compression was introduced to describe the temperature and pressure history. It was found that the K-value increased with increasing Tcomp15. However, the relation was not linear. Therefore the following two equations were proposed to describe the temperature and pressure dependence of the K-value:

P. Risberg
88
for Tcomp15 > 825 K
K = 0.0426(Tcomp15) – 35.2
And for Tcomp15 < 825 K,
K = 0.0056(Tcomp15) – 4.68
It was also found that the K-value increases slightly with decreasing lambda, but it was not significantly affected by the engine speed. At high Tcomp15, that is high temperature, caused by either high intake temperature or retained EGR, and low Tcomp15 caused by a high intake pressure, it is evident that the sensitivity of the fuel octane quality on combustion phasing is small and the auto-ignition quality defined by the OI scale does no longer play a big role. Different fuels of different octane numbers will burn within just a few CAD. NO influences the auto-ignition chemistry and therefore also the combustion phasing. This effect is most significant at low concentration where it advances the combustion phasing considerably. At higher concentrations, NO affects different fuels differently. A sensitive fuel is considered a good gasoline-like HCCI fuel since its OI changes in the same direction as octane requirement of the engine, which would make the engine management easier. It is also likely that a sensitive fuel will enable a wider operating range. The auto-ignition quality of diesel-like fuels was studied with three different strategies of mixture formation. In these tests it was found that the ignition delay increased with a lower cetane number and that the cetane number described the auto-ignition quality well, even for fuels of significantly different

Describing the Auto-Ignition Quality of Fuels in HCCI Engines
89
physical properties. The experiments were, however, made at a limited range of operating conditions and low load. A good diesel-like HCCI fuel should be easy to vaporize to facilitate homogeneity. It should have a high resistance to auto-ignition, not necessarily the highest, one that allows both high and low loads at a given compression ratio and finally it should also function well with the injection system without a significant decrease in the injection system’s life length.

P. Risberg
90
8 Symbols and Abbreviations a Coefficient from multiple regression (Eq.6) a+b The sensitivity of the fuel octane quality on combustion
phasing ASTM American Society for Testing Materials AVT Active Valve Train b Coefficient from multiple regression (Eq.6) BTU British Thermal Unit BTDC Before Top Dead Center c Coefficient from multiple regression (Eq.6) CA5 Crank angle where 5 percent of the accumulated heat release is
reached CA50 Crank angle where 50 percent of the accumulated heat release
is reached CAD Crank Angel Degree CAN Controlled Auto-ignition Number CFR Cooperative Fuel Research Committee CH4 Methane CI Compression Ignited CN Cetane Number CO Carbon monoxide CO2 Carbon dioxide DCN Derived Cetane Number DIB Diisobutylene EGR Exhaust Gas Recycling H2O2 Hydrogen peroxide HC Hydrocarbons HCCI Homogenous Charge Compression Ignition HMN Hepta Methyl Nonane ID Ignition Delay IFP Institut Français du Pétrole IMEP Indicated Mean Effective Pressure IPCC Intergovernmental Panel on Climate Change IQT Ignition Quality Test IUPAC the International Union of Pure and Applied Chemistry K Variable decided by operating point Kpred Predicted K-value MON Motor Octane Number N Engine Speed [RPM] NOx Nitrogen oxide
Describing the Auto-Ignition Quality of Fuels in HCCI Engines
91
N2O Dinitrogen oxide NTC Negative Temperature Coefficient NVO Negative Valve Overlap OI Octane Index OI0 Octane Index for a fuel with the combustion centred at TDC p Pressure Pmaxcomp Compression pressure at TDC assuming that there is no heat
release [Pa] PFI Port Fuel Injection PRF Primary Reference Fuel R2 Coefficient of determination RON Research Octane Number S Sensitvity (RON-MON) SCR Selective Catalytic Reduction SI Spark ignited T Temperature T Time Tcomp15 Temperature when the pressure reaches 15 bar during the
compression stroke [°K] Tmaxcomp Compression temperature at TDC assuming that there is no
heat release [K] TDC Top Dead Centre TRF Toluene Reference Fuel λ Normalized air-fuel ratio τi Induction time

P. Risberg
92
9 References [1] Heywood, J.B., "Internal combustion engine fundamentals”, McGraw
Hill Book Co., 1988 [2] Bosch, “Automotive handbook” 4th Edition, 1996 [3] Stone, R., “Introduction to Internal Combustion Engines” SAE
International,. 1992 [4] Dec, J.E., “ A conceptual model of DI Diesel combustion based on laser
sheet imaging”, SAE 970873, 1997. [5] “Putting Energy in the Spotlight - BP Statistical Review of World
Energy” June 2005 [6] “Nuffield Advanced Science Book of Data” Longman 1996 [7] Energy Information Administration, “International Energy Outlook 2004”,
http://www.eia.doe.gov/, 2005-03-01 [8] Svenska Naturskyddsföreningen, http://www.snf.se, 2005-03-01 [9] Keeling C.D., Whorf T.P., “Atmospheric CO2 concentrations (ppmv)
derived from in situ air samples collected at Mauna Loa Observatory, Hawaii”, the Carbon Dioxide Research Group, Scripps Institution of Oceanography (SIO), University of California, http://cdiac.ornl.gov/ftp/trends/co2/maunaloa.co2, 2005-03-01
[10] Goddard Institute for Space Studies, “Global Temperature Anomalies”, http://www.giss.nasa.gov/data/update/gistemp/GLB.Ts.txt, 2005-03-01
[11] Naturvårdsverket “Klara Fakta om Klimatförändringen”, 2002 [12] Naturvårdsverket ”Sweden’s National Inventory Report 2004” [13] United States Environmental Protection Agency, “NOx – How nitrogen
oxides affect the way we live and breathe”, http://www.epa.gov/, 2005-03-01
[14] Miljöeffekter kompendium i miljöskydd, del 4” Industriellt miljöskydd, KTH 1997.
[15] United States Environmental Protection Agency, http://www.epa.gov/, 2005-03-01
[16] Dieselnet, http://www.Dieselnet.com/ [17] European Commission, “EU Strategy on CO2 emissions from
passenger cars”, http://europa.eu.int/comm/environment/ [18] Zhao, F., “Homogeneous Charge Compression Ignition (HCCI)
Engines: Key Research and Development Issues”, ISBN 0-7680-1123-X, SAE International, 2003.

Describing the Auto-Ignition Quality of Fuels in HCCI Engines
93
[19] Christensen, M. “HCCI Combustion – Engine Operation and Emission Characteristics.” Doctoral Thesis, Lund Institute of Technology, 2002
[20] U.S. Department of Energy, “Homogeneous Charge Compression Ignition (HCCI) Technology” A Report to the U.S. Congress, 2001
[21] The Lawrence Livermore National Laboratory, http://www-cms.llnl.gov/combustion/combustion2.html, 2005-03-01
[22] Westbrook, C.K., “Chemical kinetics of hydrocarbon ignition in practical combustion systems”, Proceedings of the Combustion Institute, vol.28, pp 1563-1577, 2000.
[23] Glaude, P. A.,Conraud, V. et al. “Modeling the Oxidation of Mixtures of Primary Reference Automobile Fuels” Energy & Fuels 2002, 16, 1186-1195
[24] Tanaka, S., Ayala, F., Keck, J.C. and Heywood, J.B, “Two-stage ignition in HCCI Combustion and HCCI combustion control by fuels and additives”, Combust. Flame, vol. 132, pp 219-239, 2003.
[25] Giovangigli, V., Smooke, M. D., “Extinction of Strained Premixed Flames with Complex Chemistry”, Combust. Sci. Thec., 53, 23, 1987
[26] Simmie, J.M., “ Detailed chemical kinetic models for the combustion of hydrocarbon fuels”, Prog. Energy Combust. Sci., vol. 29, p 599, 2003.
[27] Livengood, J.C. and Wu, P.C., “Correlation of auto-ignition phenomenon in internal combustion engines and rapid compression machines”, Proceedings of Fifth International Symposium on Combustion, p 347, Reinhold, 1955.
[28] Douaud, A. M. and Eyzat, P., “Four-Octane-Number method for predicting the anti-knock behavior of fuels and engines,” SAE paper 780080, SAE Trans., vol. 87, 1978.
[29] Bradley, D., Morley, C., Walmsley, H., “Relevance of Research and Motor Octane numbers to the prediction of engine auto-ignition”, SAE 2004-01-1970
[30] Yates, A., D., B., Swarts, A., Viljoen, C., L., ”Correlating Auto-Igntion Delays and Knock-Limited Spark-Advance Data for Different Types of Fuel” SAE 2005-01-2083
[31] Owen, K. and Coley, T. “Automotive fuels reference book”, SAE, Warrendale PA, 1995.
[32] Bell, A.G., “The relationship between octane quality and octane requirement”, SAE 750935, 1975
[33] Leppard, W.R., “ The chemical origin of fuel octane sensitivity”, SAE 902137, 1990.
P. Risberg
94
[34] American Society for Testing Materials: Designation: D 6890-03a, “Standard test method for determination of ignition delay and derived cetane number (DCN) of Diesel fuel oils by combustion in a constant volume chamber”, Annual book of ASTM Standards, vol. 5.05, 2003.
[35] Ryan, T.W. and Matheaus, A., “ Fuel requirements for HCCI engine operation”, THIESEL 2002, Thermo and Fluid Dynamic Processes in Diesel Engines, 2002.
[36] Jeuland, N., Montagne, X., Duret, P., “Engine and fuel-related issues of gasoline CAI (controlled auto-ignition) combustion”, SAE 2003-01-1856, JSAE20030349
[37] Kalghatgi, G.T. and Head, R.A., “The available and required auto-ignition quality of gasoline-like fuels in HCCI engines at high temperatures” – SAE 2004-01-1969
[38] Kalghatgi, G.T. and Head, R.A., “Combustion limits and efficiency in a HCCI engine” Int. J Engine Research, 2006
[39] Aroonsrisopon T, Sohm V., Werner P. and Foster D., “An Investigation Into the Effect of Fuel Composition on HCCI Combustion Characteristics” SAE 2002-01-2830
[40] Koopmans, L., Stromberg, E. and Denbratt, I., “The influence of PRF and commercial fuels with high octane number on the auto-ignition timing of an engine operated in HCCI combustion mode with negative valve overlap”, SAE 2004-01-1967.
[41] Kalghatgi, G.T., “Fuel anti-knock quality - Part I, Engine Studies”, SAE 2001-01-3584, 2001, SAE Transactions – Journal of Fuels and Lubricants, Vol.110.
[42] Griffiths, J.F., Halford-Maw, P.A. and Mohammed, C., “Spontaneous ignition delays as a diagnostic of the propensity of alkanes to cause engine knock”, Combustion and Flame 111, pp 327-337, 1997
[43] Sjöberg, M. and Dec, J. “Combined Effects of Fuel-type and Engine Speed on Intake Temperature Requirements and Completeness of Bulk-gas Reactions for HCCI Combustion”, SAE 2003-01-3173
[44] Sjöberg, M. and Dec, J. “Isolating the Effects of Fuel Chemistry on Combustion Phasing in an HCCI Engine and the Potential of Fuel Stratification for Ignition Control”, SAE 2004-01-0557
[45] Kalghatgi, G.T.,“Auto-ignition Quality of Practical Fuels and Implication for Fuel Requirements of Future SI and HCCI Engines” SAE 2005-01-0239
[46] Fieweger, K., Blumenthal, R. and Adomeit, G., “Self-igntion of S.I. engine model fuels: a shock tube investigation at high pressure,” Combust. Flame, 109, 599-619 (1997).

Describing the Auto-Ignition Quality of Fuels in HCCI Engines
95
[47] Prabhu, S.K., Li, H., Miller, D.L. and Cernansky, N.P., “The Effect of Nitric Oxide on Autoignition of a Primary Reference Fuel Blend in a Motored Engine”, SAE 932757
[48] Burluka, A.A., Liu, K., Sheppard, C.G.W., Smallbone, A.J. and Woolley R., “The Influence of Simulated Residual and NO concentrations on Knock Onset for PRFs and Gasolines”, SAE 2004-01-2998
[49] Kimura, S., Aoki, O., Kitahara, Y. And Aiyoshizawa, E., “Ultra-clean combustion technology combining a low-temperature and pre-mixed combustion concept for meeting future emission standards”, SAE 2001-01-0200
[50] Pöttker, S., Eckert, P., Merker, G.P., “Homogeneous Charge Compression Ignition with Synthetic Fuels” MTZ 12/2005 Volume 66 27-29
[51] Kitano, K., Nishiumi, R., Tsukasaki, Y., Tanaka, T. And Morinaga, M., “Effects of Fuel Properties on Premixed Charge Compression Ignition Combustion in a Direct Injection Diesel Engine“, SAE 2003-01-1815
[52] Steinbach, N., Harndorf, H., Weberbauer, F. And Thiel, M. “Potential of Synthetic Diesel Fuels“ MTZ 02/2006 Volume 67 9-12
[53] Kobori, S., Kamimoto, T. and Aradi, A. A. „A Study of Igntion Delay of Diesel Sprays“ Int. J Engine Research, Vol 1, no. 1, 29-39, 2000
[54] Wang, J., Neely, G. D. and Ryan, T. W., “On-Board Fuel Property Classifier for Fuel Property Adaptive Engine Control System”, SAE 2006-01-0054