descriptive statistics renan levine. frequency table one can easily display all of the responses to...
TRANSCRIPT

Descriptive Statistics
Renan Levine

Frequency Table
One can easily display all of the responses to survey questions in a frequency table.
Ipsos-Reid Canadian Online Year End Poll, Dec. 3-10, 2012. N=1021 registered voters nationwide. Margin of error ± 3.5%Results accessed on-line at: http://www.globaltvedmonton.com/canadians+losing+confidence+in+rcmp+poll/6442780370/story.html
As you may know, the Royal Canadian Mounted Police, otherwise known as the RCMP, has been in the news lately. When it comes to the most senior leadership at the highest levels of the RCMP in its management and accountability of the force, overall, do you think they are doing a:Great job: 9.0% Good job: 37.0%Fair job: 38.0% Terrible job: 16.0%

Describe the distribution of the responses!
Let me suggest:More than half of all Canadians think that the RCMP is doing a ________ including _____ who think the RCMP is doing a terrible job. _____ think the RCMP is doing a good or great job.
From this we would conclude that Canadians are {badly split}/{tend to agree/___} on the RCMP.
As you may know, the Royal Canadian Mounted Police, otherwise known as the RCMP, has been in the news lately. When it comes to the most senior leadership at the highest levels of the RCMP in its management and accountability of the force, overall, do you think they are doing a:Great job: 9.0% Good job: 37.0%Fair job: 38.0% Terrible job: 16.0%
Professional sounding descriptions Univariate descriptive statistics exist to
succinctly give people a mental picture of the distribution of the observations.
Primary focus on what is the “typical” observation. Average (mean) response Middle (median) response Most common response (mode)
Secondary: how typical is “typical” (or, are many observations different from “typical”).
Typical? Measures of central tendency Mode = Most frequent observation.
Just look at which category has the most observations.
Median = observation in the middle Order observations by category in ascending or
descending order. Look at which category has the “middle” observation,
so that , half of all observations are higher, half are lower.
Mean = Average
Calculating an Average
Order the observations in ascending or descending order.
Value 1 * Number of Observations = X Value 2 * Number of Observations = Y Value 3 * Number of Observations = Z Average = (X+Y+Z) ÷ by the total number of
observations. Mean is just a technical name for an average.

What is typical?
Choosing the right descriptive statistic depends primarily on the level of measurement of the variable.
To ascertain what is “typical” one must first assess what level of measurement is used.

Levels of Measurement: Nominal Nominal – categories are unordered
Only differentiates categories. Categories are presented in an arbitrary order. Usually includes dichotomous variables. Examples:
Provinces (QC, ON, NB, BC…) Occupation (Teacher, Manager, Retail clerk…) Which party did you vote for in the last election? (Liberals, NDP,
Greens…) Do you approve of the performance of the Prime Minister? (Yes, No, I
don’t know)

Nominal? Use mode. Do you approve of the job performance of the current
Minister of Human Resources and Social Development ? Yes – 37% No - 48% I don’t know – 15%^
Nominal variables are unordered, so one cannot order the categories in order to find the median or the mean.
Only “typical” measure one can rely on is mode, most frequent observation. In example above, mode = “No” with 48% Mode is more concise than saying, “just under half of all
Canadians approve of the Minister of Human Resources, with 15% saying they do not know…”
Mode
Every variable has a mode or modal category.
Can be identified simply by looking at the number of frequencies in each category.
If two categories are tied for the honor of having the most observations, then the variable is said to be “bimodal”
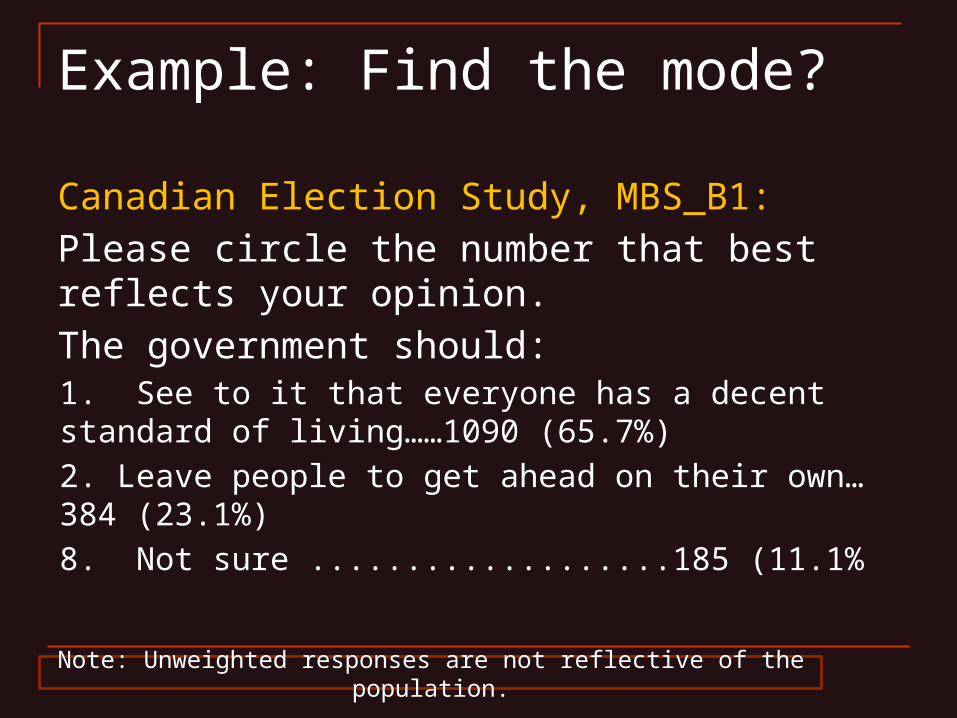
Example: Find the mode?
Canadian Election Study, MBS_B1:
Please circle the number that best reflects your opinion.
The government should:1. See to it that everyone has a decent standard of living……1090 (65.7%)
2. Leave people to get ahead on their own… 384 (23.1%)
8. Not sure ...................185 (11.1%
Note: Unweighted responses are not reflective of the population.

Levels of Measurement: Ordinal Ordinal – ordered, but no set distance
between categories/values. Examples:
Any question that presents a statement and asks respondents to indicate: Strongly agree, agree, neither agree nor disagree, disagree, or strongly disagree, like: We have gone too far in pushing equal rights in this country
(Canadian Election Survey 2004, MBS_A1) People who don’t vote have no right to criticize the
government (Canadian Election Survey 2004, MBS_E1)
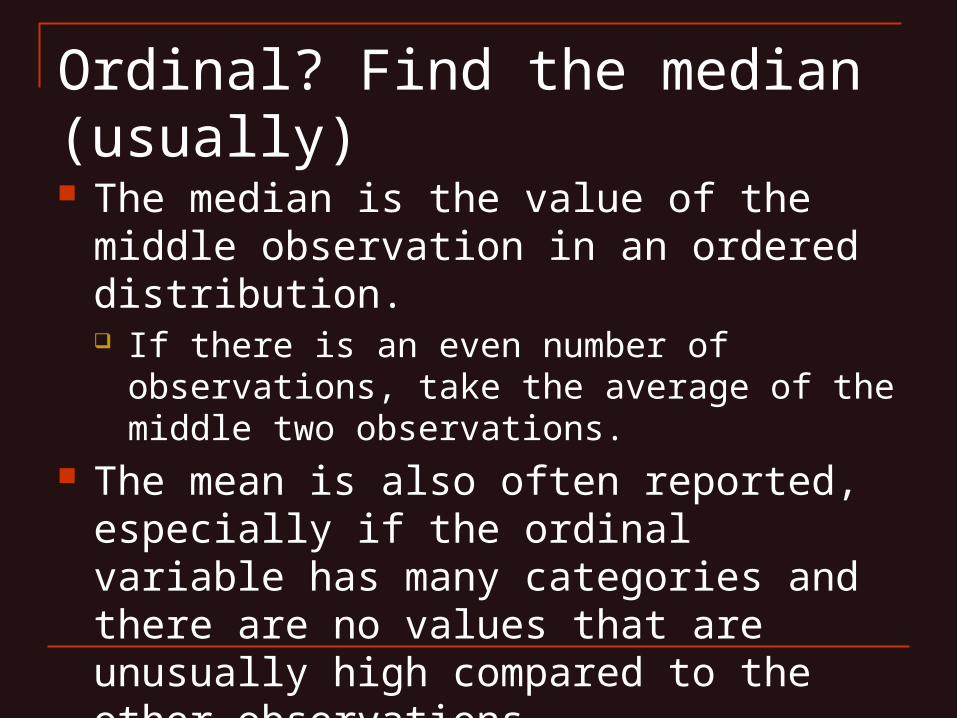
Ordinal? Find the median (usually) The median is the value of the middle
observation in an ordered distribution. If there is an even number of observations, take
the average of the middle two observations. The mean is also often reported, especially if
the ordinal variable has many categories and there are no values that are unusually high compared to the other observations.

Median Example
What is the median number of years between each of the last ten elections (going back to 1980, Liberal Pierre Trudeau’s last triumph)? There were ten elections, with gaps* of 4 years, 4 years, 5, 4, 3, 4, 2, 2, and 3 years.
First, order the observations in ascending order: 2,2,3,4,4,4,4,4,5
There are nine observations, so the median is the fifth one in order (red box).
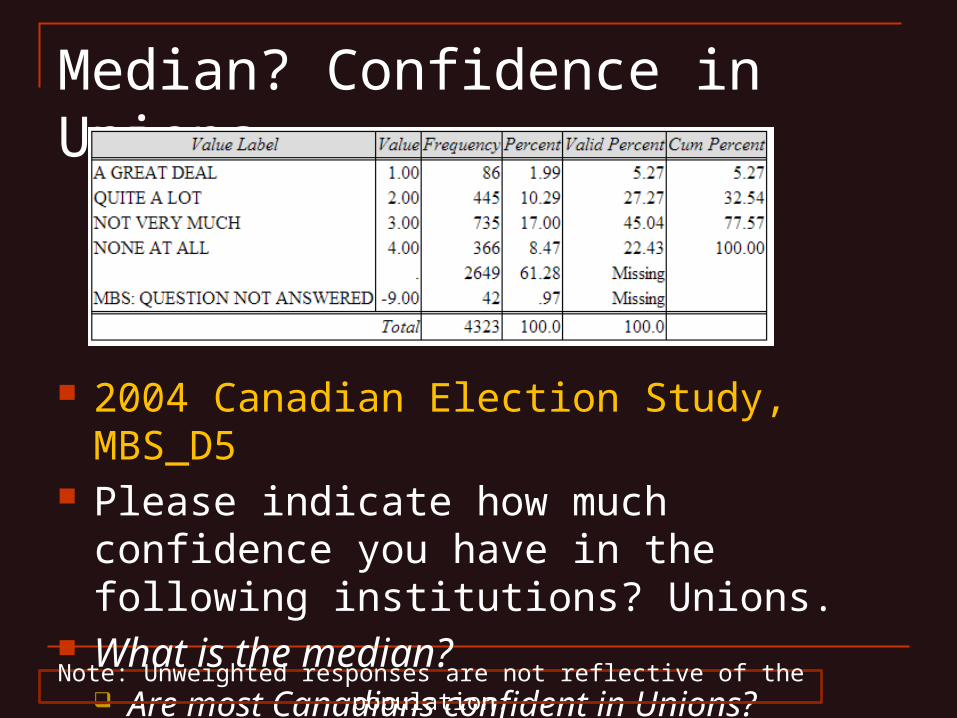
Median? Confidence in Unions
2004 Canadian Election Study, MBS_D5 Please indicate how much confidence you
have in the following institutions? Unions. What is the median?
Are most Canadians confident in Unions?
Note: Unweighted responses are not reflective of the population.
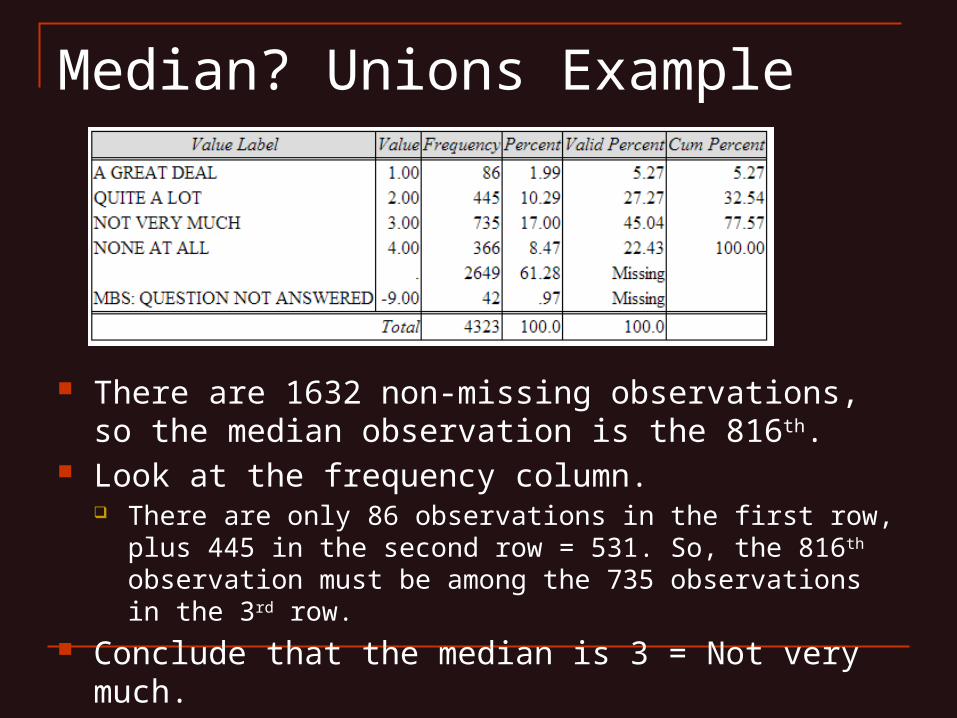
Median? Unions Example
There are 1632 non-missing observations, so the median observation is the 816th.
Look at the frequency column. There are only 86 observations in the first row, plus 445 in the
second row = 531. So, the 816th observation must be among the 735 observations in the 3rd row.
Conclude that the median is 3 = Not very much.
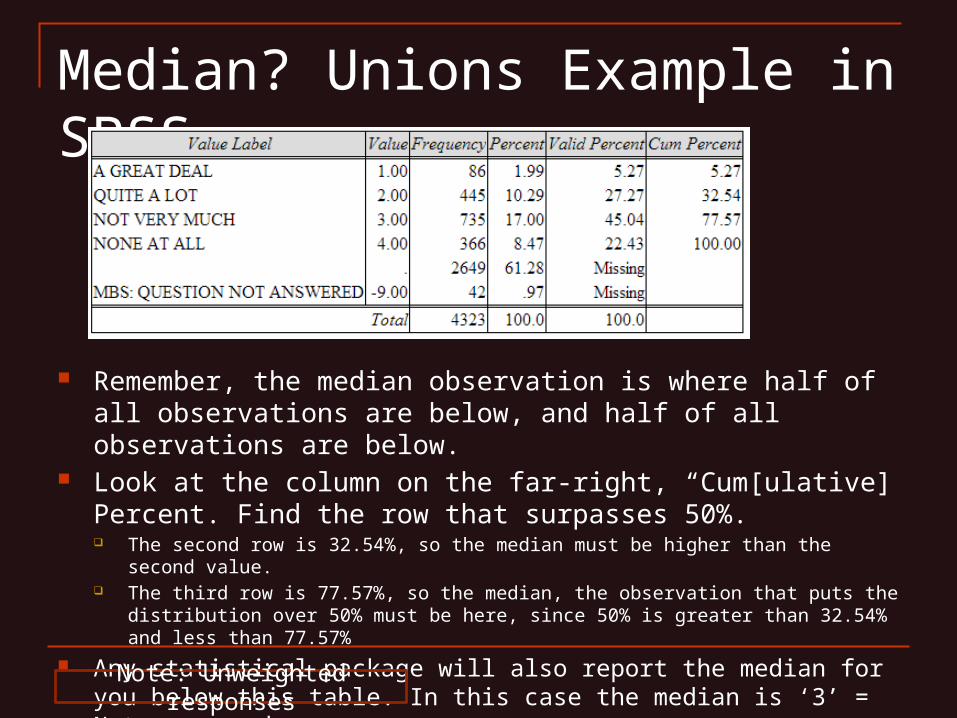
Median? Unions Example in SPSS
Remember, the median observation is where half of all observations are below, and half of all observations are below.
Look at the column on the far-right, “Cum[ulative] Percent. Find the row that surpasses 50%. The second row is 32.54%, so the median must be higher than the second value. The third row is 77.57%, so the median, the observation that puts the distribution over 50%
must be here, since 50% is greater than 32.54% and less than 77.57%
Any statistical package will also report the median for you below this table. In this case the median is ‘3’ = Not very much.
Note: Unweighted responses

Median Example II: BilingualismWE HAVE GONE TOO FAR IN PUSHING BILINGUALISM IN CANADA.
Value Label Value Frequency Percent^ Valid Percent Cum Percent
STRONGLY AGREE 1.00 406 9.39 25.84 25.84
AGREE 2.00 474 10.96 30.17 56.02
DISAGREE 3.00 488 11.29 31.06 87.08
STRONGLY DISAGREE 4.00 203 4.70 12.92 100.00
TOTAL . 1571
What is the median observation? In other words, do most Canadians agree
that we have gone too far in pushing bilingualism in Canada?
Note: Unweighted responses

Levels of Measurement: Interval/Ratio Interval/ratio- ordered with standardized
distances between categories/values. Sometimes called “continuous” variables (along
with some ordinal variables with plentiful categories).
Examples: Temperature (F or C) Income Gross Domestic Product (GDP)
Continuous? Look at the mean (usually) For interval/ratio data, the mean should be
reported. Survey data is rarely interval/ratio, but also look at
the mean when the data is ordinal with many categories.

Calculating an Average
Order the observations in ascending or descending order.
Value 1 * Number of Observations = X Value 2 * Number of Observations = Y Value 3 * Number of Observations = Z Average = (X+Y+Z) ÷ by the total number of
observations. Mean is just a technical name for an average.

Ex: Population living on $2 a day
05
1015
20P
erce
nt
0 20 40 60 80 100Population Below $2 a Day (%)
Source: Quality of Government (QoG) v6, April 2011
Mean=42.6

Feelings towards Conservative Party
Strongly
Dislike
0 1 2 3 4 5 6 7 8 9
Strongly
Like 1
00
2
4
6
8
10
12
14
16
18
%
Source: Canadian Election Study, 2008, CES_MBS_I10a [National Weight]
Mean = 4.8
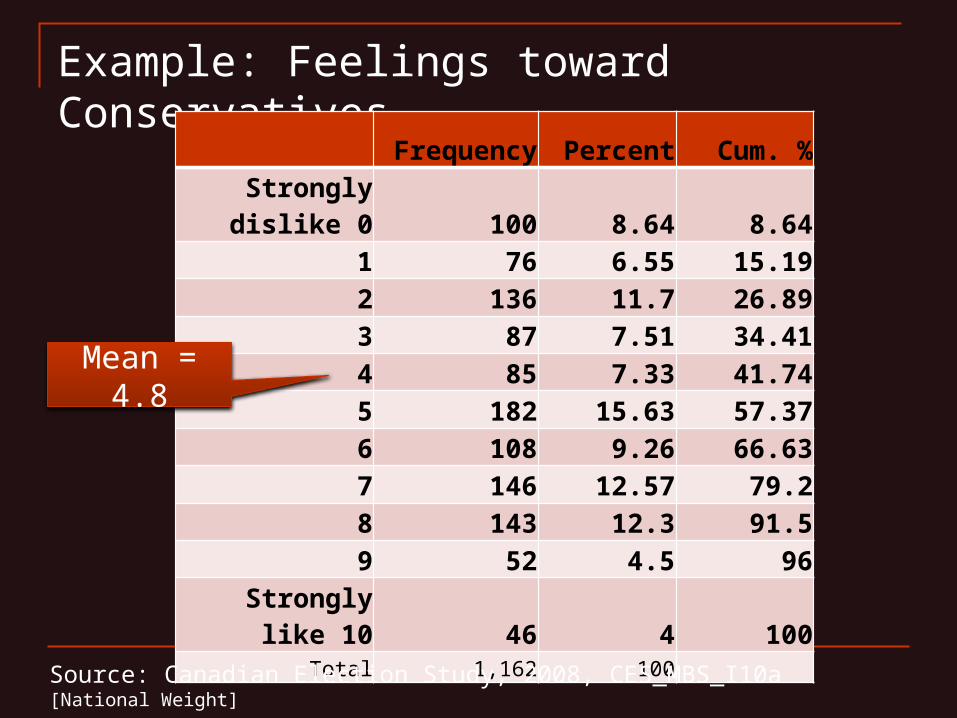
Example: Feelings toward Conservatives
Frequency Percent Cum. %
Strongly dislike 0 100 8.64 8.641 76 6.55 15.192 136 11.7 26.893 87 7.51 34.414 85 7.33 41.745 182 15.63 57.376 108 9.26 66.637 146 12.57 79.28 143 12.3 91.59 52 4.5 96
Strongly like 10 46 4 100Total 1,162 100
Source: Canadian Election Study, 2008, CES_MBS_I10a [National Weight]
Mean = 4.8

Check the median too.
The mean is more sensitive to extreme values. When there are one or more observations that are
very different than most of the other observations, the mean will be very different than the median.
You may need to use your judgement as to whether to report the mean or the median.
Best to also check the median. If there are no extreme outliers, the median and
mean will be similar.

Trimmed Mean
With continuous (interval/ratio) variables, some scholars will report the “10% trimmed mean.”
To solve the problem of extreme outliers making the mean atypical of the observations, the trimmed mean calculates the average of all the observations except the highest and lowest 10 percent of the observations. In a perfectly symmetrical distribution, the mean is the
same as the median and the trimmed mean.
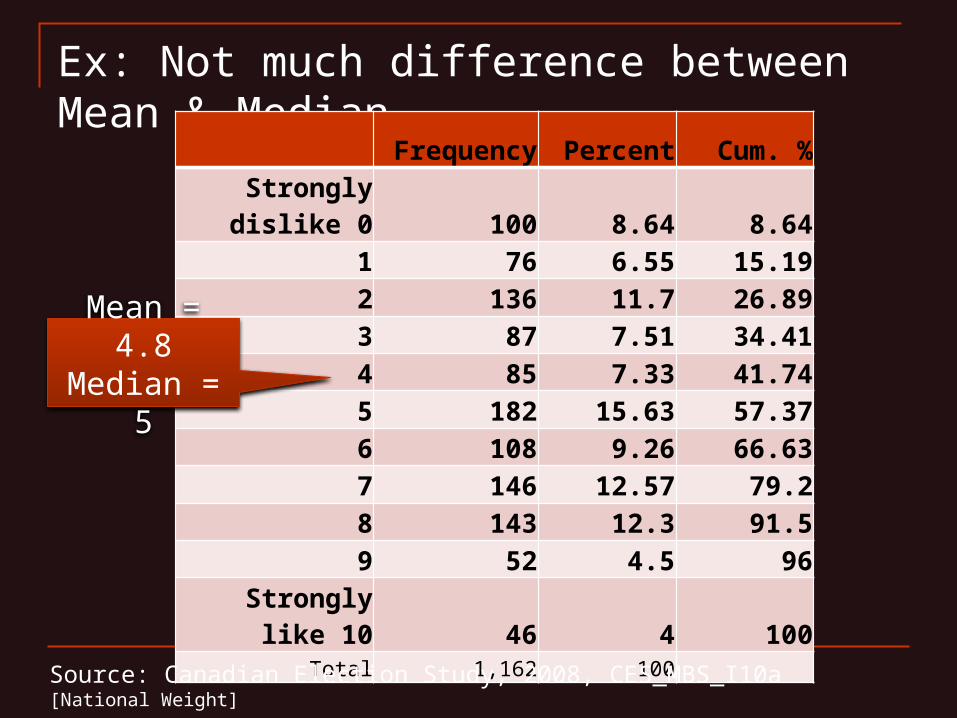
Ex: Not much difference between Mean & Median
Frequency Percent Cum. %
Strongly dislike 0 100 8.64 8.641 76 6.55 15.192 136 11.7 26.893 87 7.51 34.414 85 7.33 41.745 182 15.63 57.376 108 9.26 66.637 146 12.57 79.28 143 12.3 91.59 52 4.5 96
Strongly like 10 46 4 100Total 1,162 100
Source: Canadian Election Study, 2008, CES_MBS_I10a [National Weight]
Mean = 4.8Median = 5

Example: Real GDP – Large Differences
010
2030
Per
cent
0 10000 20000 30000 40000 50000Real GDP per Capita
Source: Gleditsch, K. S. 2002 via Quality of Government (QoG) v6, April 2011
Mean = $9,089.82
Median = $5,194.48Mean is sensitive
to a few very wealthy countries
Trimmed Mean = $7549