descriptive stats
TRANSCRIPT
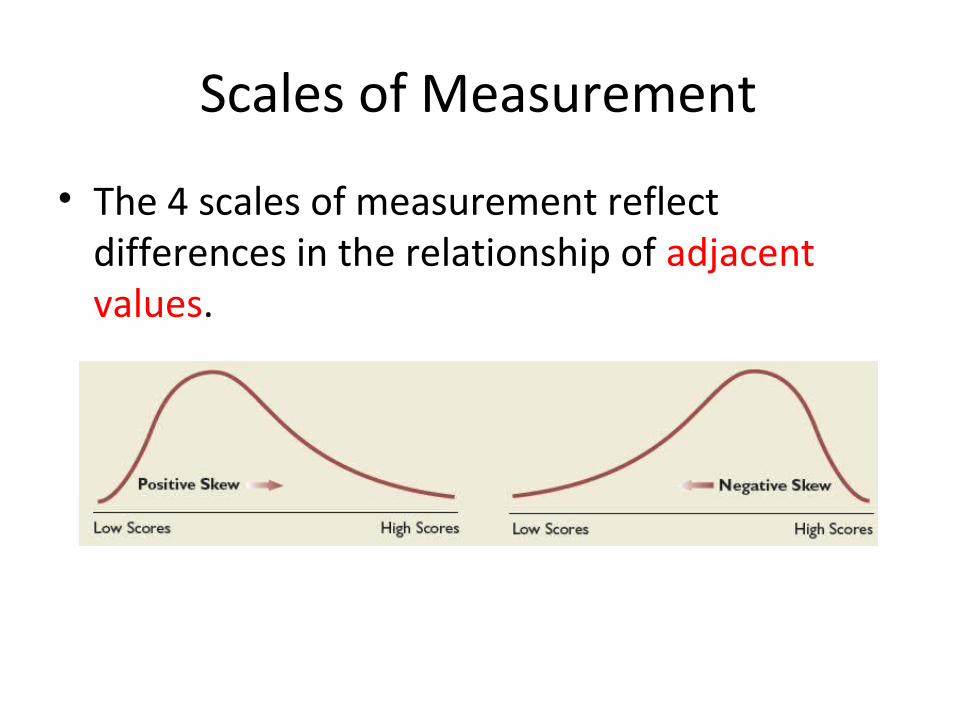
Scales of Measurement
• The 4 scales of measurement reflect differences in the relationship of adjacent values.
Measurement on Nominal Scales
• On Nominal Scales there is no relationship between adjacent values. Higher values are not better or worse than lower values. e.g., Number 57 on the football team may or may not be a better player than number 56.
• Nominal Numbers: social security, telephone numbers, uniform numbers
• Nominal Names: given names, male-female, flavor names at the ice cream parlor
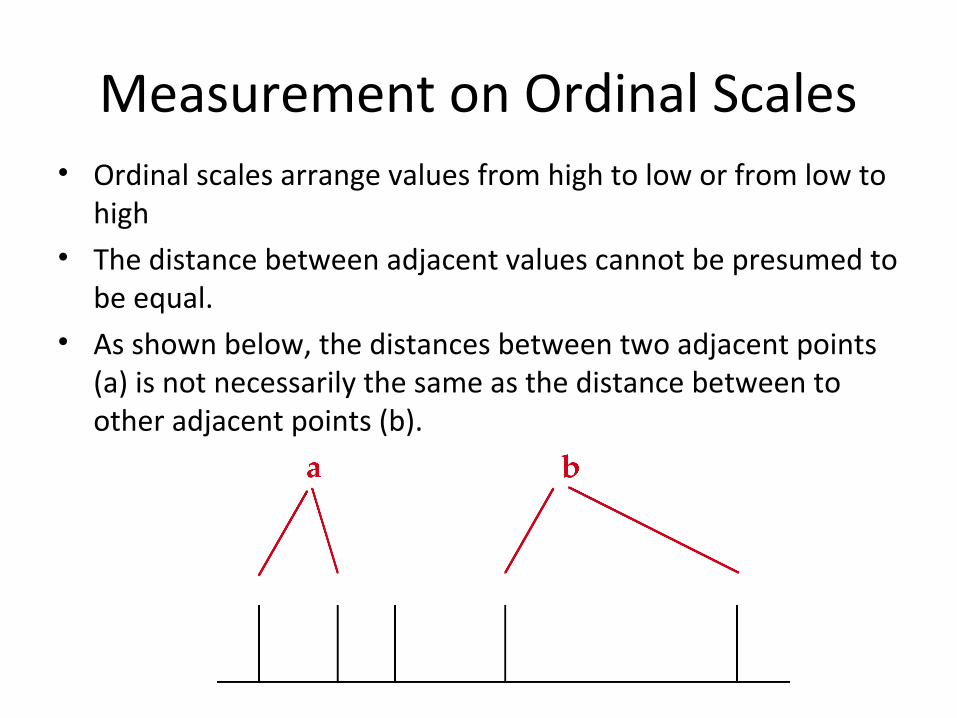
Measurement on Ordinal Scales• Ordinal scales arrange values from high to low or from low to
high• The distance between adjacent values cannot be presumed to
be equal.• As shown below, the distances between two adjacent points
(a) is not necessarily the same as the distance between to other adjacent points (b).
Ordinal Scales in Daily Life
• Numerical Ranks: Standing in the graduation class, letter grades (usually), ranks in military service.
• Verbal Ranks: worst to best ratings, biggest to smallest ratings, winner to last runner up.
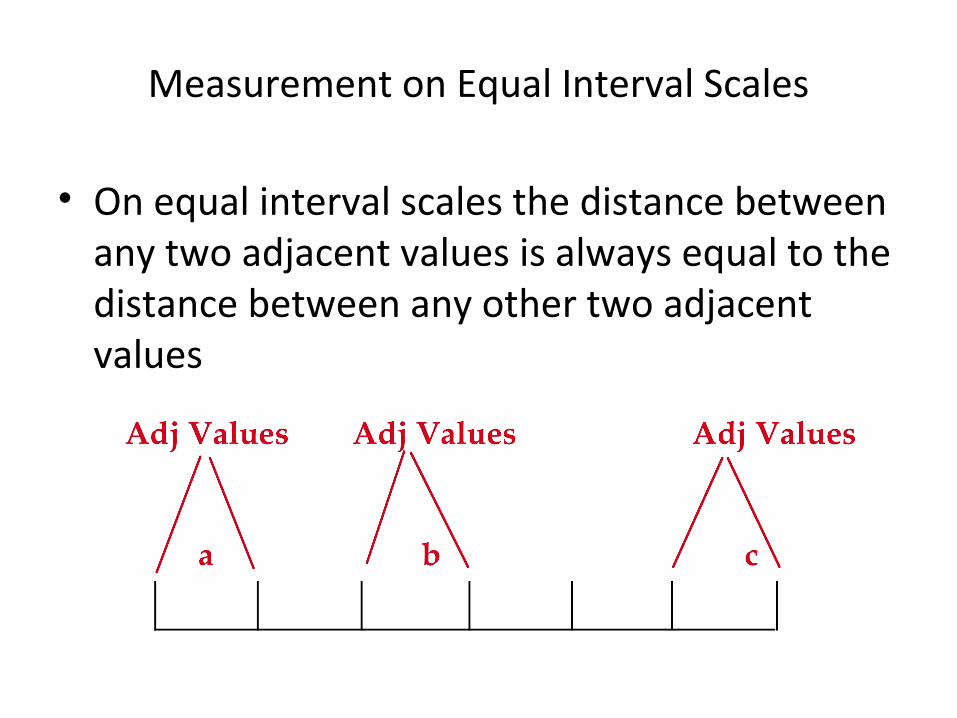
Measurement on Equal Interval Scales
• On equal interval scales the distance between any two adjacent values is always equal to the distance between any other two adjacent values
Equal Interval Scales in Daily Life
• Physical measurements: lengths, weights, temperature
• Warning: just because the values on the scale are numbers does not mean the scale is equal interval.
• Advantages: Unlike nominal and ordinal scales, variable measured on equal interval scales can be added, subtracted, multiplied, and divided.
Measurement on Ratio Scales
• A ratio scale is a special equal interval scale with a logical and absolute 0.
• Examples of ratio scales:– Weight (0 is an absence of weight),– Blood pressure (0 is an absence of BP)
• Non Examples of ratio scales• Temperature in Fahrenheit and Celsius• Scores on standardized tests
• Advantage of Ratio Scales: you can construct ratios (e.g., Bill is 72 inches tall; Greg is 36 inches tall. Bill is twice as tall as Greg.)
Comparing the Scales
• Values of variables are named on all scales• Values are ordered on ordinal, equal interval,
and ratio scales.• Values can be added, subtracted, multiplied,
and divided on equal interval and ratio scales.• Values can be formed into ratios on ratio
scales.
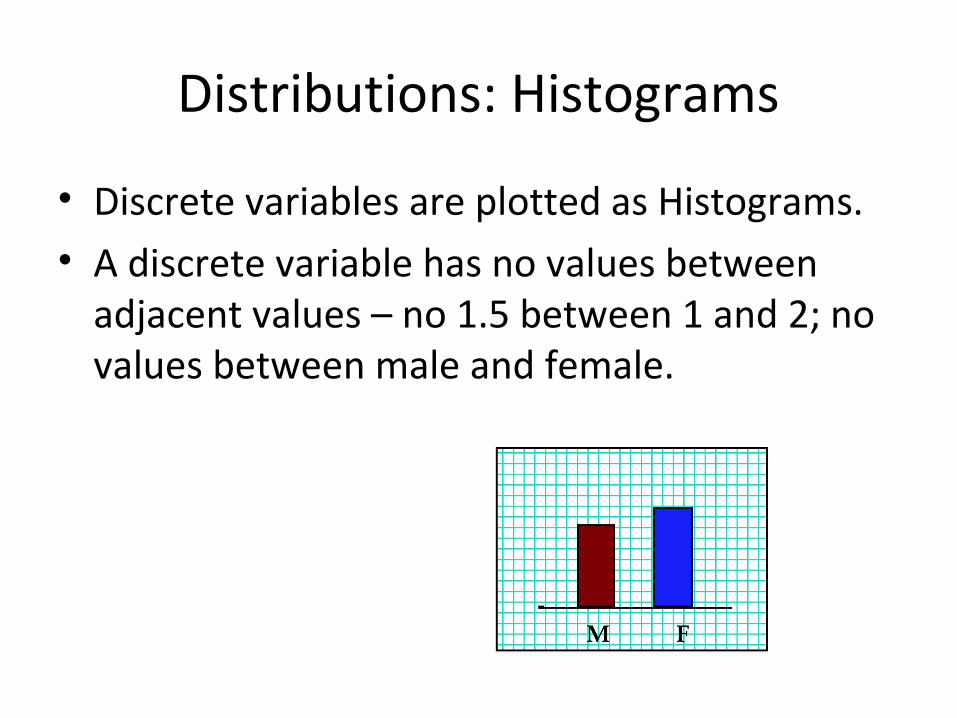
Distributions: Histograms
• Discrete variables are plotted as Histograms. • A discrete variable has no values between
adjacent values – no 1.5 between 1 and 2; no values between male and female.
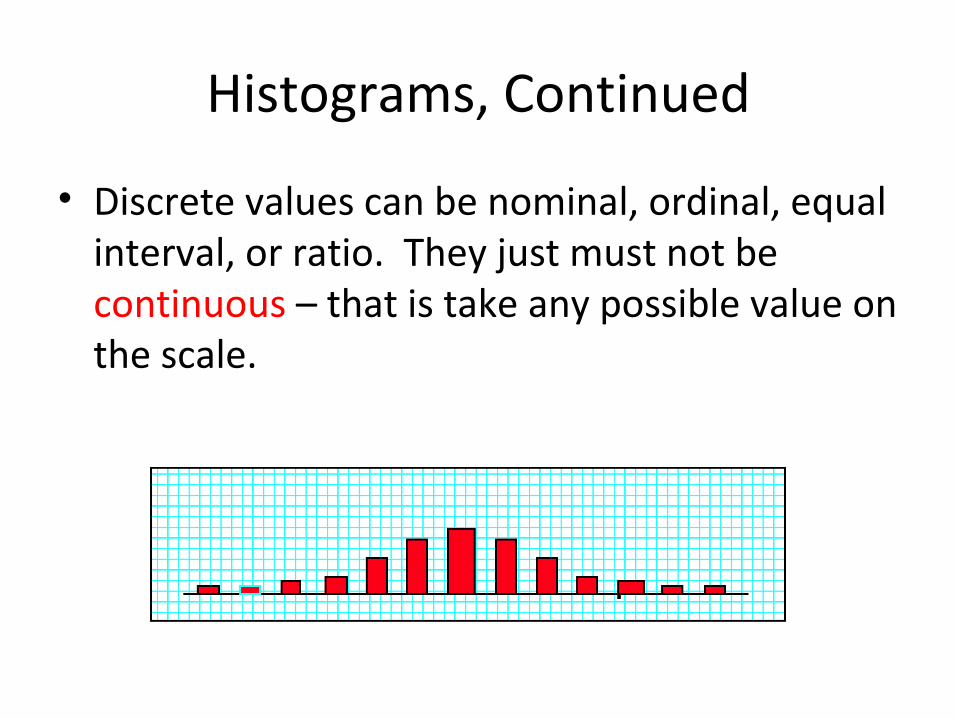
Histograms, Continued
• Discrete values can be nominal, ordinal, equal interval, or ratio. They just must not be continuous – that is take any possible value on the scale.
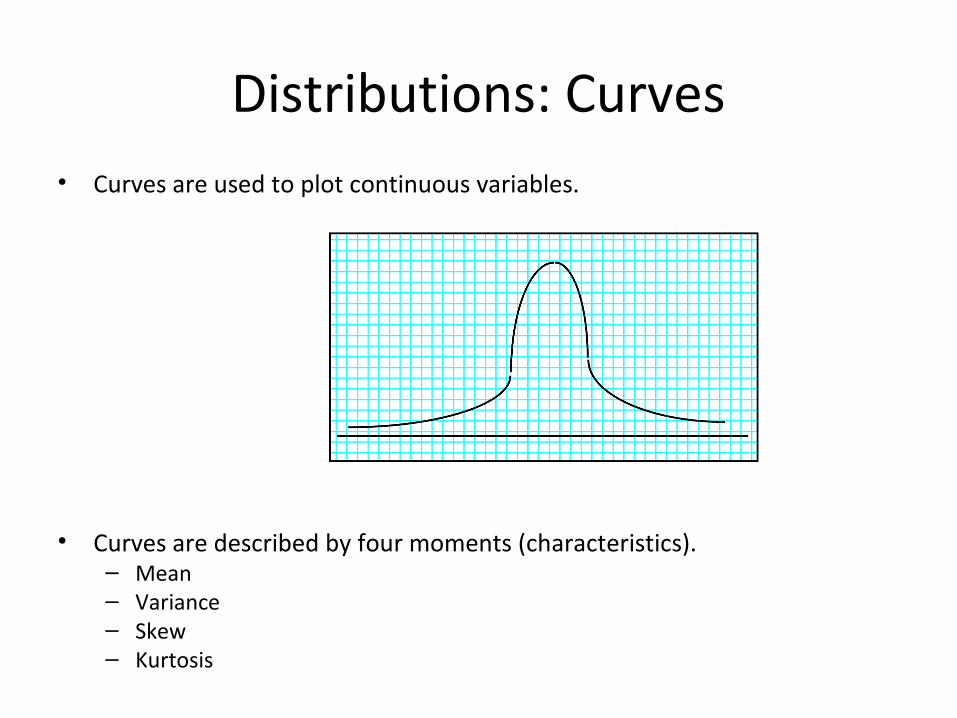
Distributions: Curves• Curves are used to plot continuous variables.
• Curves are described by four moments (characteristics).– Mean– Variance– Skew– Kurtosis
A brief digression:Populations and Samples
• A population is all of the people of interest• A sample is a subset of the population• Sample values are used to estimate
population .• Symbols
Moments of a Curve: Mean
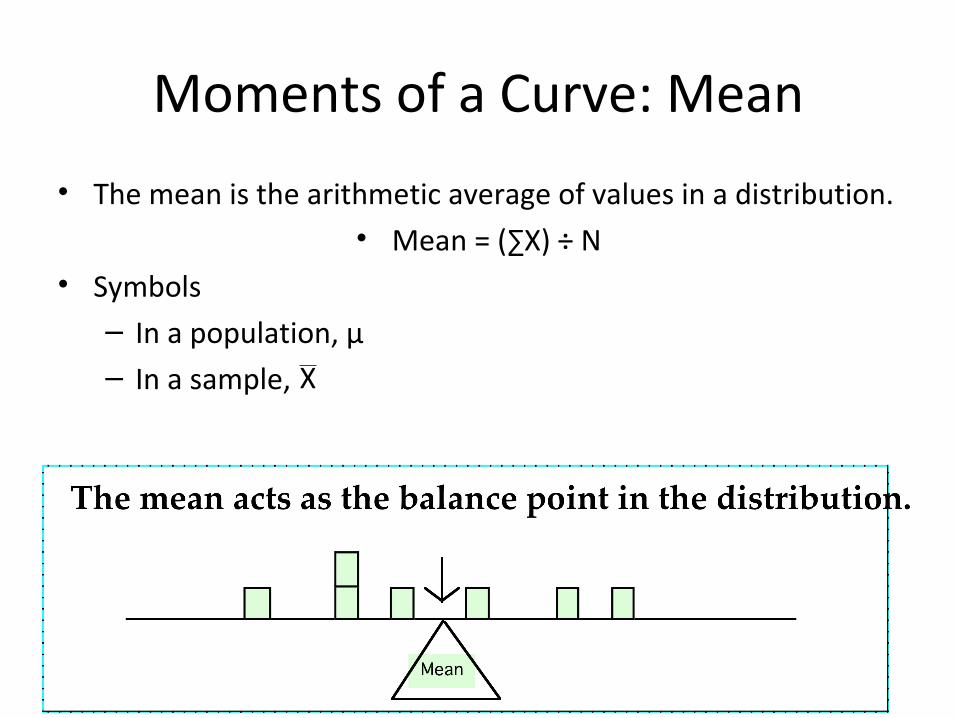
• The mean is the arithmetic average of values in a distribution.• Mean = (∑X) ÷ N
• Symbols– In a population, µ– In a sample,
€
X
Moments of a Curve: Variance
• Definition. The variance is the average squared distance of each score from the mean of the distribution.
• Interpretation: The variance describes the dispersion of scores around the mean. Distributions with wide dispersions have large variances; distributions with small variances have little dispersion. Variance is unrelated to the number of scores in the distribution.
• Symbols– In the population,– In a sample, S2
€
2∑
Digression to Standard Deviation
• The standard deviation is the square root of the variance– For example, if S2 is 25, the standard deviation is 5.
• Uses of the standard deviation– In measurement, standard deviations are used as
a unit of measurement or as a score• Symbols– In a population, σ– In a sample, S
Moments of a Curve: Skew
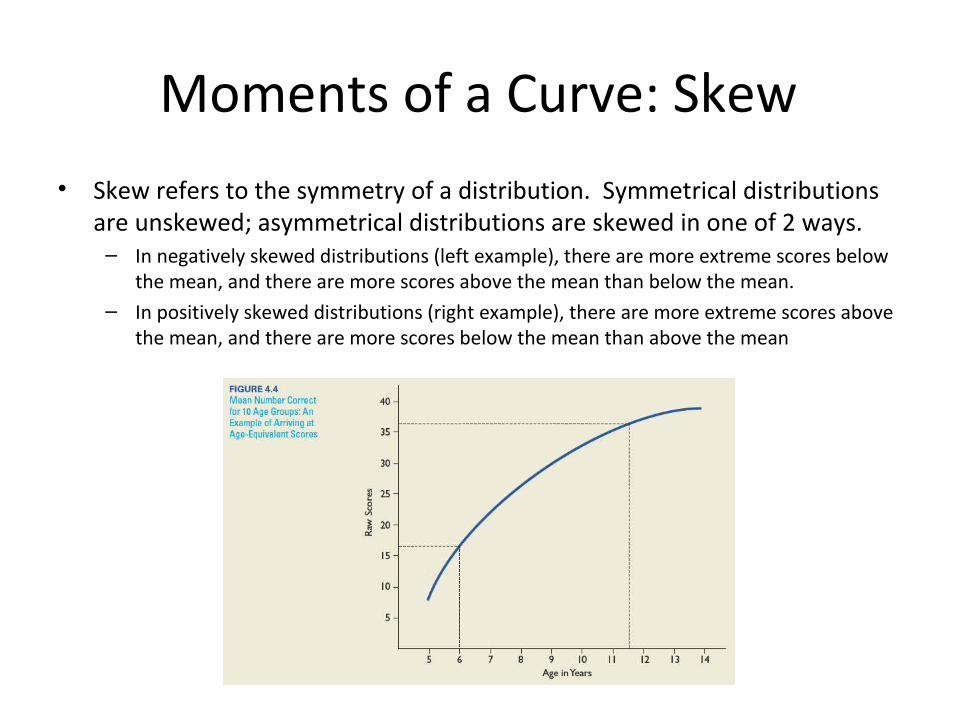
• Skew refers to the symmetry of a distribution. Symmetrical distributions are unskewed; asymmetrical distributions are skewed in one of 2 ways.– In negatively skewed distributions (left example), there are more extreme scores below
the mean, and there are more scores above the mean than below the mean.– In positively skewed distributions (right example), there are more extreme scores above
the mean, and there are more scores below the mean than above the mean
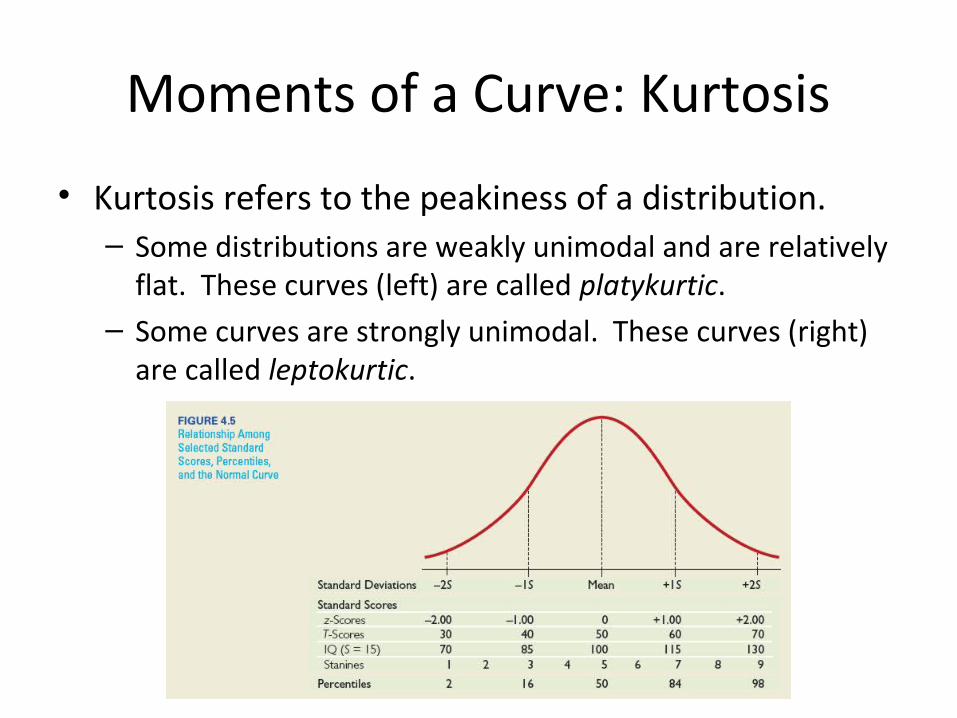
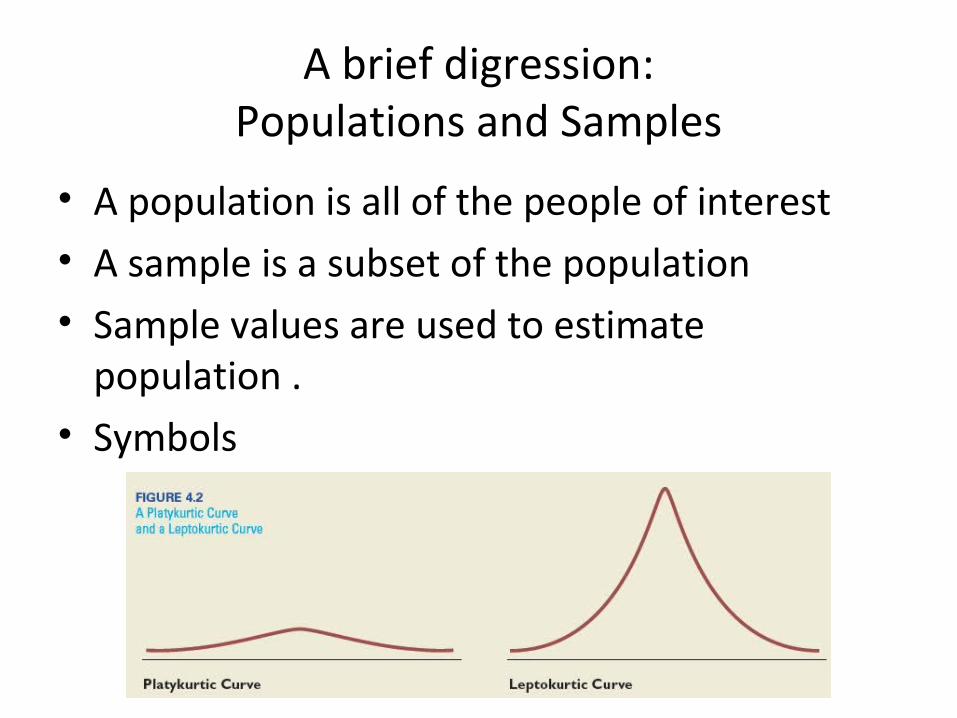
Moments of a Curve: Kurtosis
• Kurtosis refers to the peakiness of a distribution. – Some distributions are weakly unimodal and are relatively
flat. These curves (left) are called platykurtic. – Some curves are strongly unimodal. These curves (right)
are called leptokurtic.
Descriptive StatisticsCentral Tendency
• Mean is the arithmetic average. Median divides the top 50% of people from the
bottom 50% of people (not scores)Mode is the most common or frequent score in a
distribution
On ratio and equal interval scales, any of the 3 can be calculated; on ordinal scales, medians and modes can be calculated; on nominal scales, only modes can be obtained.
Descriptive StatisticsDispersion
• Range is the distance from the highest to the lowest value + one.
• Variance is the average squared distance of scores from the mean; it can be calculated with ratio and equal interval scales.
• Standard Deviation is the square root of the variance.
Correlation
• Correlation. The relationship between two or more variables.
• Correlation Coefficient. Index of the degree of relationship. Ranges from -1.0 to +1.0. The sign tells direction of relationship (high values with high values are +; low values with high values are negative. The numerical value is the magnitude; 0 is no correlation; 1.0 is a perfect correlation.
• Most commonly used correlations is the Pearson ______________ Correlation Coefficient. The symbol for this coefficient is r.
€
Product⋅Moment
Pearson Family Correlation Coefficients
• All members of the Pearson family are computationally equivalent although there are short-cut formulas for different ones.
• Phi is the Pearson coefficient when both variables are dichotomous.
• Point Biserial is the Pearson coefficient when one variable is dichotomous and one is continuous.
• Spearman’s rho is the Pearson coefficient when both variables are ordinal.
Non Pearson Family Coefficients
• The common variants of Pearson family coefficients are used when a continuous variable is forced into a dichotomy due to insensitive measurement. They are calculated by different formulas.
• Examples of continuous variables forced into a dichotomy: good/bad, cute/unattractive, right/wrong.
• Two common nonPearson coefficients– Tetrachoric correlation (2 forced dichotomies)– Biserial correlation (one forced dichotomy and one
continuous variable)
A Digression to Causality
• Correlation is a necessary but insufficient condition for causality.– All causes and effects are correlated– The presence of a correlation does not prove causality.
• There are four causal explanations for any correlation– Variable 1 caused Variable 2– Variable 2 caused Variable 1– Variable 3 caused both Variables 1 and 2– Chance