desert grove retail project - victorville, ca
TRANSCRIPT

Desert Grove Retail Project GREENHOUSE GAS ANALYSIS CITY OF VICTORVILLE
PREPARED BY:
Haseeb Qureshi [email protected] (949) 336-5987
Alyssa Tamase [email protected] (949) 336-5988
MARCH 13, 2019
11723-05 GHG Report


Desert Grove Retail Project Greenhouse Gas Analysis
11723-05 GHG Report
i
TABLE OF CONTENTS
TABLE OF CONTENTS ........................................................................................................................... I APPENDICES ...................................................................................................................................... II LIST OF EXHIBITS ................................................................................................................................ II LIST OF TABLES .................................................................................................................................. II LIST OF ABBREVIATED TERMS ............................................................................................................ III EXECUTIVE SUMMARY ....................................................................................................................... 1 1 INTRODUCTION ......................................................................................................................... 3
1.1 SITE LOCATION .................................................................................................................................. 3 1.2 PROJECT DESCRIPTION ........................................................................................................................ 3 1.3 GHG Emission Reduction Measures and Strategies Overview ..................................................... 3 1.4 Project GHG Impact Mitigation Measures .................................................................................... 6
2 CLIMATE CHANGE SETTING ........................................................................................................ 7
2.1 Introduction to Global Climate Change ........................................................................................ 7 2.2 Greenhouse Gas Emissions Inventories ........................................................................................ 7 2.3 Global Climate Change Defined .................................................................................................... 8 2.4 Greenhouse Gases ........................................................................................................................ 9 2.5 Effects of Climate Change in California ....................................................................................... 12 2.6 Human Health Effects ................................................................................................................. 14 2.7 Regulatory Setting ....................................................................................................................... 16 2.8 City of Victorville Climate Action Plan (CAP) ............................................................................... 36
3 PROJECT GREENHOUSE GAS IMPACT ........................................................................................ 39
3.1 Introduction ................................................................................................................................ 39 3.2 Greenhouse Gas Emissions Modeling and Sources ................................................................... 39 3.3 Life-Cycle Analysis Considerations .............................................................................................. 39 3.4 Project Greenhouse Gas Emissions ............................................................................................. 39 3.5 Operational-source Emissions .................................................................................................... 40 3.6 Emissions Summary .................................................................................................................... 41 3.7 Findings and Conclusions ............................................................................................................ 42
4 REFERENCES ............................................................................................................................ 44 5 CERTIFICATION ........................................................................................................................ 48

Desert Grove Retail Project Greenhouse Gas Analysis
11723-05 GHG Report
ii
APPENDICES
APPENDIX 3.1: CALEEMOD EMISSIONS MODEL OUTPUTS APPENDIX 3.2: SCREENING TABLES
LIST OF EXHIBITS
EXHIBIT 1-A: LOCATION MAP ............................................................................................................. 4 EXHIBIT 1-B: SITE PLAN ...................................................................................................................... 5 EXHIBIT 2-A: SUMMARY OF PROJECTED GLOBAL WARMING IMPACT ................................................ 15
LIST OF TABLES
TABLE ES-1: SUMMARY OF CEQA SIGNIFICANCE FINDINGS ................................................................. 1 TABLE 2-1: TOP GHG PRODUCER COUNTRIES AND THE EUROPEAN UNION ......................................... 8 TABLE 2-2: GLOBAL WARMING POTENTIAL AND ATMOSPHERIC LIFETIME OF SELECT GHGS ............... 12 TABLE 3-1: PROJECT GHG EMISSIONS SUMMARY (ANNUAL) .............................................................. 41

Desert Grove Retail Project Greenhouse Gas Analysis
11723-05 GHG Report
iii
LIST OF ABBREVIATED TERMS
(1) Reference
APS Alternative Planning Organizations
ARB California Air Resources Board
CAA Federal Clean Air Act
CalEEMod California Emissions Estimator Model
CalEPA California Environmental Protection Agency
CAPCOA California Air Pollution Control Officers Association
CARB California Air Resource Board
CAT Climate Action Team
CBSC California Building Standards Commission
CEC California Energy Commission
CCR California Code of Regulations
CEQA California Environmental Quality Act
CFC Chlorofluorocarbons
CFR Code of Federal Regulations
CH4 Methane
CO Carbon Monoxide
CO2 Carbon Dioxide
CO2e Carbon Dioxide Equivalent
CPUC California Public Utilities Commission
EPA Environmental Protection Agency
EPS Emission Performance Standard
GCC Global Climate Change
GHGA Greenhouse Gas Analysis
GWP Global Warming Potential
HFC Hydrofluorocarbons
LCA Life-Cycle Analysis
MMTCO2e Million Metric Ton of Carbon Dioxide Equivalent
MPOs Metropolitan Planning Organizations
MTCO2e Metric Ton of Carbon Dioxide Equivalent
N20 Nitrogen Dioxide
NIOSH National Institute for Occupational Safety and Health
NOx Oxides of Nitrogen
PFC Perfluorocarbons
PM10 Particulate Matter 10 microns in diameter or less
PM2.5 Particulate Matter 2.5 microns in diameter or less
Desert Grove Retail Project Greenhouse Gas Analysis
11723-05 GHG Report
iv
PPM Parts Per Million
Project Desert Grove Retail Project
RTP Regional Transportation Plan
SB Senate Bill
SCAG Southern California Association of Governments
SCAQMD South Coast Air Quality Management District
SCS Sustainable Communities Strategies
UNFCCC United Nations’ Framework Convention on Climate Change
VOC Volatile Organic Compounds

Desert Grove Retail Project Greenhouse Gas Analysis
11723-05 GHG Report
v
This page intentionally left blank

Desert Grove Retail Project Greenhouse Gas Analysis
11723-05 GHG Report
1
EXECUTIVE SUMMARY
The results of this Desert Grove Retail Project Greenhouse Gas Analysis are summarized below based on the significance criteria in Section 3.7 of this report consistent with Appendix G of the California Environmental Quality Act (CEQA) Guidelines (1). Table ES-1 shows the findings of significance for potential greenhouse gas impacts under CEQA.
TABLE ES-1: SUMMARY OF CEQA SIGNIFICANCE FINDINGS
Analysis Report Section
Significance Findings
Unmitigated Mitigated
GHG Impact #1: The Project would not generate direct or indirect greenhouse gas emission that would result in a significant impact on the environment.
3.7 Less Than Significant
n/a
GHG Impact #2: The Project would not conflict with any applicable plan, policy or regulation of an agency adopted for the purpose of reducing the emissions of greenhouse gases.
3.7 Less Than Significant
n/a

Desert Grove Retail Project Greenhouse Gas Analysis
11723-05 GHG Report
2
This page intentionally left blank

Desert Grove Retail Project Greenhouse Gas Analysis
11723-05 GHG Report
3
1 INTRODUCTION
This report presents the results of the greenhouse gas analysis (GHGA) prepared by Urban Crossroads, Inc., for the Desert Grove Retail Project (referred to as “Project”).
The purpose of this GHGA is to evaluate Project-related construction and operational emissions and determine the level of greenhouse gas (GHG) impacts as a result of constructing and operating the proposed Project.
1.1 SITE LOCATION
The proposed Desert Grove Retail Project is located at the southwest corner of the State Route 395 (SR-395) and Palmdale Road (SR-18) in the City of Victorville, as shown on Exhibit 1-A. The Project site is bounded by commercial uses and vacant land to the north (within the City of Adelanto), south, and east (within the City of Victorville); with existing residential homes located west of the Project site in the City of Victorville.
1.2 PROJECT DESCRIPTION
The Project proposes development of approximately 96,300 square feet of commercial/retail uses on an approximately 14.8-acre site, as shown on Exhibit 1-B. For the purposes of this analysis, it has been assumed that the Project will be developed with an anticipated Opening Year of 2019.
1.3 GHG EMISSION REDUCTION MEASURES AND STRATEGIES OVERVIEW
The State of California and the Mojave Desert Air Quality Management District have implemented measures aimed at the reduction of air pollutant emissions. Those that are directly and indirectly applicable to the Project and that would assist in the reduction of greenhouse gas emissions include:
• Global Warming Solutions Act of 2006 (AB32) (2). AB 32 is applicable to the Project because it is subject to 2020 GHG reduction goals set forth in AB 32. AB 32 requires the California Air Resources Board (CARB or ARB) to develop regulations and market mechanisms to reduce California's greenhouse gas emissions to 1990 levels by the year of 2020. Many of the GHG reduction measures outlined in AB 32 (e.g., Low Carbon Fuel Standard, Advanced Clean Car standards, and Cap-and-Trade) have been adopted over the last five years and implementation activities are ongoing.
• Pavley Fuel Efficiency Standards (AB1493). Establishes fuel efficiency ratings for new vehicles (3). More specifically, AB 1493 (Pavley) establishes fuel efficiency rating for model year 2009-2016 passenger cars and light trucks. AB 1493 is applicable to the Project because model year 2009-2016 passenger cars and light duty truck vehicles traveling to and from the Project site have implemented required fuel efficiency standards acting to reduce vehicular-source GHG emissions. The CARB estimates that implementation of the Pavley regulations has reduced GHG emissions from California passenger vehicles by about 30 percent in 2016 compared to emissions that occurred prior to enactment of AB 1493.

Desert Grove Retail Project Greenhouse Gas Analysis
11723-05 GHG Report
4
EXHIBIT 1-A: LOCATION MAP

Desert Grove Retail Project Greenhouse Gas Analysis
11723-05 GHG Report
5
EXHIBIT 1-B: SITE PLAN

Desert Grove Retail Project Greenhouse Gas Analysis
11723-05 GHG Report
6
• Title 24 California Code of Regulations (California Building Code). Establishes energy efficiency requirements for new construction (4). Title 24 energy standards address the energy efficiency of new (and altered) homes and commercial buildings. The Desert Grove Retail Project is required to comply with Title 24 Code of Regulations, acting to promote building energy efficiencies and reduce GHG emissions associated with building energy consumption.
• Title 17 California Code of Regulations (Low Carbon Fuel Standard, LCFS). Title 17 requires carbon content of fuel sold in California to be 10% less by 2020 (5). The LCFS applies to any transportation fuel that is sold, supplied, or offered for sale in California, and to any person who, as a regulated party, is responsible for a transportation fuel in a calendar year. All vehicles accessing the site will be required to comply with LCFS. Implementation of the LCFS reduces greenhouse gas emissions by reducing the full fuel-cycle, carbon intensity of the transportation fuel pool used in California.
• California Water Conservation in Landscaping Act of 2006 (AB1881). AB1881 requires local agencies to adopt the Department of Water Resources updated Water Efficient Landscape Ordinance or equivalent by January 1, 2010. AB1881 ensures water-efficient landscapes in new development and reduced water consumption in existing landscapes (6). The Desert Grove Retail Project is required to comply with the City of Victorville ’s adopted water efficient landscape requirements and would therefore be consistent with the requirements of AB1881. AB1881 and similar measures promote water use efficiencies and reduce GHG emissions associated with water production and delivery.
1.4 PROJECT GHG IMPACT MITIGATION MEASURES
The Project would not result in any potentially significant GHG emissions impacts. Therefore, no mitigation measures are required.

Desert Grove Retail Project Greenhouse Gas Analysis
11723-05 GHG Report
7
2 CLIMATE CHANGE SETTING
2.1 INTRODUCTION TO GLOBAL CLIMATE CHANGE
Global Climate Change (GCC) is defined as the change in average meteorological conditions on the earth with respect to temperature, precipitation, and storms. GCC is currently one of the most controversial environmental issues in the United States, and much debate exists within the scientific community about whether or not GCC is occurring naturally or as a result of human activity. Some data suggests that GCC has occurred in the past over the course of thousands or millions of years. These historical changes to the earth’s climate have occurred naturally without human influence, as in the case of an ice age. However, many scientists believe that the climate shift taking place since the industrial revolution (1900) is occurring at a quicker rate and magnitude than in the past. Scientific evidence suggests that GCC is the result of increased concentrations of greenhouse gases in the earth’s atmosphere, including carbon dioxide, methane, nitrous oxide, and fluorinated gases. Many scientists believe that this increased rate of climate change is the result of greenhouse gases resulting from human activity and industrialization over the past 200 years.
An individual project like the proposed Project evaluated in this GHGA cannot generate enough greenhouse gas emissions to affect a discernible change in global climate. However, the proposed Project may participate in the potential for GCC by its incremental contribution of greenhouse gases combined with the cumulative increase of all other sources of greenhouse gases, which when taken together constitute potential influences on GCC. Because these changes may have serious environmental consequences, Section 3.0 will evaluate the potential for the proposed Project to have a significant effect upon the environment as a result of its potential contribution to the greenhouse effect.
2.2 GREENHOUSE GAS EMISSIONS INVENTORIES
Global
Worldwide anthropogenic (human) GHG emissions are tracked by the Intergovernmental Panel on Climate Change for industrialized nations (referred to as Annex I) and developing nations (referred to as Non-Annex I). Human GHG emissions data for Annex I nations are available through 2016. For the Year 2016, the sum of these emissions totaled approximately 28,747,554 Gg CO2e1 (7) (8). The GHG emissions in more recent years may differ from the inventories presented in Table 2-2; however, the data is representative of currently available inventory data.
1 The global emissions are the sum of Annex I and non-Annex I countries, without counting Land-Use, Land-Use Change and Forestry (LULUCF).
For countries without 2016 data, the UNFCCC data for the most recent year were used. United Nations Framework Convention on Climate Change, “Annex I Parties – GHG total without LULUCF,” The most recent GHG emissions for China were taken in 2012, while the most recent GHG emissions for India were taken in 2010.

Desert Grove Retail Project Greenhouse Gas Analysis
11723-05 GHG Report
8
TABLE 2-1: TOP GHG PRODUCER COUNTRIES AND THE EUROPEAN UNION 2
Emitting Countries GHG Emissions (Gg CO2e)
China 11,895,765
United States 6,511,302
European Union (28 member countries) 4,291,252
India 2,643,817
Russian Federation 2,100,850
Japan 1,304,568
Total 28,747,554
United States
As noted in Table 2-2, the United States, as a single country, was the number two producer of GHG emissions in 2016. The primary greenhouse gas emitted by human activities in the United States was CO2, representing approximately 81.6 percent of total greenhouse gas emissions in the US. Carbon dioxide from fossil fuel combustion, the largest source of US greenhouse gas emissions, accounted for approximately 93.5 percent of the CO2 emissions (9).
State of California
CARB compiles GHG inventories for the State of California. Based upon the 2018 GHG inventory data (i.e., the latest year for which data are available) for the 2000-2016 greenhouse gas emissions inventory, California emitted 429.4 MMTCO2e including emissions resulting from imported electrical power in 2015 (10).
City of Victorville
The City of Victorville is home to one of 14 cement facilities in California and the Southern California Logistics Airport. Both the cement facility and the airport are reflected in the City’s GHG emissions inventories. It is important to note that cement manufacturing is a highly GHG intense industrial process. Emissions related to cement manufacturing activities make up the majority of the City’s GHG emissions profile but is not considered in the City’s GHG emissions reduction target since the City has no control over plant operations, which are regulated by both the state and local air districts (11). The City of Victorville’s Climate Action Plan, identifies that the City’s 2008 emissions total was estimated to be 871,976 MTCO2e (11).
Project Site
The Project site is undeveloped and is not a source of GHG emissions.
2.3 GLOBAL CLIMATE CHANGE DEFINED
GCC refers to the change in average meteorological conditions on the earth with respect to temperature, wind patterns, precipitation and storms. Global temperatures are regulated by naturally occurring atmospheric gases such as water vapor, CO2 (carbon dioxide), N2O (nitrous oxide), CH4 (methane), hydrofluorocarbons, perfluorocarbons and sulfur hexafluoride. These
2 Used http://unfccc.int data for Annex I countries. Consulted the CAIT Climate Data Explorer in http://www.wri.org site to reference Non-
Annex I countries such as China and India.

Desert Grove Retail Project Greenhouse Gas Analysis
11723-05 GHG Report
9
particular gases are important due to their residence time (duration they stay) in the atmosphere, which ranges from 10 years to more than 100 years. These gases allow solar radiation into the earth’s atmosphere, but prevent radioactive heat from escaping, thus warming the earth’s atmosphere. GCC can occur naturally as it has in the past with the previous ice ages.
Gases that trap heat in the atmosphere are often referred to as greenhouse gases. Greenhouse gases are released into the atmosphere by both natural and anthropogenic (human) activity. Without the natural greenhouse gas effect, the earth’s average temperature would be approximately 61° Fahrenheit (F) cooler than it is currently. The cumulative accumulation of these gases in the earth’s atmosphere is considered to be the cause for the observed increase in the earth’s temperature.
Although California’s rate of growth of greenhouse gas emissions is slowing, the state is still a substantial contributor to the U.S. emissions inventory total. In 2004, California is estimated to have produced 492 million gross metric tons of CO2e greenhouse gas emissions. Despite a population increase of 16 percent between 1990 and 2004, California has significantly slowed the rate of growth of greenhouse gas emissions due to the implementation of energy efficiency programs as well as adoption of strict emission controls (12).
2.4 GREENHOUSE GASES
For the purposes of this analysis, emissions of CO2, CH4, and NO2 were evaluated (see Table 3-1 later in this report) because these gasses are the primary contributors to GCC from development projects. Although there are other substances such as fluorinated gases that also contribute to GCC, these fluorinated gases were not evaluated as their sources are not well-defined and do not contain accepted emissions factors or methodology to accurately calculate these gases.
Water Vapor: Water vapor (H20) is the most abundant, important, and variable greenhouse gas in the atmosphere. Water vapor is not considered a pollutant; in the atmosphere it maintains a climate necessary for life. Changes in its concentration are primarily considered to be a result of climate feedbacks related to the warming of the atmosphere rather than a direct result of industrialization. A climate feedback is an indirect, or secondary, change, either positive or negative, that occurs within the climate system in response to a forcing mechanism. The feedback loop in which water is involved is critically important to projecting future climate change.
As the temperature of the atmosphere rises, more water is evaporated from ground storage (rivers, oceans, reservoirs, soil). Because the air is warmer, the relative humidity can be higher (in essence, the air is able to ‘hold’ more water when it is warmer), leading to more water vapor in the atmosphere. As a GHG, the higher concentration of water vapor is then able to absorb more thermal indirect energy radiated from the Earth, thus further warming the atmosphere. The warmer atmosphere can then hold more water vapor and so on and so on. This is referred to as a “positive feedback loop.” The extent to which this positive feedback loop will continue is unknown as there are also dynamics that hold the positive feedback loop in check. As an example, when water vapor increases in the atmosphere, more of it will eventually condense into

Desert Grove Retail Project Greenhouse Gas Analysis
11723-05 GHG Report
10
clouds, which are more able to reflect incoming solar radiation (thus allowing less energy to reach the earth’s surface and heat it up) (13).
There are no human health effects from water vapor itself; however, when some pollutants come in contact with water vapor, they can dissolve, and the water vapor can then act as a pollutant-carrying agent. The main source of water vapor is evaporation from the oceans (approximately 85 percent). Other sources include evaporation from other water bodies, sublimation (change from solid to gas) from sea ice and snow, and transpiration from plant leaves.
Carbon Dioxide: Carbon dioxide (CO2) is an odorless and colorless GHG. Outdoor levels of carbon dioxide are not high enough to result in negative health effects. Carbon dioxide is emitted from natural and manmade sources. Natural sources include: the decomposition of dead organic matter; respiration of bacteria, plants, animals and fungus; evaporation from oceans; and volcanic outgassing. Anthropogenic sources include: the burning of coal, oil, natural gas, and wood. Carbon dioxide is naturally removed from the air by photosynthesis, dissolution into ocean water, transfer to soils and ice caps, and chemical weathering of carbonate rocks (14).
Since the industrial revolution began in the mid-1700s, the sort of human activity that increases GHG emissions has increased dramatically in scale and distribution. Data from the past 50 years suggests a corollary increase in levels and concentrations. As an example, prior to the industrial revolution, CO2 concentrations were fairly stable at 280 parts per million (ppm). Today, they are around 370 ppm, an increase of more than 30 percent. Left unchecked, the concentration of carbon dioxide in the atmosphere is projected to increase to a minimum of 540 ppm by 2100 as a direct result of anthropogenic sources (15).
Methane: Methane (CH4) is an extremely effective absorber of radiation, although its atmospheric concentration is less than carbon dioxide and its lifetime in the atmosphere is brief (10-12 years), compared to other GHGs. Exposure to high levels of methane can cause asphyxiation, loss of consciousness, headache and dizziness, nausea and vomiting, weakness, loss of coordination, and an increased breathing rate.
Methane has both natural and anthropogenic sources. It is released as part of the biological processes in low oxygen environments, such as in swamplands or in rice production (at the roots of the plants). Over the last 50 years, human activities such as growing rice, raising cattle, using natural gas, and mining coal have added to the atmospheric concentration of methane. Other anthropocentric sources include fossil-fuel combustion and biomass burning (16).
Nitrous Oxide: Nitrous oxide (N2O), also known as laughing gas, is a colorless greenhouse gas. Nitrous oxide can cause dizziness, euphoria, and sometimes slight hallucinations. In small doses, it is considered harmless. However, in some cases, heavy and extended use can cause Olney’s Lesions (brain damage) (17).
Concentrations of nitrous oxide also began to rise at the beginning of the industrial revolution. In 1998, the global concentration was 314 parts per billion (ppb). Nitrous oxide is produced by microbial processes in soil and water, including those reactions which occur in fertilizer containing nitrogen. In addition to agricultural sources, some industrial processes (fossil fuel-fired power plants, nylon production, nitric acid production, and vehicle emissions) also

Desert Grove Retail Project Greenhouse Gas Analysis
11723-05 GHG Report
11
contribute to its atmospheric load. It is used as an aerosol spray propellant, i.e., in whipped cream bottles. It is also used in potato chip bags to keep chips fresh. It is used in rocket engines and in race cars. Nitrous oxide can be transported into the stratosphere, be deposited on the earth’s surface, and be converted to other compounds by chemical reaction (17).
Chlorofluorocarbons: Chlorofluorocarbons (CFCs) are gases formed synthetically by replacing all hydrogen atoms in methane or ethane (C2H6) with chlorine and/or fluorine atoms. CFCs are nontoxic, nonflammable, insoluble and chemically unreactive in the troposphere (the level of air at the earth’s surface). CFCs are no longer being used; therefore, it is not likely that health effects would be experienced. Nonetheless, in confined indoor locations, working with CFC-113 or other CFCs is thought to result in death by cardiac arrhythmia (heart frequency too high or too low) or asphyxiation.
CFCs have no natural source but were first synthesized in 1928. They were used for refrigerants, aerosol propellants and cleaning solvents. Due to the discovery that they are able to destroy stratospheric ozone, a global effort to halt their production was undertaken and was extremely successful, so much so that levels of the major CFCs are now remaining steady or declining. However, their long atmospheric lifetimes mean that some of the CFCs will remain in the atmosphere for over 100 years (18).
Hydrofluorocarbons: Hydrofluorocarbons (HFCs) are synthetic, man-made chemicals that are used as a substitute for CFCs. Out of all the greenhouse gases, they are one of three groups with the highest global warming potential. The HFCs with the largest measured atmospheric abundances are (in order), HFC-23 (CHF3), HFC-134a (CF3CH2F), and HFC-152a (CH3CHF2). Prior to 1990, the only significant emissions were of HFC-23. HFC-134a emissions are increasing due to its use as a refrigerant. The U.S. EPA estimates that concentrations of HFC-23 and HFC-134a are now about 10 parts per trillion (ppt) each; and that concentrations of HFC-152a are about 1 ppt (19). No health effects are known to result from exposure to HFCs, which are manmade for applications such as automobile air conditioners and refrigerants.
Perfluorocarbons: Perfluorocarbons (PFCs) have stable molecular structures and do not break down through chemical processes in the lower atmosphere. High-energy ultraviolet rays, which occur about 60 kilometers above earth’s surface, are able to destroy the compounds. Because of this, PFCs have very long lifetimes, between 10,000 and 50,000 years. Two common PFCs are tetrafluoromethane (CF4) and hexafluoroethane (C2F6). The U.S. EPA estimates that concentrations of CF4 in the atmosphere are over 70 ppt.
No health effects are known to result from exposure to PFCs. The two main sources of PFCs are primary aluminum production and semiconductor manufacture.
Sulfur Hexafluoride: Sulfur hexafluoride (SF6) is an inorganic, odorless, colorless, nontoxic, nonflammable gas. It also has the highest global warming potential (GWP) of any gas evaluated (23,900) (20). The U.S. EPA indicates that concentrations in the 1990s were about 4 ppt. In high concentrations in confined areas, the gas presents the hazard of suffocation because it displaces the oxygen needed for breathing.

Desert Grove Retail Project Greenhouse Gas Analysis
11723-05 GHG Report
12
Sulfur hexafluoride is used for insulation in electric power transmission and distribution equipment, in the magnesium industry, in semiconductor manufacturing, and as a tracer gas for leak detection.
Nitrogen Trifluoride: Nitrogen trifluoride (NF3) is a colorless gas with a distinctly moldy odor. NF3 is used in industrial processes and is produced in the manufacture of semiconductors and LCD (Liquid Crystal Display) panels, and types of solar panels and chemical lasers. The World Resources Institute (WRI) indicates that NF3 has a 100-year GWP of 17,200 (21).
Long-term or repeated exposure may affect the liver and kidneys and may cause fluorosis (22).
Greenhouse gases have varying GWP values; GWP values represent the potential of a gas to trap heat in the atmosphere. Carbon dioxide is utilized as the reference gas for GWP, and thus has a GWP of 1.
The atmospheric lifetime and GWP of selected greenhouse gases are summarized at Table 2-2. As shown in the table below, GWP for the Second Assessment Report (SAR), the Intergovernmental Panel on Climate Change (IPCC)’s scientific and socio-economic assessment on climate change, range from 1 for carbon dioxide to 23,900 for sulfur hexafluoride and GWP for the IPCC’s 4th Assessment Report (AR4) range from 1 for carbon dioxide to 22,800 for sulfur hexafluoride.
TABLE 2-2: GLOBAL WARMING POTENTIAL AND ATMOSPHERIC LIFETIME OF SELECT GHGS
Gas Atmospheric Lifetime (years)
Global Warming Potential (100 year time horizon)
Second Assessment Report (SAR)
4th Assessment Report (AR4)
Carbon Dioxide 50-200 1 1
Methane 12 ± 3 21 25
Nitrous Oxide 114 310 298
HFC-23 270 11,700 14,800
HFC-134a 14 1,300 1,430
HFC-152a 1.4 140 124
Sulfur Hexafluoride (SF6) 3,200 23,900 22,800
Source: Table 2.14 of the IPCC Fourth Assessment Report, 2007
2.5 EFFECTS OF CLIMATE CHANGE IN CALIFORNIA
Public Health
Higher temperatures may increase the frequency, duration, and intensity of conditions conducive to air pollution formation. For example, days with weather conducive to ozone formation could increase from 25 to 35 percent under the lower warming range to 75 to 85 percent under the

Desert Grove Retail Project Greenhouse Gas Analysis
11723-05 GHG Report
13
medium warming range. In addition, if global background ozone levels increase as predicted in some scenarios, it may become impossible to meet local air quality standards. Air quality could be further compromised by increases in wildfires, which emit fine particulate matter that can travel long distances, depending on wind conditions. The Climate Scenarios report indicates that large wildfires could become up to 55 percent more frequent if GHG emissions are not significantly reduced.
In addition, under the higher warming range scenario, there could be up to 100 more days per
year with temperatures above 90F in Los Angeles and 95F in Sacramento by 2100. This is a large increase over historical patterns and approximately twice the increase projected if temperatures remain within or below the lower warming range. Rising temperatures could increase the risk of death from dehydration, heat stroke/exhaustion, heart attack, stroke, and respiratory distress caused by extreme heat.
Water Resources
A vast network of man-made reservoirs and aqueducts captures and transports water throughout the state from northern California rivers and the Colorado River. The current distribution system relies on Sierra Nevada snowpack to supply water during the dry spring and summer months. Rising temperatures, potentially compounded by decreases in precipitation, could severely reduce spring snowpack, increasing the risk of summer water shortages.
If temperatures continue to increase, more precipitation could fall as rain instead of snow, and the snow that does fall could melt earlier, reducing the Sierra Nevada spring snowpack by as much as 70 to 90 percent. Under the lower warming range scenario, snowpack losses could be only half as large as those possible if temperatures were to rise to the higher warming range. How much snowpack could be lost depends in part on future precipitation patterns, the projections for which remain uncertain. However, even under the wetter climate projections, the loss of snowpack could pose challenges to water managers and hamper hydropower generation. It could also adversely affect winter tourism. Under the lower warming range, the ski season at lower elevations could be reduced by as much as a month. If temperatures reach the higher warming range and precipitation declines, there might be many years with insufficient snow for skiing and snowboarding.
The State’s water supplies are also at risk from rising sea levels. An influx of saltwater could degrade California’s estuaries, wetlands, and groundwater aquifers. Saltwater intrusion caused by rising sea levels is a major threat to the quality and reliability of water within the southern edge of the Sacramento/San Joaquin River Delta – a major fresh water supply.
Agriculture
Increased temperatures could cause widespread changes to the agriculture industry reducing the quantity and quality of agricultural products statewide. First, California farmers could possibly lose as much as 25 percent of the water supply needed. Although higher CO2 levels can stimulate plant production and increase plant water-use efficiency, California’s farmers could face greater water demand for crops and a less reliable water supply as temperatures rise. Crop growth and development could change, as could the intensity and frequency of pest and disease outbreaks.

Desert Grove Retail Project Greenhouse Gas Analysis
11723-05 GHG Report
14
Rising temperatures could aggravate O3 pollution, which makes plants more susceptible to disease and pests and interferes with plant growth.
Plant growth tends to be slow at low temperatures, increasing with rising temperatures up to a threshold. However, faster growth can result in less-than-optimal development for many crops, so rising temperatures could worsen the quantity and quality of yield for a number of California’s agricultural products. Products likely to be most affected include wine grapes, fruits and nuts.
In addition, continued global climate change could shift the ranges of existing invasive plants and weeds and alter competition patterns with native plants. Range expansion could occur in many species while range contractions may be less likely in rapidly evolving species with significant populations already established. Should range contractions occur, new or different weed species could fill the emerging gaps. Continued global climate change could alter the abundance and types of many pests, lengthen pests’ breeding season, and increase pathogen growth rates.
Forests and Landscapes
Global climate change has the potential to intensify the current threat to forests and landscapes by increasing the risk of wildfire and altering the distribution and character of natural vegetation. If temperatures rise into the medium warming range, the risk of large wildfires in California could increase by as much as 55 percent, which is almost twice the increase expected if temperatures stay in the lower warming range. However, since wildfire risk is determined by a combination of factors, including precipitation, winds, temperature, and landscape and vegetation conditions, future risks will not be uniform throughout the state. In contrast, wildfires in northern California could increase by up to 90 percent due to decreased precipitation.
Moreover, continued global climate change has the potential to alter natural ecosystems and biological diversity within the state. For example, alpine and subalpine ecosystems could decline by as much as 60 to 80 percent by the end of the century as a result of increasing temperatures. The productivity of the state’s forests has the potential to decrease as a result of global climate change.
Rising Sea Levels
Rising sea levels, more intense coastal storms, and warmer water temperatures could increasingly threaten the state’s coastal regions. Under the higher warming range scenario, sea level is anticipated to rise 22 to 35 inches by 2100. Elevations of this magnitude would inundate low-lying coastal areas with salt water, accelerate coastal erosion, threaten vital levees and inland water systems, and disrupt wetlands and natural habitats. Under the lower warming range scenario, sea level could rise 12-14 inches.
2.6 HUMAN HEALTH EFFECTS
The potential health effects related directly to the emissions of carbon dioxide, methane, and nitrous oxide as they relate to development projects such as the proposed Project are still being debated in the scientific community. Their cumulative effects to global climate change have the potential to cause adverse effects to human health. Increases in Earth’s ambient temperatures

Desert Grove Retail Project Greenhouse Gas Analysis
11723-05 GHG Report
15
would result in more intense heat waves, causing more heat-related deaths. Scientists also purport that higher ambient temperatures would increase disease survival rates and result in more widespread disease. Climate change will likely cause shifts in weather patterns, potentially resulting in devastating droughts and food shortages in some areas (23). Exhibit 2-A presents the potential impacts of global warming (24).
EXHIBIT 2-A: SUMMARY OF PROJECTED GLOBAL WARMING IMPACT
Source: Our Changing Climate: A Summary Report from the California Climate Change Center, July 2006
Specific health effects associated with directly emitted GHG emissions are as follows:
Water Vapor: There are no known direct health effects related to water vapor at this time. It should be noted however that when some pollutants react with water vapor, the reaction forms a transport mechanism for some of these pollutants to enter the human body through water vapor.

Desert Grove Retail Project Greenhouse Gas Analysis
11723-05 GHG Report
16
Carbon Dioxide: According to the National Institute for Occupational Safety and Health (NIOSH) high concentrations of carbon dioxide can result in health effects such as: headaches, dizziness, restlessness, difficulty breathing, sweating, increased heart rate, increased cardiac output, increased blood pressure, coma, asphyxia, and/or convulsions. It should be noted that current concentrations of carbon dioxide in the earth’s atmosphere are estimated to be approximately 370 parts per million (ppm), the actual reference exposure level (level at which adverse health effects typically occur) is at exposure levels of 5,000 ppm averaged over 10 hours in a 40-hour workweek and short-term reference exposure levels of 30,000 ppm averaged over a 15 minute period (25).
Methane: Methane is extremely reactive with oxidizers, halogens, and other halogen-containing compounds. Methane is also an asphyxiant and may displace oxygen in an enclosed space.
Nitrous Oxide: Nitrous Oxide is often referred to as laughing gas; it is a colorless greenhouse gas. The health effects associated with exposure to elevated concentrations of nitrous oxide include dizziness, euphoria, slight hallucinations, and in extreme cases of elevated concentrations nitrous oxide can also cause brain damage (26).
Fluorinated Gases: High concentrations of fluorinated gases can also result in adverse health effects such as asphyxiation, dizziness, headache, cardiovascular disease, cardiac disorders, and in extreme cases, increased mortality.
Aerosols: The health effects of aerosols are similar to that of other fine particulate matter. Thus, aerosols can cause elevated respiratory and cardiovascular diseases as well as increased mortality (27).
Nitrogen Trifluoride: Long-term or repeated exposure may affect the liver and kidneys and may cause fluorosis (28).
2.7 REGULATORY SETTING
INTERNATIONAL
Climate change is a global issue. Following is a summary of past and current international measures and policies addressing GHG emissions and global climate change.
Intergovernmental Panel on Climate Change. In 1988, the United Nations and the World Meteorological Organization established the Intergovernmental Panel on Climate Change to assess the scientific, technical and socioeconomic information relevant to understanding the scientific basis of risk of human-induced climate change, its potential impacts, and options for adaptation and mitigation.
United Nations Framework Convention on Climate Change (Convention). On March 21, 1994, the U.S. joined a number of countries around the world in signing the Convention. Under the Convention, governments gather and share information on GHG emissions, national policies, and best practices; launch national strategies for addressing GHG emissions and adapting to expected impacts, including the provision of financial and technological support to developing countries; and cooperate in preparing for adaptation to the impacts of climate change.
Desert Grove Retail Project Greenhouse Gas Analysis
11723-05 GHG Report
17
International Climate Change Treaties. The Kyoto Protocol is an international agreement linked to the Convention. The major feature of the Kyoto Protocol is that it sets binding targets for 37 industrialized countries and the European community for reducing GHG emissions at an average of five percent against 1990 levels over the five-year period 2008–2012. The Convention (as discussed above) encouraged industrialized countries to stabilize emissions; however, the Protocol commits them to do so. Developed countries have contributed more emissions over the last 150 years; therefore, the Protocol places a heavier burden on developed nations under the principle of “common but differentiated responsibilities.”
In 2001, President George W. Bush indicated that he would not submit the treaty to the U.S. Senate for ratification, which effectively ended American involvement in the Kyoto Protocol. In December 2009, international leaders met in Copenhagen to address the future of international climate change commitments post-Kyoto. No binding agreement was reached in Copenhagen; however, the Committee identified the long-term goal of limiting the maximum global average temperature increase to no more than 2°C above pre-industrial levels, subject to a review in 2015. The UN Climate Change Committee held additional meetings in Durban, South Africa in November 2011; Doha, Qatar in November 2012; and Warsaw, Poland in November 2013. The meetings are gradually gaining consensus among participants on individual climate change issues.
On September 23, 2014 more than 100 Heads of State and Government and leaders from the private sector and civil society met at the Climate Summit in New York hosted by the United Nations. At the Summit, heads of government, business and civil society announced actions in areas that would have the greatest impact on reducing emissions, including climate finance, energy, transport, industry, agriculture, cities, forests, and building resilience.
Parties to the U.N. Framework Convention on Climate Change (UNFCCC) reached a landmark agreement on December 12, 2015 in Paris, charting a fundamentally new course in the two-decade-old global climate effort. Culminating a four-year negotiating round, the new treaty ends the strict differentiation between developed and developing countries that characterized earlier efforts, replacing it with a common framework that commits all countries to put forward their best efforts and to strengthen them in the years ahead. This includes, for the first time, requirements that all parties report regularly on their emissions and implementation efforts and undergo international review.
The agreement and a companion decision by parties were the key outcomes of the conference, known as the 21st session of the UNFCCC Conference of the Parties, or COP 21. Together, the Paris Agreement and the accompanying COP decision:
• Reaffirm the goal of limiting global temperature increase well below 2 degrees Celsius, while urging efforts to limit the increase to 1.5 degrees;
• Establish binding commitments by all parties to make “nationally determined contributions” (NDCs), and to pursue domestic measures aimed at achieving them;
• Commit all countries to report regularly on their emissions and “progress made in implementing and achieving” their NDCs, and to undergo international review;

Desert Grove Retail Project Greenhouse Gas Analysis
11723-05 GHG Report
18
• Commit all countries to submit new NDCs every five years, with the clear expectation that they will “represent a progression” beyond previous ones;
• Reaffirm the binding obligations of developed countries under the UNFCCC to support the efforts of developing countries, while for the first time encouraging voluntary contributions by developing countries too;
• Extend the current goal of mobilizing $100 billion a year in support by 2020 through 2025, with a new, higher goal to be set for the period after 2025;
• Extend a mechanism to address “loss and damage” resulting from climate change, which explicitly will not “involve or provide a basis for any liability or compensation;”
• Require parties engaging in international emissions trading to avoid “double counting;” and
• Call for a new mechanism, similar to the Clean Development Mechanism under the Kyoto Protocol, enabling emission reductions in one country to be counted toward another country’s NDC (C2ES 2015a) (29).
On June 2, 2017 President Donald Trump announced his intention to withdraw from the Paris Agreement. It should be noted that under the terms of the agreement, the United Sates cannot formally announce its resignation until November 4, 2019. Subsequently, withdrawal would be effective one year after notification in 2020.
NATIONAL
Prior to the last decade, there have been no concrete federal regulations of GHGs or major planning for climate change adaptation. Following is a summary of past and current national measures and policies addressing GHG emissions and global climate change.
GHG Endangerment. In Massachusetts v. Environmental Protection Agency 549 U.S. 497 (2007), decided on April 2, 2007, the Supreme Court found that four GHGs, including carbon dioxide, are air pollutants subject to regulation under Section 202(a)(1) of the Clean Air Act. The Court held that the EPA Administrator must determine whether emissions of GHGs from new motor vehicles cause or contribute to air pollution, which may reasonably be anticipated to endanger public health or welfare, or whether the science is too uncertain to make a reasoned decision. On December 7, 2009, the EPA Administrator signed two distinct findings regarding GHGs under section 202(a) of the Clean Air Act:
• Endangerment Finding: The Administrator finds that the current and projected concentrations of
the six key well-mixed GHGs—carbon dioxide, methane, nitrous oxide, hydrofluorocarbons,
perfluorocarbons, and sulfur hexafluoride—in the atmosphere threaten the public health and
welfare of current and future generations.
• Cause or Contribute Finding: The Administrator finds that the combined emissions of these well-
mixed GHGs from new motor vehicles and new motor vehicle engines contribute to the GHG
pollution, which threatens public health and welfare.
These findings do not impose requirements on industry or other entities. However, this was a prerequisite for implementing GHG emissions standards for vehicles, as discussed in the section
Desert Grove Retail Project Greenhouse Gas Analysis
11723-05 GHG Report
19
“Clean Vehicles” below. After a lengthy legal challenge, the U.S. Supreme Court declined to review an Appeals Court ruling that upheld the EPA Administrator’s findings (30).
Clean Vehicles. Congress first passed the Corporate Average Fuel Economy law in 1975 to increase the fuel economy of cars and light duty trucks. The law has become more stringent over time. On May 19, 2009, President Obama put in motion a new national policy to increase fuel economy for all new cars and trucks sold in the U.S. On April 1, 2010, the EPA and the Department of Transportation’s National Highway Safety Administration announced a joint final rule establishing a national program that would reduce GHG emissions and improve fuel economy for new cars and trucks sold in the U.S.
The first phase of the national program applies to passenger cars, light-duty trucks, and medium-duty passenger vehicles, covering model years 2012 through 2016. They require these vehicles to meet an estimated combined average emissions level of 250 grams of carbon dioxide per mile, equivalent to 35.5 miles per gallon if the automobile industry were to meet this carbon dioxide level solely through fuel economy improvements. Together, these standards would cut carbon dioxide emissions by an estimated 960 million metric tons and 1.8 billion barrels of oil over the lifetime of the vehicles sold under the program (model years 2012–2016). The EPA and the National Highway Safety Administration issued final rules on a second-phase joint rulemaking establishing national standards for light-duty vehicles for model years 2017 through 2025 in August 2012 (EPA 2012c). The new standards for model years 2017 through 2025 apply to passenger cars, light-duty trucks, and medium duty passenger vehicles. The final standards are projected to result in an average industry fleetwide level of 163 grams/mile of carbon dioxide (CO2) in model year 2025, which is equivalent to 54.5 miles per gallon (mpg) if achieved exclusively through fuel economy improvements.
The EPA and the U.S. Department of Transportation issued final rules for the first national standards to reduce GHG emissions and improve fuel efficiency of heavy-duty trucks and buses on September 15, 2011, effective November 14, 2011. For combination tractors, the agencies are proposing engine and vehicle standards that begin in the 2014 model year and achieve up to a 20 percent reduction in carbon dioxide emissions and fuel consumption by the 2018 model year. For heavy-duty pickup trucks and vans, the agencies are proposing separate gasoline and diesel truck standards, which phase in starting in the 2014 model year and achieve up to a 10-percent reduction for gasoline vehicles and a 15 percent reduction for diesel vehicles by the 2018 model year (12 and 17 percent respectively if accounting for air conditioning leakage). Lastly, for vocational vehicles, the engine and vehicle standards would achieve up to a 10 percent reduction in fuel consumption and carbon dioxide emissions from the 2014 to 2018 model years.
As of September 2018, the EPA has proposed amendments to the 2012 light-duty vehicle GHG regulations. This amendment would revise two technical errors related to compliance credit calculations. The first revision addresses how auto manufacturers calculate credits for optional advanced technology incentives while the second corrects the equation for calculating certain types of off-cycle credits. The proposed amendments would clarify the calculation methodology in the regulations and would take effect once the final rule becomes effective.

Desert Grove Retail Project Greenhouse Gas Analysis
11723-05 GHG Report
20
Mandatory Reporting of GHGs. The Consolidated Appropriations Act of 2008, passed in December 2007, requires the establishment of mandatory GHG reporting requirements. On September 22, 2009, the EPA issued the Final Mandatory Reporting of GHGs Rule, which became effective January 1, 2010. The rule requires reporting of GHG emissions from large sources and suppliers in the U.S. and is intended to collect accurate and timely emissions data to inform future policy decisions. Under the rule, suppliers of fossil fuels or industrial GHGs, manufacturers of vehicles and engines, and facilities that emit 25,000 metric tons or more per year of GHG emissions are required to submit annual reports to the EPA.
New Source Review. The EPA issued a final rule on May 13, 2010, that establishes thresholds for GHGs that define when permits under the New Source Review Prevention of Significant Deterioration and Title V Operating Permit programs are required for new and existing industrial facilities. This final rule “tailors” the requirements of these Clean Air Act permitting programs to limit which facilities will be required to obtain Prevention of Significant Deterioration and Title V permits. In the preamble to the revisions to the Federal Code of Regulations, the EPA states:
This rulemaking is necessary because without it the Prevention of Significant Deterioration and Title V requirements would apply, as of January 2, 2011, at the 100 or 250 tons per year levels provided under the Clean Air Act, greatly increasing the number of required permits, imposing undue costs on small sources, overwhelming the resources of permitting authorities, and severely impairing the functioning of the programs. EPA is relieving these resource burdens by phasing in the applicability of these programs to GHG sources, starting with the largest GHG emitters. This rule establishes two initial steps of the phase-in. The rule also commits the agency to take certain actions on future steps addressing smaller sources but excludes certain smaller sources from Prevention of Significant Deterioration and Title V permitting for GHG emissions until at least April 30, 2016.
The EPA estimates that facilities responsible for nearly 70 percent of the national GHG emissions from stationary sources will be subject to permitting requirements under this rule. This includes the nation’s largest GHG emitters—power plants, refineries, and cement production facilities.
Standards of Performance for GHG Emissions for New Stationary Sources: Electric Utility Generating Units. As required by a settlement agreement, the EPA proposed new performance standards for emissions of carbon dioxide for new, affected, fossil fuel-fired electric utility generating units on March 27, 2012. New sources greater than 25 megawatts would be required to meet an output-based standard of 1,000 pounds of carbon dioxide per megawatt-hour, based on the performance of widely used natural gas combined cycle technology. It should be noted that on February 9, 2016, the U.S. Supreme Court issued a stay of this regulation pending litigation. Additionally, the current EPA Administrator has also signed a measure to repeal the Clean Power Plan, including the CO2 standards.
Cap and Trade. Cap and trade refers to a policy tool where emissions are limited to a certain amount and can be traded, or provides flexibility on how the emitter can comply. Successful examples in the U.S. include the Acid Rain Program and the NOx Budget Trading Program and Clean Air Interstate Rule in the northeast. There is no federal GHG cap and trade program

Desert Grove Retail Project Greenhouse Gas Analysis
11723-05 GHG Report
21
currently; however, some states have joined to create initiatives to provide a mechanism for cap and trade.
The Regional GHG Initiative is an effort to reduce GHGs among the states of Connecticut, Delaware, Maine, Maryland, Massachusetts, New Hampshire, New York, Rhode Island, and Vermont. Each state caps carbon dioxide emissions from power plants, auctions carbon dioxide emission allowances, and invests the proceeds in strategic energy programs that further reduce emissions, save consumers money, create jobs, and build a clean energy economy. The Initiative began in 2008.
The Western Climate Initiative partner jurisdictions have developed a comprehensive initiative to reduce regional GHG emissions to 15 percent below 2005 levels by 2020. The partners were originally California, British Columbia, Manitoba, Ontario, and Quebec. However, Manitoba and Ontario are not currently participating. California linked with Quebec’s cap and trade system January 1, 2014, and joint offset auctions took place in 2015 (C2ES 2015). California’s Cap and Trade Program is discussed below.
SmartWay Program. The SmartWay Program is a public-private initiative between the EPA, large and small trucking companies, rail carriers, logistics companies, commercial manufacturers, retailers, and other federal and state agencies. Its purpose is to improve fuel efficiency and the environmental performance (reduction of both GHG emissions and air pollution) of the goods movement supply chains. SmartWay is comprised of four components (EPA 2014):
1. SmartWay Transport Partnership: A partnership in which freight carriers and shippers commit to benchmark operations, track fuel consumption, and improve performance annually.
2. SmartWay Technology Program: A testing, verification, and designation program to help freight companies identify equipment, technologies, and strategies that save fuel and lower emissions.
3. SmartWay Vehicles: A program that ranks light‐duty cars and small trucks and identifies superior environmental performers with the SmartWay logo.
4. SmartWay International Interests: Guidance and resources for countries seeking to develop freight sustainability programs modeled after SmartWay.
SmartWay effectively refers to requirements geared towards reducing fuel consumption. Most large trucking fleets driving newer vehicles are compliant with SmartWay design requirements. Moreover, over time, all heavy-duty trucks will have to comply with the ARB GHG Regulation that is designed with the SmartWay Program in mind, to reduce GHG emissions by making them more fuel-efficient. For instance, in 2015, 53 foot or longer dry vans or refrigerated trailers equipped with a combination of SmartWay-verified low-rolling resistance tires and SmartWay-verified aerodynamic devices would obtain a total of 10 percent or more fuel savings over traditional trailers.
Through the SmartWay Technology Program, the EPA has evaluated the fuel saving benefits of various devices through grants, cooperative agreements, emissions and fuel economy testing, demonstration projects and technical literature review. As a result, the EPA has determined the following types of technologies provide fuel saving and/or emission reducing benefits when used properly in their designed applications, and has verified certain products:

Desert Grove Retail Project Greenhouse Gas Analysis
11723-05 GHG Report
22
• Idle reduction technologies – less idling of the engine when it is not needed would reduce fuel consumption.
• Aerodynamic technologies minimize drag and improve airflow over the entire tractor‐trailer vehicle. Aerodynamic technologies include gap fairings that reduce turbulence between the tractor and trailer, side skirts that minimize wind under the trailer, and rear fairings that reduce turbulence and pressure drop at the rear of the trailer.
• Low rolling resistance tires can roll longer without slowing down, thereby reducing the amount of fuel used. Rolling resistance (or rolling friction or rolling drag) is the force resisting the motion when a tire rolls on a surface. The wheel will eventually slow down because of this resistance.
• Retrofit technologies include things such as diesel particulate filters, emissions upgrades (to a higher tier), etc., which would reduce emissions.
• Federal excise tax exemptions.
CALIFORNIA
Legislative Actions to Reduce GHGs
The State of California legislature has enacted a series of bills that constitute the most aggressive program to reduce GHGs of any state in the nation. Some legislation such as the landmark Assembly Bill (AB 32) California Global Warming Solutions Act of 2006 was specifically enacted to address GHG emissions. Other legislation such as Title 24 and Title 20 energy standards were originally adopted for other purposes such as energy and water conservation, but also provide GHG reductions. This section describes the major provisions of past and current California measures and policies addressing global climate change and GHG emissions. legislation.
AB 32. The California State Legislature enacted AB 32, which requires that GHGs emitted in California be reduced to 1990 levels by the year 2020. “GHGs” as defined under AB 32 include carbon dioxide, methane, N2O, hydrofluorocarbons, perfluorocarbons, and sulfur hexafluoride. Since AB 32 was enacted, a seventh chemical, nitrogen trifluoride, has also been added to the list of GHGs. The California Air Resources Board (ARB) is the state agency charged with monitoring and regulating sources of GHGs. AB 32 states the following:
Global warming poses a serious threat to the economic well-being, public health, natural resources, and the environment of California. The potential adverse impacts of global warming include the exacerbation of air quality problems, a reduction in the quality and supply of water to the state from the Sierra snowpack, a rise in sea levels resulting in the displacement of thousands of coastal businesses and residences, damage to marine ecosystems and the natural environment, and an increase in the incidences of infectious diseases, asthma, and other human health-related problems.
ARB approved the 1990 GHG emissions level of 427 MMTCO2e on December 6, 2007 (ARB 2007). Therefore, emissions generated in California in 2020 are required to be equal to or less than 427 MMTCO2e. Emissions in 2020 in a “business as usual” (BAU) scenario were estimated to be 596 MMTCO2e, which do not account for reductions from AB 32 regulations (ARB 2008). At that level, a 28.4 percent reduction was required to achieve the 427 million MTCO2e 1990 inventory. In

Desert Grove Retail Project Greenhouse Gas Analysis
11723-05 GHG Report
23
October 2010, ARB prepared an updated 2020 forecast to account for the recession and slower forecasted growth. The forecasted inventory without the benefits of adopted regulation is now estimated at 545 million MTCO2e. Therefore, under the updated forecast, a 21.7 percent reduction from BAU is required to achieve 1990 levels (ARB 2010).
PROGRESS IN ACHIEVING AB 32 TARGETS AND REMAINING REDUCTIONS REQUIRED
The State has made steady progress in implementing AB 32 and achieving targets included in Executive Order S-3-05. The progress is shown in updated emission inventories prepared by ARB for 2000 through 2012 (ARB 2014a). The State has achieved the Executive Order S-3-05 target for 2010 of reducing GHG emissions to 2000 levels. As shown below, the 2010 emission inventory achieved this target.
• 1990: 427 million MTCO2e (AB 32 2020 target)
• 2000: 463 million MTCO2e (an average 8 percent reduction needed to achieve 1990 base)
• 2010: 450 million MTCO2e (an average 5 percent reduction needed to achieve 1990 base)
ARB has also made substantial progress in achieving its goal of achieving 1990 emissions levels by 2020. As described earlier in this section, ARB revised the 2020 BAU inventory forecast to account for new lower growth projections, which resulted in a new lower reduction from BAU to achieve the 1990 base. The previous reduction from 2020 BAU needed to achieve 1990 levels was 28.4 percent and the latest reduction from 2020 BAU is 21.7 percent.
• 2020: 545 million MTCO2e BAU (an average 21.7 percent reduction from BAU needed to achieve 1990
base)
ARB Scoping Plan. ARB’s Climate Change Scoping Plan (Scoping Plan) contains measures designed to reduce the State’s emissions to 1990 levels by the year 2020 to comply with AB 32 (ARB 2008). The Scoping Plan identifies recommended measures for multiple GHG emission sectors and the associated emission reductions needed to achieve the year 2020 emissions target—each sector has a different emission reduction target. Most of the measures target the transportation and electricity sectors. As stated in the Scoping Plan, the key elements of the strategy for achieving the 2020 GHG target include:
• Expanding and strengthening existing energy efficiency programs as well as building and appliance standards;
• Achieving a statewide renewables energy mix of 33 percent;
• Developing a California cap-and-trade program that links with other Western Climate Initiative partner programs to create a regional market system;
• Establishing targets for transportation-related GHG emissions for regions throughout California and pursuing policies and incentives to achieve those targets;
• Adopting and implementing measures pursuant to existing State laws and policies, including California’s clean car standards, goods movement measures, and the Low Carbon Fuel Standard; and

Desert Grove Retail Project Greenhouse Gas Analysis
11723-05 GHG Report
24
• Creating targeted fees, including a public goods charge on water use, fees on high global warming potential gases, and a fee to fund the administrative costs of the State’s long-term commitment to AB 32 implementation.
The ARB approved the First Update to the Scoping Plan (Update) on May 22, 2014. The Update identifies the next steps for California’s climate change strategy. The Update shows how California continues on its path to meet the near-term 2020 GHG limit, but also sets a path toward long-term, deep GHG emission reductions. The report establishes a broad framework for continued emission reductions beyond 2020, on the path to 80 percent below 1990 levels by 2050. The Update identifies progress made to meet the near-term objectives of AB 32 and defines California’s climate change priorities and activities for the next several years. The Update does not set new targets for the State but describes a path that would achieve the long term 2050 goal of Executive Order S-05-03 for emissions to decline to 80 percent below 1990 levels by 2050 (ARB 2014).
Forecasting the amount of emissions that would occur in 2020 if no actions are taken was necessary to assess the amount of reductions California must achieve to return to the 1990 emissions level by 2020 as required by AB 32. The no-action scenario is known as “business-as-usual” or BAU. The ARB originally defined the BAU scenario as emissions in the absence of any GHG emission reduction measures discussed in the Scoping Plan.
As part of CEQA compliance for the Scoping Plan, ARB prepared a Supplemental Functional Equivalent Document (FED) in 2011. The FED included an updated 2020 BAU emissions inventory projection based on current economic forecasts (i.e., as influenced by the economic downturn) and emission reduction measures already in place, replacing its prior 2020 BAU emissions inventory. ARB staff derived the updated emissions estimates by projecting emissions growth, by sector, from the state’s average emissions from 2006–2008. The new BAU estimate includes emission reductions for the million-solar-roofs program, the AB 1493 (Pavley I) motor vehicle GHG emission standards, and the Low Carbon Fuels Standard. In addition, ARB factored into the 2020 BAU inventory emissions reductions associated with 33 percent Renewable Energy Portfolio Standard (RPS) for electricity generation. The updated BAU estimate of 507 MMTCO2e by 2020 requires a reduction of 80 MMTCO2e, or a 16 percent reduction below the estimated BAU levels to return to 1990 levels (i.e., 427 MMTCO2e) by 2020.
In order to provide a BAU reduction that is consistent with the original definition in the Scoping Plan and with threshold definitions used in thresholds adopted by lead agencies for CEQA purposes and many climate action plans, the updated inventory without regulations was also included in the Supplemental FED. The ARB 2020 BAU projection for GHG emissions in California was originally estimated to be 596 MMTCO2e. The updated ARB 2020 BAU projection in the Supplemental FED is 545 MMTCO2e. Considering the updated BAU estimate of 545 MMTCO2e by 2020, ARB estimates a 21.7 percent reduction below the estimated statewide BAU levels is necessary to return to 1990 emission levels (i.e., 427 MMTCO2e) by 2020, instead of the approximate 28.4 percent BAU reduction previously reported under the original Climate Change Scoping Plan (2008).

Desert Grove Retail Project Greenhouse Gas Analysis
11723-05 GHG Report
25
2017 Climate Change Scoping Plan Update
In November 2017, ARB released the final 2017 Scoping Plan Update, which identifies the State’s post-2020 reduction strategy. The 2017 Scoping Plan Update reflects the 2030 target of a 40 percent reduction below 1990 levels, set by Executive Order B-30-15 and codified by Senate Bill 32 (SB 32). Key programs that the proposed Second Update builds upon include the Cap-and-Trade Regulation, the Low Carbon Fuel Standard, and much cleaner cars, trucks and freight movement, utilizing cleaner, renewable energy, and strategies to reduce methane emissions from agricultural and other wastes.
The 2017 Scoping Plan establishes a new emissions limit of 260 MMTCO2e for the year 2030, which corresponds to a 40 percent decrease in 1990 levels by 2030.
California’s climate strategy will require contributions from all sectors of the economy, including the land base, and will include enhanced focus on zero- and near-zero-emission (ZE/NZE) vehicle technologies; continued investment in renewables, including solar roofs, wind, and other distributed generation; greater use of low carbon fuels; integrated land conservation and development strategies; coordinated efforts to reduce emissions of short-lived climate pollutants (methane, black carbon, and fluorinated gases); and an increased focus on integrated land use planning to support livable, transit-connected communities and conservation of agricultural and other lands. Requirements for direct GHG reductions at refineries will further support air quality co-benefits in neighborhoods, including in disadvantaged communities historically located adjacent to these large stationary sources, as well as efforts with California’s local air pollution control and air quality management districts (air districts) to tighten emission limits on a broad spectrum of industrial sources. Major elements of the 2017 Scoping Plan framework include:
• Implementing and/or increasing the standards of the Mobile Source Strategy, which include increasing ZEV buses and trucks.
• Low Carbon Fuel Standard (LCFS), with an increased stringency (18 percent by 2030).
• Implementing SB 350, which expands the Renewables Portfolio Standard (RPS) to 50 percent RPS and doubles energy efficiency savings by 2030.
• California Sustainable Freight Action Plan, which improves freight system efficiency, utilizes near-zero emissions technology, and deployment of ZEV trucks.
• Implementing the proposed Short-Lived Climate Pollutant Strategy (SLPS), which focuses on reducing methane and hydroflurocarbon emissions by 40 percent and anthropogenic black carbon emissions by 50 percent by year 2030.
• Continued implementation of SB 375.
• Post-2020 Cap-and-Trade Program that includes declining caps.
• 20 percent reduction in GHG emissions from refineries by 2030.
• Development of a Natural and Working Lands Action Plan to secure California’s land base as a net carbon sink.
In addition to the statewide strategies listed above, the 2017 Scoping Plan also identifies local governments as essential partners in achieving the State’s long-term GHG reduction goals and identifies local actions to reduce GHG emissions. As part of the recommended actions, CARB

Desert Grove Retail Project Greenhouse Gas Analysis
11723-05 GHG Report
26
recommends that local governments achieve a community-wide goal to achieve emissions of no more than 6 MTCO2e or less per capita by 2030 and 2 MTCO2e or less per capita by 2050. For CEQA projects, CARB states that lead agencies may develop evidenced-based bright-line numeric thresholds—consistent with the Scoping Plan and the State’s long-term GHG goals—and projects with emissions over that amount may be required to incorporate on-site design features and mitigation measures that avoid or minimize project emissions to the degree feasible; or, a performance-based metric using a climate action plan or other plan to reduce GHG emissions is appropriate.
According to research conducted by the Lawrence Berkeley National Laboratory and supported by ARB, California, under its existing and proposed GHG reduction policies, is on track to meet the 2020 reduction targets under AB 32 and could achieve the 2030 goals under SB 32. The research utilized a new, validated model known as the California LBNL GHG Analysis of Policies Spreadsheet (CALGAPS), which simulates GHG and criteria pollutant emissions in California from 2010 to 2050 in accordance to existing and future GHG-reducing policies. The CALGAPS model showed that GHG emissions through 2020 could range from 317 to 415 MTCO2e per year, “indicating that existing state policies will likely allow California to meet its target [of 2020 levels under AB 32].” CALGAPS also showed that by 2030, emissions could range from 211 to 428 MTCO2e per year, indicating that “even if all modeled policies are not implemented, reductions could be sufficient to reduce emissions 40 percent below the 1990 level [of SB 32].” CALGAPS analyzed emissions through 2050 even though it did not generally account for policies that might be put in place after 2030. Although the research indicated that the emissions would not meet the State’s 80 percent reduction goal by 2050, various combinations of policies could allow California’s cumulative emissions to remain very low through 2050 (31) (32).
Senate Bill 32. On September 8, 2016, Governor Jerry Brown signed the Senate Bill (SB) 32 and its companion bill, Assembly Bill (AB) 197. SB 32 requires the state to reduce statewide GHG emissions to 40 percent below 1990 levels by 2030, a reduction target that was first introduced in Executive Order B-30-15. The new legislation builds upon the AB 32 goal of 1990 levels by 2020 and provides an intermediate goal to achieving S-3-05, which sets a statewide GHG reduction target of 80 percent below 1990 levels by 2050. AB 197 creates a legislative committee to oversee regulators to ensure that ARB not only responds to the Governor, but also the Legislature (33) (34).
Cap and Trade Program. The Scoping Plan identifies a Cap-and-Trade Program as one of the key strategies for California to reduce GHG emissions. According to ARB, a cap-and-trade program will help put California on the path to meet its goal of reducing GHG emissions to 1990 levels by the year 2020 and ultimately achieving an 80 percent reduction from 1990 levels by 2050. Under cap-and-trade, an overall limit on GHG emissions from capped sectors is established, and facilities subject to the cap will be able to trade permits to emit GHGs within the overall limit.
ARB adopted a California Cap-and-Trade Program pursuant to its authority under AB 32. See Title 17 of the California Code of Regulations (CCR) §§ 95800 to 96023). The Cap-and-Trade Program is designed to reduce GHG emissions from major sources (deemed “covered entities”) by setting a firm cap on statewide GHG emissions and employing market mechanisms to achieve AB 32's emission-reduction mandate of returning to 1990 levels of emissions by 2020. The statewide cap

Desert Grove Retail Project Greenhouse Gas Analysis
11723-05 GHG Report
27
for GHG emissions from the capped sectors (e.g., electricity generation, petroleum refining, and cement production) commenced in 2013 and will decline over time, achieving GHG emission reductions throughout the program's duration.
Covered entities that emit more than 25.000 MTCO2e per year must comply with the Cap-and-Trade Program. Triggering of the 25.000 MTCO2e per year “inclusion threshold” is measured against a subset of emissions reported and verified under the California Regulation for the Mandatory Reporting of GHG Emissions (Mandatory Reporting Rule or “MRR”).
Under the Cap-and-Trade Program, ARB issues allowances equal to the total amount of allowable emissions over a given compliance period and distributes these to regulated entities. Covered entities are allocated free allowances in whole or part (if eligible), and may buy allowances at auction, purchase allowances from others, or purchase offset credits. Each covered entity with a compliance obligation is required to surrender “compliance instruments” (30) for each MTCO2e of GHG they emit. There also are requirements to surrender compliance instruments covering 30 percent of the prior year’s compliance obligation by November of each year. For example, in November 2014, a covered entity was required to submit compliance instruments to cover 30 percent of its 2013 GHG emissions.
The Cap-and-Trade Program provides a firm cap, ensuring that the 2020 statewide emission limit will not be exceeded. An inherent feature of the Cap-and-Trade program is that it does not guarantee GHG emissions reductions in any discrete location or by any particular source. Rather, GHG emissions reductions are only guaranteed on an accumulative basis. As summarized by ARB in the First Update:
The Cap-and-Trade Regulation gives companies the flexibility to trade allowances with others or take steps to cost-effectively reduce emissions at their own facilities. Companies that emit more have to turn in more allowances or other compliance instruments. Companies that can cut their GHG emissions have to turn in fewer allowances. But as the cap declines, aggregate emissions must be reduced. In other words, a covered entity theoretically could increase its GHG emissions every year and still comply with the Cap-and-Trade Program if there is a reduction in GHG emissions from other covered entities. Such a focus on aggregate GHG emissions is considered appropriate because climate change is a global phenomenon, and the effects of GHG emissions are considered cumulative (ARB 2014).
The Cap-and-Trade Program works with other direct regulatory measures and provides an economic incentive to reduce emissions. If California’s direct regulatory measures reduce GHG emissions more than expected, then the Cap-and-Trade Program will be responsible for relatively fewer emissions reductions. If California’s direct regulatory measures reduce GHG emissions less than expected, then the Cap-and-Trade Program will be responsible for relatively more emissions reductions. Thus, the Cap-and-Trade Program assures that California will meet its 2020 GHG emissions reduction mandate:

Desert Grove Retail Project Greenhouse Gas Analysis
11723-05 GHG Report
28
The Cap-and-Trade Program establishes an overall limit on GHG emissions from most of the California economy—the “capped sectors.” Within the capped sectors, some of the reductions are being accomplished through direct regulations, such as improved building and appliance efficiency standards, the [Low Carbon Fuel Standard] LCFS, and the 33 percent [Renewables Portfolio Standard] RPS. Whatever additional reductions are needed to bring emissions within the cap is accomplished through price incentives posed by emissions allowance prices. Together, direct regulation and price incentives assure that emissions are brought down cost-effectively to the level of the overall cap. The Cap-and-Trade Regulation provides assurance that California’s 2020 limit will be met because the regulation sets a firm limit on 85 percent of California’s GHG emissions. In sum, the Cap-and-Trade Program will achieve aggregate, rather than site specific or project-level, GHG emissions reductions. Also, due to the regulatory architecture adopted by ARB in AB 32, the reductions attributed to the Cap-and-Trade Program can change over time depending on the State’s emissions forecasts and the effectiveness of direct regulatory measures (ARB 2014).
As of January 1, 2015, the Cap-and-Trade Program covered approximately 85 percent of California’s GHG emissions. The Cap-and-Trade Program covers the GHG emissions associated with electricity consumed in California, whether generated in-state or imported. Accordingly, GHG emissions associated with CEQA projects’ electricity usage are covered by the Cap-and-Trade Program.
The Cap-and-Trade Program also covers fuel suppliers (natural gas and propane fuel providers and transportation fuel providers) to address emissions from such fuels and from combustion of other fossil fuels not directly covered at large sources in the Program’s first compliance period. While the Cap-and-Trade Program technically covered fuel suppliers as early as 2012, they did not have a compliance obligation (i.e., they were not fully regulated) until 2015. The Cap-and-Trade Program covers the GHG emissions associated with the combustion of transportation fuels in California, whether refined in-state or imported. The point of regulation for transportation fuels is when they are “supplied” (i.e., delivered into commerce). Accordingly, as with stationary source GHG emissions and GHG emissions attributable to electricity use, virtually all, if not all, of GHG emissions from CEQA projects associated with vehicle-miles traveled (VMT) are covered by the Cap-and-Trade Program (ARB 2015) (35).
In addition, the Scoping Plan differentiates between “capped” and “uncapped” strategies. “Capped” strategies are subject to the proposed cap-and-trade program. The Scoping Plan states that the inclusion of these emissions within the Program will help ensure that the year 2020 emission targets are met despite some degree of uncertainty in the emission reduction estimates for any individual measure. Implementation of the capped strategies is calculated to achieve a sufficient amount of reductions by 2020 to achieve the emission target contained in AB 32. “Uncapped” strategies that will not be subject to the cap-and-trade emissions caps and

Desert Grove Retail Project Greenhouse Gas Analysis
11723-05 GHG Report
29
requirements are provided as a margin of safety by accounting for additional GHG emission reductions.3
SB 375 - the Sustainable Communities and Climate Protection Act of 2008. Passing the Senate on August 30, 2008, Senate Bill (SB) 375 was signed by the Governor on September 30, 2008. According to SB 375, the transportation sector is the largest contributor of GHG emissions, which emits over 40 percent of the total GHG emissions in California. SB 375 states, “Without improved land use and transportation policy, California will not be able to achieve the goals of AB 32.” SB 375 does the following: it (1) requires metropolitan planning organizations to include sustainable community strategies in their regional transportation plans for reducing GHG emissions, (2) aligns planning for transportation and housing, and (3) creates specified incentives for the implementation of the strategies.
Concerning CEQA, SB 375, as codified in Public Resources Code Section 21159.28, states that CEQA findings for certain projects are not required to reference, describe, or discuss (1) growth inducing impacts, or (2) any project-specific or cumulative impacts from cars and light-duty truck trips generated by the project on global warming or the regional transportation network, if the project:
1. Is in an area with an approved sustainable communities’ strategy or an alternative planning strategy that the ARB accepts as achieving the GHG emission reduction targets.
2. Is consistent with that strategy (in designation, density, building intensity, and applicable policies).
3. Incorporates the mitigation measures required by an applicable prior environmental document.
AB 1493 Pavley Regulations and Fuel Efficiency Standards. California AB 1493, enacted on July 22, 2002, required ARB to develop and adopt regulations that reduce GHGs emitted by passenger vehicles and light duty trucks. Implementation of the regulation was delayed by lawsuits filed by automakers and by the EPA’s denial of an implementation waiver. The EPA subsequently granted the requested waiver in 2009, which was upheld by the U.S. District Court for the District of Columbia in 2011.
The standards phase in during the 2009 through 2016 model years. When fully phased in, the near-term (2009–2012) standards will result in about a 22 percent reduction compared with the 2002 fleet, and the mid-term (2013–2016) standards will result in about a 30 percent reduction. Several technologies stand out as providing significant reductions in emissions at favorable costs. These include discrete variable valve lift or camless valve actuation to optimize valve operation rather than relying on fixed valve timing and lift as has historically been done; turbocharging to boost power and allow for engine downsizing; improved multi-speed transmissions; and
3
On March 17, 2011, the San Francisco Superior Court issued a final decision in Association of Irritated Residents v. California Air Resources
Board (Case No. CPF-09-509562). While the Court upheld the validity of the ARB Scoping Plan for the implementation of AB 32, the Court enjoined ARB from further rulemaking under AB 32 until ARB amends its CEQA environmental review of the Scoping Plan to address the flaws identified by the Court. On May 23, 2011, ARB filed an appeal. On June 24, 2011, the Court of Appeal granted ARB’s petition staying the trail court’s order pending consideration of the appeal. In the interest of informed decision-making, on June 13, 2011, ARB released the expanded alternatives analysis in a draft Supplement to the AB 32 Scoping Plan Functional Equivalent Document. The ARB Board approved the Scoping Plan and the CEQA document on August 24, 2011.

Desert Grove Retail Project Greenhouse Gas Analysis
11723-05 GHG Report
30
improved air conditioning systems that operate optimally, leak less, and/or use an alternative refrigerant.
The second phase of the implementation for the Pavley bill was incorporated into Amendments to the Low-Emission Vehicle Program referred to as LEV III or the Advanced Clean Cars program. The Advanced Clean Car program combines the control of smog-causing pollutants and GHG emissions into a single coordinated package of requirements for model years 2017 through 2025. The regulation will reduce GHGs from new cars by 34 percent from 2016 levels by 2025. The new rules will clean up gasoline and diesel-powered cars, and deliver increasing numbers of zero-emission technologies, such as full battery electric cars, newly emerging plug-in hybrid electric vehicles and hydrogen fuel cell cars. The package will also ensure adequate fueling infrastructure is available for the increasing numbers of hydrogen fuel cell vehicles planned for deployment in California.
SB 350— Clean Energy and Pollution Reduction Act of 2015. In October 2015, the legislature approved and the Governor signed SB 350, which reaffirms California’s commitment to reducing its GHG emissions and addressing climate change. Key provisions include an increase in the renewables portfolio standard (RPS), higher energy efficiency requirements for buildings, initial strategies towards a regional electricity grid, and improved infrastructure for electric vehicle charging stations. Provisions for a 50 percent reduction in the use of petroleum statewide were removed from the Bill because of opposition and concern that it would prevent the Bill’s passage. Specifically, SB 350 requires the following to reduce statewide GHG emissions:
• Increase the amount of electricity procured from renewable energy sources from 33 percent to 50 percent by 2030, with interim targets of 40 percent by 2024, and 25 percent by 2027.
• Double the energy efficiency in existing buildings by 2030. This target will be achieved through the California Public Utility Commission (CPUC), the California Energy Commission (CEC), and local publicly-owned utilities.
• Reorganize the Independent System Operator (ISO) to develop more regional electrify transmission markets and to improve accessibility in these markets, which will facilitate the growth of renewable energy markets in the western United States (California Leginfo 2015).
EXECUTIVE ORDERS RELATED TO GHG EMISSIONS
California’s Executive Branch has taken several actions to reduce GHGs through the use of Executive Orders. Although not regulatory, they set the tone for the state and guide the actions of state agencies.
Executive Order S-3-05. Former California Governor Arnold Schwarzenegger announced on June 1, 2005, through Executive Order S-3-05, the following reduction targets for GHG emissions:
• By 2010, reduce GHG emissions to 2000 levels.
• By 2020, reduce GHG emissions to 1990 levels.
• By 2050, reduce GHG emissions to 80 percent below 1990 levels.
The 2050 reduction goal represents what some scientists believe is necessary to reach levels that will stabilize the climate. The 2020 goal was established to be a mid-term target. Because this is

Desert Grove Retail Project Greenhouse Gas Analysis
11723-05 GHG Report
31
an executive order, the goals are not legally enforceable for local governments or the private sector.
Executive Order S-01-07 – Low Carbon Fuel Standard. The Governor signed Executive Order S-01-07 on January 18, 2007. The order mandates that a statewide goal shall be established to reduce the carbon intensity of California’s transportation fuels by at least 10 percent by 2020. In particular, the Executive Order established a Low Carbon Fuel Standard and directed the Secretary for Environmental Protection to coordinate the actions of the California Energy Commission, the ARB, the University of California, and other agencies to develop and propose protocols for measuring the “life-cycle carbon intensity” of transportation fuels. This analysis supporting development of the protocols was included in the State Implementation Plan for alternative fuels (State Alternative Fuels Plan adopted by California Energy Commission on December 24, 2007) and was submitted to ARB for consideration as an “early action” item under AB 32. The ARB adopted the Low Carbon Fuel Standard on April 23, 2009.
The Low Carbon Fuel Standard was challenged in the U.S. District Court in Fresno in 2011. The court’s ruling issued on December 29, 2011, included a preliminary injunction against ARB’s implementation of the rule. The Ninth Circuit Court of Appeals stayed the injunction on April 23, 2012, pending final ruling on appeal, allowing ARB to continue to implement and enforce the regulation. The Ninth Circuit Court’s decision, filed September 18, 2013, vacated the preliminary injunction. In essence, the court held that Low Carbon Fuel Standards adopted by ARB were not in conflict with federal law. On August 8, 2013, the Fifth District Court of Appeal (California) ruled ARB failed to comply with CEQA and the Administrative Procedure Act (APA) when adopting regulations for Low Carbon Fuel Standards. In a partially published opinion, the Court of Appeal reversed the trial court’s judgment and directed issuance of a writ of mandate setting aside Resolution 09-31 and two executive orders of ARB approving Low Carbon Fuel Standards (LCFS) regulations promulgated to reduce GHG emissions. However, the court tailored its remedy to protect the public interest by allowing the LCFS regulations to remain operative while ARB complies with the procedural requirements it failed to satisfy.
To address the Court ruling, ARB was required to bring a new LCFS regulation to the Board for consideration in February 2015. The proposed LCFS regulation was required to contain revisions to the 2010 LCFS as well as new provisions designed to foster investments in the production of the low-carbon intensity (low-CI) fuels, offer additional flexibility to regulated parties, update critical technical information, simplify and streamline program operations, and enhance enforcement. On November 16, 2015 the Office of Administrative Law (OAL) approved the Final Rulemaking Package. The new LCFS regulation became effective on January 1, 2016.
Executive Order S-13-08. Executive Order S-13-08 states that “climate change in California during the next century is expected to shift precipitation patterns, accelerate sea level rise and increase temperatures, thereby posing a serious threat to California’s economy, to the health and welfare of its population and to its natural resources.” Pursuant to the requirements in the Order, the 2009 California Climate Adaptation Strategy (California Natural Resources Agency 2009) was adopted, which is the “. . . first statewide, multi-sector, region-specific, and information-based climate change adaptation strategy in the United States.” Objectives include
Desert Grove Retail Project Greenhouse Gas Analysis
11723-05 GHG Report
32
analyzing risks of climate change in California, identifying and exploring strategies to adapt to climate change, and specifying a direction for future research.
Executive Order B-30-15. On April 29, 2015, Governor Edmund G. Brown Jr. issued an executive order to establish a California GHG reduction target of 40 percent below 1990 levels by 2030. The Governor’s executive order aligns California’s GHG reduction targets with those of leading international governments ahead of the United Nations Climate Change Conference in Paris late 2015. The Order sets a new interim statewide GHG emission reduction target to reduce GHG emissions to 40 percent below 1990 levels by 2030 in order to ensure California meets its target of reducing GHG emissions to 80 percent below 1990 levels by 2050 and directs ARB to update the Climate Change Scoping Plan to express the 2030 target in terms of million metric tons of CO2 equivalent (MMCO2e). The Order also requires the state’s climate adaptation plan to be updated every three years, and for the State to continue its climate change research program, among other provisions. As with Executive Order S-3-05, this Order is not legally enforceable for local governments and the private sector. Legislation that would update AB 32 to make post 2020 targets and requirements a mandate is in process in the State Legislature.
CALIFORNIA REGULATIONS AND BUILDING CODES
California has a long history of adopting regulations to improve energy efficiency in new and remodeled buildings. These regulations have kept California’s energy consumption relatively constant even with rapid population growth.
Title 20 Appliance Efficiency Standards. California Code of Regulations, Title 20: Division 2, Chapter 4, Article 4, Sections 1601-1608: Appliance Efficiency Regulations regulates the sale of appliances in California. The Appliance Efficiency Regulations include standards for both federally regulated appliances and non-federally regulated appliances. 23 categories of appliances are included in the scope of these regulations. The standards within these regulations apply to appliances that are sold or offered for sale in California, except those sold wholesale in California for final retail sale outside the state and those designed and sold exclusively for use in recreational vehicles or other mobile equipment (CEC 2012).
Title 24 Energy Efficiency Standards and California Green Building Standards. California Code of Regulations Title 24 Part 6: California’s Energy Efficiency Standards for Residential and Nonresidential Buildings, was first adopted in 1978 in response to a legislative mandate to reduce California’s energy consumption. The standards are updated periodically to allow consideration and possible incorporation of new energy efficient technologies and methods. Energy efficient buildings require less electricity; therefore, increased energy efficiency reduces fossil fuel consumption and decreases GHG emissions. The 2019 version of Title 24 was adopted by the California Energy Commission (CEC) and will become effective on January 1, 2020.
The CEC indicates that the 2019 Title 24 standards will reduce energy consumption by 7 percent for single-family residential buildings due to the energy efficiency measures built by the 2016 standards. Additionally, nonresidential buildings will use 30 percent less energy due to lighting upgrades (36).
Desert Grove Retail Project Greenhouse Gas Analysis
11723-05 GHG Report
33
California Code of Regulations, Title 24, Part 11: California Green Building Standards Code (CALGreen) is a comprehensive and uniform regulatory code for all residential, commercial, and school buildings that went in effect on January 1, 2011, and is administered by the California Building Standards Commission. CALGreen is updated on a regular basis, with the most recent update consisting of the 2016 California Green Building Code Standards that will be effective January 1, 2017. Local jurisdictions are permitted to adopt more stringent requirements, as state law provides methods for local enhancements. CALGreen recognizes that many jurisdictions have developed existing construction and demolition ordinances and defers to them as the ruling guidance provided they establish a minimum 65 percent diversion requirement. The code also provides exemptions for areas not served by construction and demolition recycling infrastructure. The State Building Code provides the minimum standard that buildings must meet in order to be certified for occupancy, which is generally enforced by the local building official. CALGreen requires:
• Short-term bicycle parking. If a commercial project is anticipated to generate visitor traffic, provide permanently anchored bicycle racks within 200 feet of the visitors’ entrance, readily visible to passers-by, for 5 percent of visitor motorized vehicle parking capacity, with a minimum of one two-bike capacity rack (5.106.4.1.1).
• Long-term bicycle parking. For new buildings with 10 or more tenant-occupants, provide secure bicycle parking for 5 percent of tenant-occupied motorized vehicle parking capacity, with a minimum of one space (5.106.4.1.2).
• Designated parking. Provide designated parking in commercial projects for any combination of low-emitting, fuel-efficient and carpool/van pool vehicles as shown in Table 5.106.5.2 (5.106.5.2).
• Recycling by Occupants. Provide readily accessible areas that serve the entire building and are identified for the depositing, storage and collection of nonhazardous materials for recycling (5.410.1).
• Construction waste. A minimum 65 percent diversion of construction and demolition waste from landfills, increasing voluntarily to 80 percent for new homes and commercial projects (5.408.1, A5.408.3.1 [nonresidential], A5.408.3.1 [residential]). All (100 percent) of trees, stumps, rocks and associated vegetation and soils resulting from land clearing shall be reused or recycled (5.408.3).
• Wastewater reduction. Each building shall reduce the generation of wastewater by one of the following methods:
o The installation of water-conserving fixtures (5.303.3) or
o Using nonpotable water systems (5.303.4).
• Water use savings. 20 percent mandatory reduction of indoor water use with voluntary goal standards for 30, 35 and 40 percent reductions (5.303.2, A5303.2.3 [nonresidential]).
• Water meters. Separate water meters for buildings in excess of 50,000 square feet or buildings projected to consume more than 1,000 gallons per day (5.303.1).
• Irrigation efficiency. Moisture-sensing irrigation systems for larger landscaped areas (5.304.3).
• Materials pollution control. Low-pollutant emitting interior finish materials such as paints, carpet, vinyl flooring, and particleboard (5.404).

Desert Grove Retail Project Greenhouse Gas Analysis
11723-05 GHG Report
34
• Building commissioning. Mandatory inspections of energy systems (i.e., heat furnace, air conditioner, mechanical equipment) for nonresidential buildings over 10,000 square feet to ensure that all are working at their maximum capacity according to their design efficiencies (5.410.2).
Model Water Efficient Landscape Ordinance. The Model Water Efficient Landscape Ordinance (Ordinance) was required by AB 1881, the Water Conservation Act. The bill required local agencies to adopt a local landscape ordinance at least as effective in conserving water as the Model Ordinance by January 1, 2010. Reductions in water use of 20 percent consistent with (SBX-7-7) 2020 mandate are expected upon compliance with the ordinance. Governor Brown’s Drought Executive Order of April 1, 2015 (EO B-29-15) directed Department of Water Resources (DWR) to update the Ordinance through expedited regulation. The California Water Commission approved the revised Ordinance on July 15, 2015 effective December 15, 2015. New development projects that include landscape areas of 500 square feet or more are subject to the Ordinance. The update requires:
• More efficient irrigation systems;
• Incentives for graywater usage;
• Improvements in on-site stormwater capture;
• Limiting the portion of landscapes that can be planted with high water use plants; and
• Reporting requirements for local agencies.
ARB Refrigerant Management Program. ARB adopted a regulation in 2009 to reduce refrigerant GHG emissions from stationary sources through refrigerant leak detection and monitoring, leak repair, system retirement and retrofitting, reporting and recordkeeping, and proper refrigerant cylinder use, sale, and disposal. The regulation is set forth in sections 95380 to 95398 of Title 17, California Code of Regulations. The rules implementing the regulation establish a limit on statewide GHG emissions from stationary facilities with refrigeration systems with more than 50 pounds of a high GWP refrigerant. The refrigerant management program is designed to (1) reduce emissions of high-GWP GHG refrigerants from leaky stationary, non-residential refrigeration equipment; (2) reduce emissions from the installation and servicing of refrigeration and air-conditioning appliances using high-GWP refrigerants; and (3) verify GHG emission reductions.
Tractor‐Trailer GHG Regulation. The tractors and trailers subject to this regulation must either use EPA SmartWay certified tractors and trailers, or retrofit their existing fleet with SmartWay verified technologies. The regulation applies primarily to owners of 53-foot or longer box-type trailers, including both dry-van and refrigerated-van trailers, and owners of the heavy-duty tractors that pull them on California highways. These owners are responsible for replacing or retrofitting their affected vehicles with compliant aerodynamic technologies and low rolling resistance tires. Sleeper cab tractors model year 2011 and later must be SmartWay certified. All other tractors must use SmartWay verified low rolling resistance tires. There are also requirements for trailers to have low rolling resistance tires and aerodynamic devices.
Phase I and 2 Heavy-Duty Vehicle GHG Standards. ARB has adopted a new regulation for greenhouse gas (GHG) emissions from heavy-duty trucks and engines sold in California. It

Desert Grove Retail Project Greenhouse Gas Analysis
11723-05 GHG Report
35
establishes GHG emission limits on truck and engine manufacturers and harmonizes with the U.S. EPA rule for new trucks and engines nationally. Existing heavy-duty vehicle regulations in California include engine criteria emission standards, tractor-trailer GHG requirements to implement SmartWay strategies (i.e., the Heavy-Duty Tractor-Trailer Greenhouse Gas Regulation), and in-use fleet retrofit requirements such as the Truck and Bus Regulation. In September 2011, the U.S. EPA adopted their new rule for heavy-duty trucks and engines. The U.S. EPA rule has compliance requirements for new compression and spark ignition engines, as well as trucks from Class 2b through Class 8. Compliance requirements begin with model year (MY) 2014 with stringency levels increasing through MY 2018. The rule organizes truck compliance into three groupings, which include a) heavy-duty pickups and vans; b) vocational vehicles; and c) combination tractors. The U.S. EPA rule does not regulate trailers.
ARB staff has worked jointly with the U.S. Environmental Protection Agency (U.S. EPA) and the National Highway Traffic Safety Administration (NHTSA) on the next phase of federal greenhouse gas (GHG) emission standards for medium- and heavy-duty vehicles, called federal Phase 2. The federal Phase 2 standards were built on the improvements in engine and vehicle efficiency required by the Phase 1 emission standards and represent a significant opportunity to achieve further GHG reductions for 2018 and later model year heavy-duty vehicles, including trailers.
U.S. EPA and NHTSA issued a Notice of Proposed Rulemaking for Phase 2 in June 2015 and published the final rule in October 2016. On February 8, 2018 the Board approved, with direction to staff to make additional 15-day changes, the proposed Phase 2 standards. Final approval and OAL action is expected to be completed by the end of 2018.
SB 97 and the CEQA Guidelines Update. Passed in August 2007, SB 97 added Section 21083.05 to the Public Resources Code. The code states “(a) On or before July 1, 2009, the Office of Planning and Research shall prepare, develop, and transmit to the Resources Agency guidelines for the mitigation of GHG emissions or the effects of GHG emissions as required by this division, including, but not limited to, effects associated with transportation or energy consumption. (b) On or before January 1, 2010, the Resources Agency shall certify and adopt guidelines prepared and developed by the Office of Planning and Research pursuant to subdivision (a).” Section 21097 was also added to the Public Resources Code. It provided CEQA protection until January 1, 2010 for transportation projects funded by the Highway Safety, Traffic Reduction, Air Quality, and Port Security Bond Act of 2006 or projects funded by the Disaster Preparedness and Flood Prevention Bond Act of 2006, in stating that the failure to analyze adequately the effects of GHGs would not violate CEQA.
On April 13, 2009, the Office of Planning and Research submitted to the Secretary for Natural Resources its recommended amendments to the CEQA Guidelines for addressing GHG emissions. On July 3, 2009, the Natural Resources Agency commenced the Administrative Procedure Act rulemaking process for certifying and adopting these amendments pursuant to Public Resources Code section 21083.05. Following a 55-day public comment period and two public hearings, the Natural Resources Agency proposed revisions to the text of the proposed Guidelines amendments. The Natural Resources Agency transmitted the adopted amendments and the entire rulemaking file to the Office of Administrative Law on December 31, 2009. On February 16, 2010, the Office of Administrative Law approved the Amendments, and filed them with the

Desert Grove Retail Project Greenhouse Gas Analysis
11723-05 GHG Report
36
Secretary of State for inclusion in the California Code of Regulations. The Amendments became effective on March 18, 2010.
The CEQA Amendments provide guidance to public agencies regarding the analysis and mitigation of the effects of GHG emissions in CEQA documents. The CEQA Amendments fit within the existing CEQA framework by amending existing CEQA Guidelines to reference climate change.
A new section, CEQA Guidelines Section 15064.4, was added to assist agencies in determining the significance of GHG emissions. The new section allows agencies the discretion to determine whether a quantitative or qualitative analysis is best for a particular project. However, little guidance is offered on the crucial next step in this assessment process—how to determine whether the project’s estimated GHG emissions are significant or cumulatively considerable.
Also amended were CEQA Guidelines Sections 15126.4 and 15130, which address mitigation measures and cumulative impacts, respectively. GHG mitigation measures are referenced in general terms, but no specific measures are championed. The revision to the cumulative impact discussion requirement (Section 15130) simply directs agencies to analyze GHG emissions in an EIR when a project’s incremental contribution of emissions may be cumulatively considerable, however it does not answer the question of when emissions are cumulatively considerable.
Section 15183.5 permits programmatic GHG analysis and later project-specific tiering, as well as the preparation of GHG Reduction Plans. Compliance with such plans can support a determination that a project’s cumulative effect is not cumulatively considerable, according to Section 15183.5(b).
In addition, the amendments revised Appendix F of the CEQA Guidelines, which focuses on Energy Conservation. The sample environmental checklist in Appendix G was amended to include GHG questions.
2.8 CITY OF VICTORVILLE CLIMATE ACTION PLAN (CAP)
The City has prepared a Climate Action Plan (CAP), which provides a framework for reducing GHG emissions and managing resources to best prepare for a changing climate (11). In order to determine consistency with the CAP, the City of Victorville provided Screening Tables to aid in measuring the reduction of GHG emissions attributable to certain design and construction measures incorporated into development projects. The CAP establishes categories of GHG reduction measures to reduce GHG emissions generated by development projects. CAP GHG reduction measure categories include: energy conservation, water use reduction, increased residential density or mixed uses, transportation management, and solid waste recycling. Within each category, individual sub-measures are assigned a point value under the city’s GHG Measures Screening Table.. The point values are adjusted according to the intensity of GHG reduction measure. “Modest” Measures that reduce GHG emissions by modest amounts are worth the least number of points; and enhanced GHG emissions reduction measures are worth the most points. Projects that yield at least 45 points are determined to be consistent with the CAP and do not require quantification of project specific GHG emissions. Screening Tables developed for the Project and included in the Project GHGA substantiate that the Project would yield 53 points and would therefore be consistent with the CAP, and further quantification of Project GHG

Desert Grove Retail Project Greenhouse Gas Analysis
11723-05 GHG Report
37
emissions is not required per the CAP (37). Project GHG emissions have nonetheless been quantified for informational and disclosure purposes.
Moreover, projects that are consistent with an adopted CAP may be found to cause a less than
significant impact under CEQA. (CEQA Guidelines § 15064(h)(3)). Projects that are consistent with adopted CAPs are also considered to support and would not conflict with an applicable plan, policy or regulation of an agency adopted for the purpose of reducing the emissions of greenhouse gases. The Project is substantiated herein to be consistent with the CAP. Project GHG emissions impacts on the environment are therefore considered less-than-significant. Additionally, because the Project is substantiated to be consistent with the CAP, the Project would not conflict with an applicable plan, policy or regulation of an agency adopted for the purpose of reducing the emissions of greenhouse gases.

Desert Grove Retail Project Greenhouse Gas Analysis
11723-05 GHG Report
38
This page intentionally left blank
Desert Grove Retail Project Greenhouse Gas Analysis
11723-05 GHG Report
39
3 PROJECT GREENHOUSE GAS IMPACT
3.1 INTRODUCTION
The Project has been evaluated to determine if it will result in a significant greenhouse gas impact. The significance of these potential impacts is described in the following section.
3.2 GREENHOUSE GAS EMISSIONS MODELING AND SOURCES
On October 17, 2017, the SCAQMD in conjunction with the California Air Pollution Control Officers Association (CAPCOA) and other California air districts, released the latest version of the California Emissions Estimator Model™ (CalEEMod™) v2016.3.2. The purpose of this model is to calculate construction-source and operational-source criteria pollutant (VOCs, NOX, SOX, CO, PM10, and PM2.5) and greenhouse gas (GHG) emissions from direct and indirect sources; and quantify applicable air quality and GHG reductions achieved from mitigation measures (38). Accordingly, the latest version of CalEEMod™ has been used for this Project to determine construction and operational air quality emissions. The CalEEMod protocol includes GHG emissions from the following source categories: construction, area, energy, mobile, waste, water. The Project GHG emissions are reported herein for informational purposes. CalEEMod output model runs are provided in Appendix 3.1. Unless otherwise noted, CalEEMod default inputs and parameters were employed in all modeling applications.
3.3 LIFE-CYCLE ANALYSIS CONSIDERATIONS
A full life-cycle analysis (LCA) for construction and operational activity is not included in this analysis due to the lack of consensus guidance on LCA methodology at this time. Life-cycle analysis (i.e., assessing economy-wide GHG emissions from the processes in manufacturing and transporting all raw materials used in the project development, infrastructure and on-going operations) depends on emission factors or econometric factors that are not well established for all processes. At this time an LCA would be extremely speculative and thus has not been prepared.
3.4 PROJECT GREENHOUSE GAS EMISSIONS
3.4.1 CONSTRUCTION-SOURCE EMISSIONS
Project construction actvities would generate CO2 and CH4 emissions The report Desert Grove Retail Project Air Quality Impact Analysis Report (Urban Crossroads, Inc. 2018) contains detailed information regarding Project construction activities (39).
Project construction-source GHG emissions are quantified and amortized over the life of the Project. To amortize the emissions over the life of the Project, the SCAQMD recommends calculating the total greenhouse gas emissions for construction activities, dividing it by a 30- year project life then adding that number to the annual operational-source GHG emissions (40). Accordingly, within this analysis, Project construction-source emissions were amortized over a 30-year period and added to the annual operational-source GHG emissions.
Desert Grove Retail Project Greenhouse Gas Analysis
11723-05 GHG Report
40
3.5 OPERATIONAL-SOURCE EMISSIONS
Project operations would generate CO2, CH4, and N2O emissions. Primary emissions sources would include:
• Miscellaneous Area Sources (landscape and site maintenance activities)
• Building Energy Use (combustion emissions associated with natural gas and electricity)
• Mobile Sources (vehicles)
• Solid Waste
• Water Supply, Treatment, and Distribution
3.5.1 MISCELLANEOUS AREA SOURCES
Landscape Maintenance Equipment
Landscape and site maintenance equipment would generate emissions from fuel combustion and evaporation of unburned fuel. Typical equipment in this category would include lawnmowers, shedders/grinders, sweepers, blowers, trimmers, chain saws, and hedge trimmers used to maintain the landscaping of the Project.
3.5.2 BUILDING ENERGY USE
Combustion Emissions Associated with Natural Gas and Electricity
GHGs are emitted from buildings as a result of activities for which electricity and natural gas are typically used as energy sources. Combustion of any type of fuel emits CO2 and other GHGs directly into the atmosphere; these emissions are considered direct emissions associated with a building. GHGs are also emitted during the generation of electricity from fossil fuels; these emissions are considered to be indirect emissions.
3.5.3 MOBILE SOURCES
Vehicles
Project-related operational air quality impacts derive primarily from vehicle trips generated by the Project. Trip characteristics available from the report, SWC US-395/Palmdale Road (SR-18) Traffic Impact Analysis (TJW Engineering, Inc. 2019) were utilized in this analysis (41).
3.5.4 SOLID WASTE
Retail commercial land uses would result in the generation and disposal of solid waste. A large percentage of this waste would be diverted from landfills by a variety of means, such as reducing the amount of waste generated, recycling, and/or composting. The remainder of the waste not diverted would be disposed of at a landfill. GHG emissions from landfills are associated with the anaerobic breakdown of material.

Desert Grove Retail Project Greenhouse Gas Analysis
11723-05 GHG Report
41
3.5.5 WATER SUPPLY, TREATMENT, AND DISTRIBUTION
Indirect GHG emissions result from the production of electricity used to convey, treat and distribute water and wastewater. The amount of electricity required to convey, treat and distribute water depends on the volume of water as well as the sources of the water. Default CalEEMod water use assumptions are applied for the Project, with the exception of the proposed car was use. Estimated water use for the proposed car wash is summarized below.
The project includes the construction and operation of a 3,000 square foot automated car wash. Water usage for the car wash has been estimated based on the Water Use, Evaporation and Carryout Conveyor Car Washes (International Carwash Association, 2018) This study assumes that the average conveyor car wash utilizes 30 gallons of freshwater per vehicle (42). This GHGA assumes that the car wash will service approximately 472 vehicles per day (based on the trip generation estimates from the Project’s traffic study). This assumption likely overstates the Project car wash water use because not all vehicles generated by the car wash would necessarily be washed (e.g., employee trips, vendor trips, etc.) . On this basis, water usage for the proposed automated car wash is estimated at 14,160 gallons per day or 5,168,400 gallons per year. The water usage estimates for the car wash were added to the default water usage estimates in CalEEMod.
3.6 EMISSIONS SUMMARY
For informational purposes, Project GHG emissions have been estimated and are summarized in Table 3-1.
TABLE 3-1: PROJECT GHG EMISSIONS SUMMARY (ANNUAL)
Emission Source Emissions (metric tons per year)
CO2 CH4 N2O Total CO2E
Annual construction-source emissions -amortized over 30 years
14.24 0.00 0.00 14.31
Misc. Area Sources 0.01 3.00E-05 0.00 0.01
Energy Use 764.47 0.03 8.57E-03 767.70
Mobile Sources 7,444.92 0.64 0.00 7,460.97
Solid Waste 49.76 2.94 0.00 123.28
Water Usage 59.70 0.34 8.47E-03 98.02
Total CO2E (All Sources) 8,464.29
Source: CalEEMod™ model output, See Appendix 3.1 for detailed model outputs. Note: Totals obtained from CalEEMod™ and may not total 100% due to rounding. Table results include scientific notation. e is used to represent times ten raised to the power of (which would be written as x 10b") and is followed by the value of the exponent

Desert Grove Retail Project Greenhouse Gas Analysis
11723-05 GHG Report
42
3.7 FINDINGS AND CONCLUSIONS
GHG Impact #1: The Project would not generate direct or indirect greenhouse gas emission that would result in a significant impact on the environment.
The Project will result in approximately 1,003.32 MTCO2e per year from construction, area, energy, waste, and water usage. In addition, the Project has the potential to result in an additional 7,460.97 MTCO2e per year from mobile sources if the assumption is made that all of the vehicle trips to and from the Project are “new” trips resulting from the development of the Project. As such, the Project has the potential to generate a total of approximately 8,464.29 MTCO2e per year as summarized on Table 3-1. An individual project cannot generate enough GHG emissions to influence global climate change. The project participates in this potential impact by its incremental contribution combined with the cumulative increase of all other sources of GHGs, which when taken together may have a significant impact on global climate change. Because the City’s CAP addresses GHG emissions reduction, is in concert with AB 32 and international efforts to address global climate change, and includes specific local requirements that will substantially lessen the cumulative problem, compliance with the CAP fulfills the description of mitigation found in CEQA Guidelines §15130(a)(3) and §15183.5.
Projects that yield 45 points under the city’s GHG Screening Tables methodology are considered to be consistent with the CAP. Per the Project GHGA Screening Tables (GHGA Appendix 3.2), the Project would yield 53 points. The Project would therefore be consistent with the CAP. Because the Project is consistent with the CAP, Project GHG emissions would have a less-than-significant impact on the environment. The CAP states that quantification of emissions is not required for development proposals that are determined consistent with the CAP. Quantification of GHG emissions attributable to the Project are nonetheless quantified herein and disclosed for informational purposes.
GHG Impact #2: The Project would not conflict with any applicable plan, policy or regulation of an agency adopted for the purpose of reducing the emissions of greenhouse gases.
As discussed in Impact GHG Impact #1 above, the Project is consistent with the City of Victorville’s adopted CAP since it will achieve the required minimum 45 points per the City’s Screening Tables. Because the Project is consitent with CAP, the Project is also determined to be consistent with AB 32’s Scoping Plan reduction target for Year 2020 and 2030. The Project would be required to comply with any future City-mandated, state-mandated, or federally-mandated retrofit obligations enacted or promulgated to legally require development projects to assist in meeting state-adopted greenhouse gas emissions reduction targets, including those manadates established under Executive Order S-3-05, Executive Order B-30-15, or SB 32. On this basis, the Project would not conflict with any applicable plan, policy or regulation of an agency adopted for the purpose of reducing the emissions of greenhouse gases.

Desert Grove Retail Project Greenhouse Gas Analysis
11723-05 GHG Report
43
This page intentionally left blank

Desert Grove Retail Project Greenhouse Gas Analysis
11723-05 GHG Report
44
4 REFERENCES
1. Association of Environmental Professionals. 2018 CEQA California Environmental Quality Act. 2018.
2. Air Resources Board. Assembly Bill 32: Global Warming Solutions Act. [Online] 2006. http://www.arb.ca.gov/cc/ab32/ab32.htm.
3. South Coast Air Quality Management District. Greenhouse Gases (GHG) CEQA Significance Thresholds. [Online] http://www.aqmd.gov/home/regulations/ceqa/air-quality-analysis-handbook/ghg-significance-thresholds.
4. Building Standards Commission. California Building Standards Code (Title 24, California Code of Regulations). [Online] http://www.bsc.ca.gov/codes.aspx.
5. South Coast Air Quality Management District. Southern California Air Basins. [Online] http://www.aqmd.gov/map/mapaqmd1.pdf.
6. South coast Air Quality Management District. CEQA Air Quality Handbook (1993). [Online] 1993. http://www.leginfo.ca.gov/pub/05-06/bill/asm/ab_1851-1900/ab_1881_bill_20060928_chaptered.pdf.
7. United Nations. GHG Profiles - Annex I. [Online] http://di.unfccc.int/ghg_profile_annex1.
8. —. GHG Profiles - Non-Annex I. [Online] http://di.unfccc.int/ghg_profile_non_annex1.
9. Environmental Protection Agency. Inventory of U.S. Greenhouse Gas Emissions and Sinks 1990-2016. [Online] 2018. https://www.epa.gov/sites/production/files/2018-01/documents/2018_complete_report.pdf.
10. Air Resources Board. California Greenhouse Gas Emission Inventory -2016 Edition. [Online] June 17, 2016. http://www.arb.ca.gov/cc/inventory/data/data.htm.
11. City of Victorville. Climate Action Plan. Victorville : s.n., 2015.
12. World Resources Institute. Climate Analysis Indicator Tool (CAIT). [Online] http://cait.wri.org.
13. National Oceanic and Atmospheric Administration. Greenhouse Gases - Water Vapor. NOAA National Centers For Environmental Information. [Online] https://www.ncdc.noaa.gov/monitoring-references/faq/greenhouse-gases.php?section=watervapor.
14. The Carbon Cycle and Climate Change. Bennington, Bret J. 1, s.l. : Brooks/Cole. ISBN 1 3: 978-0-495-73855-8.
15. Climate Change 2007: The Physical Science Basis. Contribution of Working Group I to the Fourth Assessment Report. International Panel on Climate Change. 4, 2007.
16. National Oceanic and Atmospheric Administration. Greenhouse Gases - Methane. NOAA National Centers for Environmental Information. [Online] https://www.ncdc.noaa.gov/monitoring-references/faq/greenhouse-gases.php?section=methane.
17. The National Institute for Occupational Safety and Health. Workplace Safety and Health Topics - Nitrous Oxide. Centers for Disease Control and Prevention. [Online] https://www.cdc.gov/niosh/topics/nitrousoxide/default.html.
18. National Oceanic and Atmospheric Administration. Greenhouse Gases - Chlorofluorocarbons. NOAA National Centers For Environmental Information. [Online] https://www.ncdc.noaa.gov/monitoring-references/faq/greenhouse-gases.php?section=chlorofluorocarbons.
19. Environmental Protection Agency. Overview of Greenhouse Gases. [Online] https://www.epa.gov/ghgemissions/overview-greenhouse-gases.

Desert Grove Retail Project Greenhouse Gas Analysis
11723-05 GHG Report
45
20. United States Environmental Protection Agency. Regulation for Reducting Sulfur Hexafluoride Emissions from Gas Insulated Switchgear. Environmental Protection Agency. [Online] May 7, 2014. https://www.epa.gov/sites/production/files/2016-02/documents/mehl-arb-presentation-2014-wkshp.pdf.
21. World Resources Institute. Nitrogen Trifluoride Now Required in GHG Protocol Greenhouse Gas Emissions Inventory. [Online] May 22, 2013. https://www.wri.org/blog/2013/05/nitrogen-trifluoride-now-required-ghg-protocol-greenhouse-gas-emissions-inventories.
22. National Center for Biotechnology Information. Nitrogen Trifluoride. PubChem Compound Database. [Online] https://pubchem.ncbi.nlm.nih.gov/compound/24553 .
23. American Lung Association. Climate Change. [Online] http://www.lung.org/our-initiatives/healthy-air/outdoor/climate-change/.
24. Barbara H. Allen-Diaz. Climate change affects us all. University of California Agriculture and Natural Resources. [Online] April 1, 2009. http://calag.ucanr.edu/Archive/?article=ca.v063n02p51.
25. The National Institute for Occupational Safety and Health. Carbon Dioxide. Centers for Disease Control and Prevention. [Online] https://www.cdc.gov/niosh/npg/npgd0103.html.
26. United States Department of Labor. Nitrous Oxide in Workplace Atmospheres (Passive Monitor). Occupational Health and Safety Administration. [Online] 1994. https://www.osha.gov/dts/sltc/methods/inorganic/id166/id166.html.
27. Hardin, Mary and Kahn, Ralph. Aerosols & Climate Change. Earth Observatory. [Online] http://earthobservatory.nasa.gov/Features/Aerosols/.
28. Centeres for Disease Control and Prevention. Nitrogen Trifluoride. [Online] 2015. https://www.cdc.gov/niosh/ipcsneng/neng1234.html.
29. Center for Climate and Energy Solutions (C2ES). Outcomes of the U.N. Climate Change Conference. Center for Climate and Energy Solutions (C2ES). [Online] 2015a. [Cited: April 19, 2016.] http://www.c2es.org/international/negotiations/cop21-paris/summary.
30. Agency, United States Environmental Protection. Endangerment and Cause or Contribute Findings for Greenhouse Gases under the Section 202(a) of the Clean Air Act. United States Environmental Protection Agency. [Online] https://www.epa.gov/ghgemissions/endangerment-and-cause-or-contribute-findings-greenhouse-gases-under-section-202a-clean.
31. Lawrence Berkeley National Laboratory. California's Policies Can Significantly Cut Greenhouse Gas Emissions through 2030. Lawrence Berkeley National Laboratory. [Online] January 22, 2015. http://newscenter.lbl.gov/2015/01/22/californias-policies-can-significantly-cut-greenhouse-gas-emissions-2030/.
32. Ernest Orlando Lawrence Berkeley National Laboratory. Modeling California policy impacts on greenhouse gas emissions. [Online] 2015. https://eetd.lbl.gov/sites/all/files/lbnl-7008e.pdf.
33. California Legislative Information. Senate Bill No. 32. [Online] September 8, 2016. https://leginfo.legislature.ca.gov/faces/billNavClient.xhtml?bill_id=201520160SB32.
34. Policy Matters Journal: A Student Publication from the Goldman School of Public Policy. New California Emissions Targets Spell Next Step in the State’s Fight against Climate Change. [Online] September 1, 2016. http://www.policymattersjournal.org/sb32.html.
35. California Air Resources Board (ARB). Cap and Trade Overview. California Air Resources Board. [Online] [Cited: May 10, 2016.] http://www.arb.ca.gov/cc/capandtrade/guidance/cap_trade_overview.pdf. .

Desert Grove Retail Project Greenhouse Gas Analysis
11723-05 GHG Report
46
36. The California Energy Commission. 2019 Building Energy Efficieny Standards. California Energy Commission. [Online] https://www.energy.ca.gov/title24/2019standards/documents/2018_Title_24_2019_Building_Standards_FAQ.pdf.
37. City of Victorville. Draft City of Victorville Greenhouse Gas Emissions Screening Tables. 2016.
38. California Air Pollution Control Officers Association (CAPCOA). California Emissions Estimator Model (CalEEMod). [Online] September 2016. www.caleemod.com.
39. Urban Crossroads, Inc. Desert Grove Retail Project Air Quality Impact Analysis Report. 2019.
40. South Coast Air Quality Management District. Greenhouse Gas CEQA Significance Threshold Stakeholder Working Group #13. [Powerpoint] Diamond Bar : s.n., 2009.
41. TJW Engineering, Inc. SWC US-395/Palmdale Road (SR-18) Traffic Impact Analysis. 2019.
42. International Carwash Association. Water Use, Evaporation and Carryout Conveyor Car Washes. 2018.
Desert Grove Retail Project Greenhouse Gas Analysis
11723-05 GHG Report
47
This page intentionally left blank

Desert Grove Retail Project Greenhouse Gas Analysis
11723-05 GHG Report
48
5 CERTIFICATION
The contents of this greenhouse gas study report represent an accurate depiction of the greenhouse gas impacts associated with the proposed Desert Grove Retail Project . The information contained in this greenhouse gas report is based on the best available data at the time of preparation. If you have any questions, please contact me directly at (949) 336-5987.
Haseeb Qureshi Senior Associate URBAN CROSSROADS, INC. 260 E. Baker St., Suite 200 Costa Mesa, CA 92626 (949) 336-5987 [email protected]
EDUCATION
Master of Science in Environmental Studies California State University, Fullerton • May, 2010
Bachelor of Arts in Environmental Analysis and Design University of California, Irvine • June, 2006
PROFESSIONAL AFFILIATIONS AEP – Association of Environmental Planners AWMA – Air and Waste Management Association ASTM – American Society for Testing and Materials
PROFESSIONAL CERTIFICATIONS
Planned Communities and Urban Infill – Urban Land Institute • June 2011 Indoor Air Quality and Industrial Hygiene – EMSL Analytical • April 2008 Principles of Ambient Air Monitoring – California Air Resources Board • August 2007 AB2588 Regulatory Standards – Trinity Consultants • November 2006 Air Dispersion Modeling – Lakes Environmental • June 2006

Desert Grove Retail Project Greenhouse Gas Analysis
11723-04 GHG Report
This page intentionally left blank

Desert Grove Retail Project Greenhouse Gas Analysis
11723-04 GHG Report
APPENDIX 3.1:
CALEEMOD EMISSIONS MODEL OUTPUTS

1.1 Land Usage
Land Uses Size Metric Lot Acreage Floor Surface Area Population
Parking Lot 488.00 Space 4.39 195,200.00 0
Fast Food Restaurant with Drive Thru 8.80 1000sqft 2.20 8,800.00 0
High Turnover (Sit Down Restaurant) 4.50 1000sqft 1.10 4,500.00 0
Automobile Care Center 3.00 1000sqft 0.77 3,000.00 0
Convenience Market With Gas Pumps 16.00 Pump 0.55 5,268.00 0
Regional Shopping Center 75.00 1000sqft 6.38 75,000.00 0
1.2 Other Project Characteristics
Urbanization
Climate Zone
Urban
10
Wind Speed (m/s) Precipitation Freq (Days)2.6 32
1.3 User Entered Comments & Non-Default Data
1.0 Project Characteristics
Utility Company Southern California Edison
2019Operational Year
CO2 Intensity (lb/MWhr)
702.44 0.029CH4 Intensity (lb/MWhr)
0.006N2O Intensity (lb/MWhr)
Victorville Retail (Operations)San Bernardino-Mojave Desert County, Annual
CalEEMod Version: CalEEMod.2016.3.2 Date: 2/1/2019 9:41 AMPage 1 of 24
Victorville Retail (Operations) - San Bernardino-Mojave Desert County, Annual

Project Characteristics -
Land Use - Total Project area as per the Site Plan is 10.03 acres.
Construction Phase - Operational Run Only.
Off-road Equipment - Operational Run Only.
Trips and VMT - Operational Run Only.
Vehicle Trips - Trip Rates based on TIA by TJW Engineering, Inc. (2019)
Water And Wastewater - Car Wash Water Usage (indoor) adjusted to include CalEEMod Default of 282,243.32 annual gallons + 30 gallons per wash x 365 days x 472 vehicles per day (based on trip generation) = 5,450,643.32 annual gallons
CalEEMod Version: CalEEMod.2016.3.2 Date: 2/1/2019 9:41 AMPage 2 of 24
Victorville Retail (Operations) - San Bernardino-Mojave Desert County, Annual

Table Name Column Name Default Value New Value
tblConstructionPhase NumDays 10.00 1.00
tblLandUse LandUseSquareFeet 2,258.80 5,268.00
tblLandUse LotAcreage 0.20 2.20
tblLandUse LotAcreage 0.10 1.10
tblLandUse LotAcreage 0.07 0.77
tblLandUse LotAcreage 0.05 0.55
tblLandUse LotAcreage 1.72 6.38
tblOffRoadEquipment OffRoadEquipmentUnitAmount 3.00 0.00
tblOffRoadEquipment OffRoadEquipmentUnitAmount 4.00 0.00
tblVehicleTrips ST_TR 23.72 314.67
tblVehicleTrips ST_TR 204.47 205.36
tblVehicleTrips ST_TR 722.03 616.12
tblVehicleTrips ST_TR 158.37 122.40
tblVehicleTrips ST_TR 49.97 46.12
tblVehicleTrips SU_TR 11.88 314.67
tblVehicleTrips SU_TR 166.88 205.36
tblVehicleTrips SU_TR 542.72 472.58
tblVehicleTrips SU_TR 131.84 142.64
tblVehicleTrips SU_TR 25.24 21.10
tblVehicleTrips WD_TR 23.72 314.67
tblVehicleTrips WD_TR 542.60 205.36
tblVehicleTrips WD_TR 496.12 470.95
tblVehicleTrips WD_TR 127.15 112.18
tblVehicleTrips WD_TR 42.70 37.75
tblWater IndoorWaterUseRate 282,243.32 5,450,643.32
CalEEMod Version: CalEEMod.2016.3.2 Date: 2/1/2019 9:41 AMPage 3 of 24
Victorville Retail (Operations) - San Bernardino-Mojave Desert County, Annual
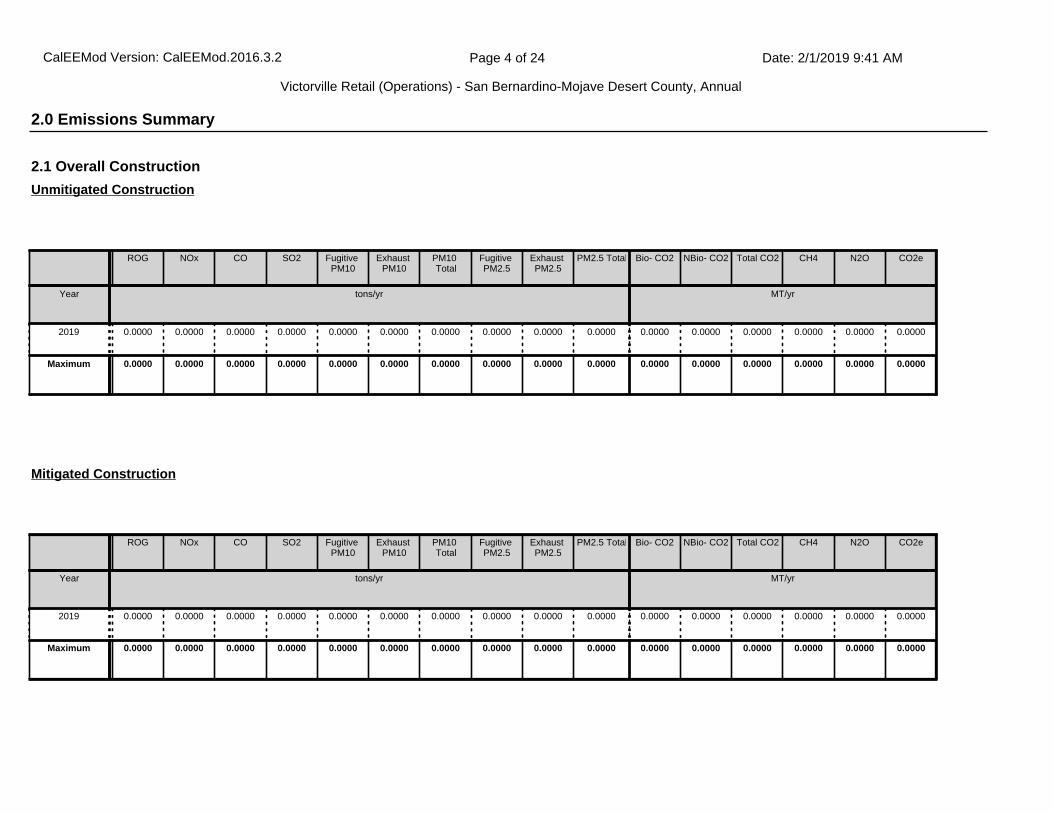
2.0 Emissions Summary
2.1 Overall Construction
ROG NOx CO SO2 Fugitive PM10
Exhaust PM10
PM10 Total
Fugitive PM2.5
Exhaust PM2.5
PM2.5 Total Bio- CO2 NBio- CO2 Total CO2 CH4 N2O CO2e
Year tons/yr MT/yr
2019 0.0000 0.0000 0.0000 0.0000 0.0000 0.0000 0.0000 0.0000 0.0000 0.0000 0.0000 0.0000 0.0000 0.0000 0.0000 0.0000
Maximum 0.0000 0.0000 0.0000 0.0000 0.0000 0.0000 0.0000 0.0000 0.0000 0.0000 0.0000 0.0000 0.0000 0.0000 0.0000 0.0000
Unmitigated Construction
ROG NOx CO SO2 Fugitive PM10
Exhaust PM10
PM10 Total
Fugitive PM2.5
Exhaust PM2.5
PM2.5 Total Bio- CO2 NBio- CO2 Total CO2 CH4 N2O CO2e
Year tons/yr MT/yr
2019 0.0000 0.0000 0.0000 0.0000 0.0000 0.0000 0.0000 0.0000 0.0000 0.0000 0.0000 0.0000 0.0000 0.0000 0.0000 0.0000
Maximum 0.0000 0.0000 0.0000 0.0000 0.0000 0.0000 0.0000 0.0000 0.0000 0.0000 0.0000 0.0000 0.0000 0.0000 0.0000 0.0000
Mitigated Construction
CalEEMod Version: CalEEMod.2016.3.2 Date: 2/1/2019 9:41 AMPage 4 of 24
Victorville Retail (Operations) - San Bernardino-Mojave Desert County, Annual

2.2 Overall Operational
ROG NOx CO SO2 Fugitive PM10
Exhaust PM10
PM10 Total
Fugitive PM2.5
Exhaust PM2.5
PM2.5 Total Bio- CO2 NBio- CO2 Total CO2 CH4 N2O CO2e
Category tons/yr MT/yr
Area 0.5090 5.0000e-005
5.5200e-003
0.0000 2.0000e-005
2.0000e-005
2.0000e-005
2.0000e-005
0.0000 0.0106 0.0106 3.0000e-005
0.0000 0.0114
Energy 0.0211 0.1918 0.1611 1.1500e-003
0.0146 0.0146 0.0146 0.0146 0.0000 764.4696 764.4696 0.0269 8.5700e-003
767.6983
Mobile 3.5276 22.8807 28.2872 0.0803 4.6351 0.0806 4.7156 1.2425 0.0759 1.3184 0.0000 7,444.9189
7,444.9189
0.6419 0.0000 7,460.9664
Waste 0.0000 0.0000 0.0000 0.0000 49.7592 0.0000 49.7592 2.9407 0.0000 123.2763
Water 0.0000 0.0000 0.0000 0.0000 4.8256 77.0451 81.8706 0.4988 0.0124 98.0245
Total 4.0577 23.0726 28.4538 0.0814 4.6351 0.0952 4.7302 1.2425 0.0905 1.3330 54.5847 8,286.4442
8,341.0289
4.1084 0.0209 8,449.9768
Unmitigated Operational
ROG NOx CO SO2 Fugitive PM10
Exhaust PM10
PM10 Total
Fugitive PM2.5
Exhaust PM2.5
PM2.5 Total
Bio- CO2 NBio-CO2 Total CO2 CH4 N20 CO2e
Percent Reduction
0.00 0.00 0.00 0.00 0.00 0.00 0.00 0.00 0.00 0.00 0.00 0.00 0.00 0.00 0.00 0.00
Quarter Start Date End Date Maximum Unmitigated ROG + NOX (tons/quarter) Maximum Mitigated ROG + NOX (tons/quarter)
Highest
CalEEMod Version: CalEEMod.2016.3.2 Date: 2/1/2019 9:41 AMPage 5 of 24
Victorville Retail (Operations) - San Bernardino-Mojave Desert County, Annual

2.2 Overall Operational
ROG NOx CO SO2 Fugitive PM10
Exhaust PM10
PM10 Total
Fugitive PM2.5
Exhaust PM2.5
PM2.5 Total Bio- CO2 NBio- CO2 Total CO2 CH4 N2O CO2e
Category tons/yr MT/yr
Area 0.5090 5.0000e-005
5.5200e-003
0.0000 2.0000e-005
2.0000e-005
2.0000e-005
2.0000e-005
0.0000 0.0106 0.0106 3.0000e-005
0.0000 0.0114
Energy 0.0211 0.1918 0.1611 1.1500e-003
0.0146 0.0146 0.0146 0.0146 0.0000 764.4696 764.4696 0.0269 8.5700e-003
767.6983
Mobile 3.5276 22.8807 28.2872 0.0803 4.6351 0.0806 4.7156 1.2425 0.0759 1.3184 0.0000 7,444.9189
7,444.9189
0.6419 0.0000 7,460.9664
Waste 0.0000 0.0000 0.0000 0.0000 49.7592 0.0000 49.7592 2.9407 0.0000 123.2763
Water 0.0000 0.0000 0.0000 0.0000 4.8256 77.0451 81.8706 0.4988 0.0124 98.0245
Total 4.0577 23.0726 28.4538 0.0814 4.6351 0.0952 4.7302 1.2425 0.0905 1.3330 54.5847 8,286.4442
8,341.0289
4.1084 0.0209 8,449.9768
Mitigated Operational
3.0 Construction Detail
Construction Phase
Phase Number
Phase Name Phase Type Start Date End Date Num Days Week
Num Days Phase Description
1 Site Preparation Site Preparation 4/1/2019 4/1/2019 5 1
ROG NOx CO SO2 Fugitive PM10
Exhaust PM10
PM10 Total
Fugitive PM2.5
Exhaust PM2.5
PM2.5 Total
Bio- CO2 NBio-CO2 Total CO2 CH4 N20 CO2e
Percent Reduction
0.00 0.00 0.00 0.00 0.00 0.00 0.00 0.00 0.00 0.00 0.00 0.00 0.00 0.00 0.00 0.00
Acres of Grading (Site Preparation Phase): 0
CalEEMod Version: CalEEMod.2016.3.2 Date: 2/1/2019 9:41 AMPage 6 of 24
Victorville Retail (Operations) - San Bernardino-Mojave Desert County, Annual

3.1 Mitigation Measures Construction
OffRoad Equipment
Phase Name Offroad Equipment Type Amount Usage Hours Horse Power Load Factor
Site Preparation Rubber Tired Dozers 0 8.00 247 0.40
Site Preparation Tractors/Loaders/Backhoes 0 8.00 97 0.37
Trips and VMT
Phase Name Offroad Equipment Count
Worker Trip Number
Vendor Trip Number
Hauling Trip Number
Worker Trip Length
Vendor Trip Length
Hauling Trip Length
Worker Vehicle Class
Vendor Vehicle Class
Hauling Vehicle Class
Site Preparation 0 0.00 0.00 0.00 10.80 7.30 20.00 LD_Mix HDT_Mix HHDT
Residential Indoor: 0; Residential Outdoor: 0; Non-Residential Indoor: 0; Non-Residential Outdoor: 0; Striped Parking Area: 0 (Architectural Coating – sqft)
Acres of Grading (Grading Phase): 0
Acres of Paving: 4.39
CalEEMod Version: CalEEMod.2016.3.2 Date: 2/1/2019 9:41 AMPage 7 of 24
Victorville Retail (Operations) - San Bernardino-Mojave Desert County, Annual

3.2 Site Preparation - 2019
ROG NOx CO SO2 Fugitive PM10
Exhaust PM10
PM10 Total
Fugitive PM2.5
Exhaust PM2.5
PM2.5 Total Bio- CO2 NBio- CO2 Total CO2 CH4 N2O CO2e
Category tons/yr MT/yr
Fugitive Dust 0.0000 0.0000 0.0000 0.0000 0.0000 0.0000 0.0000 0.0000 0.0000 0.0000 0.0000 0.0000
Off-Road 0.0000 0.0000 0.0000 0.0000 0.0000 0.0000 0.0000 0.0000 0.0000 0.0000 0.0000 0.0000 0.0000 0.0000
Total 0.0000 0.0000 0.0000 0.0000 0.0000 0.0000 0.0000 0.0000 0.0000 0.0000 0.0000 0.0000 0.0000 0.0000 0.0000 0.0000
Unmitigated Construction On-Site
ROG NOx CO SO2 Fugitive PM10
Exhaust PM10
PM10 Total
Fugitive PM2.5
Exhaust PM2.5
PM2.5 Total Bio- CO2 NBio- CO2 Total CO2 CH4 N2O CO2e
Category tons/yr MT/yr
Hauling 0.0000 0.0000 0.0000 0.0000 0.0000 0.0000 0.0000 0.0000 0.0000 0.0000 0.0000 0.0000 0.0000 0.0000 0.0000 0.0000
Vendor 0.0000 0.0000 0.0000 0.0000 0.0000 0.0000 0.0000 0.0000 0.0000 0.0000 0.0000 0.0000 0.0000 0.0000 0.0000 0.0000
Worker 0.0000 0.0000 0.0000 0.0000 0.0000 0.0000 0.0000 0.0000 0.0000 0.0000 0.0000 0.0000 0.0000 0.0000 0.0000 0.0000
Total 0.0000 0.0000 0.0000 0.0000 0.0000 0.0000 0.0000 0.0000 0.0000 0.0000 0.0000 0.0000 0.0000 0.0000 0.0000 0.0000
Unmitigated Construction Off-Site
CalEEMod Version: CalEEMod.2016.3.2 Date: 2/1/2019 9:41 AMPage 8 of 24
Victorville Retail (Operations) - San Bernardino-Mojave Desert County, Annual

4.0 Operational Detail - Mobile
3.2 Site Preparation - 2019
ROG NOx CO SO2 Fugitive PM10
Exhaust PM10
PM10 Total
Fugitive PM2.5
Exhaust PM2.5
PM2.5 Total Bio- CO2 NBio- CO2 Total CO2 CH4 N2O CO2e
Category tons/yr MT/yr
Fugitive Dust 0.0000 0.0000 0.0000 0.0000 0.0000 0.0000 0.0000 0.0000 0.0000 0.0000 0.0000 0.0000
Off-Road 0.0000 0.0000 0.0000 0.0000 0.0000 0.0000 0.0000 0.0000 0.0000 0.0000 0.0000 0.0000 0.0000 0.0000
Total 0.0000 0.0000 0.0000 0.0000 0.0000 0.0000 0.0000 0.0000 0.0000 0.0000 0.0000 0.0000 0.0000 0.0000 0.0000 0.0000
Mitigated Construction On-Site
ROG NOx CO SO2 Fugitive PM10
Exhaust PM10
PM10 Total
Fugitive PM2.5
Exhaust PM2.5
PM2.5 Total Bio- CO2 NBio- CO2 Total CO2 CH4 N2O CO2e
Category tons/yr MT/yr
Hauling 0.0000 0.0000 0.0000 0.0000 0.0000 0.0000 0.0000 0.0000 0.0000 0.0000 0.0000 0.0000 0.0000 0.0000 0.0000 0.0000
Vendor 0.0000 0.0000 0.0000 0.0000 0.0000 0.0000 0.0000 0.0000 0.0000 0.0000 0.0000 0.0000 0.0000 0.0000 0.0000 0.0000
Worker 0.0000 0.0000 0.0000 0.0000 0.0000 0.0000 0.0000 0.0000 0.0000 0.0000 0.0000 0.0000 0.0000 0.0000 0.0000 0.0000
Total 0.0000 0.0000 0.0000 0.0000 0.0000 0.0000 0.0000 0.0000 0.0000 0.0000 0.0000 0.0000 0.0000 0.0000 0.0000 0.0000
Mitigated Construction Off-Site
CalEEMod Version: CalEEMod.2016.3.2 Date: 2/1/2019 9:41 AMPage 9 of 24
Victorville Retail (Operations) - San Bernardino-Mojave Desert County, Annual

ROG NOx CO SO2 Fugitive PM10
Exhaust PM10
PM10 Total
Fugitive PM2.5
Exhaust PM2.5
PM2.5 Total Bio- CO2 NBio- CO2 Total CO2 CH4 N2O CO2e
Category tons/yr MT/yr
Mitigated 3.5276 22.8807 28.2872 0.0803 4.6351 0.0806 4.7156 1.2425 0.0759 1.3184 0.0000 7,444.9189
7,444.9189
0.6419 0.0000 7,460.9664
Unmitigated 3.5276 22.8807 28.2872 0.0803 4.6351 0.0806 4.7156 1.2425 0.0759 1.3184 0.0000 7,444.9189
7,444.9189
0.6419 0.0000 7,460.9664
4.1 Mitigation Measures Mobile
4.2 Trip Summary Information
4.3 Trip Type Information
Average Daily Trip Rate Unmitigated Mitigated
Land Use Weekday Saturday Sunday Annual VMT Annual VMT
Automobile Care Center 944.01 944.01 944.01 940,410 940,410
Convenience Market With Gas Pumps 3,285.76 3,285.76 3285.76 1,762,496 1,762,496
Fast Food Restaurant with Drive Thru 4,144.36 5,421.86 4158.70 4,044,608 4,044,608
High Turnover (Sit Down Restaurant) 504.81 550.80 641.88 616,056 616,056
Parking Lot 0.00 0.00 0.00
Regional Shopping Center 2,831.25 3,459.00 1582.50 4,808,501 4,808,501
Total 11,710.19 13,661.43 10,612.85 12,172,070 12,172,070
CalEEMod Version: CalEEMod.2016.3.2 Date: 2/1/2019 9:41 AMPage 10 of 24
Victorville Retail (Operations) - San Bernardino-Mojave Desert County, Annual

Miles Trip % Trip Purpose %
Land Use H-W or C-W H-S or C-C H-O or C-NW H-W or C-W H-S or C-C H-O or C-NW Primary Diverted Pass-by
Automobile Care Center 9.50 7.30 7.30 33.00 48.00 19.00 21 51 28
Convenience Market With Gas Pumps
9.50 7.30 7.30 0.80 80.20 19.00 14 21 65
Fast Food Restaurant with Drive Thru
9.50 7.30 7.30 2.20 78.80 19.00 29 21 50
High Turnover (Sit Down Restaurant)
9.50 7.30 7.30 8.50 72.50 19.00 37 20 43
Parking Lot 9.50 7.30 7.30 0.00 0.00 0.00 0 0 0
Regional Shopping Center 9.50 7.30 7.30 16.30 64.70 19.00 54 35 11
5.0 Energy Detail
5.1 Mitigation Measures Energy
4.4 Fleet Mix
Land Use LDA LDT1 LDT2 MDV LHD1 LHD2 MHD HHD OBUS UBUS MCY SBUS MH
Automobile Care Center 0.541740 0.038987 0.178620 0.126833 0.019742 0.005671 0.017070 0.060066 0.001326 0.001715 0.006244 0.000823 0.001163
Convenience Market With Gas Pumps
0.541740 0.038987 0.178620 0.126833 0.019742 0.005671 0.017070 0.060066 0.001326 0.001715 0.006244 0.000823 0.001163
Fast Food Restaurant with Drive Thru
0.541740 0.038987 0.178620 0.126833 0.019742 0.005671 0.017070 0.060066 0.001326 0.001715 0.006244 0.000823 0.001163
High Turnover (Sit Down Restaurant)
0.541740 0.038987 0.178620 0.126833 0.019742 0.005671 0.017070 0.060066 0.001326 0.001715 0.006244 0.000823 0.001163
Parking Lot 0.541740 0.038987 0.178620 0.126833 0.019742 0.005671 0.017070 0.060066 0.001326 0.001715 0.006244 0.000823 0.001163
Regional Shopping Center 0.541740 0.038987 0.178620 0.126833 0.019742 0.005671 0.017070 0.060066 0.001326 0.001715 0.006244 0.000823 0.001163
Historical Energy Use: N
CalEEMod Version: CalEEMod.2016.3.2 Date: 2/1/2019 9:41 AMPage 11 of 24
Victorville Retail (Operations) - San Bernardino-Mojave Desert County, Annual
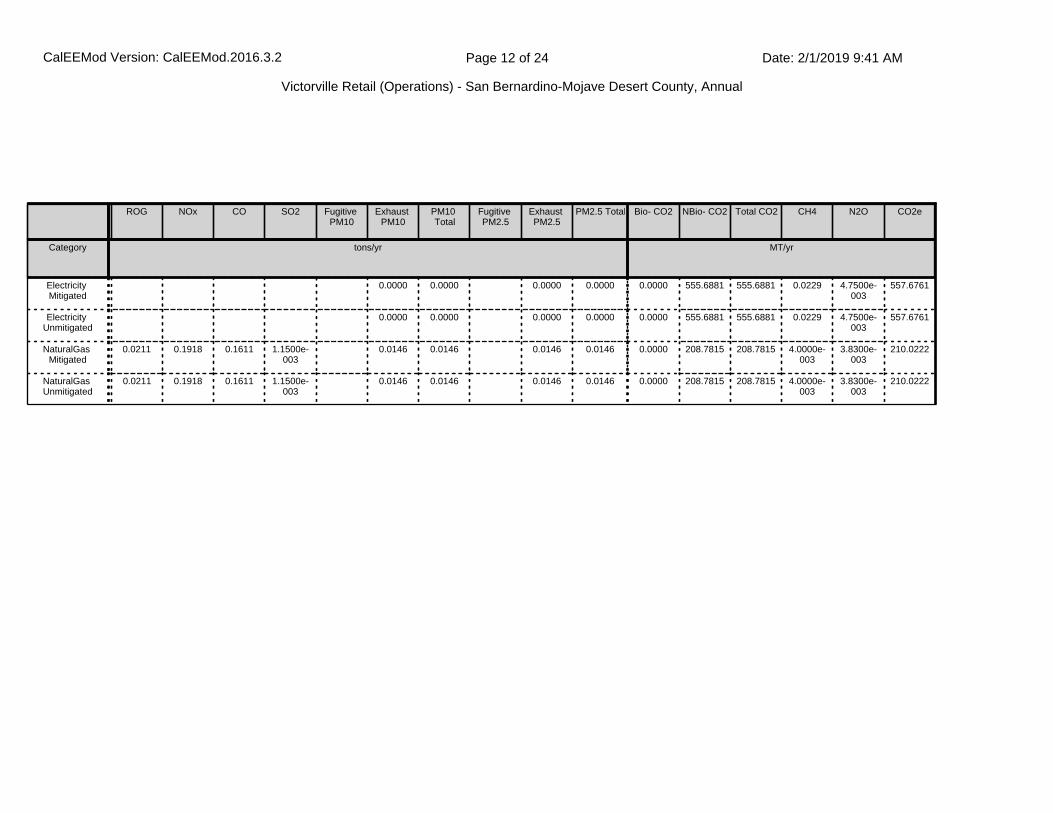
ROG NOx CO SO2 Fugitive PM10
Exhaust PM10
PM10 Total
Fugitive PM2.5
Exhaust PM2.5
PM2.5 Total Bio- CO2 NBio- CO2 Total CO2 CH4 N2O CO2e
Category tons/yr MT/yr
Electricity Mitigated
0.0000 0.0000 0.0000 0.0000 0.0000 555.6881 555.6881 0.0229 4.7500e-003
557.6761
Electricity Unmitigated
0.0000 0.0000 0.0000 0.0000 0.0000 555.6881 555.6881 0.0229 4.7500e-003
557.6761
NaturalGas Mitigated
0.0211 0.1918 0.1611 1.1500e-003
0.0146 0.0146 0.0146 0.0146 0.0000 208.7815 208.7815 4.0000e-003
3.8300e-003
210.0222
NaturalGas Unmitigated
0.0211 0.1918 0.1611 1.1500e-003
0.0146 0.0146 0.0146 0.0146 0.0000 208.7815 208.7815 4.0000e-003
3.8300e-003
210.0222
CalEEMod Version: CalEEMod.2016.3.2 Date: 2/1/2019 9:41 AMPage 12 of 24
Victorville Retail (Operations) - San Bernardino-Mojave Desert County, Annual

5.2 Energy by Land Use - NaturalGas
NaturalGas Use
ROG NOx CO SO2 Fugitive PM10
Exhaust PM10
PM10 Total
Fugitive PM2.5
Exhaust PM2.5
PM2.5 Total Bio- CO2 NBio- CO2 Total CO2 CH4 N2O CO2e
Land Use kBTU/yr tons/yr MT/yr
Automobile Care Center
97470 5.3000e-004
4.7800e-003
4.0100e-003
3.0000e-005
3.6000e-004
3.6000e-004
3.6000e-004
3.6000e-004
0.0000 5.2014 5.2014 1.0000e-004
1.0000e-004
5.2323
Convenience Market With Gas
Pumps
11695 6.0000e-005
5.7000e-004
4.8000e-004
0.0000 4.0000e-005
4.0000e-005
4.0000e-005
4.0000e-005
0.0000 0.6241 0.6241 1.0000e-005
1.0000e-005
0.6278
Fast Food Restaurant with
Drive Thru
2.40627e+006
0.0130 0.1180 0.0991 7.1000e-004
8.9600e-003
8.9600e-003
8.9600e-003
8.9600e-003
0.0000 128.4078 128.4078 2.4600e-003
2.3500e-003
129.1709
High Turnover (Sit Down Restaurant)
1.23048e+006
6.6300e-003
0.0603 0.0507 3.6000e-004
4.5800e-003
4.5800e-003
4.5800e-003
4.5800e-003
0.0000 65.6631 65.6631 1.2600e-003
1.2000e-003
66.0533
Parking Lot 0 0.0000 0.0000 0.0000 0.0000 0.0000 0.0000 0.0000 0.0000 0.0000 0.0000 0.0000 0.0000 0.0000 0.0000
Regional Shopping Center
166500 9.0000e-004
8.1600e-003
6.8600e-003
5.0000e-005
6.2000e-004
6.2000e-004
6.2000e-004
6.2000e-004
0.0000 8.8851 8.8851 1.7000e-004
1.6000e-004
8.9379
Total 0.0211 0.1918 0.1611 1.1500e-003
0.0146 0.0146 0.0146 0.0146 0.0000 208.7815 208.7815 4.0000e-003
3.8200e-003
210.0222
Unmitigated
CalEEMod Version: CalEEMod.2016.3.2 Date: 2/1/2019 9:41 AMPage 13 of 24
Victorville Retail (Operations) - San Bernardino-Mojave Desert County, Annual

5.2 Energy by Land Use - NaturalGas
NaturalGas Use
ROG NOx CO SO2 Fugitive PM10
Exhaust PM10
PM10 Total
Fugitive PM2.5
Exhaust PM2.5
PM2.5 Total Bio- CO2 NBio- CO2 Total CO2 CH4 N2O CO2e
Land Use kBTU/yr tons/yr MT/yr
Automobile Care Center
97470 5.3000e-004
4.7800e-003
4.0100e-003
3.0000e-005
3.6000e-004
3.6000e-004
3.6000e-004
3.6000e-004
0.0000 5.2014 5.2014 1.0000e-004
1.0000e-004
5.2323
Convenience Market With Gas
Pumps
11695 6.0000e-005
5.7000e-004
4.8000e-004
0.0000 4.0000e-005
4.0000e-005
4.0000e-005
4.0000e-005
0.0000 0.6241 0.6241 1.0000e-005
1.0000e-005
0.6278
Fast Food Restaurant with
Drive Thru
2.40627e+006
0.0130 0.1180 0.0991 7.1000e-004
8.9600e-003
8.9600e-003
8.9600e-003
8.9600e-003
0.0000 128.4078 128.4078 2.4600e-003
2.3500e-003
129.1709
High Turnover (Sit Down Restaurant)
1.23048e+006
6.6300e-003
0.0603 0.0507 3.6000e-004
4.5800e-003
4.5800e-003
4.5800e-003
4.5800e-003
0.0000 65.6631 65.6631 1.2600e-003
1.2000e-003
66.0533
Parking Lot 0 0.0000 0.0000 0.0000 0.0000 0.0000 0.0000 0.0000 0.0000 0.0000 0.0000 0.0000 0.0000 0.0000 0.0000
Regional Shopping Center
166500 9.0000e-004
8.1600e-003
6.8600e-003
5.0000e-005
6.2000e-004
6.2000e-004
6.2000e-004
6.2000e-004
0.0000 8.8851 8.8851 1.7000e-004
1.6000e-004
8.9379
Total 0.0211 0.1918 0.1611 1.1500e-003
0.0146 0.0146 0.0146 0.0146 0.0000 208.7815 208.7815 4.0000e-003
3.8200e-003
210.0222
Mitigated
CalEEMod Version: CalEEMod.2016.3.2 Date: 2/1/2019 9:41 AMPage 14 of 24
Victorville Retail (Operations) - San Bernardino-Mojave Desert County, Annual

5.3 Energy by Land Use - Electricity
Electricity Use
Total CO2 CH4 N2O CO2e
Land Use kWh/yr MT/yr
Automobile Care Center
30450 9.7020 4.0000e-004
8.0000e-005
9.7367
Convenience Market With Gas
Pumps
66534.8 21.1994 8.8000e-004
1.8000e-004
21.2753
Fast Food Restaurant with
Drive Thru
417824 133.1277 5.5000e-003
1.1400e-003
133.6040
High Turnover (Sit Down Restaurant)
213660 68.0767 2.8100e-003
5.8000e-004
68.3202
Parking Lot 68320 21.7682 9.0000e-004
1.9000e-004
21.8461
Regional Shopping Center
947250 301.8141 0.0125 2.5800e-003
302.8939
Total 555.6881 0.0230 4.7500e-003
557.6761
Unmitigated
CalEEMod Version: CalEEMod.2016.3.2 Date: 2/1/2019 9:41 AMPage 15 of 24
Victorville Retail (Operations) - San Bernardino-Mojave Desert County, Annual

6.1 Mitigation Measures Area
6.0 Area Detail
5.3 Energy by Land Use - Electricity
Electricity Use
Total CO2 CH4 N2O CO2e
Land Use kWh/yr MT/yr
Automobile Care Center
30450 9.7020 4.0000e-004
8.0000e-005
9.7367
Convenience Market With Gas
Pumps
66534.8 21.1994 8.8000e-004
1.8000e-004
21.2753
Fast Food Restaurant with
Drive Thru
417824 133.1277 5.5000e-003
1.1400e-003
133.6040
High Turnover (Sit Down Restaurant)
213660 68.0767 2.8100e-003
5.8000e-004
68.3202
Parking Lot 68320 21.7682 9.0000e-004
1.9000e-004
21.8461
Regional Shopping Center
947250 301.8141 0.0125 2.5800e-003
302.8939
Total 555.6881 0.0230 4.7500e-003
557.6761
Mitigated
CalEEMod Version: CalEEMod.2016.3.2 Date: 2/1/2019 9:41 AMPage 16 of 24
Victorville Retail (Operations) - San Bernardino-Mojave Desert County, Annual

ROG NOx CO SO2 Fugitive PM10
Exhaust PM10
PM10 Total
Fugitive PM2.5
Exhaust PM2.5
PM2.5 Total
Bio- CO2 NBio- CO2 Total CO2 CH4 N2O CO2e
Category tons/yr MT/yr
Mitigated 0.5090 5.0000e-005
5.5200e-003
0.0000 2.0000e-005
2.0000e-005
2.0000e-005
2.0000e-005
0.0000 0.0106 0.0106 3.0000e-005
0.0000 0.0114
Unmitigated 0.5090 5.0000e-005
5.5200e-003
0.0000 2.0000e-005
2.0000e-005
2.0000e-005
2.0000e-005
0.0000 0.0106 0.0106 3.0000e-005
0.0000 0.0114
6.2 Area by SubCategory
ROG NOx CO SO2 Fugitive PM10
Exhaust PM10
PM10 Total
Fugitive PM2.5
Exhaust PM2.5
PM2.5 Total Bio- CO2 NBio- CO2 Total CO2 CH4 N2O CO2e
SubCategory tons/yr MT/yr
Architectural Coating
0.1187 0.0000 0.0000 0.0000 0.0000 0.0000 0.0000 0.0000 0.0000 0.0000 0.0000
Consumer Products
0.3898 0.0000 0.0000 0.0000 0.0000 0.0000 0.0000 0.0000 0.0000 0.0000 0.0000
Landscaping 5.2000e-004
5.0000e-005
5.5200e-003
0.0000 2.0000e-005
2.0000e-005
2.0000e-005
2.0000e-005
0.0000 0.0106 0.0106 3.0000e-005
0.0000 0.0114
Total 0.5090 5.0000e-005
5.5200e-003
0.0000 2.0000e-005
2.0000e-005
2.0000e-005
2.0000e-005
0.0000 0.0106 0.0106 3.0000e-005
0.0000 0.0114
Unmitigated
CalEEMod Version: CalEEMod.2016.3.2 Date: 2/1/2019 9:41 AMPage 17 of 24
Victorville Retail (Operations) - San Bernardino-Mojave Desert County, Annual
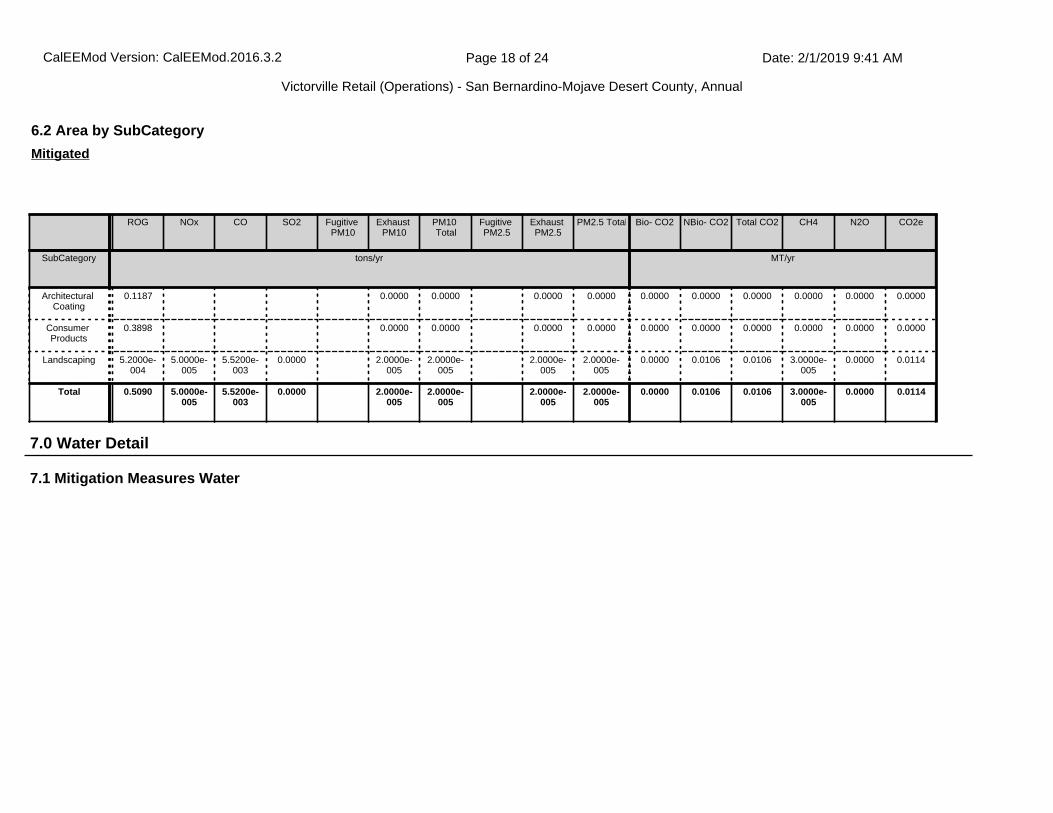
7.1 Mitigation Measures Water
7.0 Water Detail
6.2 Area by SubCategory
ROG NOx CO SO2 Fugitive PM10
Exhaust PM10
PM10 Total
Fugitive PM2.5
Exhaust PM2.5
PM2.5 Total Bio- CO2 NBio- CO2 Total CO2 CH4 N2O CO2e
SubCategory tons/yr MT/yr
Architectural Coating
0.1187 0.0000 0.0000 0.0000 0.0000 0.0000 0.0000 0.0000 0.0000 0.0000 0.0000
Consumer Products
0.3898 0.0000 0.0000 0.0000 0.0000 0.0000 0.0000 0.0000 0.0000 0.0000 0.0000
Landscaping 5.2000e-004
5.0000e-005
5.5200e-003
0.0000 2.0000e-005
2.0000e-005
2.0000e-005
2.0000e-005
0.0000 0.0106 0.0106 3.0000e-005
0.0000 0.0114
Total 0.5090 5.0000e-005
5.5200e-003
0.0000 2.0000e-005
2.0000e-005
2.0000e-005
2.0000e-005
0.0000 0.0106 0.0106 3.0000e-005
0.0000 0.0114
Mitigated
CalEEMod Version: CalEEMod.2016.3.2 Date: 2/1/2019 9:41 AMPage 18 of 24
Victorville Retail (Operations) - San Bernardino-Mojave Desert County, Annual

Total CO2 CH4 N2O CO2e
Category MT/yr
Mitigated 81.8706 0.4988 0.0124 98.0245
Unmitigated 81.8706 0.4988 0.0124 98.0245
CalEEMod Version: CalEEMod.2016.3.2 Date: 2/1/2019 9:41 AMPage 19 of 24
Victorville Retail (Operations) - San Bernardino-Mojave Desert County, Annual

7.2 Water by Land Use
Indoor/Outdoor Use
Total CO2 CH4 N2O CO2e
Land Use Mgal MT/yr
Automobile Care Center
5.45064 / 0.172988
24.9551 0.1786 4.3900e-003
30.7281
Convenience Market With Gas
Pumps
0.167315 / 0.102548
1.1102 5.5000e-003
1.4000e-004
1.2887
Fast Food Restaurant with
Drive Thru
2.6711 / 0.170496
12.5327 0.0875 2.1500e-003
15.3629
High Turnover (Sit Down Restaurant)
1.3659 / 0.0871852
6.4088 0.0448 1.1000e-003
7.8560
Parking Lot 0 / 0 0.0000 0.0000 0.0000 0.0000
Regional Shopping Center
5.55544 / 3.40495
36.8638 0.1825 4.5700e-003
42.7888
Total 81.8706 0.4988 0.0124 98.0245
Unmitigated
CalEEMod Version: CalEEMod.2016.3.2 Date: 2/1/2019 9:41 AMPage 20 of 24
Victorville Retail (Operations) - San Bernardino-Mojave Desert County, Annual

8.1 Mitigation Measures Waste
7.2 Water by Land Use
Indoor/Outdoor Use
Total CO2 CH4 N2O CO2e
Land Use Mgal MT/yr
Automobile Care Center
5.45064 / 0.172988
24.9551 0.1786 4.3900e-003
30.7281
Convenience Market With Gas
Pumps
0.167315 / 0.102548
1.1102 5.5000e-003
1.4000e-004
1.2887
Fast Food Restaurant with
Drive Thru
2.6711 / 0.170496
12.5327 0.0875 2.1500e-003
15.3629
High Turnover (Sit Down Restaurant)
1.3659 / 0.0871852
6.4088 0.0448 1.1000e-003
7.8560
Parking Lot 0 / 0 0.0000 0.0000 0.0000 0.0000
Regional Shopping Center
5.55544 / 3.40495
36.8638 0.1825 4.5700e-003
42.7888
Total 81.8706 0.4988 0.0124 98.0245
Mitigated
8.0 Waste Detail
CalEEMod Version: CalEEMod.2016.3.2 Date: 2/1/2019 9:41 AMPage 21 of 24
Victorville Retail (Operations) - San Bernardino-Mojave Desert County, Annual

Total CO2 CH4 N2O CO2e
MT/yr
Mitigated 49.7592 2.9407 0.0000 123.2763
Unmitigated 49.7592 2.9407 0.0000 123.2763
Category/Year
8.2 Waste by Land Use
Waste Disposed
Total CO2 CH4 N2O CO2e
Land Use tons MT/yr
Automobile Care Center
11.46 2.3263 0.1375 0.0000 5.7633
Fast Food Restaurant with
Drive Thru
101.37 20.5772 1.2161 0.0000 50.9791
High Turnover (Sit Down Restaurant)
53.55 10.8702 0.6424 0.0000 26.9304
Parking Lot 0 0.0000 0.0000 0.0000 0.0000
Regional Shopping Center
78.75 15.9855 0.9447 0.0000 39.6035
Total 49.7592 2.9407 0.0000 123.2763
Unmitigated
CalEEMod Version: CalEEMod.2016.3.2 Date: 2/1/2019 9:41 AMPage 22 of 24
Victorville Retail (Operations) - San Bernardino-Mojave Desert County, Annual

8.2 Waste by Land Use
Waste Disposed
Total CO2 CH4 N2O CO2e
Land Use tons MT/yr
Automobile Care Center
11.46 2.3263 0.1375 0.0000 5.7633
Fast Food Restaurant with
Drive Thru
101.37 20.5772 1.2161 0.0000 50.9791
High Turnover (Sit Down Restaurant)
53.55 10.8702 0.6424 0.0000 26.9304
Parking Lot 0 0.0000 0.0000 0.0000 0.0000
Regional Shopping Center
78.75 15.9855 0.9447 0.0000 39.6035
Total 49.7592 2.9407 0.0000 123.2763
Mitigated
9.0 Operational Offroad
Equipment Type Number Hours/Day Days/Year Horse Power Load Factor Fuel Type
10.0 Stationary Equipment
Fire Pumps and Emergency Generators
Equipment Type Number Hours/Day Hours/Year Horse Power Load Factor Fuel Type
Boilers
Equipment Type Number Heat Input/Day Heat Input/Year Boiler Rating Fuel Type
CalEEMod Version: CalEEMod.2016.3.2 Date: 2/1/2019 9:41 AMPage 23 of 24
Victorville Retail (Operations) - San Bernardino-Mojave Desert County, Annual
11.0 Vegetation
User Defined Equipment
Equipment Type Number
CalEEMod Version: CalEEMod.2016.3.2 Date: 2/1/2019 9:41 AMPage 24 of 24
Victorville Retail (Operations) - San Bernardino-Mojave Desert County, Annual

1.1 Land Usage
Land Uses Size Metric Lot Acreage Floor Surface Area Population
Regional Shopping Center 75.00 1000sqft 6.38 75,000.00 0
Fast Food Restaurant with Drive Thru 8.80 1000sqft 2.20 8,800.00 0
High Turnover (Sit Down Restaurant) 4.50 1000sqft 1.10 4,500.00 0
Automobile Care Center 3.00 1000sqft 0.77 3,000.00 0
Convenience Market With Gas Pumps 16.00 Pump 0.55 5,268.00 0
Parking Lot 488.00 Space 4.39 195,200.00 0
1.2 Other Project Characteristics
Urbanization
Climate Zone
Urban
10
Wind Speed (m/s) Precipitation Freq (Days)2.6 32
1.3 User Entered Comments & Non-Default Data
1.0 Project Characteristics
Utility Company Southern California Edison
2019Operational Year
CO2 Intensity (lb/MWhr)
702.44 0.029CH4 Intensity (lb/MWhr)
0.006N2O Intensity (lb/MWhr)
Victorville Retail (Construction - Unmitigated)San Bernardino-Mojave Desert County, Annual
CalEEMod Version: CalEEMod.2016.3.2 Date: 1/7/2019 4:58 PMPage 1 of 38
Victorville Retail (Construction - Unmitigated) - San Bernardino-Mojave Desert County, Annual

Project Characteristics -
Land Use - Total Project area as per the Site Plan is 10.03 acres.
Construction Phase - Construction Schedule adjusted to meet the 2019 Opening Year.
Off-road Equipment - Hours are based on an 8-hour workday.
Off-road Equipment -
Off-road Equipment - Hours are based on an 8-hour workday.
Grading - Total acres graded adjusted.
Architectural Coating - Rule 1113
Vehicle Trips - Construction Run Only.
Energy Use - Construction Run Only.
Water And Wastewater - Construction Run Only.
Solid Waste - Construction Run Only.
Construction Off-road Equipment Mitigation -
Table Name Column Name Default Value New Value
tblArchitecturalCoating EF_Nonresidential_Exterior 250.00 50.00
tblArchitecturalCoating EF_Nonresidential_Interior 250.00 50.00
tblArchitecturalCoating EF_Parking 250.00 50.00
tblConstructionPhase NumDays 300.00 100.00
tblConstructionPhase PhaseEndDate 10/9/2020 12/6/2019
tblConstructionPhase PhaseEndDate 8/14/2020 10/11/2019
tblConstructionPhase PhaseEndDate 6/21/2019 5/24/2019
tblConstructionPhase PhaseEndDate 9/11/2020 11/8/2019
tblConstructionPhase PhaseEndDate 5/10/2019 4/12/2019
tblConstructionPhase PhaseStartDate 9/12/2020 11/9/2019
tblConstructionPhase PhaseStartDate 6/22/2019 5/25/2019
tblConstructionPhase PhaseStartDate 5/11/2019 4/13/2019
CalEEMod Version: CalEEMod.2016.3.2 Date: 1/7/2019 4:58 PMPage 2 of 38
Victorville Retail (Construction - Unmitigated) - San Bernardino-Mojave Desert County, Annual

tblConstructionPhase PhaseStartDate 8/15/2020 10/12/2019
tblConstructionPhase PhaseStartDate 4/27/2019 4/1/2019
tblEnergyUse LightingElect 2.93 0.00
tblEnergyUse LightingElect 5.61 0.00
tblEnergyUse LightingElect 6.62 0.00
tblEnergyUse LightingElect 6.62 0.00
tblEnergyUse LightingElect 0.35 0.00
tblEnergyUse LightingElect 5.61 0.00
tblEnergyUse NT24E 5.02 0.00
tblEnergyUse NT24E 2.44 0.00
tblEnergyUse NT24E 28.48 0.00
tblEnergyUse NT24E 28.48 0.00
tblEnergyUse NT24E 2.44 0.00
tblEnergyUse NT24NG 17.13 0.00
tblEnergyUse NT24NG 0.30 0.00
tblEnergyUse NT24NG 195.77 0.00
tblEnergyUse NT24NG 195.77 0.00
tblEnergyUse NT24NG 0.30 0.00
tblEnergyUse T24E 2.20 0.00
tblEnergyUse T24E 4.58 0.00
tblEnergyUse T24E 12.38 0.00
tblEnergyUse T24E 12.38 0.00
tblEnergyUse T24E 4.58 0.00
tblEnergyUse T24NG 15.36 0.00
tblEnergyUse T24NG 1.92 0.00
tblEnergyUse T24NG 77.67 0.00
tblEnergyUse T24NG 77.67 0.00
CalEEMod Version: CalEEMod.2016.3.2 Date: 1/7/2019 4:58 PMPage 3 of 38
Victorville Retail (Construction - Unmitigated) - San Bernardino-Mojave Desert County, Annual

tblEnergyUse T24NG 1.92 0.00
tblGrading AcresOfGrading 75.00 5.00
tblGrading MaterialExported 0.00 14,000.00
tblLandUse LandUseSquareFeet 2,258.80 5,268.00
tblLandUse LotAcreage 1.72 6.38
tblLandUse LotAcreage 0.20 2.20
tblLandUse LotAcreage 0.10 1.10
tblLandUse LotAcreage 0.07 0.77
tblLandUse LotAcreage 0.05 0.55
tblOffRoadEquipment UsageHours 6.00 8.00
tblOffRoadEquipment UsageHours 7.00 8.00
tblOffRoadEquipment UsageHours 7.00 8.00
tblSolidWaste SolidWasteGenerationRate 11.46 0.00
tblSolidWaste SolidWasteGenerationRate 101.37 0.00
tblSolidWaste SolidWasteGenerationRate 53.55 0.00
tblSolidWaste SolidWasteGenerationRate 78.75 0.00
tblVehicleTrips CC_TL 7.30 0.00
tblVehicleTrips CC_TL 7.30 0.00
tblVehicleTrips CC_TL 7.30 0.00
tblVehicleTrips CC_TL 7.30 0.00
tblVehicleTrips CC_TL 7.30 0.00
tblVehicleTrips CC_TL 7.30 0.00
tblVehicleTrips CC_TTP 48.00 0.00
tblVehicleTrips CC_TTP 80.20 0.00
tblVehicleTrips CC_TTP 78.80 0.00
tblVehicleTrips CC_TTP 72.50 0.00
tblVehicleTrips CC_TTP 64.70 0.00
CalEEMod Version: CalEEMod.2016.3.2 Date: 1/7/2019 4:58 PMPage 4 of 38
Victorville Retail (Construction - Unmitigated) - San Bernardino-Mojave Desert County, Annual

tblVehicleTrips CNW_TL 7.30 0.00
tblVehicleTrips CNW_TL 7.30 0.00
tblVehicleTrips CNW_TL 7.30 0.00
tblVehicleTrips CNW_TL 7.30 0.00
tblVehicleTrips CNW_TL 7.30 0.00
tblVehicleTrips CNW_TL 7.30 0.00
tblVehicleTrips CNW_TTP 19.00 0.00
tblVehicleTrips CNW_TTP 19.00 0.00
tblVehicleTrips CNW_TTP 19.00 0.00
tblVehicleTrips CNW_TTP 19.00 0.00
tblVehicleTrips CNW_TTP 19.00 0.00
tblVehicleTrips CW_TL 9.50 0.00
tblVehicleTrips CW_TL 9.50 0.00
tblVehicleTrips CW_TL 9.50 0.00
tblVehicleTrips CW_TL 9.50 0.00
tblVehicleTrips CW_TL 9.50 0.00
tblVehicleTrips CW_TL 9.50 0.00
tblVehicleTrips CW_TTP 33.00 0.00
tblVehicleTrips CW_TTP 0.80 0.00
tblVehicleTrips CW_TTP 2.20 0.00
tblVehicleTrips CW_TTP 8.50 0.00
tblVehicleTrips CW_TTP 16.30 0.00
tblVehicleTrips DV_TP 51.00 0.00
tblVehicleTrips DV_TP 21.00 0.00
tblVehicleTrips DV_TP 21.00 0.00
tblVehicleTrips DV_TP 20.00 0.00
tblVehicleTrips DV_TP 35.00 0.00
CalEEMod Version: CalEEMod.2016.3.2 Date: 1/7/2019 4:58 PMPage 5 of 38
Victorville Retail (Construction - Unmitigated) - San Bernardino-Mojave Desert County, Annual

tblVehicleTrips PB_TP 28.00 0.00
tblVehicleTrips PB_TP 65.00 0.00
tblVehicleTrips PB_TP 50.00 0.00
tblVehicleTrips PB_TP 43.00 0.00
tblVehicleTrips PB_TP 11.00 0.00
tblVehicleTrips PR_TP 21.00 0.00
tblVehicleTrips PR_TP 14.00 0.00
tblVehicleTrips PR_TP 29.00 0.00
tblVehicleTrips PR_TP 37.00 0.00
tblVehicleTrips PR_TP 54.00 0.00
tblVehicleTrips ST_TR 23.72 0.00
tblVehicleTrips ST_TR 204.47 0.00
tblVehicleTrips ST_TR 722.03 0.00
tblVehicleTrips ST_TR 158.37 0.00
tblVehicleTrips ST_TR 49.97 0.00
tblVehicleTrips SU_TR 11.88 0.00
tblVehicleTrips SU_TR 166.88 0.00
tblVehicleTrips SU_TR 542.72 0.00
tblVehicleTrips SU_TR 131.84 0.00
tblVehicleTrips SU_TR 25.24 0.00
tblVehicleTrips WD_TR 23.72 0.00
tblVehicleTrips WD_TR 542.60 0.00
tblVehicleTrips WD_TR 496.12 0.00
tblVehicleTrips WD_TR 127.15 0.00
tblVehicleTrips WD_TR 42.70 0.00
tblWater IndoorWaterUseRate 282,243.32 0.00
tblWater IndoorWaterUseRate 167,314.87 0.00
CalEEMod Version: CalEEMod.2016.3.2 Date: 1/7/2019 4:58 PMPage 6 of 38
Victorville Retail (Construction - Unmitigated) - San Bernardino-Mojave Desert County, Annual

2.0 Emissions Summary
tblWater IndoorWaterUseRate 2,671,096.67 0.00
tblWater IndoorWaterUseRate 1,365,901.71 0.00
tblWater IndoorWaterUseRate 5,555,439.11 0.00
tblWater OutdoorWaterUseRate 172,987.84 0.00
tblWater OutdoorWaterUseRate 102,547.82 0.00
tblWater OutdoorWaterUseRate 170,495.53 0.00
tblWater OutdoorWaterUseRate 87,185.22 0.00
tblWater OutdoorWaterUseRate 3,404,946.55 0.00
CalEEMod Version: CalEEMod.2016.3.2 Date: 1/7/2019 4:58 PMPage 7 of 38
Victorville Retail (Construction - Unmitigated) - San Bernardino-Mojave Desert County, Annual

2.1 Overall Construction
ROG NOx CO SO2 Fugitive PM10
Exhaust PM10
PM10 Total
Fugitive PM2.5
Exhaust PM2.5
PM2.5 Total
Bio- CO2 NBio- CO2 Total CO2 CH4 N2O CO2e
Year tons/yr MT/yr
2019 0.5223 2.9032 2.0108 4.7000e-003
0.2675 0.1297 0.3972 0.1224 0.1208 0.2432 0.0000 427.2890 427.2890 0.0798 0.0000 429.2838
Maximum 0.5223 2.9032 2.0108 4.7000e-003
0.2675 0.1297 0.3972 0.1224 0.1208 0.2432 0.0000 427.2890 427.2890 0.0798 0.0000 429.2838
Unmitigated Construction
ROG NOx CO SO2 Fugitive PM10
Exhaust PM10
PM10 Total
Fugitive PM2.5
Exhaust PM2.5
PM2.5 Total
Bio- CO2 NBio- CO2 Total CO2 CH4 N2O CO2e
Year tons/yr MT/yr
2019 0.5223 2.9032 2.0108 4.7000e-003
0.1551 0.1297 0.2847 0.0615 0.1208 0.1823 0.0000 427.2887 427.2887 0.0798 0.0000 429.2835
Maximum 0.5223 2.9032 2.0108 4.7000e-003
0.1551 0.1297 0.2847 0.0615 0.1208 0.1823 0.0000 427.2887 427.2887 0.0798 0.0000 429.2835
Mitigated Construction
ROG NOx CO SO2 Fugitive PM10
Exhaust PM10
PM10 Total
Fugitive PM2.5
Exhaust PM2.5
PM2.5 Total
Bio- CO2 NBio-CO2 Total CO2 CH4 N20 CO2e
Percent Reduction
0.00 0.00 0.00 0.00 42.03 0.00 28.31 49.73 0.00 25.02 0.00 0.00 0.00 0.00 0.00 0.00
CalEEMod Version: CalEEMod.2016.3.2 Date: 1/7/2019 4:58 PMPage 8 of 38
Victorville Retail (Construction - Unmitigated) - San Bernardino-Mojave Desert County, Annual

2.2 Overall Operational
ROG NOx CO SO2 Fugitive PM10
Exhaust PM10
PM10 Total
Fugitive PM2.5
Exhaust PM2.5
PM2.5 Total
Bio- CO2 NBio- CO2 Total CO2 CH4 N2O CO2e
Category tons/yr MT/yr
Area 0.5090 5.0000e-005
5.5200e-003
0.0000 2.0000e-005
2.0000e-005
2.0000e-005
2.0000e-005
0.0000 0.0106 0.0106 3.0000e-005
0.0000 0.0114
Energy 0.0000 0.0000 0.0000 0.0000 0.0000 0.0000 0.0000 0.0000 0.0000 0.0000 0.0000 0.0000 0.0000 0.0000
Mobile 0.0000 0.0000 0.0000 0.0000 0.0000 0.0000 0.0000 0.0000 0.0000 0.0000 0.0000 0.0000 0.0000 0.0000 0.0000 0.0000
Waste 0.0000 0.0000 0.0000 0.0000 0.0000 0.0000 0.0000 0.0000 0.0000 0.0000
Water 0.0000 0.0000 0.0000 0.0000 0.0000 0.0000 0.0000 0.0000 0.0000 0.0000
Total 0.5090 5.0000e-005
5.5200e-003
0.0000 0.0000 2.0000e-005
2.0000e-005
0.0000 2.0000e-005
2.0000e-005
0.0000 0.0106 0.0106 3.0000e-005
0.0000 0.0114
Unmitigated Operational
Quarter Start Date End Date Maximum Unmitigated ROG + NOX (tons/quarter) Maximum Mitigated ROG + NOX (tons/quarter)
1 4-1-2019 6-30-2019 1.7646 1.7646
2 7-1-2019 9-30-2019 1.0492 1.0492
Highest 1.7646 1.7646
CalEEMod Version: CalEEMod.2016.3.2 Date: 1/7/2019 4:58 PMPage 9 of 38
Victorville Retail (Construction - Unmitigated) - San Bernardino-Mojave Desert County, Annual

2.2 Overall Operational
ROG NOx CO SO2 Fugitive PM10
Exhaust PM10
PM10 Total
Fugitive PM2.5
Exhaust PM2.5
PM2.5 Total
Bio- CO2 NBio- CO2 Total CO2 CH4 N2O CO2e
Category tons/yr MT/yr
Area 0.5090 5.0000e-005
5.5200e-003
0.0000 2.0000e-005
2.0000e-005
2.0000e-005
2.0000e-005
0.0000 0.0106 0.0106 3.0000e-005
0.0000 0.0114
Energy 0.0000 0.0000 0.0000 0.0000 0.0000 0.0000 0.0000 0.0000 0.0000 0.0000 0.0000 0.0000 0.0000 0.0000
Mobile 0.0000 0.0000 0.0000 0.0000 0.0000 0.0000 0.0000 0.0000 0.0000 0.0000 0.0000 0.0000 0.0000 0.0000 0.0000 0.0000
Waste 0.0000 0.0000 0.0000 0.0000 0.0000 0.0000 0.0000 0.0000 0.0000 0.0000
Water 0.0000 0.0000 0.0000 0.0000 0.0000 0.0000 0.0000 0.0000 0.0000 0.0000
Total 0.5090 5.0000e-005
5.5200e-003
0.0000 0.0000 2.0000e-005
2.0000e-005
0.0000 2.0000e-005
2.0000e-005
0.0000 0.0106 0.0106 3.0000e-005
0.0000 0.0114
Mitigated Operational
3.0 Construction Detail
Construction Phase
ROG NOx CO SO2 Fugitive PM10
Exhaust PM10
PM10 Total
Fugitive PM2.5
Exhaust PM2.5
PM2.5 Total
Bio- CO2 NBio-CO2 Total CO2 CH4 N20 CO2e
Percent Reduction
0.00 0.00 0.00 0.00 0.00 0.00 0.00 0.00 0.00 0.00 0.00 0.00 0.00 0.00 0.00 0.00
CalEEMod Version: CalEEMod.2016.3.2 Date: 1/7/2019 4:58 PMPage 10 of 38
Victorville Retail (Construction - Unmitigated) - San Bernardino-Mojave Desert County, Annual

Phase Number
Phase Name Phase Type Start Date End Date Num Days Week
Num Days Phase Description
1 Site Preparation Site Preparation 4/1/2019 4/12/2019 5 10
2 Grading Grading 4/13/2019 5/24/2019 5 30
3 Building Construction Building Construction 5/25/2019 10/11/2019 5 100
4 Paving Paving 10/12/2019 11/8/2019 5 20
5 Architectural Coating Architectural Coating 11/9/2019 12/6/2019 5 20
OffRoad Equipment
Residential Indoor: 0; Residential Outdoor: 0; Non-Residential Indoor: 144,852; Non-Residential Outdoor: 48,284; Striped Parking Area: 11,712 (Architectural Coating – sqft)
Acres of Grading (Site Preparation Phase): 0
Acres of Grading (Grading Phase): 5
Acres of Paving: 4.39
CalEEMod Version: CalEEMod.2016.3.2 Date: 1/7/2019 4:58 PMPage 11 of 38
Victorville Retail (Construction - Unmitigated) - San Bernardino-Mojave Desert County, Annual

Phase Name Offroad Equipment Type Amount Usage Hours Horse Power Load Factor
Architectural Coating Air Compressors 1 8.00 78 0.48
Grading Excavators 2 8.00 158 0.38
Building Construction Cranes 1 8.00 231 0.29
Building Construction Forklifts 3 8.00 89 0.20
Building Construction Generator Sets 1 8.00 84 0.74
Paving Pavers 2 8.00 130 0.42
Paving Rollers 2 8.00 80 0.38
Grading Rubber Tired Dozers 1 8.00 247 0.40
Building Construction Tractors/Loaders/Backhoes 3 8.00 97 0.37
Grading Graders 1 8.00 187 0.41
Grading Tractors/Loaders/Backhoes 2 8.00 97 0.37
Paving Paving Equipment 2 8.00 132 0.36
Site Preparation Tractors/Loaders/Backhoes 4 8.00 97 0.37
Site Preparation Rubber Tired Dozers 3 8.00 247 0.40
Grading Scrapers 2 8.00 367 0.48
Building Construction Welders 1 8.00 46 0.45
Trips and VMT
Phase Name Offroad Equipment Count
Worker Trip Number
Vendor Trip Number
Hauling Trip Number
Worker Trip Length
Vendor Trip Length
Hauling Trip Length
Worker Vehicle Class
Vendor Vehicle Class
Hauling Vehicle Class
Site Preparation 7 18.00 0.00 0.00 10.80 7.30 20.00 LD_Mix HDT_Mix HHDT
Grading 8 20.00 0.00 1,750.00 10.80 7.30 20.00 LD_Mix HDT_Mix HHDT
Building Construction 9 114.00 48.00 0.00 10.80 7.30 20.00 LD_Mix HDT_Mix HHDT
Paving 6 15.00 0.00 0.00 10.80 7.30 20.00 LD_Mix HDT_Mix HHDT
Architectural Coating 1 23.00 0.00 0.00 10.80 7.30 20.00 LD_Mix HDT_Mix HHDT
CalEEMod Version: CalEEMod.2016.3.2 Date: 1/7/2019 4:58 PMPage 12 of 38
Victorville Retail (Construction - Unmitigated) - San Bernardino-Mojave Desert County, Annual

3.2 Site Preparation - 2019
ROG NOx CO SO2 Fugitive PM10
Exhaust PM10
PM10 Total
Fugitive PM2.5
Exhaust PM2.5
PM2.5 Total
Bio- CO2 NBio- CO2 Total CO2 CH4 N2O CO2e
Category tons/yr MT/yr
Fugitive Dust 0.0903 0.0000 0.0903 0.0497 0.0000 0.0497 0.0000 0.0000 0.0000 0.0000 0.0000 0.0000
Off-Road 0.0217 0.2279 0.1103 1.9000e-004
0.0120 0.0120 0.0110 0.0110 0.0000 17.0843 17.0843 5.4100e-003
0.0000 17.2195
Total 0.0217 0.2279 0.1103 1.9000e-004
0.0903 0.0120 0.1023 0.0497 0.0110 0.0607 0.0000 17.0843 17.0843 5.4100e-003
0.0000 17.2195
Unmitigated Construction On-Site
3.1 Mitigation Measures Construction
Water Exposed Area
CalEEMod Version: CalEEMod.2016.3.2 Date: 1/7/2019 4:58 PMPage 13 of 38
Victorville Retail (Construction - Unmitigated) - San Bernardino-Mojave Desert County, Annual

3.2 Site Preparation - 2019
ROG NOx CO SO2 Fugitive PM10
Exhaust PM10
PM10 Total
Fugitive PM2.5
Exhaust PM2.5
PM2.5 Total
Bio- CO2 NBio- CO2 Total CO2 CH4 N2O CO2e
Category tons/yr MT/yr
Hauling 0.0000 0.0000 0.0000 0.0000 0.0000 0.0000 0.0000 0.0000 0.0000 0.0000 0.0000 0.0000 0.0000 0.0000 0.0000 0.0000
Vendor 0.0000 0.0000 0.0000 0.0000 0.0000 0.0000 0.0000 0.0000 0.0000 0.0000 0.0000 0.0000 0.0000 0.0000 0.0000 0.0000
Worker 3.9000e-004
3.0000e-004
2.9900e-003
1.0000e-005
7.3000e-004
1.0000e-005
7.3000e-004
1.9000e-004
0.0000 2.0000e-004
0.0000 0.6464 0.6464 2.0000e-005
0.0000 0.6470
Total 3.9000e-004
3.0000e-004
2.9900e-003
1.0000e-005
7.3000e-004
1.0000e-005
7.3000e-004
1.9000e-004
0.0000 2.0000e-004
0.0000 0.6464 0.6464 2.0000e-005
0.0000 0.6470
Unmitigated Construction Off-Site
ROG NOx CO SO2 Fugitive PM10
Exhaust PM10
PM10 Total
Fugitive PM2.5
Exhaust PM2.5
PM2.5 Total
Bio- CO2 NBio- CO2 Total CO2 CH4 N2O CO2e
Category tons/yr MT/yr
Fugitive Dust 0.0352 0.0000 0.0352 0.0194 0.0000 0.0194 0.0000 0.0000 0.0000 0.0000 0.0000 0.0000
Off-Road 0.0217 0.2279 0.1103 1.9000e-004
0.0120 0.0120 0.0110 0.0110 0.0000 17.0843 17.0843 5.4100e-003
0.0000 17.2195
Total 0.0217 0.2279 0.1103 1.9000e-004
0.0352 0.0120 0.0472 0.0194 0.0110 0.0304 0.0000 17.0843 17.0843 5.4100e-003
0.0000 17.2195
Mitigated Construction On-Site
CalEEMod Version: CalEEMod.2016.3.2 Date: 1/7/2019 4:58 PMPage 14 of 38
Victorville Retail (Construction - Unmitigated) - San Bernardino-Mojave Desert County, Annual

3.2 Site Preparation - 2019
ROG NOx CO SO2 Fugitive PM10
Exhaust PM10
PM10 Total
Fugitive PM2.5
Exhaust PM2.5
PM2.5 Total
Bio- CO2 NBio- CO2 Total CO2 CH4 N2O CO2e
Category tons/yr MT/yr
Hauling 0.0000 0.0000 0.0000 0.0000 0.0000 0.0000 0.0000 0.0000 0.0000 0.0000 0.0000 0.0000 0.0000 0.0000 0.0000 0.0000
Vendor 0.0000 0.0000 0.0000 0.0000 0.0000 0.0000 0.0000 0.0000 0.0000 0.0000 0.0000 0.0000 0.0000 0.0000 0.0000 0.0000
Worker 3.9000e-004
3.0000e-004
2.9900e-003
1.0000e-005
7.3000e-004
1.0000e-005
7.3000e-004
1.9000e-004
0.0000 2.0000e-004
0.0000 0.6464 0.6464 2.0000e-005
0.0000 0.6470
Total 3.9000e-004
3.0000e-004
2.9900e-003
1.0000e-005
7.3000e-004
1.0000e-005
7.3000e-004
1.9000e-004
0.0000 2.0000e-004
0.0000 0.6464 0.6464 2.0000e-005
0.0000 0.6470
Mitigated Construction Off-Site
3.3 Grading - 2019
ROG NOx CO SO2 Fugitive PM10
Exhaust PM10
PM10 Total
Fugitive PM2.5
Exhaust PM2.5
PM2.5 Total
Bio- CO2 NBio- CO2 Total CO2 CH4 N2O CO2e
Category tons/yr MT/yr
Fugitive Dust 0.0940 0.0000 0.0940 0.0501 0.0000 0.0501 0.0000 0.0000 0.0000 0.0000 0.0000 0.0000
Off-Road 0.0711 0.8178 0.5007 9.3000e-004
0.0357 0.0357 0.0329 0.0329 0.0000 83.5520 83.5520 0.0264 0.0000 84.2129
Total 0.0711 0.8178 0.5007 9.3000e-004
0.0940 0.0357 0.1297 0.0501 0.0329 0.0830 0.0000 83.5520 83.5520 0.0264 0.0000 84.2129
Unmitigated Construction On-Site
CalEEMod Version: CalEEMod.2016.3.2 Date: 1/7/2019 4:58 PMPage 15 of 38
Victorville Retail (Construction - Unmitigated) - San Bernardino-Mojave Desert County, Annual

3.3 Grading - 2019
ROG NOx CO SO2 Fugitive PM10
Exhaust PM10
PM10 Total
Fugitive PM2.5
Exhaust PM2.5
PM2.5 Total
Bio- CO2 NBio- CO2 Total CO2 CH4 N2O CO2e
Category tons/yr MT/yr
Hauling 5.9700e-003
0.2372 0.0356 6.9000e-004
0.0151 7.8000e-004
0.0158 4.1400e-003
7.5000e-004
4.8800e-003
0.0000 66.0538 66.0538 3.8100e-003
0.0000 66.1490
Vendor 0.0000 0.0000 0.0000 0.0000 0.0000 0.0000 0.0000 0.0000 0.0000 0.0000 0.0000 0.0000 0.0000 0.0000 0.0000 0.0000
Worker 1.2900e-003
1.0000e-003
9.9800e-003
2.0000e-005
2.4200e-003
2.0000e-005
2.4300e-003
6.4000e-004
2.0000e-005
6.6000e-004
0.0000 2.1548 2.1548 7.0000e-005
0.0000 2.1566
Total 7.2600e-003
0.2382 0.0456 7.1000e-004
0.0175 8.0000e-004
0.0183 4.7800e-003
7.7000e-004
5.5400e-003
0.0000 68.2086 68.2086 3.8800e-003
0.0000 68.3056
Unmitigated Construction Off-Site
ROG NOx CO SO2 Fugitive PM10
Exhaust PM10
PM10 Total
Fugitive PM2.5
Exhaust PM2.5
PM2.5 Total
Bio- CO2 NBio- CO2 Total CO2 CH4 N2O CO2e
Category tons/yr MT/yr
Fugitive Dust 0.0367 0.0000 0.0367 0.0195 0.0000 0.0195 0.0000 0.0000 0.0000 0.0000 0.0000 0.0000
Off-Road 0.0711 0.8178 0.5007 9.3000e-004
0.0357 0.0357 0.0329 0.0329 0.0000 83.5519 83.5519 0.0264 0.0000 84.2128
Total 0.0711 0.8178 0.5007 9.3000e-004
0.0367 0.0357 0.0724 0.0195 0.0329 0.0524 0.0000 83.5519 83.5519 0.0264 0.0000 84.2128
Mitigated Construction On-Site
CalEEMod Version: CalEEMod.2016.3.2 Date: 1/7/2019 4:58 PMPage 16 of 38
Victorville Retail (Construction - Unmitigated) - San Bernardino-Mojave Desert County, Annual

3.3 Grading - 2019
ROG NOx CO SO2 Fugitive PM10
Exhaust PM10
PM10 Total
Fugitive PM2.5
Exhaust PM2.5
PM2.5 Total
Bio- CO2 NBio- CO2 Total CO2 CH4 N2O CO2e
Category tons/yr MT/yr
Hauling 5.9700e-003
0.2372 0.0356 6.9000e-004
0.0151 7.8000e-004
0.0158 4.1400e-003
7.5000e-004
4.8800e-003
0.0000 66.0538 66.0538 3.8100e-003
0.0000 66.1490
Vendor 0.0000 0.0000 0.0000 0.0000 0.0000 0.0000 0.0000 0.0000 0.0000 0.0000 0.0000 0.0000 0.0000 0.0000 0.0000 0.0000
Worker 1.2900e-003
1.0000e-003
9.9800e-003
2.0000e-005
2.4200e-003
2.0000e-005
2.4300e-003
6.4000e-004
2.0000e-005
6.6000e-004
0.0000 2.1548 2.1548 7.0000e-005
0.0000 2.1566
Total 7.2600e-003
0.2382 0.0456 7.1000e-004
0.0175 8.0000e-004
0.0183 4.7800e-003
7.7000e-004
5.5400e-003
0.0000 68.2086 68.2086 3.8800e-003
0.0000 68.3056
Mitigated Construction Off-Site
3.4 Building Construction - 2019
ROG NOx CO SO2 Fugitive PM10
Exhaust PM10
PM10 Total
Fugitive PM2.5
Exhaust PM2.5
PM2.5 Total
Bio- CO2 NBio- CO2 Total CO2 CH4 N2O CO2e
Category tons/yr MT/yr
Off-Road 0.1256 1.1353 0.9157 1.4400e-003
0.0690 0.0690 0.0648 0.0648 0.0000 126.0220 126.0220 0.0313 0.0000 126.8049
Total 0.1256 1.1353 0.9157 1.4400e-003
0.0690 0.0690 0.0648 0.0648 0.0000 126.0220 126.0220 0.0313 0.0000 126.8049
Unmitigated Construction On-Site
CalEEMod Version: CalEEMod.2016.3.2 Date: 1/7/2019 4:58 PMPage 17 of 38
Victorville Retail (Construction - Unmitigated) - San Bernardino-Mojave Desert County, Annual

3.4 Building Construction - 2019
ROG NOx CO SO2 Fugitive PM10
Exhaust PM10
PM10 Total
Fugitive PM2.5
Exhaust PM2.5
PM2.5 Total
Bio- CO2 NBio- CO2 Total CO2 CH4 N2O CO2e
Category tons/yr MT/yr
Hauling 0.0000 0.0000 0.0000 0.0000 0.0000 0.0000 0.0000 0.0000 0.0000 0.0000 0.0000 0.0000 0.0000 0.0000 0.0000 0.0000
Vendor 9.0300e-003
0.2866 0.0621 6.7000e-004
0.0160 1.8300e-003
0.0178 4.6200e-003
1.7500e-003
6.3700e-003
0.0000 64.2264 64.2264 4.4800e-003
0.0000 64.3385
Worker 0.0244 0.0190 0.1897 4.5000e-004
0.0459 3.3000e-004
0.0463 0.0122 3.0000e-004
0.0125 0.0000 40.9404 40.9404 1.3900e-003
0.0000 40.9751
Total 0.0335 0.3055 0.2517 1.1200e-003
0.0619 2.1600e-003
0.0641 0.0168 2.0500e-003
0.0189 0.0000 105.1668 105.1668 5.8700e-003
0.0000 105.3136
Unmitigated Construction Off-Site
ROG NOx CO SO2 Fugitive PM10
Exhaust PM10
PM10 Total
Fugitive PM2.5
Exhaust PM2.5
PM2.5 Total
Bio- CO2 NBio- CO2 Total CO2 CH4 N2O CO2e
Category tons/yr MT/yr
Off-Road 0.1256 1.1353 0.9157 1.4400e-003
0.0690 0.0690 0.0648 0.0648 0.0000 126.0219 126.0219 0.0313 0.0000 126.8048
Total 0.1256 1.1353 0.9157 1.4400e-003
0.0690 0.0690 0.0648 0.0648 0.0000 126.0219 126.0219 0.0313 0.0000 126.8048
Mitigated Construction On-Site
CalEEMod Version: CalEEMod.2016.3.2 Date: 1/7/2019 4:58 PMPage 18 of 38
Victorville Retail (Construction - Unmitigated) - San Bernardino-Mojave Desert County, Annual

3.4 Building Construction - 2019
ROG NOx CO SO2 Fugitive PM10
Exhaust PM10
PM10 Total
Fugitive PM2.5
Exhaust PM2.5
PM2.5 Total
Bio- CO2 NBio- CO2 Total CO2 CH4 N2O CO2e
Category tons/yr MT/yr
Hauling 0.0000 0.0000 0.0000 0.0000 0.0000 0.0000 0.0000 0.0000 0.0000 0.0000 0.0000 0.0000 0.0000 0.0000 0.0000 0.0000
Vendor 9.0300e-003
0.2866 0.0621 6.7000e-004
0.0160 1.8300e-003
0.0178 4.6200e-003
1.7500e-003
6.3700e-003
0.0000 64.2264 64.2264 4.4800e-003
0.0000 64.3385
Worker 0.0244 0.0190 0.1897 4.5000e-004
0.0459 3.3000e-004
0.0463 0.0122 3.0000e-004
0.0125 0.0000 40.9404 40.9404 1.3900e-003
0.0000 40.9751
Total 0.0335 0.3055 0.2517 1.1200e-003
0.0619 2.1600e-003
0.0641 0.0168 2.0500e-003
0.0189 0.0000 105.1668 105.1668 5.8700e-003
0.0000 105.3136
Mitigated Construction Off-Site
3.5 Paving - 2019
ROG NOx CO SO2 Fugitive PM10
Exhaust PM10
PM10 Total
Fugitive PM2.5
Exhaust PM2.5
PM2.5 Total
Bio- CO2 NBio- CO2 Total CO2 CH4 N2O CO2e
Category tons/yr MT/yr
Off-Road 0.0145 0.1524 0.1467 2.3000e-004
8.2500e-003
8.2500e-003
7.5900e-003
7.5900e-003
0.0000 20.4752 20.4752 6.4800e-003
0.0000 20.6371
Paving 5.7500e-003
0.0000 0.0000 0.0000 0.0000 0.0000 0.0000 0.0000 0.0000 0.0000 0.0000
Total 0.0203 0.1524 0.1467 2.3000e-004
8.2500e-003
8.2500e-003
7.5900e-003
7.5900e-003
0.0000 20.4752 20.4752 6.4800e-003
0.0000 20.6371
Unmitigated Construction On-Site
CalEEMod Version: CalEEMod.2016.3.2 Date: 1/7/2019 4:58 PMPage 19 of 38
Victorville Retail (Construction - Unmitigated) - San Bernardino-Mojave Desert County, Annual

3.5 Paving - 2019
ROG NOx CO SO2 Fugitive PM10
Exhaust PM10
PM10 Total
Fugitive PM2.5
Exhaust PM2.5
PM2.5 Total
Bio- CO2 NBio- CO2 Total CO2 CH4 N2O CO2e
Category tons/yr MT/yr
Hauling 0.0000 0.0000 0.0000 0.0000 0.0000 0.0000 0.0000 0.0000 0.0000 0.0000 0.0000 0.0000 0.0000 0.0000 0.0000 0.0000
Vendor 0.0000 0.0000 0.0000 0.0000 0.0000 0.0000 0.0000 0.0000 0.0000 0.0000 0.0000 0.0000 0.0000 0.0000 0.0000 0.0000
Worker 6.4000e-004
5.0000e-004
4.9900e-003
1.0000e-005
1.2100e-003
1.0000e-005
1.2200e-003
3.2000e-004
1.0000e-005
3.3000e-004
0.0000 1.0774 1.0774 4.0000e-005
0.0000 1.0783
Total 6.4000e-004
5.0000e-004
4.9900e-003
1.0000e-005
1.2100e-003
1.0000e-005
1.2200e-003
3.2000e-004
1.0000e-005
3.3000e-004
0.0000 1.0774 1.0774 4.0000e-005
0.0000 1.0783
Unmitigated Construction Off-Site
ROG NOx CO SO2 Fugitive PM10
Exhaust PM10
PM10 Total
Fugitive PM2.5
Exhaust PM2.5
PM2.5 Total
Bio- CO2 NBio- CO2 Total CO2 CH4 N2O CO2e
Category tons/yr MT/yr
Off-Road 0.0145 0.1524 0.1467 2.3000e-004
8.2500e-003
8.2500e-003
7.5900e-003
7.5900e-003
0.0000 20.4752 20.4752 6.4800e-003
0.0000 20.6371
Paving 5.7500e-003
0.0000 0.0000 0.0000 0.0000 0.0000 0.0000 0.0000 0.0000 0.0000 0.0000
Total 0.0203 0.1524 0.1467 2.3000e-004
8.2500e-003
8.2500e-003
7.5900e-003
7.5900e-003
0.0000 20.4752 20.4752 6.4800e-003
0.0000 20.6371
Mitigated Construction On-Site
CalEEMod Version: CalEEMod.2016.3.2 Date: 1/7/2019 4:58 PMPage 20 of 38
Victorville Retail (Construction - Unmitigated) - San Bernardino-Mojave Desert County, Annual

3.5 Paving - 2019
ROG NOx CO SO2 Fugitive PM10
Exhaust PM10
PM10 Total
Fugitive PM2.5
Exhaust PM2.5
PM2.5 Total
Bio- CO2 NBio- CO2 Total CO2 CH4 N2O CO2e
Category tons/yr MT/yr
Hauling 0.0000 0.0000 0.0000 0.0000 0.0000 0.0000 0.0000 0.0000 0.0000 0.0000 0.0000 0.0000 0.0000 0.0000 0.0000 0.0000
Vendor 0.0000 0.0000 0.0000 0.0000 0.0000 0.0000 0.0000 0.0000 0.0000 0.0000 0.0000 0.0000 0.0000 0.0000 0.0000 0.0000
Worker 6.4000e-004
5.0000e-004
4.9900e-003
1.0000e-005
1.2100e-003
1.0000e-005
1.2200e-003
3.2000e-004
1.0000e-005
3.3000e-004
0.0000 1.0774 1.0774 4.0000e-005
0.0000 1.0783
Total 6.4000e-004
5.0000e-004
4.9900e-003
1.0000e-005
1.2100e-003
1.0000e-005
1.2200e-003
3.2000e-004
1.0000e-005
3.3000e-004
0.0000 1.0774 1.0774 4.0000e-005
0.0000 1.0783
Mitigated Construction Off-Site
3.6 Architectural Coating - 2019
ROG NOx CO SO2 Fugitive PM10
Exhaust PM10
PM10 Total
Fugitive PM2.5
Exhaust PM2.5
PM2.5 Total
Bio- CO2 NBio- CO2 Total CO2 CH4 N2O CO2e
Category tons/yr MT/yr
Archit. Coating 0.2374 0.0000 0.0000 0.0000 0.0000 0.0000 0.0000 0.0000 0.0000 0.0000 0.0000
Off-Road 3.5500e-003
0.0245 0.0246 4.0000e-005
1.7200e-003
1.7200e-003
1.7200e-003
1.7200e-003
0.0000 3.4043 3.4043 2.9000e-004
0.0000 3.4115
Total 0.2409 0.0245 0.0246 4.0000e-005
1.7200e-003
1.7200e-003
1.7200e-003
1.7200e-003
0.0000 3.4043 3.4043 2.9000e-004
0.0000 3.4115
Unmitigated Construction On-Site
CalEEMod Version: CalEEMod.2016.3.2 Date: 1/7/2019 4:58 PMPage 21 of 38
Victorville Retail (Construction - Unmitigated) - San Bernardino-Mojave Desert County, Annual

3.6 Architectural Coating - 2019
ROG NOx CO SO2 Fugitive PM10
Exhaust PM10
PM10 Total
Fugitive PM2.5
Exhaust PM2.5
PM2.5 Total
Bio- CO2 NBio- CO2 Total CO2 CH4 N2O CO2e
Category tons/yr MT/yr
Hauling 0.0000 0.0000 0.0000 0.0000 0.0000 0.0000 0.0000 0.0000 0.0000 0.0000 0.0000 0.0000 0.0000 0.0000 0.0000 0.0000
Vendor 0.0000 0.0000 0.0000 0.0000 0.0000 0.0000 0.0000 0.0000 0.0000 0.0000 0.0000 0.0000 0.0000 0.0000 0.0000 0.0000
Worker 9.9000e-004
7.7000e-004
7.6500e-003
2.0000e-005
1.8500e-003
1.0000e-005
1.8700e-003
4.9000e-004
1.0000e-005
5.0000e-004
0.0000 1.6520 1.6520 6.0000e-005
0.0000 1.6534
Total 9.9000e-004
7.7000e-004
7.6500e-003
2.0000e-005
1.8500e-003
1.0000e-005
1.8700e-003
4.9000e-004
1.0000e-005
5.0000e-004
0.0000 1.6520 1.6520 6.0000e-005
0.0000 1.6534
Unmitigated Construction Off-Site
ROG NOx CO SO2 Fugitive PM10
Exhaust PM10
PM10 Total
Fugitive PM2.5
Exhaust PM2.5
PM2.5 Total
Bio- CO2 NBio- CO2 Total CO2 CH4 N2O CO2e
Category tons/yr MT/yr
Archit. Coating 0.2374 0.0000 0.0000 0.0000 0.0000 0.0000 0.0000 0.0000 0.0000 0.0000 0.0000
Off-Road 3.5500e-003
0.0245 0.0246 4.0000e-005
1.7200e-003
1.7200e-003
1.7200e-003
1.7200e-003
0.0000 3.4043 3.4043 2.9000e-004
0.0000 3.4115
Total 0.2409 0.0245 0.0246 4.0000e-005
1.7200e-003
1.7200e-003
1.7200e-003
1.7200e-003
0.0000 3.4043 3.4043 2.9000e-004
0.0000 3.4115
Mitigated Construction On-Site
CalEEMod Version: CalEEMod.2016.3.2 Date: 1/7/2019 4:58 PMPage 22 of 38
Victorville Retail (Construction - Unmitigated) - San Bernardino-Mojave Desert County, Annual

4.0 Operational Detail - Mobile
4.1 Mitigation Measures Mobile
3.6 Architectural Coating - 2019
ROG NOx CO SO2 Fugitive PM10
Exhaust PM10
PM10 Total
Fugitive PM2.5
Exhaust PM2.5
PM2.5 Total
Bio- CO2 NBio- CO2 Total CO2 CH4 N2O CO2e
Category tons/yr MT/yr
Hauling 0.0000 0.0000 0.0000 0.0000 0.0000 0.0000 0.0000 0.0000 0.0000 0.0000 0.0000 0.0000 0.0000 0.0000 0.0000 0.0000
Vendor 0.0000 0.0000 0.0000 0.0000 0.0000 0.0000 0.0000 0.0000 0.0000 0.0000 0.0000 0.0000 0.0000 0.0000 0.0000 0.0000
Worker 9.9000e-004
7.7000e-004
7.6500e-003
2.0000e-005
1.8500e-003
1.0000e-005
1.8700e-003
4.9000e-004
1.0000e-005
5.0000e-004
0.0000 1.6520 1.6520 6.0000e-005
0.0000 1.6534
Total 9.9000e-004
7.7000e-004
7.6500e-003
2.0000e-005
1.8500e-003
1.0000e-005
1.8700e-003
4.9000e-004
1.0000e-005
5.0000e-004
0.0000 1.6520 1.6520 6.0000e-005
0.0000 1.6534
Mitigated Construction Off-Site
CalEEMod Version: CalEEMod.2016.3.2 Date: 1/7/2019 4:58 PMPage 23 of 38
Victorville Retail (Construction - Unmitigated) - San Bernardino-Mojave Desert County, Annual

ROG NOx CO SO2 Fugitive PM10
Exhaust PM10
PM10 Total
Fugitive PM2.5
Exhaust PM2.5
PM2.5 Total
Bio- CO2 NBio- CO2 Total CO2 CH4 N2O CO2e
Category tons/yr MT/yr
Mitigated 0.0000 0.0000 0.0000 0.0000 0.0000 0.0000 0.0000 0.0000 0.0000 0.0000 0.0000 0.0000 0.0000 0.0000 0.0000 0.0000
Unmitigated 0.0000 0.0000 0.0000 0.0000 0.0000 0.0000 0.0000 0.0000 0.0000 0.0000 0.0000 0.0000 0.0000 0.0000 0.0000 0.0000
4.2 Trip Summary Information
4.3 Trip Type Information
Average Daily Trip Rate Unmitigated Mitigated
Land Use Weekday Saturday Sunday Annual VMT Annual VMT
Automobile Care Center 0.00 0.00 0.00
Convenience Market With Gas Pumps 0.00 0.00 0.00
Fast Food Restaurant with Drive Thru 0.00 0.00 0.00
High Turnover (Sit Down Restaurant) 0.00 0.00 0.00
Parking Lot 0.00 0.00 0.00
Regional Shopping Center 0.00 0.00 0.00
Total 0.00 0.00 0.00
CalEEMod Version: CalEEMod.2016.3.2 Date: 1/7/2019 4:58 PMPage 24 of 38
Victorville Retail (Construction - Unmitigated) - San Bernardino-Mojave Desert County, Annual

Miles Trip % Trip Purpose %
Land Use H-W or C-W H-S or C-C H-O or C-NW H-W or C-W H-S or C-C H-O or C-NW Primary Diverted Pass-by
Automobile Care Center 0.00 0.00 0.00 0.00 0.00 0.00 0 0 0
Convenience Market With Gas Pumps
0.00 0.00 0.00 0.00 0.00 0.00 0 0 0
Fast Food Restaurant with Drive Thru
0.00 0.00 0.00 0.00 0.00 0.00 0 0 0
High Turnover (Sit Down Restaurant)
0.00 0.00 0.00 0.00 0.00 0.00 0 0 0
Parking Lot 0.00 0.00 0.00 0.00 0.00 0.00 0 0 0
Regional Shopping Center 0.00 0.00 0.00 0.00 0.00 0.00 0 0 0
5.0 Energy Detail
5.1 Mitigation Measures Energy
4.4 Fleet Mix
Land Use LDA LDT1 LDT2 MDV LHD1 LHD2 MHD HHD OBUS UBUS MCY SBUS MH
Automobile Care Center 0.541740 0.038987 0.178620 0.126833 0.019742 0.005671 0.017070 0.060066 0.001326 0.001715 0.006244 0.000823 0.001163
Convenience Market With Gas Pumps
0.541740 0.038987 0.178620 0.126833 0.019742 0.005671 0.017070 0.060066 0.001326 0.001715 0.006244 0.000823 0.001163
Fast Food Restaurant with Drive Thru
0.541740 0.038987 0.178620 0.126833 0.019742 0.005671 0.017070 0.060066 0.001326 0.001715 0.006244 0.000823 0.001163
High Turnover (Sit Down Restaurant)
0.541740 0.038987 0.178620 0.126833 0.019742 0.005671 0.017070 0.060066 0.001326 0.001715 0.006244 0.000823 0.001163
Parking Lot 0.541740 0.038987 0.178620 0.126833 0.019742 0.005671 0.017070 0.060066 0.001326 0.001715 0.006244 0.000823 0.001163
Regional Shopping Center 0.541740 0.038987 0.178620 0.126833 0.019742 0.005671 0.017070 0.060066 0.001326 0.001715 0.006244 0.000823 0.001163
Historical Energy Use: N
CalEEMod Version: CalEEMod.2016.3.2 Date: 1/7/2019 4:58 PMPage 25 of 38
Victorville Retail (Construction - Unmitigated) - San Bernardino-Mojave Desert County, Annual

ROG NOx CO SO2 Fugitive PM10
Exhaust PM10
PM10 Total
Fugitive PM2.5
Exhaust PM2.5
PM2.5 Total
Bio- CO2 NBio- CO2 Total CO2 CH4 N2O CO2e
Category tons/yr MT/yr
Electricity Mitigated
0.0000 0.0000 0.0000 0.0000 0.0000 0.0000 0.0000 0.0000 0.0000 0.0000
Electricity Unmitigated
0.0000 0.0000 0.0000 0.0000 0.0000 0.0000 0.0000 0.0000 0.0000 0.0000
NaturalGas Mitigated
0.0000 0.0000 0.0000 0.0000 0.0000 0.0000 0.0000 0.0000 0.0000 0.0000 0.0000 0.0000 0.0000 0.0000
NaturalGas Unmitigated
0.0000 0.0000 0.0000 0.0000 0.0000 0.0000 0.0000 0.0000 0.0000 0.0000 0.0000 0.0000 0.0000 0.0000
CalEEMod Version: CalEEMod.2016.3.2 Date: 1/7/2019 4:58 PMPage 26 of 38
Victorville Retail (Construction - Unmitigated) - San Bernardino-Mojave Desert County, Annual

5.2 Energy by Land Use - NaturalGas
NaturalGas Use
ROG NOx CO SO2 Fugitive PM10
Exhaust PM10
PM10 Total
Fugitive PM2.5
Exhaust PM2.5
PM2.5 Total
Bio- CO2 NBio- CO2 Total CO2 CH4 N2O CO2e
Land Use kBTU/yr tons/yr MT/yr
Automobile Care Center
0 0.0000 0.0000 0.0000 0.0000 0.0000 0.0000 0.0000 0.0000 0.0000 0.0000 0.0000 0.0000 0.0000 0.0000
Convenience Market With Gas
Pumps
0 0.0000 0.0000 0.0000 0.0000 0.0000 0.0000 0.0000 0.0000 0.0000 0.0000 0.0000 0.0000 0.0000 0.0000
Fast Food Restaurant with
Drive Thru
0 0.0000 0.0000 0.0000 0.0000 0.0000 0.0000 0.0000 0.0000 0.0000 0.0000 0.0000 0.0000 0.0000 0.0000
High Turnover (Sit Down Restaurant)
0 0.0000 0.0000 0.0000 0.0000 0.0000 0.0000 0.0000 0.0000 0.0000 0.0000 0.0000 0.0000 0.0000 0.0000
Parking Lot 0 0.0000 0.0000 0.0000 0.0000 0.0000 0.0000 0.0000 0.0000 0.0000 0.0000 0.0000 0.0000 0.0000 0.0000
Regional Shopping Center
0 0.0000 0.0000 0.0000 0.0000 0.0000 0.0000 0.0000 0.0000 0.0000 0.0000 0.0000 0.0000 0.0000 0.0000
Total 0.0000 0.0000 0.0000 0.0000 0.0000 0.0000 0.0000 0.0000 0.0000 0.0000 0.0000 0.0000 0.0000 0.0000
Unmitigated
CalEEMod Version: CalEEMod.2016.3.2 Date: 1/7/2019 4:58 PMPage 27 of 38
Victorville Retail (Construction - Unmitigated) - San Bernardino-Mojave Desert County, Annual

5.2 Energy by Land Use - NaturalGas
NaturalGas Use
ROG NOx CO SO2 Fugitive PM10
Exhaust PM10
PM10 Total
Fugitive PM2.5
Exhaust PM2.5
PM2.5 Total
Bio- CO2 NBio- CO2 Total CO2 CH4 N2O CO2e
Land Use kBTU/yr tons/yr MT/yr
Automobile Care Center
0 0.0000 0.0000 0.0000 0.0000 0.0000 0.0000 0.0000 0.0000 0.0000 0.0000 0.0000 0.0000 0.0000 0.0000
Convenience Market With Gas
Pumps
0 0.0000 0.0000 0.0000 0.0000 0.0000 0.0000 0.0000 0.0000 0.0000 0.0000 0.0000 0.0000 0.0000 0.0000
Fast Food Restaurant with
Drive Thru
0 0.0000 0.0000 0.0000 0.0000 0.0000 0.0000 0.0000 0.0000 0.0000 0.0000 0.0000 0.0000 0.0000 0.0000
High Turnover (Sit Down Restaurant)
0 0.0000 0.0000 0.0000 0.0000 0.0000 0.0000 0.0000 0.0000 0.0000 0.0000 0.0000 0.0000 0.0000 0.0000
Parking Lot 0 0.0000 0.0000 0.0000 0.0000 0.0000 0.0000 0.0000 0.0000 0.0000 0.0000 0.0000 0.0000 0.0000 0.0000
Regional Shopping Center
0 0.0000 0.0000 0.0000 0.0000 0.0000 0.0000 0.0000 0.0000 0.0000 0.0000 0.0000 0.0000 0.0000 0.0000
Total 0.0000 0.0000 0.0000 0.0000 0.0000 0.0000 0.0000 0.0000 0.0000 0.0000 0.0000 0.0000 0.0000 0.0000
Mitigated
CalEEMod Version: CalEEMod.2016.3.2 Date: 1/7/2019 4:58 PMPage 28 of 38
Victorville Retail (Construction - Unmitigated) - San Bernardino-Mojave Desert County, Annual
5.3 Energy by Land Use - Electricity
Electricity Use
Total CO2 CH4 N2O CO2e
Land Use kWh/yr MT/yr
Automobile Care Center
0 0.0000 0.0000 0.0000 0.0000
Convenience Market With Gas
Pumps
0 0.0000 0.0000 0.0000 0.0000
Fast Food Restaurant with
Drive Thru
0 0.0000 0.0000 0.0000 0.0000
High Turnover (Sit Down Restaurant)
0 0.0000 0.0000 0.0000 0.0000
Parking Lot 0 0.0000 0.0000 0.0000 0.0000
Regional Shopping Center
0 0.0000 0.0000 0.0000 0.0000
Total 0.0000 0.0000 0.0000 0.0000
Unmitigated
CalEEMod Version: CalEEMod.2016.3.2 Date: 1/7/2019 4:58 PMPage 29 of 38
Victorville Retail (Construction - Unmitigated) - San Bernardino-Mojave Desert County, Annual

6.1 Mitigation Measures Area
6.0 Area Detail
5.3 Energy by Land Use - Electricity
Electricity Use
Total CO2 CH4 N2O CO2e
Land Use kWh/yr MT/yr
Automobile Care Center
0 0.0000 0.0000 0.0000 0.0000
Convenience Market With Gas
Pumps
0 0.0000 0.0000 0.0000 0.0000
Fast Food Restaurant with
Drive Thru
0 0.0000 0.0000 0.0000 0.0000
High Turnover (Sit Down Restaurant)
0 0.0000 0.0000 0.0000 0.0000
Parking Lot 0 0.0000 0.0000 0.0000 0.0000
Regional Shopping Center
0 0.0000 0.0000 0.0000 0.0000
Total 0.0000 0.0000 0.0000 0.0000
Mitigated
CalEEMod Version: CalEEMod.2016.3.2 Date: 1/7/2019 4:58 PMPage 30 of 38
Victorville Retail (Construction - Unmitigated) - San Bernardino-Mojave Desert County, Annual

ROG NOx CO SO2 Fugitive PM10
Exhaust PM10
PM10 Total
Fugitive PM2.5
Exhaust PM2.5
PM2.5 Total
Bio- CO2 NBio- CO2 Total CO2 CH4 N2O CO2e
Category tons/yr MT/yr
Mitigated 0.5090 5.0000e-005
5.5200e-003
0.0000 2.0000e-005
2.0000e-005
2.0000e-005
2.0000e-005
0.0000 0.0106 0.0106 3.0000e-005
0.0000 0.0114
Unmitigated 0.5090 5.0000e-005
5.5200e-003
0.0000 2.0000e-005
2.0000e-005
2.0000e-005
2.0000e-005
0.0000 0.0106 0.0106 3.0000e-005
0.0000 0.0114
6.2 Area by SubCategory
ROG NOx CO SO2 Fugitive PM10
Exhaust PM10
PM10 Total
Fugitive PM2.5
Exhaust PM2.5
PM2.5 Total
Bio- CO2 NBio- CO2 Total CO2 CH4 N2O CO2e
SubCategory tons/yr MT/yr
Architectural Coating
0.1187 0.0000 0.0000 0.0000 0.0000 0.0000 0.0000 0.0000 0.0000 0.0000 0.0000
Consumer Products
0.3898 0.0000 0.0000 0.0000 0.0000 0.0000 0.0000 0.0000 0.0000 0.0000 0.0000
Landscaping 5.2000e-004
5.0000e-005
5.5200e-003
0.0000 2.0000e-005
2.0000e-005
2.0000e-005
2.0000e-005
0.0000 0.0106 0.0106 3.0000e-005
0.0000 0.0114
Total 0.5090 5.0000e-005
5.5200e-003
0.0000 2.0000e-005
2.0000e-005
2.0000e-005
2.0000e-005
0.0000 0.0106 0.0106 3.0000e-005
0.0000 0.0114
Unmitigated
CalEEMod Version: CalEEMod.2016.3.2 Date: 1/7/2019 4:58 PMPage 31 of 38
Victorville Retail (Construction - Unmitigated) - San Bernardino-Mojave Desert County, Annual

7.1 Mitigation Measures Water
7.0 Water Detail
6.2 Area by SubCategory
ROG NOx CO SO2 Fugitive PM10
Exhaust PM10
PM10 Total
Fugitive PM2.5
Exhaust PM2.5
PM2.5 Total
Bio- CO2 NBio- CO2 Total CO2 CH4 N2O CO2e
SubCategory tons/yr MT/yr
Architectural Coating
0.1187 0.0000 0.0000 0.0000 0.0000 0.0000 0.0000 0.0000 0.0000 0.0000 0.0000
Consumer Products
0.3898 0.0000 0.0000 0.0000 0.0000 0.0000 0.0000 0.0000 0.0000 0.0000 0.0000
Landscaping 5.2000e-004
5.0000e-005
5.5200e-003
0.0000 2.0000e-005
2.0000e-005
2.0000e-005
2.0000e-005
0.0000 0.0106 0.0106 3.0000e-005
0.0000 0.0114
Total 0.5090 5.0000e-005
5.5200e-003
0.0000 2.0000e-005
2.0000e-005
2.0000e-005
2.0000e-005
0.0000 0.0106 0.0106 3.0000e-005
0.0000 0.0114
Mitigated
CalEEMod Version: CalEEMod.2016.3.2 Date: 1/7/2019 4:58 PMPage 32 of 38
Victorville Retail (Construction - Unmitigated) - San Bernardino-Mojave Desert County, Annual

Total CO2 CH4 N2O CO2e
Category MT/yr
Mitigated 0.0000 0.0000 0.0000 0.0000
Unmitigated 0.0000 0.0000 0.0000 0.0000
CalEEMod Version: CalEEMod.2016.3.2 Date: 1/7/2019 4:58 PMPage 33 of 38
Victorville Retail (Construction - Unmitigated) - San Bernardino-Mojave Desert County, Annual
7.2 Water by Land Use
Indoor/Outdoor Use
Total CO2 CH4 N2O CO2e
Land Use Mgal MT/yr
Automobile Care Center
0 / 0 0.0000 0.0000 0.0000 0.0000
Convenience Market With Gas
Pumps
0 / 0 0.0000 0.0000 0.0000 0.0000
Fast Food Restaurant with
Drive Thru
0 / 0 0.0000 0.0000 0.0000 0.0000
High Turnover (Sit Down Restaurant)
0 / 0 0.0000 0.0000 0.0000 0.0000
Parking Lot 0 / 0 0.0000 0.0000 0.0000 0.0000
Regional Shopping Center
0 / 0 0.0000 0.0000 0.0000 0.0000
Total 0.0000 0.0000 0.0000 0.0000
Unmitigated
CalEEMod Version: CalEEMod.2016.3.2 Date: 1/7/2019 4:58 PMPage 34 of 38
Victorville Retail (Construction - Unmitigated) - San Bernardino-Mojave Desert County, Annual

8.1 Mitigation Measures Waste
7.2 Water by Land Use
Indoor/Outdoor Use
Total CO2 CH4 N2O CO2e
Land Use Mgal MT/yr
Automobile Care Center
0 / 0 0.0000 0.0000 0.0000 0.0000
Convenience Market With Gas
Pumps
0 / 0 0.0000 0.0000 0.0000 0.0000
Fast Food Restaurant with
Drive Thru
0 / 0 0.0000 0.0000 0.0000 0.0000
High Turnover (Sit Down Restaurant)
0 / 0 0.0000 0.0000 0.0000 0.0000
Parking Lot 0 / 0 0.0000 0.0000 0.0000 0.0000
Regional Shopping Center
0 / 0 0.0000 0.0000 0.0000 0.0000
Total 0.0000 0.0000 0.0000 0.0000
Mitigated
8.0 Waste Detail
CalEEMod Version: CalEEMod.2016.3.2 Date: 1/7/2019 4:58 PMPage 35 of 38
Victorville Retail (Construction - Unmitigated) - San Bernardino-Mojave Desert County, Annual

Total CO2 CH4 N2O CO2e
MT/yr
Mitigated 0.0000 0.0000 0.0000 0.0000
Unmitigated 0.0000 0.0000 0.0000 0.0000
Category/Year
8.2 Waste by Land Use
Waste Disposed
Total CO2 CH4 N2O CO2e
Land Use tons MT/yr
Automobile Care Center
0 0.0000 0.0000 0.0000 0.0000
Fast Food Restaurant with
Drive Thru
0 0.0000 0.0000 0.0000 0.0000
High Turnover (Sit Down Restaurant)
0 0.0000 0.0000 0.0000 0.0000
Parking Lot 0 0.0000 0.0000 0.0000 0.0000
Regional Shopping Center
0 0.0000 0.0000 0.0000 0.0000
Total 0.0000 0.0000 0.0000 0.0000
Unmitigated
CalEEMod Version: CalEEMod.2016.3.2 Date: 1/7/2019 4:58 PMPage 36 of 38
Victorville Retail (Construction - Unmitigated) - San Bernardino-Mojave Desert County, Annual

8.2 Waste by Land Use
Waste Disposed
Total CO2 CH4 N2O CO2e
Land Use tons MT/yr
Automobile Care Center
0 0.0000 0.0000 0.0000 0.0000
Fast Food Restaurant with
Drive Thru
0 0.0000 0.0000 0.0000 0.0000
High Turnover (Sit Down Restaurant)
0 0.0000 0.0000 0.0000 0.0000
Parking Lot 0 0.0000 0.0000 0.0000 0.0000
Regional Shopping Center
0 0.0000 0.0000 0.0000 0.0000
Total 0.0000 0.0000 0.0000 0.0000
Mitigated
9.0 Operational Offroad
Equipment Type Number Hours/Day Days/Year Horse Power Load Factor Fuel Type
10.0 Stationary Equipment
Fire Pumps and Emergency Generators
Equipment Type Number Hours/Day Hours/Year Horse Power Load Factor Fuel Type
Boilers
Equipment Type Number Heat Input/Day Heat Input/Year Boiler Rating Fuel Type
CalEEMod Version: CalEEMod.2016.3.2 Date: 1/7/2019 4:58 PMPage 37 of 38
Victorville Retail (Construction - Unmitigated) - San Bernardino-Mojave Desert County, Annual

11.0 Vegetation
User Defined Equipment
Equipment Type Number
CalEEMod Version: CalEEMod.2016.3.2 Date: 1/7/2019 4:58 PMPage 38 of 38
Victorville Retail (Construction - Unmitigated) - San Bernardino-Mojave Desert County, Annual

Desert Grove Retail Project Greenhouse Gas Analysis
11723-04 GHG Report
This page intentionally left blank
Desert Grove Retail Project Greenhouse Gas Analysis
11723-04 GHG Report
APPENDIX 3.2:
SCREENING TABLES

Greenhouse Gas Emissions Screening Table
Note: This form is to be used only for projects which are subject to CEQA
(i.e. Negative Declaration, Mitigated Negative Declaration or Environmental Impact Report)
GENERAL INFORMATION
Applicant:
Address:
Telephone No.:
TYPE OF PROJECT
Residential (Single-Family or Multi
PROJECT LOCATION
General Location/Address of Project:
Name of Business (if applicable):
Assessor’s Parcel No(s):
Existing Zoning:
PROJECT DESCRIPTION:
Instructions
1. Fill out the appropriate section below
2. Choose items which the proposed project will incorporate into the development to reach
a minimum of 45 points.
3. Do not chose items which are independently required by other laws, codes or the VVMC,
such as the California Building Green Code, the Civic Center Sustainability Plan or
required infrastructure improvements.
4. For those items listed with a TBD point value, please provide specific information and
background studies (i.e. traffic study)
5. Submit the Screening Table along with the Planning Commission Review Application.
City of Victorville Department of Development
Planning Building Code Enforcement
Greenhouse Gas Emissions Screening Table Review
This form is to be used only for projects which are subject to CEQA and not exempt from CEQA
Negative Declaration, Mitigated Negative Declaration or Environmental Impact Report)
Contact Name:
Email Address:
Family or Multi-Family) Commercial or Industrial
General Location/Address of Project:
Name of Business (if applicable):
Fill out the appropriate section below for either Residential or Commercial/Industrial.
which the proposed project will incorporate into the development to reach
Do not chose items which are independently required by other laws, codes or the VVMC,
alifornia Building Green Code, the Civic Center Sustainability Plan or
required infrastructure improvements.
For those items listed with a TBD point value, please provide specific information and
(i.e. traffic study) for Staff to determine an assigned point value.
Submit the Screening Table along with the Planning Commission Review Application.
14343 Civic Drive PO Box 5001
Victorville, CA 92393-5001 (760) 955-5135
Fax (760) 269-0070 [email protected]
and not exempt from CEQA
Negative Declaration, Mitigated Negative Declaration or Environmental Impact Report).
Industrial
either Residential or Commercial/Industrial.
which the proposed project will incorporate into the development to reach
Do not chose items which are independently required by other laws, codes or the VVMC,
alifornia Building Green Code, the Civic Center Sustainability Plan or
For those items listed with a TBD point value, please provide specific information and
ine an assigned point value.
Submit the Screening Table along with the Planning Commission Review Application.
X
US Hwy 395 and State Hwy 18 (Palmdale Road)
3103-531-18, 3103-531-19, 3103-531-20C-3 (to remain)
New Shopping Center and pads including retail, restaurant,restaurant with drive-thru, gasoline dispensing, full service car wash uses
Broadway Chinatown LLC Fraydoon Bral
1458 South San Pedro Street, Unit 236Los Angeles, CA 90015
(310) 925-1234 [email protected]
C-2

Commercial/Industrial Section
Feature Description Assigned
Point Values Project Points
Reduction Measure PS E3: Commercial/Industrial Energy Efficiency Development
Building Envelope
Insulation 2008 baseline (walls R-13; roof/attic R-30)
Modestly Enhanced Insulation (walls R-13, roof/attic R-38))
Enhanced Insulation (rigid wall insulation R-13, roof/attic R-38)
Greatly Enhanced Insulation (spray foam insulated walls R-15 or higher, roof/attic R-38 or higher)
0 points
15 points
18 points
20 points
Windows 2008 Baseline Windows (0.57 U-factor, 0.4 solar heat gain coefficient [SHGC})
Modestly Enhanced Window Insulation (0.4 U-factor, 0.32 SHGC)
Enhanced Window Insulation (0.32 U-factor, 0.25 SHGC)
Greatly Enhanced Window Insulation (0.28 or less U-factor, 0.22 or less SHGC)
0 points
7 points
8 points
12 points
Cool Roof
Modest Cool Roof (CRRC Rated 0.15 aged solar reflectance, 0.75 thermal emittance)
Enhanced Cool Roof (CRRC Rated 0.2 aged solar reflectance, 0.75 thermal emittance)
Greatly Enhanced Cool Roof ( CRRC Rated 0.35 aged solar reflectance, 0.75 thermal emittance)
12 points
14 points
16 points
Air Infiltration Minimizing leaks in the building envelope is as important as the insulation properties of the building. Insulation does not work effectively if there is excess air leakage.
Air barrier applied to exterior walls, calking, and visual inspection such as the HERS Verified Quality Insulation Installation (QII or equivalent)
Blower Door HERS Verified Envelope Leakage or equivalent
12 points
10 points
Thermal Storage of Building
Thermal storage is a design characteristic that helps keep a constant temperature in the building. Common thermal storage devices include strategically placed water filled columns, water storage tanks, and thick masonry walls.
Modest Thermal Mass (10% of floor or 10% of walls 12” or more thick exposed concrete or masonry with no permanently installed floor covering such as carpet, linoleum, wood or other insulating materials)
4 points
Enhanced Thermal Mass (20% of floor or 20% of walls 12” or more thick 6 points
15
7

Feature Description Assigned
Point Values Project Points
exposed concrete or masonry with no permanently installed floor covering such as carpet, linoleum, wood or other insulating materials)
Enhanced Thermal Mass (80% of floor or 80% of walls 12” or more thick exposed concrete or masonry with no permanently installed floor covering such as carpet, linoleum, wood or other insulating materials)
24 points
Indoor Space Efficiencies
Heating/ Cooling Distribution System
Minimum Duct Insulation (R-4.2 required)
Modest Duct insulation (R-6)
Enhanced Duct Insulation (R-8)
Distribution loss reduction with inspection (HERS Verified Duct Leakage or equivalent)
0 points
8 points
10 points
14 points
Space Heating/ Cooling Equipment
2008 Minimum HVAC Efficiency (EER 13/75% AFUE or 7.7 HSPF)
Improved Efficiency HVAC (EER 14/78% AFUE or 8 HSPF)
High Efficiency HVAC (EER 15/80% AFUE or 8.5 HSPF)
Very High Efficiency HVAC (EER 16/82% AFUE or 9 HSPF)
0 points
7 points
8 points
12 points
Commercial Heat Recovery Systems
Heat recovery strategies employed with commercial laundry, cooking equipment, and other commercial heat sources for reuse in HVAC air intake or other appropriate heat recovery technology. Point values for these types of systems will be determined based upon design and engineering data documenting the energy savings.
TBD
Water Heaters 2008 Minimum Efficiency (0.57 Energy Factor) 0 points
Improved Efficiency Water Heater (0.675 Energy Factor) 14 points
High Efficiency Water Heater (0.72 Energy Factor) 16 points
Very High Efficiency Water Heater (0.92 Energy Factor) 19 points
Solar Pre-heat System (0.2 Net Solar Fraction)
Enhanced Solar Pre-heat System (0.35 Net Solar Fraction)
4 points
8 points
Daylighting Daylighting is the ability of each room within the building to provide outside light during the day reducing the need for artificial lighting during daylight hours.
All peripheral rooms within building have at least one window or skylight 1 points
All rooms within building have daylight (through use of windows, solar tubes, skylights, etc.)
5 points
All rooms daylighted 7 points
8
14

Feature Description Assigned
Point Values Project Points
Artificial Lighting
2008 Minimum (required)
Efficient Lights (25% of in-unit fixtures considered high efficacy. High efficacy is defined as 40 lumens/watt for 15 watt or less fixtures; 50 lumens/watt for 15-40 watt fixtures, 60 lumens/watt for fixtures >40watt)
High Efficiency Lights (50% of in-unit fixtures are high efficacy)
Very High Efficiency Lights (100% of in-unit fixtures are high efficacy)
0 points
9 points
12 points
14 points
Appliances Star Commercial Refrigerator (new)
Energy Star Commercial Dish Washer (new)
Energy Star Commercial Cloths Washing
4 points
4 points
4 points
Miscellaneous Commercial/Industrial Building Efficiencies
Building Placement
North/South alignment of building or other building placement such that the orientation of the buildings optimizes conditions for natural heating, cooling, and lighting.
6 point
Shading At least 90% of south-facing glazing will be shaded by vegetation or overhangs at noon on Jun 21st.
6 Points
Other
This allows innovation by the applicant to provide design features that increases the energy efficiency of the project not provided in the table. Note that engineering data will be required documenting the energy efficiency of innovative designs and point values given based upon the proven efficiency beyond Title 24 Energy Efficiency Standards.
TBD
Existing Commercial building Retrofits
The applicant may wish to provide energy efficiency retrofit projects to existing commercial buildings to further the point value of their project. Retrofitting existing commercial buildings within the City is a key reduction measure that is needed to reach the reduction goal. The potential for an applicant to take advantage of this program will be decided on a case by case basis and must have the approval of the City Planning Department. The decision to allow applicants to ability to participate in this program will be evaluated based upon, but not limited to the following:
TBD
Will the energy efficiency retrofit project benefit low income or disadvantaged communities?
Does the energy efficiency retrofit project fit within the overall assumptions in the reduction measure associated with commercial building energy efficiency retrofits?
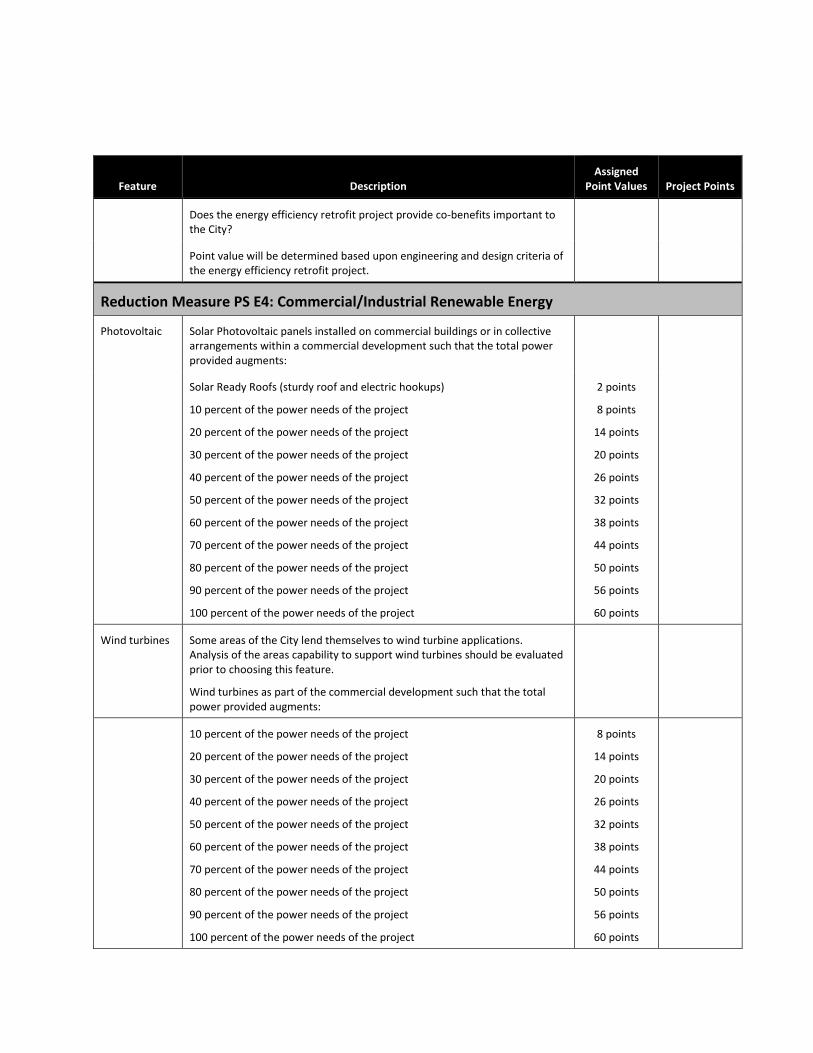
Feature Description Assigned
Point Values Project Points
Does the energy efficiency retrofit project provide co-benefits important to the City?
Point value will be determined based upon engineering and design criteria of the energy efficiency retrofit project.
Reduction Measure PS E4: Commercial/Industrial Renewable Energy
Photovoltaic Solar Photovoltaic panels installed on commercial buildings or in collective arrangements within a commercial development such that the total power provided augments:
Solar Ready Roofs (sturdy roof and electric hookups)
10 percent of the power needs of the project
20 percent of the power needs of the project
30 percent of the power needs of the project
40 percent of the power needs of the project
50 percent of the power needs of the project
60 percent of the power needs of the project
70 percent of the power needs of the project
80 percent of the power needs of the project
90 percent of the power needs of the project
100 percent of the power needs of the project
2 points
8 points
14 points
20 points
26 points
32 points
38 points
44 points
50 points
56 points
60 points
Wind turbines Some areas of the City lend themselves to wind turbine applications. Analysis of the areas capability to support wind turbines should be evaluated prior to choosing this feature.
Wind turbines as part of the commercial development such that the total power provided augments:
10 percent of the power needs of the project
20 percent of the power needs of the project
30 percent of the power needs of the project
40 percent of the power needs of the project
50 percent of the power needs of the project
60 percent of the power needs of the project
70 percent of the power needs of the project
80 percent of the power needs of the project
90 percent of the power needs of the project
100 percent of the power needs of the project
8 points
14 points
20 points
26 points
32 points
38 points
44 points
50 points
56 points
60 points
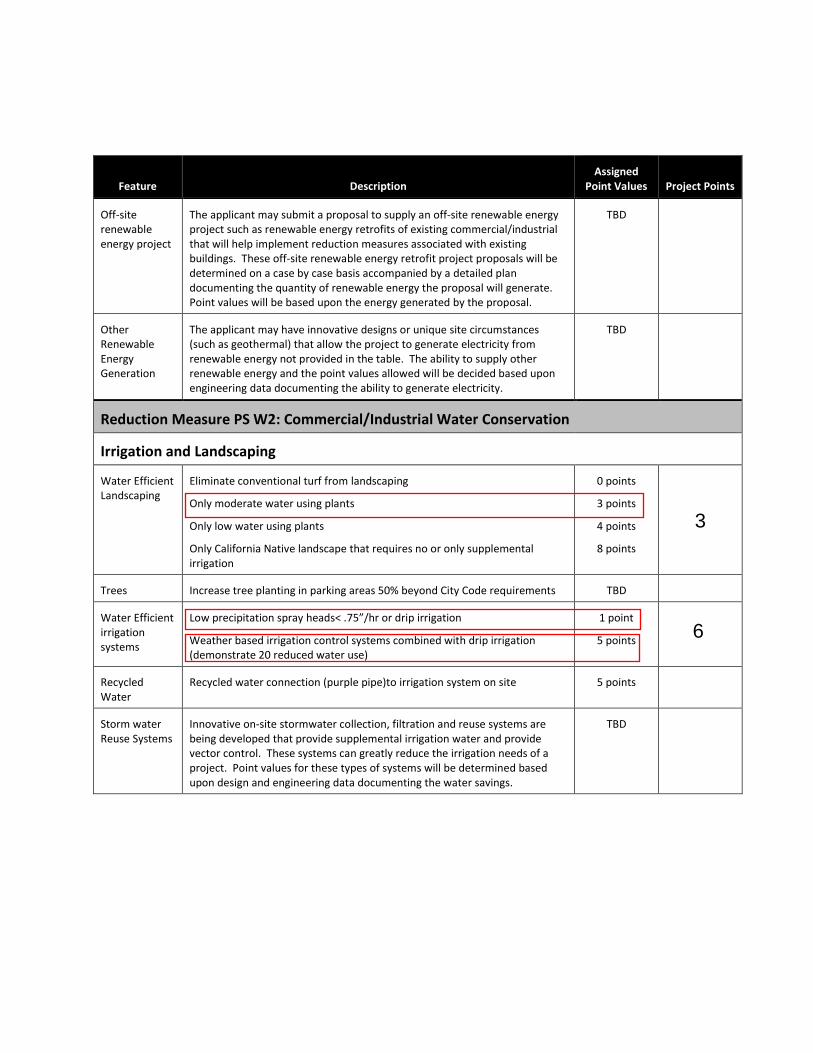
Feature Description Assigned
Point Values Project Points
Off-site renewable energy project
The applicant may submit a proposal to supply an off-site renewable energy project such as renewable energy retrofits of existing commercial/industrial that will help implement reduction measures associated with existing buildings. These off-site renewable energy retrofit project proposals will be determined on a case by case basis accompanied by a detailed plan documenting the quantity of renewable energy the proposal will generate. Point values will be based upon the energy generated by the proposal.
TBD
Other Renewable Energy Generation
The applicant may have innovative designs or unique site circumstances (such as geothermal) that allow the project to generate electricity from renewable energy not provided in the table. The ability to supply other renewable energy and the point values allowed will be decided based upon engineering data documenting the ability to generate electricity.
TBD
Reduction Measure PS W2: Commercial/Industrial Water Conservation
Irrigation and Landscaping
Water Efficient Landscaping
Eliminate conventional turf from landscaping
Only moderate water using plants
Only low water using plants
Only California Native landscape that requires no or only supplemental irrigation
0 points
3 points
4 points
8 points
Trees Increase tree planting in parking areas 50% beyond City Code requirements TBD
Water Efficient irrigation systems
Low precipitation spray heads< .75”/hr or drip irrigation
Weather based irrigation control systems combined with drip irrigation (demonstrate 20 reduced water use)
1 point
5 points
Recycled Water
Recycled water connection (purple pipe)to irrigation system on site 5 points
Storm water Reuse Systems
Innovative on-site stormwater collection, filtration and reuse systems are being developed that provide supplemental irrigation water and provide vector control. These systems can greatly reduce the irrigation needs of a project. Point values for these types of systems will be determined based upon design and engineering data documenting the water savings.
TBD
3
6
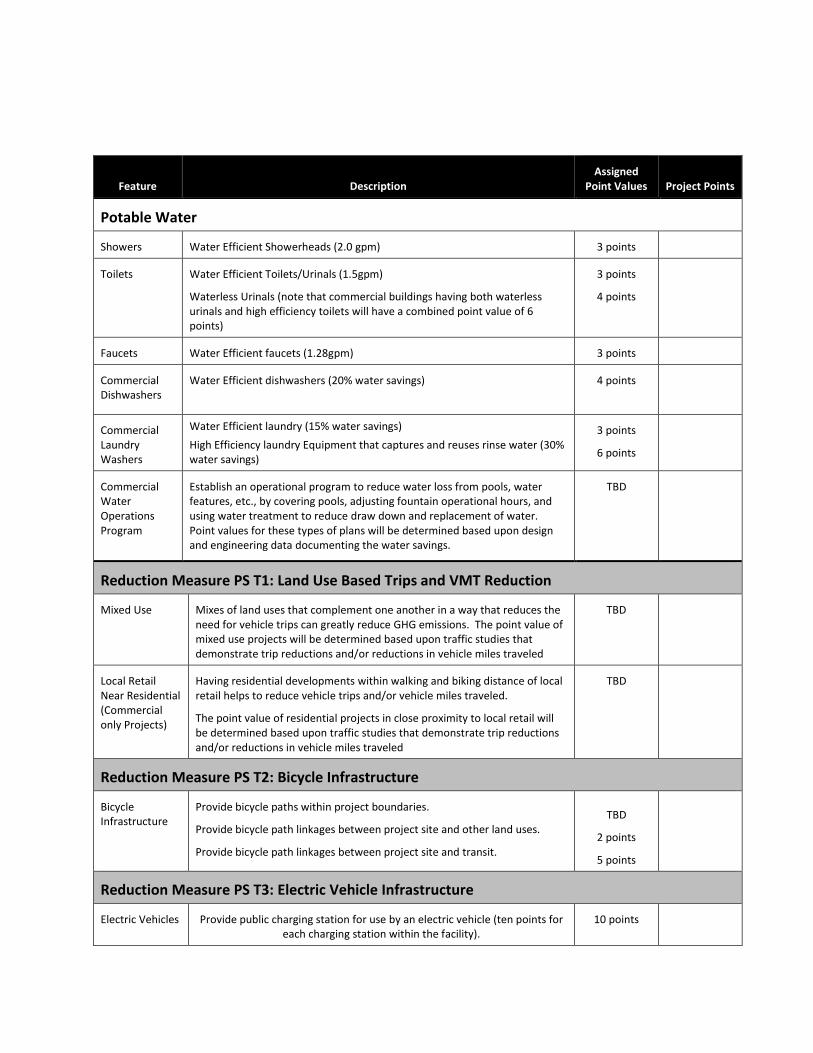
Feature Description Assigned
Point Values Project Points
Potable Water
Showers Water Efficient Showerheads (2.0 gpm) 3 points
Toilets Water Efficient Toilets/Urinals (1.5gpm)
Waterless Urinals (note that commercial buildings having both waterless urinals and high efficiency toilets will have a combined point value of 6 points)
3 points
4 points
Faucets Water Efficient faucets (1.28gpm) 3 points
Commercial Dishwashers
Water Efficient dishwashers (20% water savings)
4 points
Commercial Laundry Washers
Water Efficient laundry (15% water savings)
High Efficiency laundry Equipment that captures and reuses rinse water (30% water savings)
3 points
6 points
Commercial Water Operations Program
Establish an operational program to reduce water loss from pools, water features, etc., by covering pools, adjusting fountain operational hours, and using water treatment to reduce draw down and replacement of water. Point values for these types of plans will be determined based upon design and engineering data documenting the water savings.
TBD
Reduction Measure PS T1: Land Use Based Trips and VMT Reduction
Mixed Use Mixes of land uses that complement one another in a way that reduces the need for vehicle trips can greatly reduce GHG emissions. The point value of mixed use projects will be determined based upon traffic studies that demonstrate trip reductions and/or reductions in vehicle miles traveled
TBD
Local Retail Near Residential (Commercial only Projects)
Having residential developments within walking and biking distance of local retail helps to reduce vehicle trips and/or vehicle miles traveled.
The point value of residential projects in close proximity to local retail will be determined based upon traffic studies that demonstrate trip reductions and/or reductions in vehicle miles traveled
TBD
Reduction Measure PS T2: Bicycle Infrastructure
Bicycle Infrastructure
Provide bicycle paths within project boundaries.
Provide bicycle path linkages between project site and other land uses.
Provide bicycle path linkages between project site and transit.
TBD
2 points
5 points
Reduction Measure PS T3: Electric Vehicle Infrastructure
Electric Vehicles Provide public charging station for use by an electric vehicle (ten points for each charging station within the facility).
10 points
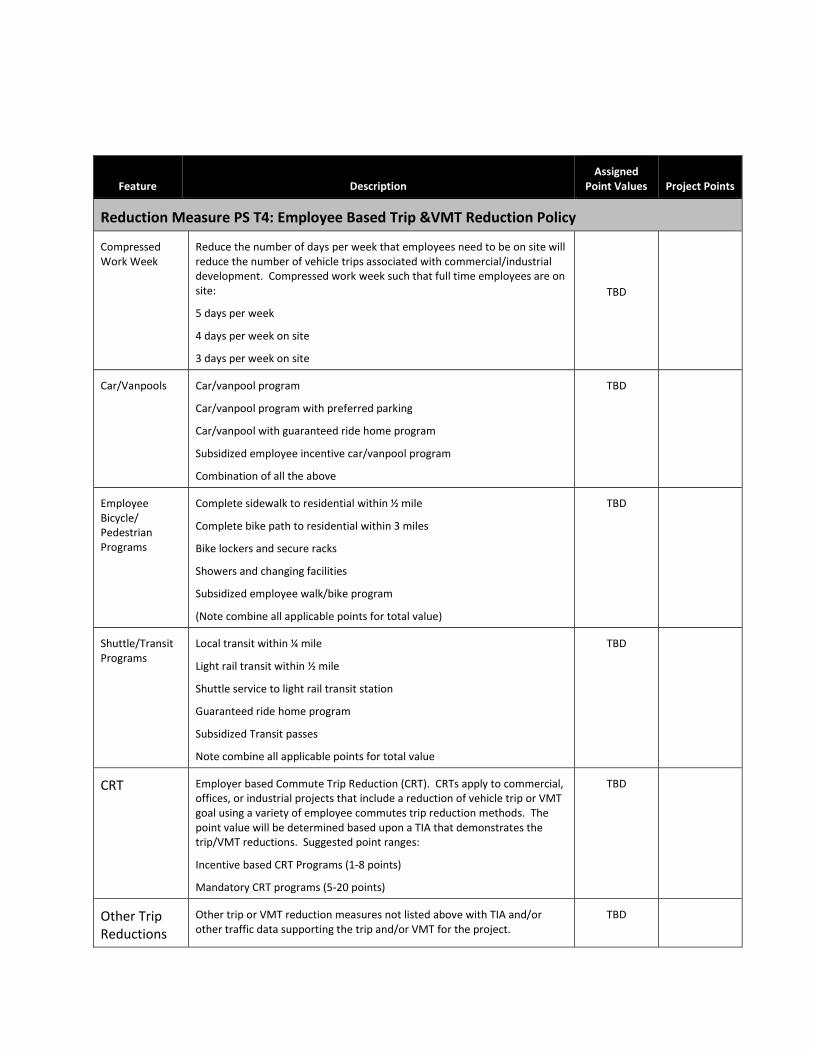
Feature Description Assigned
Point Values Project Points
Reduction Measure PS T4: Employee Based Trip &VMT Reduction Policy
Compressed Work Week
Reduce the number of days per week that employees need to be on site will reduce the number of vehicle trips associated with commercial/industrial development. Compressed work week such that full time employees are on site:
5 days per week
4 days per week on site
3 days per week on site
TBD
Car/Vanpools Car/vanpool program
Car/vanpool program with preferred parking
Car/vanpool with guaranteed ride home program
Subsidized employee incentive car/vanpool program
Combination of all the above
TBD
Employee Bicycle/ Pedestrian Programs
Complete sidewalk to residential within ½ mile
Complete bike path to residential within 3 miles
Bike lockers and secure racks
Showers and changing facilities
Subsidized employee walk/bike program
(Note combine all applicable points for total value)
TBD
Shuttle/Transit Programs
Local transit within ¼ mile
Light rail transit within ½ mile
Shuttle service to light rail transit station
Guaranteed ride home program
Subsidized Transit passes
Note combine all applicable points for total value
TBD
CRT Employer based Commute Trip Reduction (CRT). CRTs apply to commercial, offices, or industrial projects that include a reduction of vehicle trip or VMT goal using a variety of employee commutes trip reduction methods. The point value will be determined based upon a TIA that demonstrates the trip/VMT reductions. Suggested point ranges:
Incentive based CRT Programs (1-8 points)
Mandatory CRT programs (5-20 points)
TBD
Other Trip Reductions
Other trip or VMT reduction measures not listed above with TIA and/or other traffic data supporting the trip and/or VMT for the project.
TBD

Feature Description Assigned
Point Values Project Points
Total Points from Commercial/Industrial Project:
-Commercial/Industrial Section Ends-
484853 53