desert oaks plaza - constant...
TRANSCRIPT
DESERT OAKS PLAZANorth Las Vegas, Nevada
Offering Memorandum

N O N - E N D O R S E M E N T A N D D I S C L A I M E R N O T I C E
Confidentiality and DisclaimerThe information contained in the following Marketing Brochure is proprietary and strictly confidential. It is intended to
be reviewed only by the party receiving it from Marcus & Millichap and should not be made available to any other
person or entity without the written consent of Marcus & Millichap. This Marketing Brochure has been prepared to
provide summary, unverified information to prospective purchasers, and to establish only a preliminary level of
interest in the subject property. The information contained herein is not a substitute for a thorough due diligence
investigation. Marcus & Millichap has not made any investigation, and makes no warranty or representation, with
respect to the income or expenses for the subject property, the future projected financial performance of the
property, the size and square footage of the property and improvements, the presence or absence of contaminating
substances, PCB's or asbestos, the compliance with State and Federal regulations, the physical condition of the
improvements thereon, or the financial condition or business prospects of any tenant, or any tenant's plans or
intentions to continue its occupancy of the subject property. The information contained in this Marketing Brochure
has been obtained from sources we believe to be reliable; however, Marcus & Millichap has not verified, and will not
verify, any of the information contained herein, nor has Marcus & Millichap conducted any investigation regarding
these matters and makes no warranty or representation whatsoever regarding the accuracy or completeness of the
information provided. All potential buyers must take appropriate measures to verify all of the information set forth
herein. Marcus & Millichap is a service mark of Marcus & Millichap Real Estate Investment Services, Inc. © 2016
Marcus & Millichap. All rights reserved.
Non-Endorsement NoticeMarcus & Millichap is not affiliated with, sponsored by, or endorsed by any commercial tenant or lessee identified in
this marketing package. The presence of any corporation's logo or name is not intended to indicate or imply
affiliation with, or sponsorship or endorsement by, said corporation of Marcus & Millichap, its affiliates or
subsidiaries, or any agent, product, service, or commercial listing of Marcus & Millichap, and is solely included for
the purpose of providing tenant lessee information about this listing to prospective customers.
ALL PROPERTY SHOWINGS ARE BY APPOINTMENT ONLY.PLEASE CONSULT YOUR MARCUS & MILLICHAP AGENT FOR MORE DETAILS.
DESERT OAKS PLAZA
North Las Vegas, NV
ACT ID Y0220036

TABLE OF CONTENTS
SECTION
INVESTMENT OVERVIEW 01Offering Summary
Regional Map
Local Map
Aerial Photo
FINANCIAL ANALYSIS 02Tenant Summary
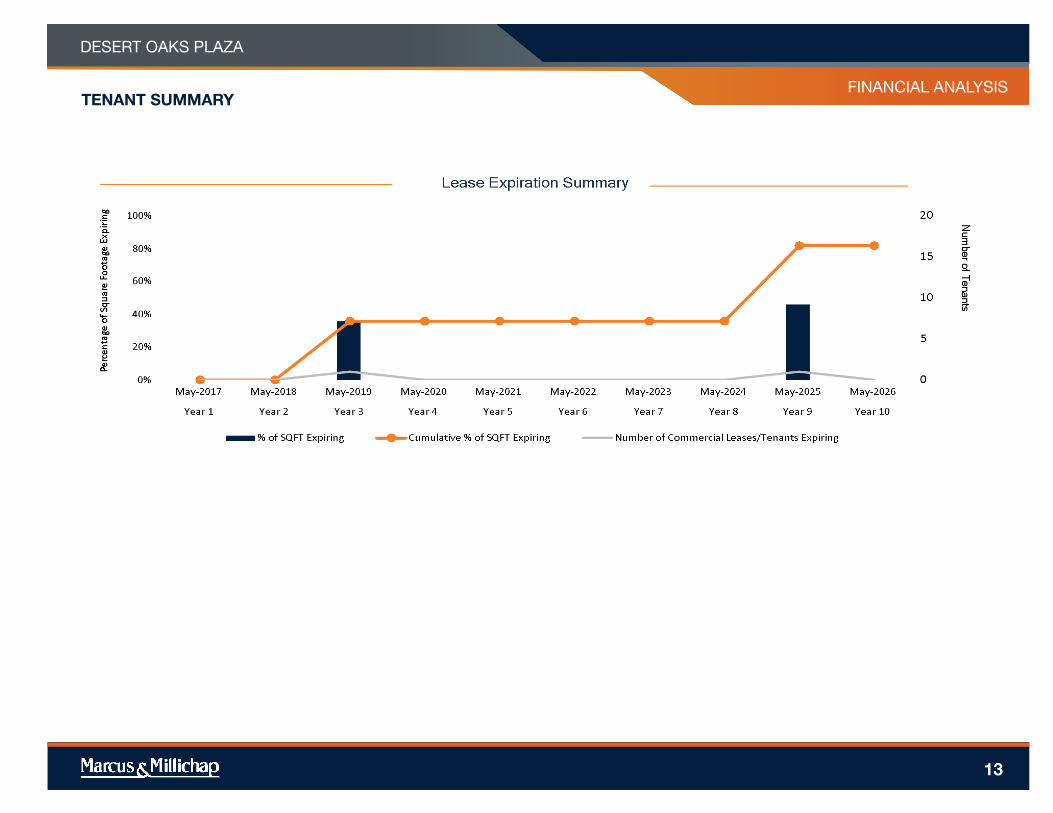
Lease Expiration Chart
Operating Statement
Notes
Pricing Detail
Acquisition Financing
MARKET COMPARABLES 03Comparables
MARKET OVERVIEW 04
Market Analysis
Demographic Analysis
DESERT OAKS PLAZA

DESERT OAKS PLAZA
4
INVESTMENT
OVERVIEW

DESERT OAKS PLAZA
#
EXECUTIVE SUMMARY
OFFERING SUMMARY
MAJOR EMPLOYERS
EMPLOYER # OF EMPLOYEES
Walmart 1,846
Epic Resorts - Scottsdale 1,798
Santa Fe Station Ht & Casino 1,500
Cox Nevada Telcom LLC 1,320
San Lorenzo Italian Restaurant 1,300
Texas Gambling Hall & Ht Inc 1,300
Station Casinos Inc 1,000
Station Casinos LLC 1,000
Clark County School District 940
Nstec 806
ISS Facility Services Inc 803
Yucaipa Companies LLC 760
DEMOGRAPHICS
1-Miles 3-Miles 5-Miles
2015 Estimate Pop 15,663 157,122 409,007
2010 Census Pop 14,686 145,625 382,533
2015 Estimate HH 5,457 52,444 135,966
2010 Census HH 5,106 48,884 127,989
Median HH Income $61,005 $60,207 $53,153
Per Capita Income $24,591 $23,861 $22,837
Average HH Income $70,511 $71,235 $68,019
VITAL DATA
CURRENT PRO FORMA
Price $1,705,000 CAP Rate 7.56% 7.78%
Down Payment 40.6% / $692,230Net Operating Income
$128,902 $132,594
Loan Amount $1,023,000Net Cash Flow After Debt Service
8.76% / $60,668 9.3% / $64,360
Loan Type Proposed New Total Return 12.04% / $83,331 12.72% / $88,064
Interest Rate / Amortization 4.50% / 25 Years
Gross Leasable Area (GLA) 7,620 SF
Price/SF $224.00
Current Occupancy 81.63%
Year Built / Renovated 2008
Lot Size 0.57 acre(s)
5
MAJOR TENANTS
TENANT GLA LEASE EXPIRATION LEASE TYPE
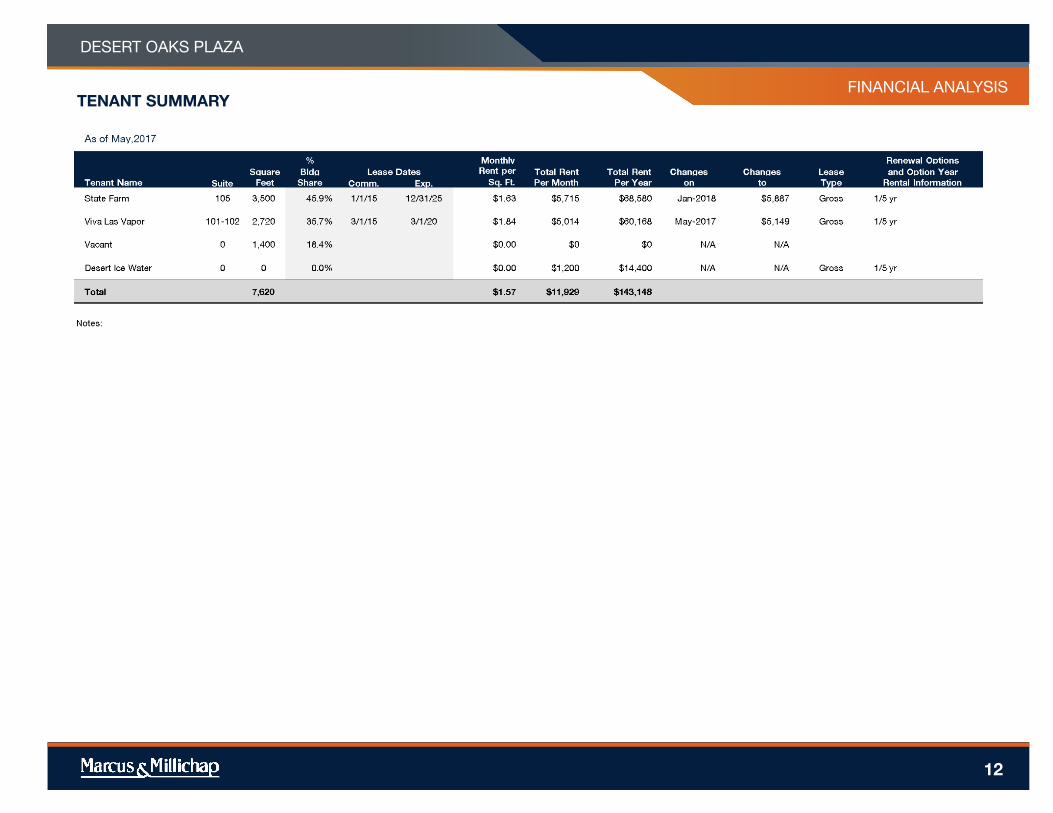
State Farm 3,500 12/31/2025 Gross
Viva Las Vapor 2,720 3/1/2020 Gross
DESERT OAKS PLAZA
#
OFFERING SUMMARY
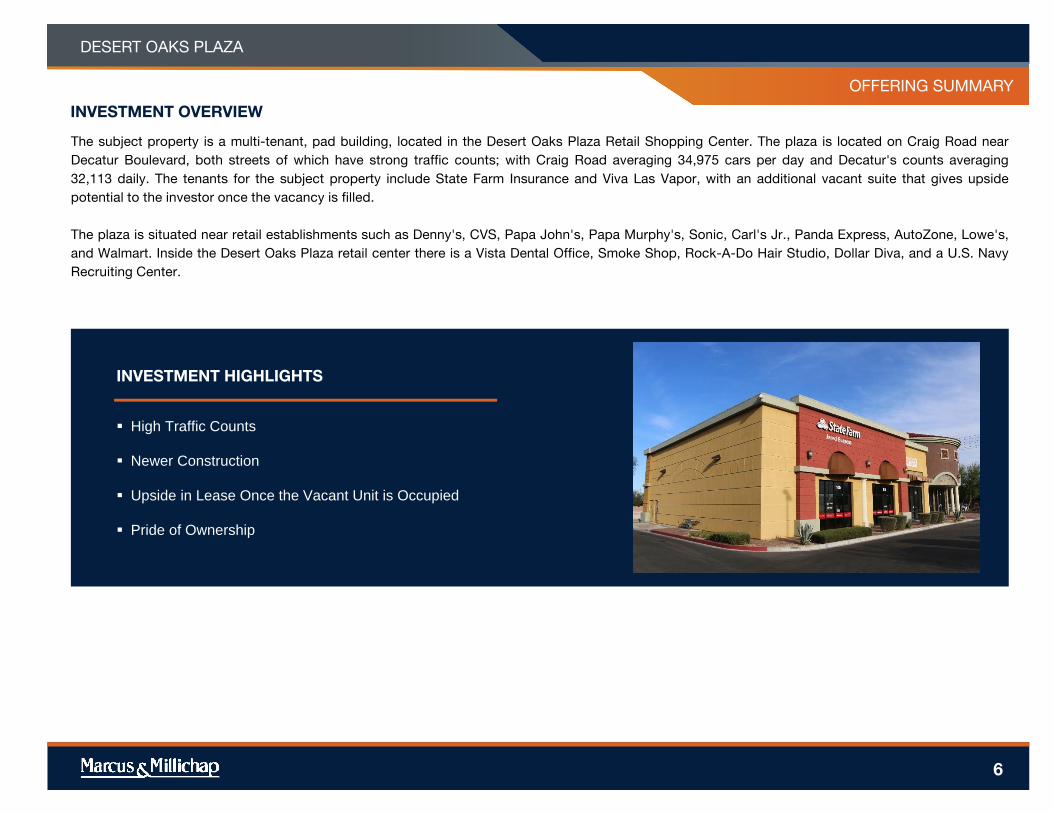
High Traffic Counts
Newer Construction
Upside in Lease Once the Vacant Unit is Occupied
Pride of Ownership
INVESTMENT HIGHLIGHTS
The subject property is a multi-tenant, pad building, located in the Desert Oaks Plaza Retail Shopping Center. The plaza is located on Craig Road near
Decatur Boulevard, both streets of which have strong traffic counts; with Craig Road averaging 34,975 cars per day and Decatur's counts averaging
32,113 daily. The tenants for the subject property include State Farm Insurance and Viva Las Vapor, with an additional vacant suite that gives upside
potential to the investor once the vacancy is filled.
The plaza is situated near retail establishments such as Denny's, CVS, Papa John's, Papa Murphy's, Sonic, Carl's Jr., Panda Express, AutoZone, Lowe's,
and Walmart. Inside the Desert Oaks Plaza retail center there is a Vista Dental Office, Smoke Shop, Rock-A-Do Hair Studio, Dollar Diva, and a U.S. Navy
Recruiting Center.
INVESTMENT OVERVIEW
6

DESERT OAKS PLAZA
#
PROPERTY SUMMARY
OFFERING SUMMARY
PROPOSED FINANCING
First Trust Deed
Loan Amount $1,023,000
Loan Type Proposed New
Interest Rate 4.50%
Amortization 25 Years
Loan Term 5 Years
Loan to Value 60%
Debt Coverage Ratio 1.89
THE OFFERING
Property Desert Oaks Plaza
Price $1,705,000
Property Address 3930 West Craig Road,North Las Vegas,NV
SITE DESCRIPTION
Year Built/Renovated 2008
Gross Leasable Area 7620
Ownership Fee Simple
Lot Size 0.57 acre(s)
7
Loan rates are subject to change at any time. Please consult your MMCC representative for more information.
Nick GrayMarcus & Millichap Capital Corporation
3800 Howard Hughes ParkwaySuite 1550
Las Vegas, NV 89169(702) 215‐7100 ext. 7144
(702) 215‐7110 [email protected]
NMLS: 1152363NV: 4096
CA: 01910898

REGIONAL MAP
DESERT OAKS PLAZA
8

LOCAL MAP
DESERT OAKS PLAZA
9

AERIAL PHOTO
DESERT OAKS PLAZA
10

DESERT OAKS PLAZA
11
FINANCIAL
ANALYSIS
FINANCIAL ANALYSIS
DESERT OAKS PLAZA
12
TENANT SUMMARY
12
TENANT SUMMARYFINANCIAL ANALYSIS
DESERT OAKS PLAZA
13
FINANCIAL ANALYSIS
DESERT OAKS PLAZA
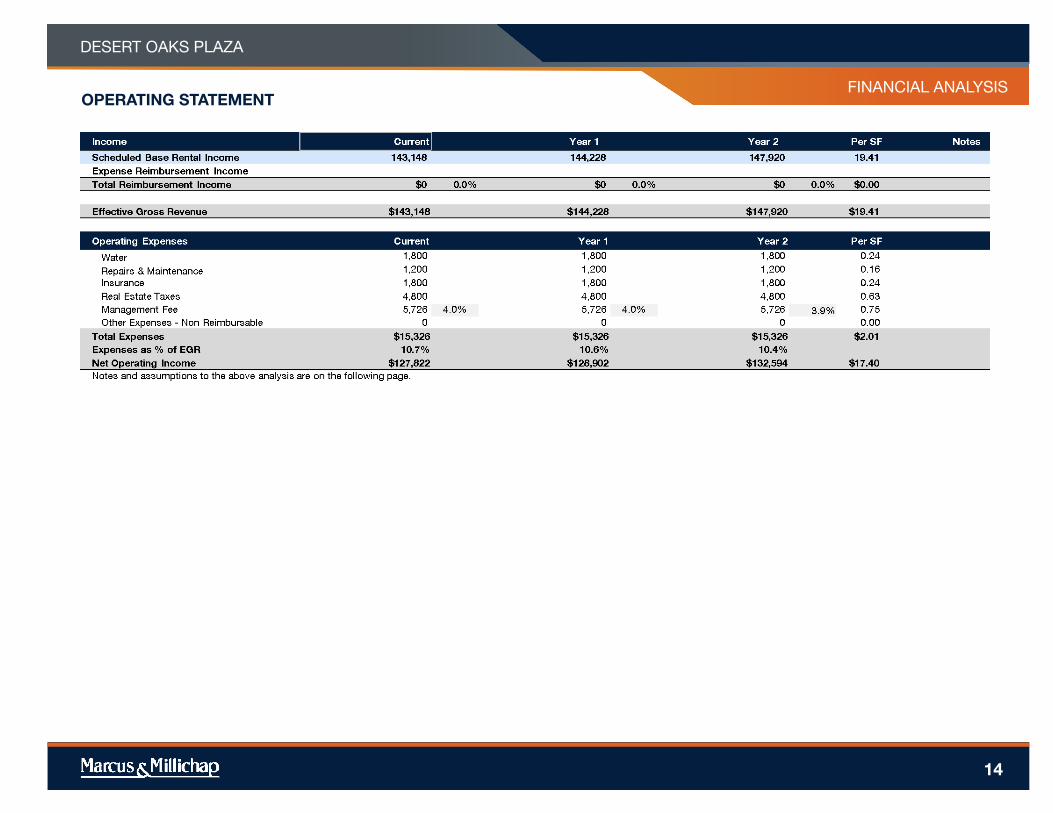
OPERATING STATEMENT
14

FINANCIAL ANALYSIS
DESERT OAKS PLAZA
PRICING DETAIL
15

DESERT OAKS PLAZA
16
MARKET
COMPARABLES

8
DESERT OAKS PLAZA
SALES COMPARABLES MAP
17
DESERT OAKS PLAZA
(SUBJECT)
Pecos Patrick Retail Center
Siegel Plaza
Sahara & Nellis Retail
Center
Sahara Pointe
351 E Silverado Ranch Blvd
Torrey Pines Shopping
Center
Craig Plaza
Southfork Pointe
SALES COMPARABLES
1
2
3
4
5
7
8
6

18
Avg. 7.27%
0
1
2
3
4
5
5
6
7
8
9
Desert
Oaks Plaza
Pecos
Patrick
Retail
Center
Siegel
Plaza
Sahara &
Nellis
Retail
Center
Sahara
Pointe
351 E
Silverado
Ranch Blvd
Torrey
Pines
Shopping
Center
Craig Plaza Southfork
Pointe
Average Cap Rate
PROPERTY NAMEDESERT OAKS PLAZA
COMPARABLES
Avg. $269
$0
$60
$120
$180
$240
$300
$360
$420
$480
$540
$600
Desert
Oaks Plaza
Pecos
Patrick
Retail
Center
Siegel
Plaza
Sahara &
Nellis
Retail
Center
Sahara
Pointe
351 E
Silverado
Ranch Blvd
Torrey
Pines
Shopping
Center
Craig Plaza Southfork
Pointe
Average Price Per Square Foot
SALES COMPARABLES SALES COMPS AVG
PROPERTY NAME
MARKETING TEAM
DESERT OAKS PLAZA
COMPARABLES
rentpropertyname1
rentpropertyaddress1
rentpropertyname1
rentpropertyaddress1
rentpropertyname1
rentpropertyaddress1
19
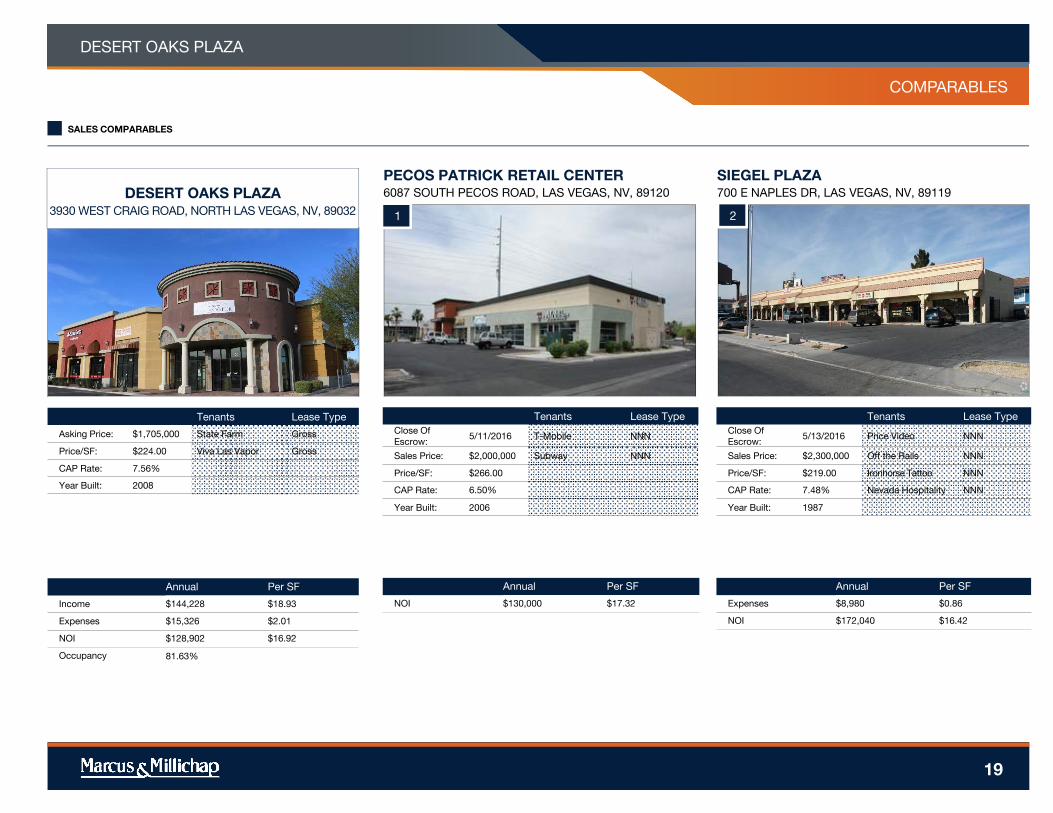
SALES COMPARABLES
Annual Per SF
Income $144,228 $18.93
Expenses $15,326 $2.01
NOI $128,902 $16.92
Occupancy 81.63%
DESERT OAKS PLAZA
3930 WEST CRAIG ROAD, NORTH LAS VEGAS, NV, 89032
Tenants Lease Type
Asking Price: $1,705,000 State Farm Gross
Price/SF: $224.00 Viva Las Vapor Gross
CAP Rate: 7.56%
Year Built: 2008
1
PECOS PATRICK RETAIL CENTER
6087 SOUTH PECOS ROAD, LAS VEGAS, NV, 89120
Annual Per SF
NOI $130,000 $17.32
Tenants Lease Type
Close Of
Escrow:5/11/2016 T-Mobile NNN
Sales Price: $2,000,000 Subway NNN
Price/SF: $266.00
CAP Rate: 6.50%
Year Built: 2006
2
SIEGEL PLAZA
700 E NAPLES DR, LAS VEGAS, NV, 89119
Annual Per SF
Expenses $8,980 $0.86
NOI $172,040 $16.42
Tenants Lease Type
Close Of
Escrow:5/13/2016 Price Video NNN
Sales Price: $2,300,000 Off the Rails NNN
Price/SF: $219.00 Ironhorse Tattoo NNN
CAP Rate: 7.48% Nevada Hospitality NNN
Year Built: 1987
PROPERTY NAME
MARKETING TEAM
DESERT OAKS PLAZA
COMPARABLES
rentpropertyname1
rentpropertyaddress1
rentpropertyname1
rentpropertyaddress1
rentpropertyname1
rentpropertyaddress1
20
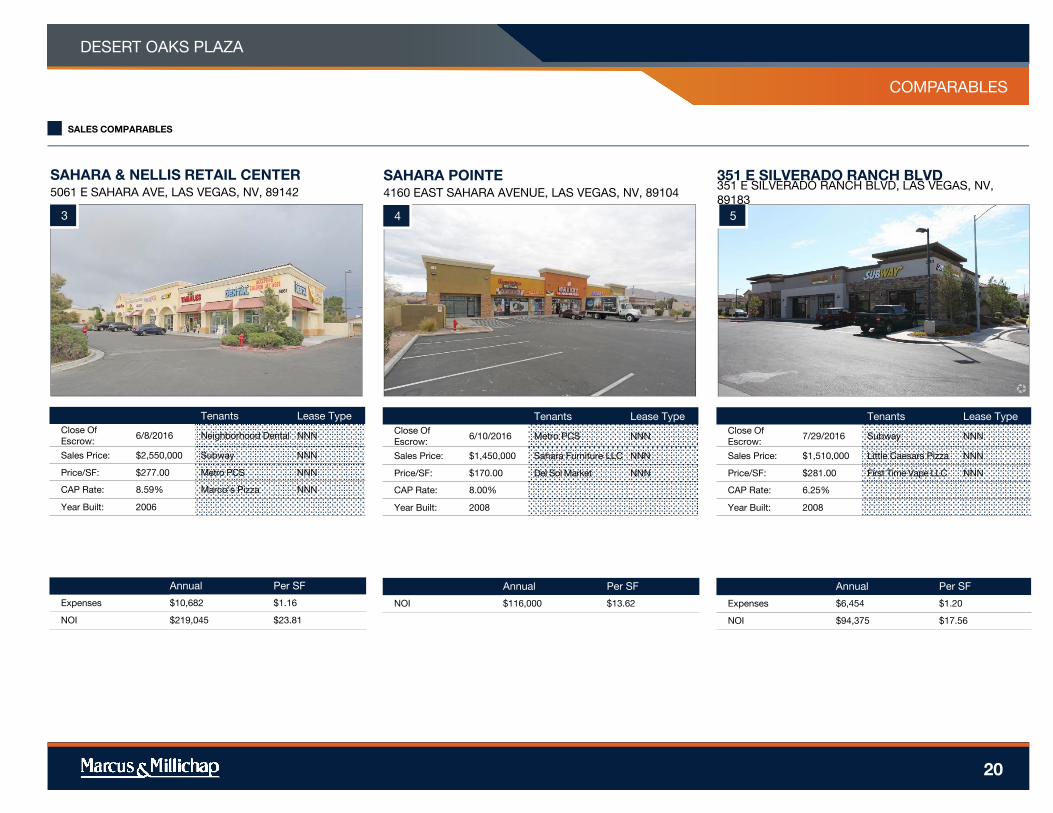
SALES COMPARABLES
3
SAHARA & NELLIS RETAIL CENTER
5061 E SAHARA AVE, LAS VEGAS, NV, 89142
Annual Per SF
Expenses $10,682 $1.16
NOI $219,045 $23.81
Tenants Lease Type
Close Of
Escrow:6/8/2016 Neighborhood Dental NNN
Sales Price: $2,550,000 Subway NNN
Price/SF: $277.00 Metro PCS NNN
CAP Rate: 8.59% Marco's Pizza NNN
Year Built: 2006
4
SAHARA POINTE
4160 EAST SAHARA AVENUE, LAS VEGAS, NV, 89104
Annual Per SF
NOI $116,000 $13.62
Tenants Lease Type
Close Of
Escrow:6/10/2016 Metro PCS NNN
Sales Price: $1,450,000 Sahara Furniture LLC NNN
Price/SF: $170.00 Del Sol Market NNN
CAP Rate: 8.00%
Year Built: 2008
5
351 E SILVERADO RANCH BLVD351 E SILVERADO RANCH BLVD, LAS VEGAS, NV,
89183
Annual Per SF
Expenses $6,454 $1.20
NOI $94,375 $17.56
Tenants Lease Type
Close Of
Escrow:7/29/2016 Subway NNN
Sales Price: $1,510,000 Little Caesars Pizza NNN
Price/SF: $281.00 First Time Vape LLC NNN
CAP Rate: 6.25%
Year Built: 2008

PROPERTY NAME
MARKETING TEAM
DESERT OAKS PLAZA
COMPARABLES
rentpropertyname1
rentpropertyaddress1
rentpropertyname1
rentpropertyaddress1
rentpropertyname1
rentpropertyaddress1
21
SALES COMPARABLES
6
TORREY PINES SHOPPING CENTER
1000 S TORREY PINES DR, LAS VEGAS, NV, 89107
Annual Per SF
Expenses $4,328 $0.74
NOI $110,390 $18.90
Tenants Lease Type
Close Of
Escrow:11/29/2016 Market & Smokes NNN
Sales Price: $1,330,000 New York Pizza & Rib NNN
Price/SF: $228.00 America's Insurance NNN
CAP Rate: 8.30% Pico Barbershops NNN
Year Built: 1966
7
CRAIG PLAZA
2445 W CRAIG RD, NORTH LAS VEGAS, NV, 89032
Annual Per SF
Expenses $6,994 $1.26
NOI $75,600 $13.63
Tenants Lease Type
Close Of
Escrow:12/8/2016 Dollar Loan Center NNN
Sales Price: $1,080,000 B Nails & Spa NNN
Price/SF: $195.00 D L C Empire NNN
CAP Rate: 7.00%
Year Built: 2006
8
SOUTHFORK POINTE
9985 S EASTERN AVE, LAS VEGAS, NV, 89183
Annual Per SF
NOI $228,000 $30.95
Tenants Lease Type
Close Of
Escrow:1/5/2017 Verizon Wireless NNN
Sales Price: $3,800,000 Jimmy John's NNN
Price/SF: $516.00 Wing's Restaurant NNN
CAP Rate: 6.00%
Year Built: 2005
DESERT OAKS PLAZA
22
MARKET
OVERVIEW

MARKET OVERVIEW
Las Vegas-Henderson-Paradise Metro
Market Highlights
Robust employment growth
Nearly 100,000 jobs are forecast to be created through 2020, topping the national rate of growth.
Strong population gains
Over the next five years the metro’s population is expected to expand by 240,000 people,
dramatically outpacing the national growth rate.
Vast tourism industry
Tourism reached an all-time high in 2015 with 42 million visitors, placing Las Vegas among the top
10 of all U.S. cities.
LAS VEGAS
The Las Vegas metro, which comprises Clark County, is situated at the southeastern tip of Nevada. The
county is bordered by the state of California on the southwest and Hoover Dam, the Colorado River
and Lake Mead define the border with the state of Arizona to the east. The city proper is largely
bounded by mountains, government lands and military facilities, limiting developable land. Las Vegas,
the largest city in the county as well as state is know as "the live entertainment capital of the world."
Geography
DESERT OAKS PLAZA
23

MARKET OVERVIEW
Interstates 215 and 515 form a beltway around the Las Vegas metro, facilitating development in outlying
areas. The area is also served by Interstate 15, which stretches from Southern California to Salt Lake
City. U.S. 93 travels south, linking Las Vegas to Interstate 40, and U.S. 95 runs northwest to Reno.
McCarran International Airport, located minutes from the Las Vegas Strip, accommodates about 40
million passengers annually. Other air service is provided by North Las Vegas Airport, Henderson
Executive Airport, Jean Sport Aviation Center and Overton/Perkins Field.
RTC Transit operates the public bus system in Las Vegas, Henderson, North Las Vegas and the suburbs.
In addition, a monorail system connects some of the casinos along the Strip. Union Pacific offers freight
rail service connecting the area directly to California and Salt Lake City, facilitating the region’s
distribution capabilities.
Infrastructure
The Las Vegas Metro is:
270 miles from Los Angeles
285 miles from Phoenix
450 miles from Reno
570 miles from San Francisco
Airports
McCarran International Airport
Four general aviation airports
Major Roadways
Interstates 15, 215 and 515
U.S. 93 and 95
Rail
Freight – Union Pacific
Monorail between the casinos
The Las Vegas metro boasts 2.1 million people, accounting for more than 70 percent of Nevada’s total
population. Henderson, North Las Vegas, Spring Valley and Las Vegas were among the fastest-growing
cities in the United States in recent years. Las Vegas is the most populated city in the metro, with roughly
613,000 persons.
Metro
Largest Areas in Metro by Population
Las Vegas 613,000
Henderson 273,000
Paradise 234,100
North Las Vegas 233,700
Sunrise Manor 199,800
Spring Valley 188,600
* Forecast
Sources: Marcus & Millichap Research Services; U.S. Census
Bureau; Experian
LAS VEGAS
DESERT OAKS PLAZA
24

MARKET OVERVIEW
The Las Vegas economy is diversifying from tourism and gaming. The metro's
business-friendly environment, access to Western markets, large labor force, and
the availability of high speed data attract companies. A powerful data network
being built by Switch is helping to draw tech firms, while lower business costs
and a large skilled labor pool lure back-office operations. In addition, relatively
affordable land compared to other major metros is attracting large logistics and
manufacturing companies.
With all 10 of the nation’s largest hotels located in Las Vegas tourism and gaming
remain the significant drivers for the Las Vegas economy. New additions to the
strip this year will include MGM's 20,000-seat Las Vegas arena and Park
promenade and the Wynn Plaza shopping center will debut next year. Along with
tourism and gaming, conventions also play an integral part in the local economy.
Convention attendance neared 5.9 million delegates in 2015, the third
consecutive year of topping 5 million and providing a significant boost to the local
economy. The Las Vegas Convention Center is one of the largest in the world.
Population-serving sectors of the economy, such as education, healthcare and
retail trade, have grown in importance over the past two decades due to the
population nearly tripling in size. These sectors will continue to have a major roll
as population growth is forecast to exceed the national annual average.
Economy
* ForecastSources: Marcus & Millichap Research Services; Bureau ofEconomic Analysis; Moody’s Analytics; U.S. Census Bureau; Las Vegas Convention and Visitors Authority
LAS VEGAS
DESERT OAKS PLAZA
25

MARKET OVERVIEW
Las Vegas has an employment base of approximately 921,600 jobs. Job growth exceeded the national
expansion rate over the previous five years and this trend is projected to continue through 2020. During this
period, roughly 98,800 nonfarm jobs could be added, an annual increase of 2.1 percent, with all major sectors
expected to post gains. This is much higher than the expected national growth rate of 1.3 percent annually over
the same time period.
While Las Vegas has achieved considerable economic diversification over the past few decades, the leisure
and hospitality sector still provides the dominant share of metro jobs, accounting for 32 percent of total
employment. Growth in this sector is expected to accelerate through 2020, with the creation of nearly 36,000
positions. Given the size and importance of this sector to the region’s economy, such healthy growth in this
segment is an indicator of positive economic conditions going forward.
The improving economy and housing market are moving developments forward. As a result, construction,
which currently comprises 6 percent of area jobs, will be the fastest-growing employment sector in the coming
five years, with gains expected to average 3.7 percent annually. It is followed by financial activities, which will
expand 3.2 percent each year during this time.
Labor
* Forecast
Sources: Marcus & Millichap Research Services; BLS; Moody’s
Analytics
LAS VEGAS
DESERT OAKS PLAZA
26

MARKET OVERVIEW
Resorts and casinos continue to dominate the list of largest private employers in the county, including Wynn Las Vegas, MGM Grand and Caesars Palace.
Back-office operations have become increasingly prevalent in the metro. Factors such as a low cost of living allow major companies to affordably staff call centers and fill
data-entry positions. Office-using employment growth will outpace the national average this year.
Distribution centers and light manufacturing facilities are located throughout the metro. Digitek and Europa Sports have recently opened distribution centers. OfficeMax,
Zappos, Sysco Foods, Pepsi Bottling and Fellowes Manufacturing also maintain local facilities. As the need for industrial space mounts, Las Vegas’ proximity to other
major metros, more affordable land costs and an available labor pool will draw additional distributors.
The Nevada Test and Training Range along with Nellis and Creech Air Force Bases employ more than 10,000 military personnel and 4,000 civilians. Nellis AFB contains
the most squadrons of any Air Force installation. Nellis’ primary role is warfare training, and the base is the home of the United States Air Force Warfare Center, Air
Combat Command.
Employers
Major Employersaa
Wynn Resorts
Station Casinos
MGM Resorts
Las Vegas Sands
Caesars Entertainment
Boyd Gaming
The Valley Health System
Cosmopolitan of Las Vegas
Dignity Health-St. Rose Dominican
United Healthcare of Nevada
* Forecast
Sources: Marcus & Millichap Research Services; BLS; Moody’s
Analytics; Experian
LAS VEGAS
DESERT OAKS PLAZA
27

MARKET OVERVIEW
The Las Vegas metro registered substantial population growth over the last couple of decades and is expected to reach nearly 2.3 million residents over the next five years,
with the addition of 240,000 people during this period. This growth is attracting new businesses, retail and residential options in areas such as Downtown and Summerlin,
where a 400-acre project continues to be developed; the retail phase is already in place.
Las Vegas is not only a popular destination for retirees and vacationers, but families are also drawn to the area for jobs. Roughly 27.0 percent of residents are under the age
of 20, compared with 26.2 percent for the nation. In addition, a greater percentage of the local population is in prime child-bearing years of 25 to 44 than the U.S. Net
migration still accounts for the majority of the county’s population growth. This trend will continue over the decade as Las Vegas’ affordable housing and numerous
employment opportunities attract new residents to the metro.
The median household income in the metro, at $53,400 per year, is slightly below that of $56,100 annually for the nation. The median income level is expected to rise 2.8
percent annually through 2020. The median home price, at $225,100, is slightly below that of the U.S. median of $225,800. Just 53 percent of households own their home,
providing a large rental market.
Demographics
LAS VEGAS
* Forecast
Sources: Marcus & Millichap Research Services; AGS; Experian;
Moody’s Analytics; U.S. Census Bureau
DESERT OAKS PLAZA
28
MARKET OVERVIEW
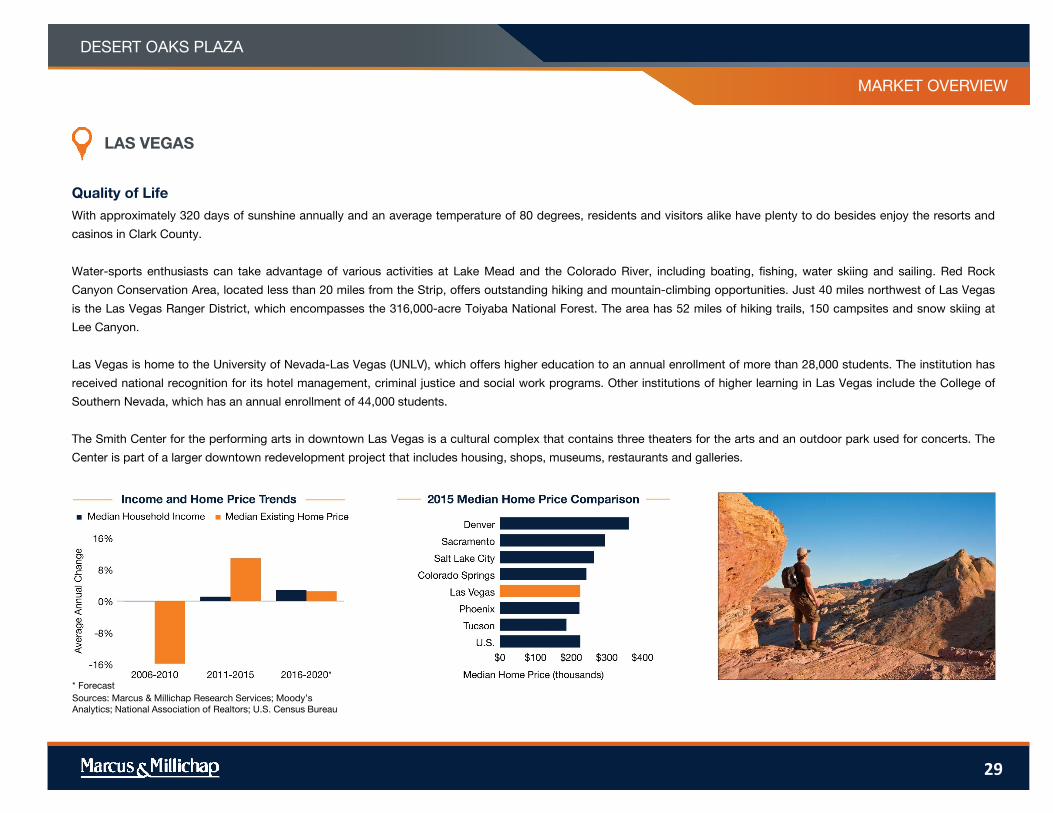
With approximately 320 days of sunshine annually and an average temperature of 80 degrees, residents and visitors alike have plenty to do besides enjoy the resorts and
casinos in Clark County.
Water-sports enthusiasts can take advantage of various activities at Lake Mead and the Colorado River, including boating, fishing, water skiing and sailing. Red Rock
Canyon Conservation Area, located less than 20 miles from the Strip, offers outstanding hiking and mountain-climbing opportunities. Just 40 miles northwest of Las Vegas
is the Las Vegas Ranger District, which encompasses the 316,000-acre Toiyaba National Forest. The area has 52 miles of hiking trails, 150 campsites and snow skiing at
Lee Canyon.
Las Vegas is home to the University of Nevada-Las Vegas (UNLV), which offers higher education to an annual enrollment of more than 28,000 students. The institution has
received national recognition for its hotel management, criminal justice and social work programs. Other institutions of higher learning in Las Vegas include the College of
Southern Nevada, which has an annual enrollment of 44,000 students.
The Smith Center for the performing arts in downtown Las Vegas is a cultural complex that contains three theaters for the arts and an outdoor park used for concerts. The
Center is part of a larger downtown redevelopment project that includes housing, shops, museums, restaurants and galleries.
* Forecast
Sources: Marcus & Millichap Research Services; Moody’s
Analytics; National Association of Realtors; U.S. Census Bureau
Quality of Life
LAS VEGAS
DESERT OAKS PLAZA
29

MARKET OVERVIEW
2016 Retail Forecast
Construction: Builders will bring
610,000 square feet of retail space on
the market this year, the second highest
annual completion total since 2009.
Developers delivered more than 331,000
square feet in 2015, approximately
215,000 square feet of which came
during the second half of the year.
Vacancy: The metrowide vacancy ratewill drop 100 basis points this year to9.5 percent as net absorption reachesthe greatest level in 10 years. Anincrease in the vacancy rate of 30 basispoints was registered in 2015 on netabsorption of nearly 80,000 square feet.
Rents: Following a 2.5 percent rise in2015, the average asking rent in LasVegas will advance 2.5 percent to$16.80 per square feet.
Employment: The local economy will
gain 28,500 jobs in 2016, a 3.1 percent
expansion. Last year, employers in the
metro created 21,300 positions, led by
gains in the education and health
services sector.
DESERT OAKS PLAZA
30
LAS VEGAS METRO AREA
Retail Spending Increasing, Pushing Vacancy to Post-Downturn Best
Intense demand outstrips development, boosting property operations. Tourism dollars and an
expanding local economy will enable the Las Vegas retail market to record vacancy and rent
improvements this year despite healthy construction. Underlying demand in the retail sector is
strong as the metro’s gaming and convention industries continue to attract out-of-town spenders to
the market. Convention attendance in particular is exploding, rising nearly 15 percent year over year.
Additionally, the metrowide workforce has regained all the jobs lost during the recession, with
construction and healthcare fields leading growth. Robust market performance has encouraged
developers to increase their output. Retail construction is on pace for one of the greatest periods of
building since 2009 with projects by Ikea and Restoration Hardware headlining deliveries. The rise in
completions will not hinder the decline of the vacancy rate to a post-recession low. Tight market
conditions amid steady demand will lift rents for the third consecutive year. Despite the increase,
lease rates remain well below the prior peak, indicating plenty of runway for future improvements.
Property operators have kept rent hikes in check in an effort to maintain occupancy. However, as
available space continues to dwindle, well-located retail sites will see steady rent appreciation in the
months to come.
High returns and improving operations drive demand. The convergence of a strong pool of
buyers and a recent upswing in listings has ignited trade activity in the Las Vegas retail market.
Annual deal volume reached a post-recession high this year with both private and institutional
investors becoming more active. Buyer demand remains elevated as intense cap rate compression
in many West Coast markets draws investors to Las Vegas, where returns average in the low-7
percent range. These out-of-town buyers often leverage their considerable access to capital to
target larger, more expensive assets, leaving small to mid-size properties ripe for acquisition. On the
seller side, motivation is largely valuation driven with property owners looking to capitalize on
elevated pricing. Those who list often reinvest into existing retail centers, pay down debt or develop.
increase
in total
employment
610,000
3.1%
sq. ft.
will be
completed
basis point
decrease in
vacancy
100
2.5%
increase
in asking
rents

MARKET OVERVIEW
Economy
Construction
* Forecast
Sources: Marcus & Millichap Research Services; CoStar Group, Inc.
* Forecast
Sources: Marcus & Millichap Research Services; Bureau of Labor
Statistics; Economy.com
DESERT OAKS PLAZA
31
LAS VEGAS METRO AREA
Employers added 16,700 workers in the first half of 2016, contributing to a year-over-year job gain of 26,400
positions. This is a modest slowdown from the previous 12-month period, when Las Vegas establishments
created 34,100 jobs.
Payrolls at building firms are booming as infrastructure improvements and new developments progress
throughout the city. The construction sector expanded 13.7 percent in the past 12 months with approximately
7,000 workers gaining employment. The education and health services sector also registered strong growth,
adding more than 7,400 headcounts in the past year.
The unemployment rate fell 60 basis points in the past four quarters to 6.2 percent at midyear, one of the
lowest points since the recession. In the previous year, the unemployment rate tumbled 140 basis points.
Outlook: In 2016, local employers will add 28,500 jobs, expanding payrolls 3.1 percent year over year. A gain
of 2.4 percent was registered in 2015.
Developers delivered more than 660,000 square feet of retail space in the last 12 months, led by a substantial
influx in the second quarter this year. During the same span one year earlier, 680,000 square feet was
completed.
The Southwest Las Vegas area was the most targeted submarket in the metro, receiving more than 366,600
square feet of space in the past year. Meanwhile, the North Las Vegas submarket garnered the second-most
attention from builders, with nearly 115,000 square feet coming online.
Swedish furniture dealer Ikea opened a 351,000-square-foot location in the first half of 2016 at the corner of
Durango Drive and the 215 Beltway. The completion is far and away the largest development of the past year
and is bringing additional traffic to the Southwest Las Vegas area.
Outlook: Builders will finalize nearly 610,000 square feet of retail space in 2016, an acceleration from 2015.

MARKET OVERVIEW
Vacancy
Rents
* Forecast
Sources: Sources: Marcus & Millichap Research Services;
CoStar Group, Inc.
* Forecast
Sources: Marcus & Millichap Research Services; CoStar Group, Inc.
LAS VEGAS METRO AREA
32
The metrowide vacancy rate slid 100 basis points in the last four quarters, reaching 9.8 percent in June. In the
prior 12-month period, negative net absorption of 367,000 square feet in the first half of 2015 raised the
marketwide vacancy rate 30 basis points to 10.8 percent.
The Downtown Las Vegas submarket is the tightest area in the metro with the vacancy rate falling 70 basis
points in the past year to 3.7 percent. Meanwhile, the Central North Las Vegas submarket recorded the
greatest vacancy contraction, plummeting 210 basis points to 4.8 percent at midyear.
Multi-tenant vacancy improvements outpaced the single-tenant sector for the first time in several quarters.
The vacancy rate for multi-tenant properties fell 100 basis points in the last year on more than 296,000 square
feet of net absorption.
Outlook: Strong demand in the west and southwest will place downward pressure on the vacancy rate, which
is on track to fall 100 basis points to 9.5 percent in 2016, the lowest point since the recession.
The market is finally recording consecutive years of rent improvements after a prolonged recovery kept rent
growth in check. In the last four quarters ending at midyear, the average asking rent advanced 1.5 percent to
$16.38 per square foot. An increase of 2.5 percent was posted in the prior 12-month period.
The Southwest Las Vegas submarket is the most expensive area in the metro with retailers paying an average
of $18.72 per square foot for marketed space. Despite having rents surge 12.6 percent year over year, the
most affordable sites can be found in the Central North Las Vegas area, which has an average asking rate of
$12.16 per square foot.
Falling vacancy for multi-tenant space is spurring rent improvements for strip and shopping centers. In the
past 12 months, the average asking rate jumped 2.8 percent to $17.02 per square foot. The rise built on an 8.0
percent rent increase registered in the prior annual period.
Outlook: Tightening market conditions will support another rent hike in 2016. The average asking rent is on
track to reach $16.80 per square foot, an increase of 2.5 percent. Last year, Las Vegas also registered an
improvement of 2.5 percent.
DESERT OAKS PLAZA

MARKET OVERVIEW
Single-Tenant Sales Trends**
Multi-Tenant Sales Trends**
** Trailing 12-month period through 2Q
Sources: Marcus & Millichap Research Services; CoStar Group, Inc.;
Real Capital Analytics
** Trailing 12-month period through 2Q
Sources: Marcus & Millichap Research Services; CoStar Group, Inc.;
Real Capital Analytics
LAS VEGAS METRO AREA
33
Similar to the single-tenant sector, deal flow for multi-tenant assets surged 64 percent in the last 12 months
and trading occurred throughout the market. In the prior four-quarter period, transaction velocity was
virtually unchanged.
The average price climbed 13.4 percent in the past four quarters to nearly $255 per square foot, marking four
consecutive years of double-digit growth. In 2015, the average price rose 13 percent.
The average cap rate fell 25 basis points in the last four quarters as prices continue to rise. Well-located
grocery-anchored centers with favorable leases will command cap rates in the low- to mid-6 percent range.
Outlook: In the near term, investors looking to capitalize on outsize pricing will continue to bring assets
to market.
Intense demand for single-tenant offerings drove a 48 percent acceleration in deal flow during the last four
quarters. Trades involving fast-food properties were the main reason for the increase in transaction velocity.
Investors heavily targeted the Central East Las Vegas submarket, sparking a doubling in deal volume over the
last year. The Southwest Las Vegas area was also particularly sought after as multifamily development heated
up in the submarket.
The average price rose nominally in the past 12 months with investors paying more than $421 per square foot
at midyear. As a result, cap rates have continued to compress with the average first-year return falling to the
low-7 percent range. Yields remain among the highest in the nation, despite the contraction.
Outlook: The influence of California buyers is still a dominant force in the market. However, local players are
beginning to expand their presence as the Las Vegas economy builds steam.
DESERT OAKS PLAZA

MARKET OVERVIEW
Capital Markets
Local Highlights
DESERT OAKS PLAZA
34
LAS VEGAS METRO AREA
Global capital markets have remained stable over the past few weeks, even as Brexit and the continued devaluation of the Chinese yuan have induced bouts of volatility into
stock and bond markets. Meanwhile, U.S. economic data has proved resilient, with increases in retail sales and steady hiring supporting a measured pace of growth.
Additionally, higher bond prices have lowered prospective yields, boosting the appeal of commercial real estate.
As the current economic cycle has continued, retail vacancy descended to 5.8 percent by the end of the second quarter. A focus on net-leased construction for pre-leased
tenants and mixed-use developments has limited development activity in relation to prior cycles, supporting robust increases in average asking rents. Builders will deliver 46
million square feet of retail space this year, with more than two-thirds of new supply slated as single-tenant structures. This environment will sponsor a fourth straight year of
average asking rent growth, with advancement projected to exceed inflation over the same period.
Capital markets remain highly competitive, with a broad assortment of fixed-rate products available through commercial banks, life-insurance companies and CMBS lenders.
Loans are generally offered at terms up to 10 years at maximum leverage of 65 to 75 percent. For 10-year terms, rates will typically reside in the high-3 to mid-4 percent
range, depending on leverage and underwriting criteria. Floating bridge loans and financing for repositionings are typically underwritten with LTVs above 80 percent, while
pricing at 300 basis points above Libor for recourse deals and extending to 470 basis points above Libor for non-recourse transactions.
The NHL recently approved Las Vegas for an expansion team that will begin play in the 2017-2018 season. The franchise will take the recently opened T-Mobile Arena as its
home ice, bolstering retail and multifamily demand in the surrounding area. The franchise will be the first major sports team to operate in the metro.
Restoration Hardware has a 70,000-square-foot development under construction in the Northwest Las Vegas submarket. RH Gallery is the home-furnishing firm’s newest
design concept and offers customers a larger retail space in which to shop in an attempt to differentiate itself from other competitors like Pottery Barn. Traditional brick-and-
mortar stores are transitioning to focus on consumer experience and atmosphere as they look to compete with the ongoing emergence of e-commerce.
A new Asian-focused boutique resort and casino dubbed Lucky Dragon will open later this year, staking an area near the north end of the Strip. The Lucky Dragon
announced that it plans to hire 800 positions to staff the business, bringing more jobs to the Resort Corridor and bolstering retail offerings in the area.

PROPERTY NAME
MARKETING TEAM
DESERT OAKS PLAZA
DEMOGRAPHICS
Source: © 2016 Experian
Created on February 2017
POPULATION 1 Miles 3 Miles 5 Miles
2020 Projection
Total Population 16,972 178,050 456,842
2015 Estimate
Total Population 15,663 157,122 409,007
2010 Census
Total Population 14,686 145,625 382,533
2000 Census
Total Population 11,253 93,269 267,556
Current Daytime Population
2015 Estimate 10,821 95,618 323,211
HOUSEHOLDS 1 Miles 3 Miles 5 Miles
2020 Projection
Total Households 6,029 59,842 152,697
2015 Estimate
Total Households 5,457 52,444 135,966
Average (Mean) Household Size 2.89 2.95 2.94
2010 Census
Total Households 5,106 48,884 127,989
2000 Census
Total Households 3,869 31,746 91,952
Occupied Units
2020 Projection 6,029 59,842 152,697
2015 Estimate 5,774 57,063 149,577
HOUSEHOLDS BY INCOME 1 Miles 3 Miles 5 Miles
2015 Estimate
$150,000 or More 3.39% 5.21% 5.15%
$100,000 - $149,000 14.92% 13.94% 12.35%
$75,000 - $99,999 16.28% 16.08% 13.41%
$50,000 - $74,999 25.51% 23.92% 20.96%
$35,000 - $49,999 15.09% 14.70% 15.91%
Under $35,000 24.32% 25.31% 31.21%
Average Household Income $70,511 $71,235 $68,019
Median Household Income $61,005 $60,207 $53,153
Per Capita Income $24,591 $23,861 $22,837
HOUSEHOLDS BY EXPENDITURE 1 Miles 3 Miles 5 Miles
Total Average Household Retail Expenditure
$68,139 $68,359 $65,552
Consumer Expenditure Top 10 Categories
Housing $18,402 $18,385 $17,696
Transportation $12,625 $12,749 $12,157
Shelter $11,218 $11,322 $10,968
Food $7,264 $7,326 $7,050
Personal Insurance and Pensions $6,448 $6,439 $5,840
Health Care $4,302 $4,021 $3,818
Utilities $3,665 $3,612 $3,457
Entertainment $3,068 $3,014 $2,832
Cash Contributions $1,960 $1,859 $1,735
Apparel $1,632 $1,686 $1,635
POPULATION PROFILE 1 Miles 3 Miles 5 Miles
Population By Age
2015 Estimate Total Population 15,663 157,122 409,007
Under 20 26.90% 29.23% 29.79%
20 to 34 Years 17.69% 19.77% 20.94%
35 to 39 Years 6.31% 6.89% 6.91%
40 to 49 Years 15.67% 14.82% 14.31%
50 to 64 Years 20.21% 17.83% 17.16%
Age 65+ 13.22% 11.46% 10.87%
Median Age 39.34 35.74 34.47
Population 25+ by Education Level
2015 Estimate Population Age 25+ 10,524 100,667 258,822
Elementary (0-8) 4.99% 4.37% 6.40%
Some High School (9-11) 9.60% 9.01% 10.30%
High School Graduate (12) 30.92% 32.26% 31.64%
Some College (13-15) 31.66% 27.47% 25.11%
Associate Degree Only 8.09% 8.72% 8.03%
Bachelors Degree Only 9.83% 11.32% 11.36%
Graduate Degree 4.11% 5.41% 5.63%
35
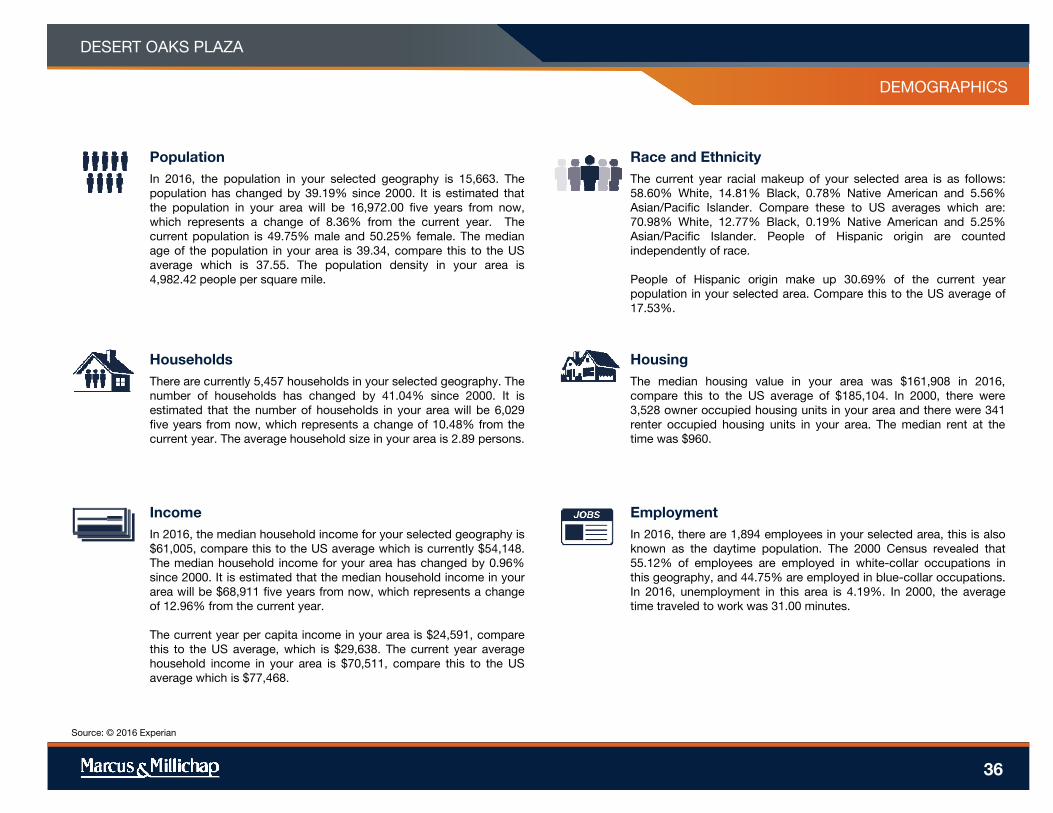
Income
In 2016, the median household income for your selected geography is
$61,005, compare this to the US average which is currently $54,148.
The median household income for your area has changed by 0.96%
since 2000. It is estimated that the median household income in your
area will be $68,911 five years from now, which represents a change
of 12.96% from the current year.
The current year per capita income in your area is $24,591, compare
this to the US average, which is $29,638. The current year average
household income in your area is $70,511, compare this to the US
average which is $77,468.
Population
In 2016, the population in your selected geography is 15,663. The
population has changed by 39.19% since 2000. It is estimated that
the population in your area will be 16,972.00 five years from now,
which represents a change of 8.36% from the current year. The
current population is 49.75% male and 50.25% female. The median
age of the population in your area is 39.34, compare this to the US
average which is 37.55. The population density in your area is
4,982.42 people per square mile.
Households
There are currently 5,457 households in your selected geography. The
number of households has changed by 41.04% since 2000. It is
estimated that the number of households in your area will be 6,029
five years from now, which represents a change of 10.48% from the
current year. The average household size in your area is 2.89 persons.
Employment
In 2016, there are 1,894 employees in your selected area, this is also
known as the daytime population. The 2000 Census revealed that
55.12% of employees are employed in white-collar occupations in
this geography, and 44.75% are employed in blue-collar occupations.
In 2016, unemployment in this area is 4.19%. In 2000, the average
time traveled to work was 31.00 minutes.
Race and Ethnicity
The current year racial makeup of your selected area is as follows:
58.60% White, 14.81% Black, 0.78% Native American and 5.56%
Asian/Pacific Islander. Compare these to US averages which are:
70.98% White, 12.77% Black, 0.19% Native American and 5.25%
Asian/Pacific Islander. People of Hispanic origin are counted
independently of race.
People of Hispanic origin make up 30.69% of the current year
population in your selected area. Compare this to the US average of
17.53%.
PROPERTY NAME
MARKETING TEAM
DESERT OAKS PLAZA
Housing
The median housing value in your area was $161,908 in 2016,
compare this to the US average of $185,104. In 2000, there were
3,528 owner occupied housing units in your area and there were 341
renter occupied housing units in your area. The median rent at the
time was $960.
Source: © 2016 Experian
DEMOGRAPHICS
36