design and analysis of horizontal steam pressure vessel · pdf filedesign and analysis of...
TRANSCRIPT

© 2016 IJEDR | Volume 4, Issue 2 | ISSN: 2321-9939
IJEDR1602380 International Journal of Engineering Development and Research (www.ijedr.org) 2167
Design and Analysis of Horizontal Steam Pressure
Vessel 1Prabir Kumar Santra, 2Prof. Saurabh Kumar
1M.E. ( Pursuing), 2 Associate Professor 1 Mechanical Engineering (Specialization in Thermal Engineering)
Chhattisgarh Swami Vivekanand Technical University Bhilai (C.G.), India
________________________________________________________________________________________________________
Abstract - A pressure vessel is a closed container designed to hold gases or liquids at a pressure and temperature
substantially different from ambient pressure and temperature. The cross-section of the pressure vessel may be circular or
square with flat end covers, reinforced by a gate mechanism on both sides. In the present study the vessel has been
optimized for shape for both circular and square sections by considering stress level on the shell areas and comparative
heat losses for cylindrical and square cross sectional pressure vessel has also been presented. The pressure vessel designed
as per the ASME code Section VIII and then checked for the stress patterns across the walls of vessel for the applied
pressure and temperature. The complete analysis i.e. pressure and thermal tests are carried out using FEA based software
platform (Solidworks 3D design & Analysis platform). At first on the basis of observation it has been tried to compare the
validity of pressure vessel shape. Then tried to reduce the thickness of the shell by applying the same amount of load, so as
to obtain an optimal thickness of pressure vessel. Thus observing both the results we have come to a conclusion to decide
the most valid shape & thickness of shell required for an optimal pressure vessel. The literature survey indicates that so
far many works has been done on different topics & subjects related to pressure vessel optimization by FEA based
technique of analysis, but there are very few works done to compare the optimality of shape of pressure vessel shell by
FEA analysis. The discussion on the results, conclusion & the scope of further work has also been manifested at the end of
the work.
_______________________________________________________________________________________________________
I. INTRODUCTION
1.1 GENERAL
A pressure vessel is a closed container designed to hold gases or liquids at a pressure substantially different from the ambient
pressure. The pressure differential is dangerous and many fatal accidents have occurred in the history of pressure vessel
development and operation. Consequently, pressure vessel design, manufacture, and operation are regulated by engineering
authorities backed by legislation. In general, Pressure vessels are design with ASME Boiler and Pressure Vessel Code, Section
VIII., Division 1 and do not require a detailed evaluation of all stresses. They are used in a wide variety of industries (e.g.,
petroleum refining, chemical, power, pulp and paper, food, etc.) Examples of pressure systems and equipment are boilers and steam
heating systems; pressurized process plant and piping; compressed air systems (fixed and portable);pressure cookers, autoclaves
and retorts; heat exchangers and refrigeration plant; valves, steam traps and filters; pipe work and hoses; and Pressure gauges and
level indicators.
The pressure vessels must design thoroughly because rupture of pressure vessels causes an explosion that may end in loss of
life and property. Implementation of software for designing mechanical equipment facilitate engineer with a comprehensive
analysis either structure analysis or dynamic simulation. Here we study the effect of stresses on vessel walls by changing the shape
from cylindrical to square cross-section. And to consider the optimality of shell thickness by testing on two consecutive thicknesses
& also perform cost analysis of whole setup. Also find insulation material & determine thickness of insulation, so as to avoid
condensation of steam within vessel due to heat transfer from vessel wall to atmosphere.
1.2 TERMINOLOGY
Code: The complete rules for construction of pressure vessels as identified in ASME Boiler and Pressure Vessel Code, Section
VIII, Division 1, Pressure Vessels.
Construction: The complete manufacturing process, including design, fabrication, inspection, examination, hydrotest, and
certification. Applies to new construction only.
Hoop membrane stress: The average stress in a ring subjected to radial forces uniformly distributed along its circumference.
Longitudinal stress: The average stress acting on a cross section of the vessel.
Pressure vessel: A leak-tight pressure container, usually cylindrical or spherical in shape, with pressure usually varying from 15 psi
to 5000 psi.
Stress concentration: Local high stress in the vicinity of a material discontinuity such as a change in thickness or an opening in a
shell.
Weld efficiency factor: A factor which reduces the allowable stress. The factor depends on the degree of weld examination
performed during construction of the vessel.
ASME: American Society of Mechanical Engineers
© 2016 IJEDR | Volume 4, Issue 2 | ISSN: 2321-9939
IJEDR1602380 International Journal of Engineering Development and Research (www.ijedr.org) 2168
DBA: Design by analysis.
FEA: Finite Element Analysis
1.3 OBJECTIVE:
To determine the thickness of shell required for prescribed pressure and temperature. Comparative study for stress analysis
has been made for cylindrical and square cross sectional pressure vessel having same volume. Comparative heat losses for
cylindrical and square cross sectional pressure vessel has also been presented.
1.4 CAUSES:
The pressure differential in pressure vessel is dangerous and many fatal accidents have occurred in the history of pressure
vessel development and operation. So we have to design the shell wall thick enough & check the stress level on shell wall so as to
avoid failure of pressure vessel. Also we should keep in mind that due to heat transfer , there will be condensation of steam inside
vessel, which we have to avoid by placing suitable insulation layer around the vessel exterior walls.
The main causes of failure of a pressure vessel are as follows:
Stress
Faulty Design
Operator error or poor maintenance
Operation above max allowable working pressures
Change of service condition
Over temperature
Safety valve
Improper installation
Corrosion
Cracking
Welding problems
Erosion
Fatigue
Improper selection of materials or defects
Low –water condition
Improper repair of leakage
Burner failure
Improper installation Fabrication error
Over pressurisation
Failure to inspect frequently enough
Erosion
Creep
Embrittlement
Unsafe modifications or alteration
Unknown or under investigation
1.5 PROBLEM IDENTIFICATION:
The main intention behind this project is to determine stress level on the shell wall & flat end faces of pressure
vessel. If the stress values are large enough & cross the limitation of allowable stress values of material of vessel, we then check for
the appropriate thickness of shell wall at which the probability of failure of pressure vessel shell wall due to stress are less.
Solving the model by FEM with Solidworks simulation platform after every change in thickness of shell wall ,we calculate the
longitudinal , hoop stresses or Von-Mises stress over the shell & verify whether the stress values or deformation minimize with the
increase in thickness of shell.
Also we study the effect of stresses on vessel walls by changing the shape from cylindrical to square cross-section. In square
cross-section, there will be stress concentration at the corners.
We also need to compare rate of heat transfer from the shell wall to the surroundings on both cylindrical and square cross
sections by determining the temperature gradients within the thickness of shell and insulation. As with the heat transfer from the
shell wall, the inside steam temperature reduces below saturation temperature, consequently condensation of steam occur.
1.6 JUSTIFICATION OF RESEARCH WORK:
There are many reasons behind failure of pressure vessels. But the most prominent cause of failure are improper
selection of materials of shells & door systems, inadequate thickness of shell & door mechanism, wrong estimation of pressure
level & temperature range for safe working & ultimately incomplete conclusions about the stresses generate at different locations of
vessel, faulty design of shape of vessel, welding problems, unsafe modifications or alteration. In this research work we have

© 2016 IJEDR | Volume 4, Issue 2 | ISSN: 2321-9939
IJEDR1602380 International Journal of Engineering Development and Research (www.ijedr.org) 2169
included these considerations & tried to solve these problems by standard methods of design prescribed by A.S.M.E. We have also
used D.B.A (Design by Analysis) method to justify our research work.
1.7 BENEFIT OCCURS FROM THIS RESEARCH WORK:
The main benefit occur from this research work is that we can observe the behavior of vessel under pressure &
temperature constraint for different thicknesses of vessel material, vessel shape. We can also identify the prominent failure areas of
vessel & determine the condition of welds around joints. Thus we can easily conclude the design defects. To avoid these defects we
can make suitable modifications on vessel & thus optimize the design data. We have followed both design procedure of ASME as
well as Design By Analysis method which increased the accuracy of design.
1.8 LIMITATIONS OF RESEARCH WORK:
The main drawbacks in different FEA based research works are that we always have to compare the results from
simulation with practical exposures & analytical results. The main reason behind this is that, the results of simulations & their
accuracy totally depend on right application of simulation tools & exact knowledge of the different parameters used to define &
simulate practical conditions of the job. The result of simulation may change with wrong estimation and application and lack of
knowledge, for the same observation.
II. METHODOLOGY
2.1 DETERMINING THE WALL THICKNESS APPROPRIATE FOR THE SAFE STRESS LEVELS ON SHELL WALLS & END DOOR
MECHANISM:-
Category of vessel- Thin shell (t/d= 0.005<0.05)
Pressure vessel with Flat ends
Stresses induced :-
σC = pd
2t (Circumferential or Hoop stress)
σL = pd
4t (Longitudinal stress)
In a cylindrical shell, at any point on it’s circumference, there is a set of 2 mutually perpendicular stresses σC & σL, which are
principal stresses. So maximum shear stress is :-
τmax = σc−σl
2 =
pd
8t
Design criteria :- Since σC is maximum, so shell is designed on this stress basis.
σC = pd
2t ≤ σt (σt is the permissible tensile stress of shell material)
t ≥ pd
2σt
According to “ASME Section VIII, Division 1, paragraph UG-27”
For longitudinal welded joints on shell
When, < 0.385SE:
t = (PR)
(SE − 0.6P) , we can determine minimum required thickness from assumed value of size of pressure vessel (i.e.,
Diameter), material & design pressure
P = (S E t)
(R + 0.6t) , We can determine the pressure limit of vessel for the chosen design shell Thickness.
Starting with design wall thickness & then vary thickness to reach the safe stress levels on shell walls & end door mechanism.
After checking the thickness of vessel for the prescribed stress, we have to check the stress level at the end door mechanism. After
thorough examination & observation, we have to accept the shell thickness having safe stress levels.
The design of pressure vessel and its components is done using ASME SEC. VIII Div I code. Here, we have not used the ASME
codes completely for designing & only used the codes to start with initial assumptions. But we rely on the results of observation
obtained from FEA analysis to choose the correct combination of thickness of shell & the shape of shell.
2.2 3D CAD SOLIDWORKS:-
Solidworks mechanical design automation software is a feature-based parametric solid modeling design tool which takes advantage
of the easy to learn Windows graphical user interface. You can create fully associative 3-D solid models with or without constraints
while utilizing automatic or user defined relations to capture design intent.
1. FEATURE-BASED

© 2016 IJEDR | Volume 4, Issue 2 | ISSN: 2321-9939
IJEDR1602380 International Journal of Engineering Development and Research (www.ijedr.org) 2170
Just as an assembly is made up of a number of individual pieces parts, a Solidworks model is also made up of individual
constituent elements. These elements are called Features.
When you create a model using the Solidworks software, you work with intelligent, easy to understand geometric features such as
bosses, cuts, holes, ribs, fillets, chamfers and drafts. As the feature are created they are applied directly to work piece.
Features can be classified as sketched or applied:-
Sketched features: Based upon a 2-D sketch. Generally that sketch is transformed into a solid by extrusion, rotation,
sweeping or lofting.
Applied Features: Created directly on solid model. Fillets and chamfers are example of this type of feature.
The Solidworks software graphically shows you the feature based structure of your model in a special window called the Feature
Manager design tree. The Feature Manager design tree not only shows you the sequence in which features were created, it gives
you easy access to all the underlying associated information.
2. PARAMETRIC:-
The dimensions and relations used to create a feature are capture and stored in the model. This is not only enables you to capture
your design intent, it also enables you to quickly and easily make changes to model.
Driving dimensions: These are dimensions used when creating a feature. They include the dimensions associated with the
sketch geometry, as well as those associated with the feature itself. A simple example of this would be a feature like
cylindrical boss. The diameter of the boss is controlled by the diameter of sketched circle. The height of the boss is
controlled by the depth to which that circle was extruded when the feature was made.
Relations: These include such information as parallelism, tangency and concentricity. Historically this type of information
has been communicated on drawings via feature controlled symbols. By capturing this in the sketch, Solidworks enables
you to fully capture your design intent upfront, in the model.
3. 3D SOLID MODELING OVERVIEW
A solid model is the most complete type of geometric model used in the CAD systems. It contains all the wireframe and surface
geometry necessary to fully describe the edges and faces of the model. In addition to the geometric information, it has the
information called topology that relates the geometry altogether. An example of topology would be which faces (surfaces) meet at
which edge (curve). This intelligence makes operations such as filleting an easy as selecting an edge and specifying a radius.
3D solid modeling with SOLIDWORKS speeds the creation of complex parts and large assemblies. Creating 3D solid models of
your designs instead of 2D drawings:
speeds design development and detailing
improves visualization and communication
eliminates design interference issues
checks design functionality and performance (without the need for physical prototypes)
automatically provides manufacturing with 3D solid models that are required when programming CNC machine tools and
rapid prototyping equipment
With SOLIDWORKS automatic drawing updates, you don’t have to worry about modifications.
All 2D drawing views are automatically created from, and linked to, the 3D solid model. If the
3D solid model is modified, the 2D drawing views and details automatically update. This
automatic associativity means that the solid model is always synchronized with your 2D
documentation.
Key SOLIDWORKS 3D solid modeling features enable you to:
Create 3D solid models of any part and assembly, no matter how large or complex
Keep all 3D models, 2D drawings, and other design and manufacturing documents synchronized with associativity that
automatically tracks and makes updates
Quickly make variations of your designs by controlling key design parameters
Directly edit your model by simply clicking and dragging model geometry
Generate surfacing for any 3D geometry, even complex organic and stylized shapes
Instantly analyze your 3D model for any solid mass properties and volume (mass, density, volume, moments of inertia,
and so forth)
2.3 FINITE ELEMENT MODELING AND ANALYSIS PROCESS OF PRESSURE VESSEL:-
FINITE ELEMENT MODELING
SOLIDWORKS Simulation uses the displacement formulation of the finite element method to calculate component displacements,
strains, and stresses under internal and external loads. The
geometry under analysis is discretized using tetrahedral (3D), triangular (2D), and beam elements, and solved by either a direct
sparse or iterative solver. SOLIDWORKS Simulation also offers the 2D simplification assumption for plane stress, plane strain,
extruded, or axisymmetric options. SOLIDWORKS Simulation can use either an h or p adaptive element type, providing a great
advantage to designers and engineers as the adaptive method ensures that the solution has converged.

© 2016 IJEDR | Volume 4, Issue 2 | ISSN: 2321-9939
IJEDR1602380 International Journal of Engineering Development and Research (www.ijedr.org) 2171
In order to streamline the model definition, SOLIDWORKS Simulation automatically generates a shell mesh (2D) for the following
geometries:
SHEET METAL BODY:
SOLIDWORKS Simulation assigns the thickness of the shell based on the 3D CAD sheet metal thickness, so Product Designers
can leverage the 3D CAD data for Simulation purposes.
SURFACE BODY:
For shell meshing, SOLIDWORKS Simulation offers a productive tool, called the Shell Manager, to manage multiple shell
definitions of your part or assembly document. It improves the workflow for organizing shells according to type, thickness, or
material, and allows for a better visualization and verification of shell properties.
SOLIDWORKS Simulation also offers the 2D simplification assumption for plane stress, plane strain, extruded, or axisymmetric
options.
Product Engineers can simplify structural beams to optimize performance in Simulation to be modeled with beam elements.
Straight, Curved, and tapered Beams are supported. SOLIDWORKS Simulation automatically converts structural members that are
created as weldment features in 3D CAD as beam elements for quick setup of the simulation model.
SOLIDWORKS Simulation can use either an h or p adaptive element type, providing a great advantage to designers and engineers,
as the adaptive method ensures that the solution has converged. Product Engineers can review the internal mesh elements with the
Mesh Sectioning Tools to check the quality of the internal mesh and make adjustments to mesh settings before running the study.
Users can specify local mesh control at vertices, edges, faces, components and beams for a more accurate representation of the
geometry.
Integrated with SOLIDWORKS 3D CAD, finite element analysis using SOLIDWORKS Simulation knows the exact geometry
during the meshing process. And the more accurately the mesh matches the product geometry, the more accurate the analysis
results will be.
FINITE ELEMENT ANALYSIS (FEA)
Since the majority of industrial components are made of metal, most FEA calculations involve metallic components. The analysis
of metal components can be carried out by either linear or nonlinear stress analysis. Which analysis approach you use depends upon
how far you want to push the design:
If you want to ensure the geometry remains in the linear elastic range (that is, once the load is removed, the component returns to
its original shape), then linear stress analysis may be applied, as long as the rotations and displacements are small relative to the
geometry. For such an analysis, factor of safety (FoS) is a common design goal.
Evaluating the effects of postyield load cycling on the geometry, a nonlinear stress analysis should be carried out. In this case, the
impact of strain hardening on the residual stresses and permanent set (deformation) is of most interest.
The analysis of nonmetallic components (such as, plastic or rubber parts) should be carried out using nonlinear stress analysis
methods, due to their complex load deformation relationship. SOLIDWORKS Simulation uses FEA methods to calculate the
displacements and stresses in your product due to operational loads such as:
Forces
Pressures
Accelerations
Temperatures
Contact between components
Loads can be imported from thermal, flow, and motion Simulation studies to perform multiphysics analysis.
MESH DEFINITION
SOLIDWORKS Simulation offers the capability to mesh the CAD geometry in tetrahedral (1st and 2nd order), triangular (1st and
2nd order), beam, and truss elements. The mesh can consist of one type of elements or multiple for mixed mesh. Solid elements are
naturally suitable for bulky
models. Shell elements are naturally suitable for modeling thin parts (such as sheet metals), and beams and trusses are suitable for
modeling structural members.
As SOLIDWORKS Simulation is tightly integrated inside SOLIDWORKS 3D CAD, the topology of the geometry is used for mesh
type:
Shell mesh is automatically generated for sheet metal model and surface bodies
Beam elements are automatically defined for structural members
So their properties are seamlessly leveraged for FEA.
To improve the accuracy of results in a given region, the user can define Local Mesh control for vertices, points, edges, faces, and
components.
SOLIDWORKS Simulation uses two important checks to measure the quality of elements in a mesh:
Aspect Ratio Check
Jacobian Points
In case of mesh generation failure, SOLIDWORKS Simulation guides the users with a failure diagnostics tool to locate and resolve
meshing problems. The Mesh Failure Diagnostic tool renders failed parts in shaded display mode in the graphics area.
ANALYSIS PROCESS :-
A. PRE-PROCESSING
Pre-processing comprises of building, meshing and loading the model created.
© 2016 IJEDR | Volume 4, Issue 2 | ISSN: 2321-9939
IJEDR1602380 International Journal of Engineering Development and Research (www.ijedr.org) 2172
Define type of Analysis.
Solidworks provide wide variety of analysis for real life problem for mechanical and other engineering problems. Static Structural
analysis is used for solving current problem.
Define Engineering Data for Analysis.
The material that is considered for the shell as well as nozzle is SS304; it is having mechanical properties like young’s modulus of
193-200MPa
Define Boundary Condition for Analysis.
All the degrees of freedom of the pressure vessel are arrested at the right side edges at shell and head joint location for all models of
pressure vessel under study throughout the thesis.
The magnitude of the pressure considered for at all internal faces.
Mesh Statics:
Type of Element : Tetrahedrons
B. SOLVING THE MODEL:
With all parts of the model defined, nodes, element, restraints and loads, the analysis part of the model is ready to begin. The
system can determine approximately the values of stresses, deflection, temperature, pressure and vibration.
An analysis requires the following information:
Nodal point
Element connecting the nodal points
Material and its physical properties
Boundary conditions, which consists of loads and constraints
Analysis options: how the problem will be evaluated
C. POST-PROCESSING:
The post-processing task displays and studies the result of an analysis, which exists in the model as analysis data sets. This task can
generate displays of stress contours, deformed geometry, etc.
Assumptions for Finite Element Analysis of pressure vessel:
Analysis type taken is static structural while neglecting effect of loading and boundary condition with time.
Only internal pressure is considered as load while neglecting all External loads.
2.4 ASME BOILER AND PRESSURE VESSEL CODE (BPVC) (UG27) FORMULAS ARE:
Cylindrical shells:
σθ = p(r+0.6t)
tE , σl =
p(r−0.4t)
2tE
where E is the joint efficient, and all others variables as stated above.
The factor of safety is often included in these formulas as well, in the case of the ASME BPVC this term is included in the material
stress value when solving for pressure or thickness.
2.5 THERMAL STRESSES DUE TO THERMAL TRANSIENTS :-
The thermal gradient is that which existed under steady-state conditions; i.e., it is independent of time. In order to reach the
equilibrium thermal conditions from an initial uniform temperature, a transient thermal gradient, changing with time first occurs.
For instance, if cylinder had an initial uniform temperature & beginning with time, t=0, The inside surface is maintained at
temperature Ta, the transient thermal gradients throughout the wall after various time intervals tn are represented by a curve as they
approach steady-state condition. From such curves the mean temperature of the whole cylinder wall & also that of the inner portion
of radius r can be determined. The thermal stresses can be found for any interval with these temperatures. For a very small time
interval t=0, the mean temperature approaches zero, & at surface,
σt = αET
1−μ
This is the numerical maximum thermal stress produced in heating a cylinder. It is equal to the stress necessary to restrict
completely the thermal expansion of the surface. The Tangential stress at any point can then be written:
σt = αE
1−μ [(Mean temperature of the entire cylindrical wall thickness) + (
1
2 the mean temperature with in the cylinder of radius r) –
(Temperature of desired stress location)]
“JOHN F. HARVEY, PUBLISHED BY VAN NOSTRAND REINHOLD COMPANY INC., NEWYORK”
2.6 MAXIMUM ALLOWABLE WORKING PRESSURE
When the thickness of the shell does not exceed one half of the inside radius, the maximum allowable working pressure on the
cylindrical shell of a steam boiler,pressure vessel or drum shall be determined by the strength of the weakest course computed from
the thickness of the plate, the efficiency of the longitudinal joint, or of the ligament between openings (whichever is the least), the
inside radius of the course, and the maximum allowable unit working stress.
P = (S E t)/(R + 0.6t) or t = PR/(SE − 0.6P)
Where,
P = maximum allowable working pressure, pounds per square inch,
© 2016 IJEDR | Volume 4, Issue 2 | ISSN: 2321-9939
IJEDR1602380 International Journal of Engineering Development and Research (www.ijedr.org) 2173
S = maximum allowable unit working stress, pounds per square inch, from Table P7,A.S.M.E. except for shells or headers of
seamless or fusion welded construction exceeding 1/2 inch in thickness, which shall be built under the provisions of A.S.M.E.,
E = efficiency of longitudinal joints or of ligaments between openings:for rivetted joints calculated riveted efficiency; for fusion
welded joints efficiency specified in A.S.M.E.; for seamless shells 100 percent (unity); for ligaments between openings, the
efficiency shall be calculated by the rules given in A.S.M.E.,
t = minimum thickness of shell plates in weakest course, inches,
R = inside radius of the weakest course of the shell or drum, inches.
The maximum allowable working pressure for shells other than cylindrical, and for heads and
other parts, shall be determined in a similar manner using the formulas appropriate for the parts,
as otherwise given in the A.S.M.E. Code or some other acceptable formula.
“N.S. REG. 218/2008”
III OBSERVATION & ANALYSIS
3.1 INTRODUCTION:-
Implementation of software for designing mechanical equipment facilitate engineer with a comprehensive analysis
either structure analysis or dynamic simulation. Finite Element Analysis of a thin walled pressure vessel under simultaneous
thermal & pressure loading is investigated using simulation based method by FE-based computer code Solidworks cosmos. The
Von-Mises yield criterion has been used to determine the distribution of stress intensity.
Here we study the effect of stresses on vessel walls by changing the shape from cylindrical to square cross-section.
Also find insulation material performance, so as to avoid condensation of steam within vessel due to heat transfer from vessel wall
to atmosphere.
3.2 CIRCULAR SECTION :-
3.2.1 ASSUMPTIONS & BOUNDARY CONDITIONS :-
Here the vessel has the following design characteristics :
Inside volume – 1.178 mt3
Shell:
Inside diameter of shell – 1mt
Length – 1.5mt
Shell material – SS304
( Yield strength – 206807kpa)
Fluid inside pressure vessel – Steam
Working pressure – 150kpa (1.5 kg/cm2)
Working temperature – 125 °c
Insulation material – Glass wool
Weld condition – Fillet weld double sided
For shell area we used filler material SS304 to weld the joints.
For other parts made of mild steel, we used mild steel as filler material to weld the joints.
For better weld we have used CO2 – MIG welding in place of conventional arc welding in order to prevent from weak porous weld
section of arc welding.
Type – Horizontal circular pressure vessel with flat ends having door mechanisms on both ends.
Thin shell (t/d = 0.005 < 0.05)
Shell sheet thickness –
From Table P7,A.S.M.E.
By taking material AISI304 (SS304) equivalent to SA-240
Yield strength = 206807000pa i.e. 206 Mpa i.e. 29994.8psi
Allowable stress(S) = 20000psi = 20000*6.89476 = 137895.2kpa
(Longitudinal butt welded joint efficiency factor for non-radiographed weld) E = 0.7
So, 0.385SE = 0.385×137895.2×0.7 = 37162.75kpa
(Working pressure) P = 150kpa < 0.385SE
From ASME Section VIII, Division 1, paragraph UG-27,
(Minimum design wall thickness of shell plates ) t = (PR)
(SE − 0.6P)
= 150×500
137895.2×0.7−0.6×150 = 0.777mm
Taking design shell thickness = 4mm > Minimum design wall thickness of shell plates
To determine the pressure limit of vessel for the chosen design shell thickness,
(Maximum allowable working pressure or design pressure )P = (2SEt)
(R − 0.4t)
= 2×137895.2×0.7×4
500−0.4×4 = 1549.38kpa > 150kpa (Working pressure)

© 2016 IJEDR | Volume 4, Issue 2 | ISSN: 2321-9939
IJEDR1602380 International Journal of Engineering Development and Research (www.ijedr.org) 2174
3.2.2 PART DESCRIPTION :-
Shell body, Top & Bottom cover, Flanges, Flat end reinforcements for both ends, Reinforcement bars, Insulation, Patch plate,
Neoprene rubber gasket.
Fig 3.1 Cylindrical pressure vessel model description
3.2.3 PRESSURE LOADING :-
Here on shell of thickness 4mm, with pressure loading on cylindrical vessel, we have a region of stress concentration around the
vertical joint of shell. In other cylindrical areas there is minimal effect of stress.
In the graph showing Von-mises stress on different nodal points on the joint area gives a steep increment in stress values.
In Deformation plot, we have deformation around joint area by 5.5mm.
3.2.4 THERMAL LOADING :-
On Thermal plot, we have 400°k temperature inside shell & temperature goes on reducing through outside insulator surface.

© 2016 IJEDR | Volume 4, Issue 2 | ISSN: 2321-9939
IJEDR1602380 International Journal of Engineering Development and Research (www.ijedr.org) 2175
In Temperature gradient plot, we have no sign of temperature difference on 4mm shell while on other parts like top covers, gate
mechanism & insulator we have clear indication of large temperature gradient.
Fig 3.2 Von-Mises stress distribution on pressure vessel due to pressure loading.
The above figure is showing that Von- Mises stress mainly concentrate at the vertical welded joint of shell & around the middle of
top & bottom cover, on the other hand there are no traces of stress concentration on other parts of shell. Due to these stresses the
shell tries to buckle around the welded joint with a camber formation & consequently the weld will fail & tear around the joints.
The graph is drawn based on the data points taken on stress concentrated area on one side of welded joint which show us a steep
increase of stress values.
Fig 3.3 Von-Mises stress distribution at different location of nodal point near the shell joint.
Fig 3.4 Graph for Von-Mises stress distribution at different location of nodal point near the shell joint.

© 2016 IJEDR | Volume 4, Issue 2 | ISSN: 2321-9939
IJEDR1602380 International Journal of Engineering Development and Research (www.ijedr.org) 2176
Table 3.1 Von-Mises stress distribution at different location of nodal point near the shell joint.
Fig 3.5 Deformation plot on pressure vessel due to pressure loading.

© 2016 IJEDR | Volume 4, Issue 2 | ISSN: 2321-9939
IJEDR1602380 International Journal of Engineering Development and Research (www.ijedr.org) 2177
Fig 3.6 Graph of Deformation plot on pressure vessel due to pressure loading.
Table 3.2 Deformation at different nodal point on pressure vessel due to pressure loading.
On above figure of deformation plot, we can easily notice that a maximum deformation of 5.5 mm is registered around the welded
joint which means a total failure of the welded joint. Again we have taken a no. of data points around the joint at different nodes
showing a steep increase in deflection around joint both in graph & table.

© 2016 IJEDR | Volume 4, Issue 2 | ISSN: 2321-9939
IJEDR1602380 International Journal of Engineering Development and Research (www.ijedr.org) 2178
Fig 3.7 Stress intensity plot on pressure vessel due to pressure loading.
Fig 3.8 Graph for Stress intensity plot on different nodal point of pressure vessel due to pressure loading.
Table 3.3 Stress intensity values on different nodal point of pressure vessel due to pressure loading.

© 2016 IJEDR | Volume 4, Issue 2 | ISSN: 2321-9939
IJEDR1602380 International Journal of Engineering Development and Research (www.ijedr.org) 2179
On above figure of stress intensity plot, we can easily notice that a maximum value of stress intensity of 292.7 MPa is registered
around the welded joint which is sufficient to buckle the shell around welded joint. Again we have taken a no. of data points around
the joint at different nodes showing jumps in stress intensity values around joint both in graph & table.
Fig 3.9 Design insight plot on pressure vessel due to pressure loading.
On above figure shows the Design Insight plot available in Solidworks design platform which shows the sequence of effected areas
on vessel. Here also the affected area is around the vertical welded joint.
On stress plot due to temperature, we have stress concentration around areas like joint of shell, shell neck, top cover & gate
mechanism.

© 2016 IJEDR | Volume 4, Issue 2 | ISSN: 2321-9939
IJEDR1602380 International Journal of Engineering Development and Research (www.ijedr.org) 2180
Fig 3.10 Temperature plot on pressure vessel due to thermal loading.
Fig 3.11 Temperature plot on different nodal point of pressure vessel due to thermal loading.
Fig 3.12 Graph of Temperature plot on different nodal point of pressure vessel due to thermal loading.
Table 3.4 Temperature plot on different nodal point of pressure vessel due to thermal loading.

© 2016 IJEDR | Volume 4, Issue 2 | ISSN: 2321-9939
IJEDR1602380 International Journal of Engineering Development and Research (www.ijedr.org) 2181
On above figure of Temperature plot, graph & table maximum temperature is at shell, top & bottom cover. Minimum temperature
is at Flat end reinforcement & at outer layer of insulation cover.
Fig 3.13 Temperature gradient plot on pressure vessel due to thermal loading.
Fig 3.14 Temperature gradient plot on different nodal point of pressure vessel due to thermal loading.

© 2016 IJEDR | Volume 4, Issue 2 | ISSN: 2321-9939
IJEDR1602380 International Journal of Engineering Development and Research (www.ijedr.org) 2182
Fig 3.15 Graph of Temperature gradient plot on different nodal point of pressure vessel due to thermal loading.
Table 3.5 Temperature gradient plot on different nodal point of pressure vessel due to thermal loading.
On figure it is easily seen that minimum temperature gradient present at shell & maximum at insulation, top & bottom cover, flat
end reinforcements. On graph & table we have taken a no. of data points on shell, where temperature gradient value is zero.

© 2016 IJEDR | Volume 4, Issue 2 | ISSN: 2321-9939
IJEDR1602380 International Journal of Engineering Development and Research (www.ijedr.org) 2183
Fig 3.16 Von-Mises stress distribution on pressure vessel due to thermal stress.
Fig 3.17 Von-Mises stress distribution on middle of pressure vessel shell due to thermal stress.

© 2016 IJEDR | Volume 4, Issue 2 | ISSN: 2321-9939
IJEDR1602380 International Journal of Engineering Development and Research (www.ijedr.org) 2184
Fig 3.18 Graph of Von-Mises stress distribution on middle of pressure vessel shell at different nodal point due to thermal stress.
Table 3.6 Von-Mises stress distribution on middle of pressure vessel shell at different nodal point due to thermal stress.
Figure, graph & table shows that on stress plot due to temperature, in shell we clearly see that maximum stress present at welded
joint & around patch plate covering the welded joint. On other parts also there present significant stress values due to temperature.

© 2016 IJEDR | Volume 4, Issue 2 | ISSN: 2321-9939
IJEDR1602380 International Journal of Engineering Development and Research (www.ijedr.org) 2185
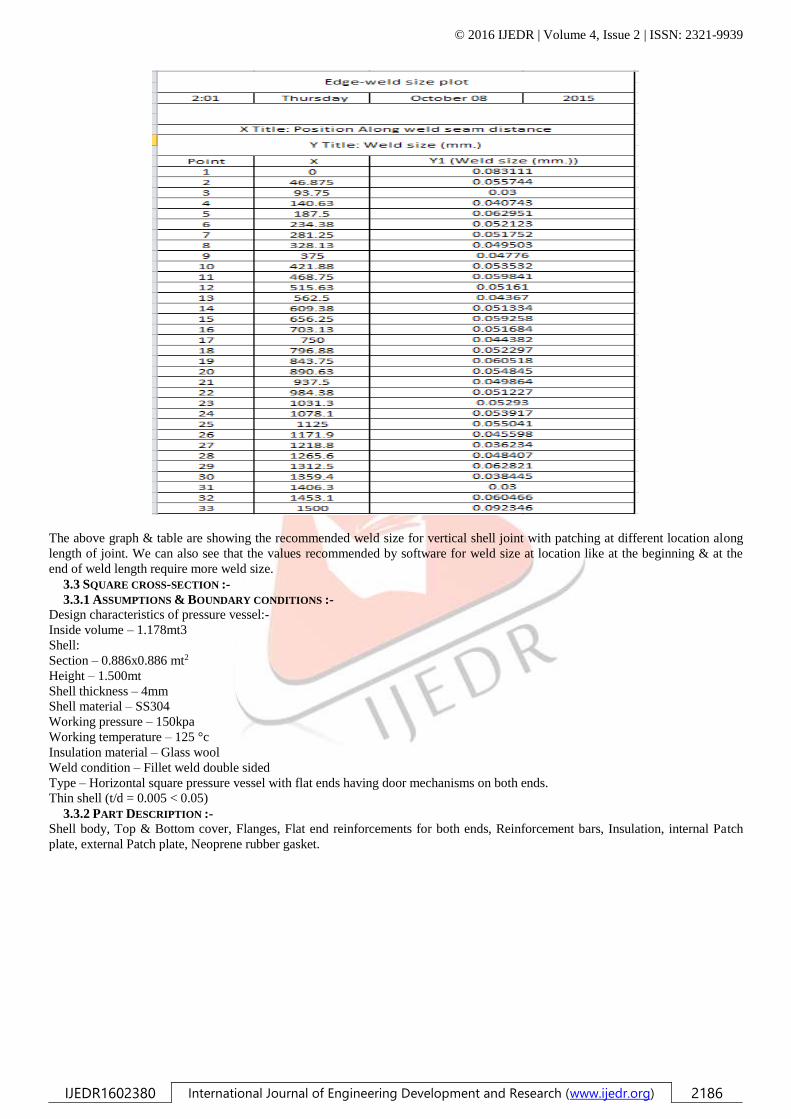
Fig. 3.19 Graph of Weld size on different position along weld seam distance.
Table. 3.7 Weld size on different position along weld seam distance.
© 2016 IJEDR | Volume 4, Issue 2 | ISSN: 2321-9939
IJEDR1602380 International Journal of Engineering Development and Research (www.ijedr.org) 2186
The above graph & table are showing the recommended weld size for vertical shell joint with patching at different location along
length of joint. We can also see that the values recommended by software for weld size at location like at the beginning & at the
end of weld length require more weld size.
3.3 SQUARE CROSS-SECTION :-
3.3.1 ASSUMPTIONS & BOUNDARY CONDITIONS :-
Design characteristics of pressure vessel:-
Inside volume – 1.178mt3
Shell:
Section – 0.886x0.886 mt2
Height – 1.500mt
Shell thickness – 4mm
Shell material – SS304
Working pressure – 150kpa
Working temperature – 125 °c
Insulation material – Glass wool
Weld condition – Fillet weld double sided
Type – Horizontal square pressure vessel with flat ends having door mechanisms on both ends.
Thin shell (t/d = 0.005 < 0.05)
3.3.2 PART DESCRIPTION :-
Shell body, Top & Bottom cover, Flanges, Flat end reinforcements for both ends, Reinforcement bars, Insulation, internal Patch
plate, external Patch plate, Neoprene rubber gasket.

© 2016 IJEDR | Volume 4, Issue 2 | ISSN: 2321-9939
IJEDR1602380 International Journal of Engineering Development and Research (www.ijedr.org) 2187
Fig 3.20 Square pressure vessel model description
3.3.3 PRESSURE LOADING :-
On shell of thickness 4mm, with pressure loading on square vessel, we have a region of stress concentration around the sharp
corners , the joint shell patching & on the resisting areas of gate mechanism.
In deformation plot, deformation takes place on the middle area of shell by 38mm.
3.3.4 THERMAL LOADING :-
In Thermal plot, the inner shell & cover areas are at a temperature of 398°k. Temperature reduces towards the outside surface of
insulation & outer gate reinforcements.
In temperature gradient plot, there is no sign of temperature difference on shell while on other places like top cover, insulation there
is significant value of temperature gradient.
In stress due to temperature plot, most stressed areas are around the middle areas of shell, top cover & gate mechanism.

© 2016 IJEDR | Volume 4, Issue 2 | ISSN: 2321-9939
IJEDR1602380 International Journal of Engineering Development and Research (www.ijedr.org) 2188
Fig 3.21 Von-Mises stress distribution on pressure vessel due to pressure loading.
The above figure is showing that Von- Mises stress mainly concentrate at the vertical welded joint of shell on opposite sides around
patching also there are some signs of stress over the faces of flat end reinforcement where the reinforcing bars are pushing against
it, there are also traces of stress concentration at corners of shell. Due to these stresses the shell tries to buckle around the middle of
sides with a camber formation & consequently the weld will fail & tear around the joints.
Fig 3.22 Von-Mises stress distribution on pressure vessel shell at different nodal point due to pressure loading.
© 2016 IJEDR | Volume 4, Issue 2 | ISSN: 2321-9939
IJEDR1602380 International Journal of Engineering Development and Research (www.ijedr.org) 2189
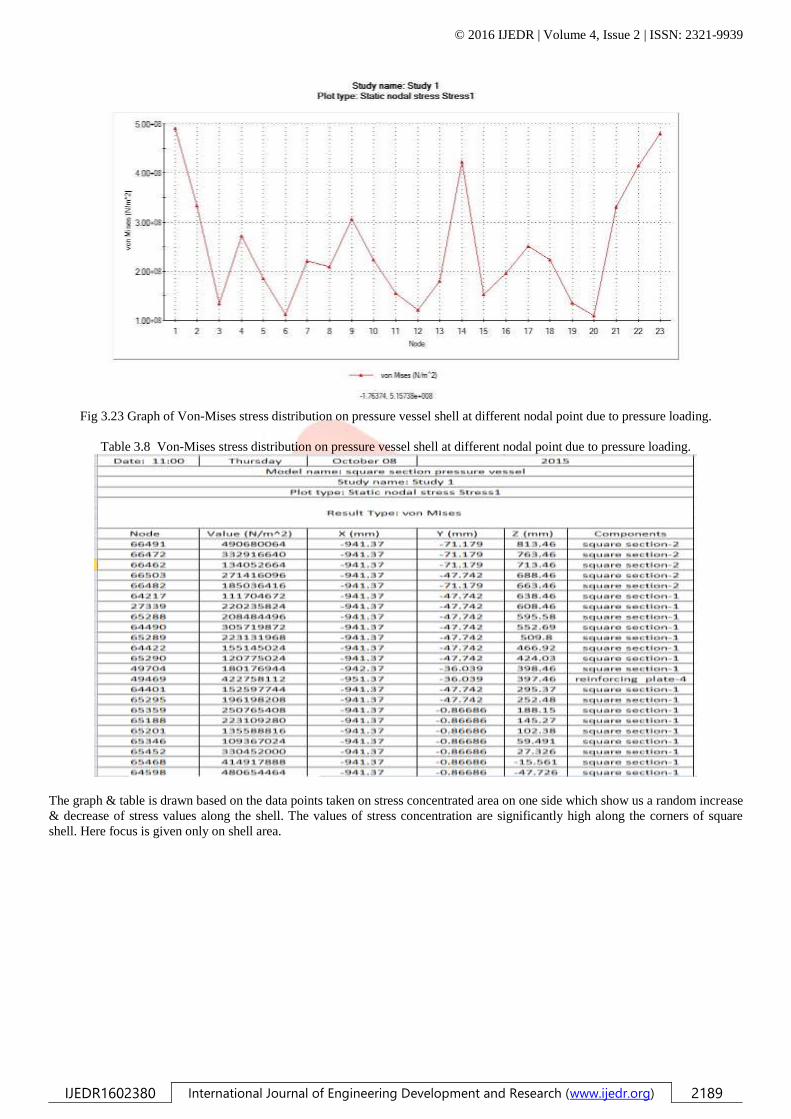
Fig 3.23 Graph of Von-Mises stress distribution on pressure vessel shell at different nodal point due to pressure loading.
Table 3.8 Von-Mises stress distribution on pressure vessel shell at different nodal point due to pressure loading.
The graph & table is drawn based on the data points taken on stress concentrated area on one side which show us a random increase
& decrease of stress values along the shell. The values of stress concentration are significantly high along the corners of square
shell. Here focus is given only on shell area.

© 2016 IJEDR | Volume 4, Issue 2 | ISSN: 2321-9939
IJEDR1602380 International Journal of Engineering Development and Research (www.ijedr.org) 2190
Fig 3.24 Deformation plot on pressure vessel due to pressure loading.
Fig 3.25 Deformation plot on middle of pressure vessel shell at different nodal points due to pressure loading.
Fig 3.26 Graph of Deformation plot on middle of pressure vessel shell at different nodal points due to pressure loading.

© 2016 IJEDR | Volume 4, Issue 2 | ISSN: 2321-9939
IJEDR1602380 International Journal of Engineering Development and Research (www.ijedr.org) 2191
Table 3.9 Deformation plot on middle of pressure vessel shell at different nodal points due to pressure loading.
On above figure of deformation plot, we can easily notice that a maximum deformation of 38 mm is registered at the middle of 4
sides which means a total failure of the welded joint of shell. Again we have taken a no. of data points on 1 face at different nodes
showing a parabolic increase in deflection at the middle of faces & minimum at corners both in graph & table. Consequently a
camber formation occur at the middle of every faces. Thus in square vessels mainly affected area are middle of shell.
Fig 3.27 Temperature plot on pressure vessel due to thermal loading.

© 2016 IJEDR | Volume 4, Issue 2 | ISSN: 2321-9939
IJEDR1602380 International Journal of Engineering Development and Research (www.ijedr.org) 2192
Fig 3.28 Temperature plot on pressure vessel components due to thermal loading.
Fig 3.29 Graph of Temperature plot on pressure vessel components due to thermal loading.
Table 3.10 Temperature plot on pressure vessel components due to thermal loading.
On above figure of Temperature plot, graph & table maximum temperature is at shell, top & bottom cover. Minimum temperature
is at Flat end reinforcement & at outer layer of insulation cover.
Fig 3.30 Temperature gradient plot on pressure vessel due to thermal loading.

© 2016 IJEDR | Volume 4, Issue 2 | ISSN: 2321-9939
IJEDR1602380 International Journal of Engineering Development and Research (www.ijedr.org) 2193
Fig 3.31 Temperature gradient plot on pressure vessel components at different nodal points due to thermal loading.
Fig 3.32 Graph of Temperature gradient plot on pressure vessel components at different nodal points due to thermal loading.
Table 3.11 Temperature gradient plot on pressure vessel components at different nodal points due to thermal loading.

© 2016 IJEDR | Volume 4, Issue 2 | ISSN: 2321-9939
IJEDR1602380 International Journal of Engineering Development and Research (www.ijedr.org) 2194
On figure it is easily seen that minimum temperature gradient present at shell & maximum at insulation, top & bottom cover, flat
end reinforcements. On graph & table we have taken a no. of data points on different locations of every components, where
temperature gradient value increase & decrease.
Fig 3.33 Von-Mises stress distribution on pressure vessel due to thermal stress.

© 2016 IJEDR | Volume 4, Issue 2 | ISSN: 2321-9939
IJEDR1602380 International Journal of Engineering Development and Research (www.ijedr.org) 2195
Fig 3.34 Von-Mises stress distribution on pressure vessel shell at different nodal point due to thermal stress.
Fig 3.35 Graph of Von-Mises stress distribution on pressure vessel shell at different nodal point due to thermal stress.
Table 3.12 Von-Mises stress distribution on pressure vessel shell at different nodal point due to thermal stress.
Figure, graph & table shows that on stress plot due to temperature, in shell we clearly see that maximum stress present at middle of
shell. Here main focus is on shell. On other parts also there present significant stress values due to temperature.

© 2016 IJEDR | Volume 4, Issue 2 | ISSN: 2321-9939
IJEDR1602380 International Journal of Engineering Development and Research (www.ijedr.org) 2196
Table 3.13 Different forces acting on nut & bolt connectors on joints, due to Thermal stresses
Above table is showing values of shear force, axial force & bending moment over nut & bolt connectors on gate mechanism.
Fig 3.36 Design Insight of pressure vessel components due to thermal stress.
On above figure shows the Design Insight plot available in Solidworks design platform which shows the sequence of effected areas
on vessel. Here also the affected area is around the shell collars, top & bottom covers, and reinforcing bars.
Table 3.14 Data comparison chart of analysis result between circular & square section pressure vessel.
Circular Section
Pressure Loading
Thermal Loading

© 2016 IJEDR | Volume 4, Issue 2 | ISSN: 2321-9939
IJEDR1602380 International Journal of Engineering Development and Research (www.ijedr.org) 2197
S.
No.
Von-Mises stress
(pa)
Deformation
(mm)
Stress
intensity (pa)
Temperature
distribution (K)
Temperature
gradient (K/m)
Von-Mises
stress (pa)
1 Maximum
288869568 on
reinforcement
bars
Maximum 5.513
on shell joint
around patch
plate
Maximum
292709248
on bars
Maximum
400.169
Maximum 10 Maximum
882958144 on
shell joint
around patch
plate
Square Section
Pressure Loading
Thermal Loading
S.
No.
Von-Mises stress
(pa)
Deformation
(mm)
Stress
intensity
(pa)
Temperature
distribution (K)
Temperature
gradient (K/m)
Von-Mises
stress (pa)
1 206807008 38.064 2529650176 Maximum
398.152
Maximum 100 Maximum
100000000
From the comparison chart , it is clearly seen that circular section resist more in comparison to square section on the same loading
condition. In pressure loading although value of von-mises stress is more in circular section in comparison to square but the
location of maximum stress concentration is not on the shell area of circular section. It is on the reinforcement bars. Also the
magnitude of deformation of shell is significantly more on shell of square section in comparison to circular section. In thermal plot
it is clearly visible that magnitude of temperature gradient is more in square section than circular which indicate more heat loss in
square section.
Fig 3.37 Deformation plot of square section pressure vessel components due to pressure after modification.
On the above figure shows the deformation of square section at the centre of faces & at the centre of top & bottom cover. Here we
have added 2 sets of angle stiffeners of section 40x40x3 mm, supporting the shell of vessel along it’s vertical length at 2 locations
(550mm apart). Consequently the value of deformation at the centre of faces decrease due to resistance offered by angle stiffeners.
Thus we have better result of square section pressure vessel with the above modification.
IV RESULT & DISCUSSION
4.1 COMPARISON BETWEEN 4MM & 5MM THICK SHELLS:-
In previous chapter we have concluded that circular section is suitable for pressure vessel design. In this section by taking a
cylindrical pressure vessel, compare between 4mm and 5mm shell thickness for pressure and thermal loading. For every
observation checked the value of stress and deformation on different parts of vessel.
4.1.1 4MM THICK SHELL MADE OF MATERIAL AISI304
PRESSURE LOADING :

© 2016 IJEDR | Volume 4, Issue 2 | ISSN: 2321-9939
IJEDR1602380 International Journal of Engineering Development and Research (www.ijedr.org) 2198
Here a cylindrical pressure vessel of 4mm thick shell is tested under 150 kpa. A pressure of 150 kpa is applied on inner faces of
shell and upper and lower cover. After analysis, we observed that area of stress concentration is around the shell joint and at the
middle of faces of top and bottom cover. From stress distribution plot of pressure loading the value of maximum stress is over the
reinforcement bars. It is easily observed from figure 5.1 that other areas of shell are free from stresses. Thus the prime matter of
concern is the welded vertical joints of shell, top & bottom end covers, restraining bars. From the deformation plot fig. 5.2, it is
seen that there is maximum deformation at the welded joint ,i.e., 5.513 mm. We see camber formation at the welded joint.
Fig 4.1 Von-Mises stress distribution on pressure vessel due to pressure loading in 4mm thk. shell.
Fig 4.2 Deformation plot of pressure vessel due to pressure loading in 4mm thk. shell.
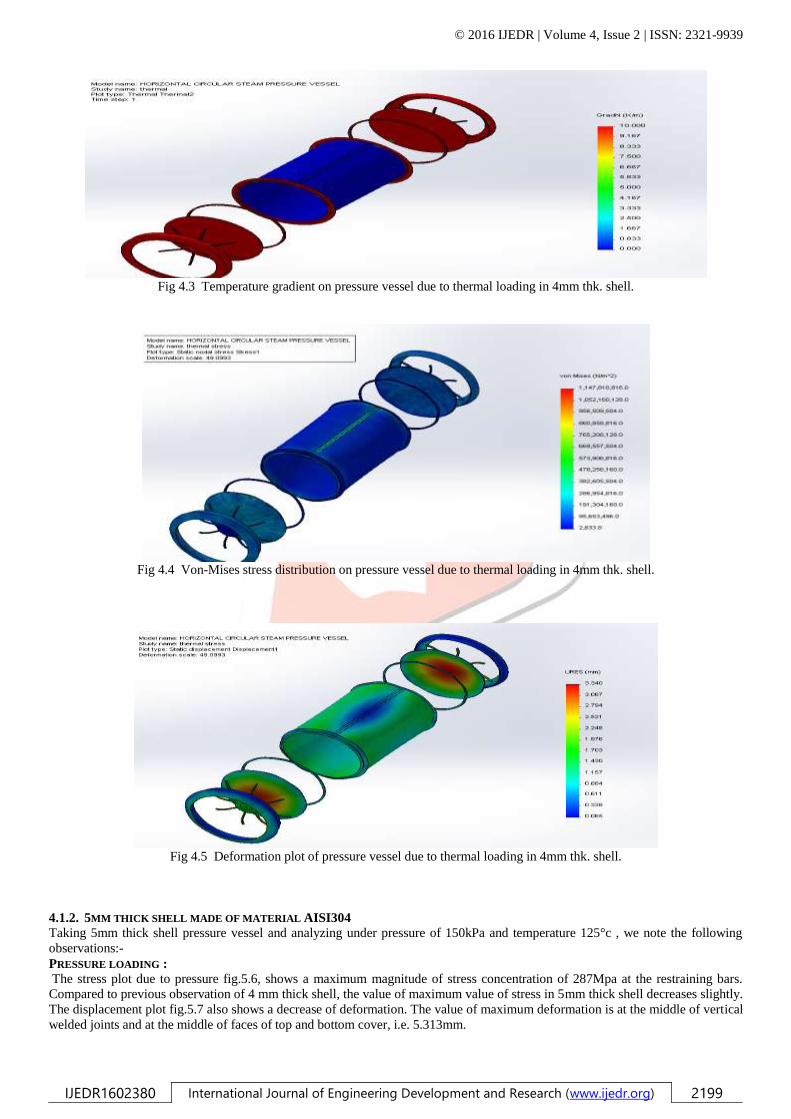
THERMAL LOADING :
The temperature gradient plot fig 5.3, below shows the magnitude of 10 K/m across the thickness of top and bottom cover, around
collar of shell and flat end reinforcements. The stress distribution plot fig.5.4, due to thermal load shows a maximum value of 1147
MPa on the restraining bars. The most affected areas are the welded vertical joint of shell, the top and bottom end cover and flat
end reinforcements. The displacement plot due to thermal loading fig 5.5, shows a maximum value of deformation of 3.34 mm at
the middle face of the top and bottom cover, but not at the welded joints.
© 2016 IJEDR | Volume 4, Issue 2 | ISSN: 2321-9939
IJEDR1602380 International Journal of Engineering Development and Research (www.ijedr.org) 2199
Fig 4.3 Temperature gradient on pressure vessel due to thermal loading in 4mm thk. shell.
Fig 4.4 Von-Mises stress distribution on pressure vessel due to thermal loading in 4mm thk. shell.
Fig 4.5 Deformation plot of pressure vessel due to thermal loading in 4mm thk. shell.
4.1.2. 5MM THICK SHELL MADE OF MATERIAL AISI304
Taking 5mm thick shell pressure vessel and analyzing under pressure of 150kPa and temperature 125°c , we note the following
observations:-
PRESSURE LOADING :
The stress plot due to pressure fig.5.6, shows a maximum magnitude of stress concentration of 287Mpa at the restraining bars.
Compared to previous observation of 4 mm thick shell, the value of maximum value of stress in 5mm thick shell decreases slightly.
The displacement plot fig.5.7 also shows a decrease of deformation. The value of maximum deformation is at the middle of vertical
welded joints and at the middle of faces of top and bottom cover, i.e. 5.313mm.

© 2016 IJEDR | Volume 4, Issue 2 | ISSN: 2321-9939
IJEDR1602380 International Journal of Engineering Development and Research (www.ijedr.org) 2200
Fig 4.6 Von-Mises stress distribution on pressure vessel due to pressure loading in 5mm thk. shell.
Fig 4.7 Deformation plot of pressure vessel due to pressure loading in 5mm thk. shell.
THERMAL LOADING :
The temperature gradient plot fig.5.8, shows a value of 10 K/m setup across the thickness of top and bottom cover, collars of shell
and the flat end reinforcements. The stress concentration plot due to thermal gradient fig.5.9, shows a maximum value of 1137 Mpa
which is less in comparison to previous observation of 4mm shell thickness. The displacement plot due to thermal loading fig.5.10,
shows a value of 3.2 mm deformation at the middle faces of top and bottom covers.
Fig 4.8 Temperature gradient on pressure vessel due to thermal loading in 5mm thk. shell.

© 2016 IJEDR | Volume 4, Issue 2 | ISSN: 2321-9939
IJEDR1602380 International Journal of Engineering Development and Research (www.ijedr.org) 2201
Fig 4.9 Von-Mises stress distribution on pressure vessel due to thermal loading in 5mm thk. shell.
Fig 4.10 Deformation plot of pressure vessel due to thermal loading in 5mm thk. shell.
Table 4.1 Comparison chart of analysis result between 4mm & 5mm thick shell.
4mm thick shell
S.
No.
Pressure loading Thermal loading
Von-Mises stress
distribution (pa)
Deformation (mm) Temperature
gradient (K/m)
Von-Mises stress
distribution (pa)
Deformation
(mm)
1 288869568 5.513 10 1147810816 3.34
5mm thick shell
S.
No.
Pressure loading Thermal loading
Von-Mises stress
distribution (pa)
Deformation (mm) Temperature
gradient (K/m)
Von-Mises stress
distribution (pa)
Deformation
(mm)
1 287869568 5.313 10 1137810816 3.2
By comparing with respect to thickness we find that maximum Von-Misses stress level differ in both observations of 4mm & 5mm
thicknesses. In deformation plot, we can make comparison that resultant displacement in 4 mm thick shell is more than 5mm thick.

© 2016 IJEDR | Volume 4, Issue 2 | ISSN: 2321-9939
IJEDR1602380 International Journal of Engineering Development and Research (www.ijedr.org) 2202
In thermal plot, the temperature gradient value remain same for both the cases. In thermal stress plot, maximum Von-Mises stress
values are greater in 4mm thickness in comparison to 5mm shell.
Thus we conclude that with increase in thickness, pressure vessel shell safety increases.
4.2. MODIFICATIONS DONE TO PRESSURE VESSEL:-
In order to reduce the amount of deformation on the load affected areas, the following modifications are done:
4.2.1. RESTRAINING BANDS ATTACHED PERPENDICULAR TO THE VERTICAL WELDED JOINT:
At first, attached 2 plate band around the vertical lengths of vessel to arrest the deformation at joint due to failure of weld. The plate
used in band is 5mm thick and 100mm in width
PRESSURE LOADING
The stress distribution plot fig.5.11, shows that after adding bands, there is minimum variation in the magnitude of stress
concentration. It means that the bands attached have no significant effect on the stress distribution. The value of stress is max. at the
shell joints and at top and bottom covers i.e., 241Mpa, which is comparatively less than previous observation of vessel without
modification. In the displacement plot, fig.5.12, due to bands attached, the maximum value of deformation around the shell joints
and at faces of top and bottom covers decreases to 4.298 mm. Thus, the band tries to reduce the deformation around joints and
prevent the failure of weld.
THERMAL LOADING
From fig.5.13, in the stress distribution plot, the maximum stress concentration areas are around the restraining band and welded
joint. The maximum value of von-mises stress is over the restraining bars,i.e., 1087 Mpa. Due to modifications done, the
deformation value decreases by little variation. The maximum deformation value from fig. 5.14, i.e., 3.159 mm is at the middle
faces of top and bottom covers.
Fig 4.11 Von-Mises stress distribution plot of pressure vessel with modification due to pressure loading in 4mm thk. shell.
Fig 4.12 Deformation plot of pressure vessel with modification due to pressure loading in 4mm thk. shell.

© 2016 IJEDR | Volume 4, Issue 2 | ISSN: 2321-9939
IJEDR1602380 International Journal of Engineering Development and Research (www.ijedr.org) 2203
Fig 4.13 Von-Mises stress distribution plot of pressure vessel with modification due to Thermal loading in 4mm thk. shell.
Fig 4.14 Deformation plot of pressure vessel with modification due to Thermal loading in 4mm thk. shell.
4.2.2. HEMISPHERICAL END COVER
The flat end covers previously used are replaced with hemispherical top and bottom covers of thickness 10 mm. Due to
hemispherical shape, the stress distribute regularly and thus, there are less chances of stress concentration.
PRESSURE LOADING
From fig.5.15 of stress distribution plot, there is no sign of stress concentration at the end covers, but there are traces of stress
concentration along the welded joint on the shell area only. The max. value of von-mises stress is 295Mpa at the welded joints of
shell. Whereas, on other parts of vessel, there are no signs of stress. In the fig.5.16, the max. deformation is at the middle of the
welded joints of shell by 3.58 mm, whereas, on other areas, no deformation takes place.
THERMAL LOADING
In temperature plot fig.5.17, shows that the max. value of temperature are at shell, top and bottom covers, i.e., 402 K. From
fig.5.18 of temperature gradient plot, the max. value of gradient is 10K/m at the top and bottom cover and the flat end
reinforcements. There is no temperature gradient at the shell wall. From fig. 5.19, the stress distribution plot due to thermal loading
shows that max. values of von-mises stress are at the welded joint of shell and at the restraining bands, i.e., 478 Mpa. From
fig.5.20, the displacement plot shows that the max. deformation takes place at the collars of shell, i.e., 2.99 mm.

© 2016 IJEDR | Volume 4, Issue 2 | ISSN: 2321-9939
IJEDR1602380 International Journal of Engineering Development and Research (www.ijedr.org) 2204
Fig 4.15 Von-Mises stress distribution plot of pressure vessel with modification 2 due to pressure loading in 4mm thk. shell.
Fig 4.16 Deformation plot of pressure vessel with modification 2 due to pressure loading in 4mm thk. shell.
Fig 4.17 Temperature distribution plot of pressure vessel with modification 2 due to thermal loading in 4mm thk. shell.

© 2016 IJEDR | Volume 4, Issue 2 | ISSN: 2321-9939
IJEDR1602380 International Journal of Engineering Development and Research (www.ijedr.org) 2205
Fig 4.18 Temperature gradient plot of pressure vessel with modification 2 due to thermal loading in 4mm thk. shell.
Fig 4.19 Von-Mises stress distribution plot of pressure vessel with modification 2 due to thermal loading in 4mm thk. shell.
Fig 4.20 Deformation plot of pressure vessel with modification 2 due to thermal loading in 4mm thk. shell.
Table 4.2 Comparative study of the result of analysis between the modifications added to cad model.
MODIFICATION NO.1 – ADDITION OF RESTRAINING CIRCULAR STRIPS TO SHELL
Pressure loading Thermal loading
S. No. Von-Mises stress distribution
(pa)
Deformation (mm) Von-Mises stress
distribution (pa)
Deformation
(mm)
1 Maximum 241815552 at
reinforcement bars
Maximum 4.298 at
middle of top cover
1087847936 Maximum 3.159
at the middle of
top & bottom

© 2016 IJEDR | Volume 4, Issue 2 | ISSN: 2321-9939
IJEDR1602380 International Journal of Engineering Development and Research (www.ijedr.org) 2206
cover
MODIFICATION NO.2 – ADDITION OF RESTRAINING CIRCULAR STRIPS TO SHELL & HEMISPHERICAL TOP &
BOTTOM ENDS IN PLACE OF FLAT ENDS
Pressure loading Thermal loading
S.
No.
Von-Mises
stress
distribution
(pa)
Deformation
(mm)
Temperature
distribution
(K)
Temperature
gradient (K/m)
Von-Mises stress
distribution (pa)
Deformation
(mm)
1 Maximum
295617952
around
patching area
Maximum
3.585 at the
middle of
patching of
shell
402.319 10 Maximum
478137568 on
patch plate
2.997
With modifications attached to pressure vessel there is no significant change in the value of stress concentration but the value of
max. deformation decrease. Thus the modifications done only to arrest the deformation of welded joints and the top and bottom
covers.
V Conclusion & Scope of future work
In this research work, Finite Element Analysis of a pressure vessel under thermal & pressure loading is investigated using
simulation based methods with Solidworks software package. Here in stress plots, the Von-mises yield criterion has been used to
determine the stress distribution & to distinguish between stressed & minimum stressed areas. Here we observed that both pressure
loading & stress generated due to thermal loading have significant role in the deformation of pressure vessel. The stressed areas are
also different for pressure loading & thermal loading depending on the type of cross-section of pressure vessel. When we compare
the loading effect on circular cross-section with square cross-section there is significant difference in the behavior of these 2 types
of pressure vessel.
By comparing with pressure loading, it is clearly visible that stress concentration in circular section concentrate only
on the region around vertical joint of shell & in other region of shell there are no sign of stress concentration while we have
observed that in square section on shell area, stress concentration occur not only on the joint shell patching but also on the four
sharp corners of the vessel. In the deformation plot too, we have a better performance in circular section than in square one. In
circular, deformation takes place only around the vertical shell joint while deformation at the Centre of all 4 faces in square shell
are clearly visible and in significant amount. This denote that with same magnitude of pressure loading, circular section of vessel
shell resist better in comparison with square one.
When we come to thermal plots we don’t have a distinguishing weakness for comparison between both the vessels
because in both types there is no temperature gradient present on shell area but in other part like gate mechanism & insulation there
is significant variation in temperature gradient. Due to this temperature gradient, thermal stress concentrate only on the regions with
significant value of temperature gradient i.e. the top & bottom cover, gate mechanism, neck collar etc. In shell areas of both vessel
types we have no significant effect due to thermal loading.
It is also interesting to know that in temperature gradient plot in circular section the maximum value of
temperature gradient is 10 while in the square section, this value touch 100. Surface area on circular section in contact with outside
atmosphere is less in comparison to square section. Thus it is proved that minimum heat loss from inside of vessel take place in
circular section. By determining all these points we come to the conclusion that pressure vessel with cylindrical shell is more
efficient than vessel with square shell. And by observing the failure of vessels at joints make us conclude that proper welding of
joints as per standard has great impact on construction of pressure vessels & it’s prevention from failure.
Further by using FEA we can verify & validate different shape of pressure vessels required for different
purposes in different environmental conditions.
REFERENCES
[1] ASME, “ASME Section I & Section VIII Fundamentals”, PDHonline Course M398 PDH), 2012
[2] R.M.Natal Jorge et al,“Design of steam heated sterilizer based on Finite Element Stress
[3] Analysis”, International Journal of Pressure Vessels & Piping, 78 , August, 2001
[4] S Al Laham Structural Integrity Branch , “ Stress Intensity Factor and Limit Load Handbook”, British Energy Generation Ltd,
United Kingdom , Issue 2, 1999, “ API/ASME Design Calculations”, API Std 6X Ballot Draft, 2013.
[5] Amir Afkar et al, “ Design and analysis of a spherical pressure vessel using finite element method”, World Journal of
Modelling and Simulation , Vol. 10 , No. 2/ Received November 18 2012, Accepted November 7 2013, pp. 126-135 , (2014)
[6] John F. Harvey , “Theory & Design Of Pressure Vessel”, Published by Van Nostrand Reinhold Company Inc., Newyork,
1974, Chapter No.2, Page No.85
[7] Steam Boiler and Pressure Vessel Act R.S.N.S. 1989: Steam Boiler and Pressure Vessel Regulations, NS Reg 19/58, N.S.
Reg. 218/2008, 2011, Page No.6

© 2016 IJEDR | Volume 4, Issue 2 | ISSN: 2321-9939
IJEDR1602380 International Journal of Engineering Development and Research (www.ijedr.org) 2207
[8] Jan Taler, Bohdan Węglowski et. al., “Inverse Space Marching Method for determining
[9] Temperature and Stress distributions in Pressure Components”, 1Cracow University of Technology, 2University of
Science and Technology Poland, 15, September, 2011, InTech, ISBN 978-953-307-569-3 Hard cover, 688 pages
[10] S. Ravinder et. al., “Design & Analysis of pressure vessel assembly for testing of missile canister sections under differential
pressures”, ScienceDirect, Procedia Engineering 64 ( 2013 ) 1040 – 1047.
Acknowledgment
Every endeavor, I understand takes an indomitable urge, perseverance’s, and proper guidance especially when it is most needed.
Internally motivated to undertake some appreciable work as a part of our curriculum, I undertook this lab report. Unsure though
but with a hope and then I was introduced to the lab report work to be completed. Initially, I had hardly ever thought of, the kind
of work I was going to do.
It is my deep of gratitude and ineptness to my guide Prof. Saurabh Kumar and without whose inspiration, co-operation,
valuable suggestion and technical acumen, this project report would not have seen the light of the day. The opportunity to work
under such esteemed academician is a matter of great pride and privilege. The duration of project work has been very enlightening
and has provided immense satisfaction to me.
I am thankful to Prof. Saurabh Kumar, HOD, Mechanical Engineering Department and all respected staff members of
Mechanical Engineering who helped me directly or indirectly in my work regarding this project.
I would like to acknowledge my special thanks to friends and family who helped me to carryout of this project work.