design and construction of a small-scale fixed-bed...
TRANSCRIPT
i
Design and Construction of
a Small-Scale Fixed-Bed
Reactor
Peter E. Akhator
No. 6/2014

ii
DESIGN AND CONSTRUCTION OF A SMALL-SCALE FIXED-BED REACTOR
Peter E. Akhator, e-mail address: [email protected]
Master thesis
Subject Category: Technology
University of Borås
School of Engineering
SE-501 90 BORÅS
Telephone +46 033 435 4640
Examiner: Professor Tobias Richards
Supervisor’s name: Professor Tobias Richards
Supervisor’s
address:
School of Engineering, University of Boras,
SE-501 90, Boras.
Client: University of Boras
Date: 2014 - 06- 24
Keywords: Fixed-bed reactor, gasification, pyrolysis.

iii
Abstract
As biomass and municipal solid wastes become increasingly viable fossil fuels alternatives,
more researches are being conducted to improve on the processes for their conversion to
energy or energy carriers. Gasification is one of such processes and it forms the core of this
project. This project presents a specified design of a small-scale fixed-bed reactor for the
purpose of investigating the gasification processes of biomass and municipal solid wastes.
Gas extraction ports are evenly distributed along the height of the reactor to extract product
gases and accommodate thermo-couples for temperature measurement. A cyclone separator
was incorporated to clean the gases as well as extract bio-oil from the gases.

iv
Contents
Abstract ……………………………………………………………………….iii
Contents ……………………………………………………………………….iv
List of Figures …………………………………………………………………v
List of Tables …………………………………………………………………..vi 1. Background and Problem Description ........................................................................... 1
1.1 Overview ...................................................................................................................... 1 1.2 Gasification .................................................................................................................. 1 1.3 Gasification process ..................................................................................................... 1
1.3.1 Air gasification ................................................................................................... 2
1.3.2 Steam gasification ............................................................................................... 3 1.3.3 Oxygen gasification ............................................................................................ 3 1.3.4 Hydrogen gasification ......................................................................................... 4
1.4 Gasification reactors..................................................................................................... 4
1.4.1 Fixed-bed reactor ................................................................................................ 4 1.4.2 Fluidized bed reactors ......................................................................................... 7 1.4.3 Entrained-flow reactors ...................................................................................... 9
1.5 Gasification Applications ........................................................................................... 10
1.6 Pyrolysis ..................................................................................................................... 11
1.7 Cyclone separator ....................................................................................................... 14 1.7.1 Historical background ....................................................................................... 14
1.7.2 Description ........................................................................................................ 14 1.7.3 How cyclones work .......................................................................................... 16 1.7.4 Types of cyclones ............................................................................................. 16
1.7.5 Cyclone performance ........................................................................................ 18 1.7.6 Advantages and disadvantges of cyclones ........................................................ 19
1.7.7 Applications of cyclones................................................................................... 19
2. Purpose and limitations ................................................................................................. 21 3. Methodology ................................................................................................................... 21
3.1 Cyclone separator ....................................................................................................... 22
3.2 Water cooler simulation ............................................................................................. 26 3.2.1 Simulation with 2mm thickness ....................................................................... 28 3.2.2 Simulation with 3mm thickness ....................................................................... 29
4. The small-scale fixed-bed reactor and its components ............................................... 30 4.1 Oven ........................................................................................................................... 30 4.2 Screw feeder ............................................................................................................... 30 4.3 Thermo-couples.......................................................................................................... 31 4.4 Ignition system ........................................................................................................... 31 4.5 Gasifying agents and secondary air............................................................................ 32
5. Water cooler simulation results .................................................................................... 33 6. Conclusion ....................................................................................................................... 37
7. References ....................................................................................................................... 38 Appendix A………………………………………………………………………………….42
Appendix B………………………………………………………………………………….45
Appendix C…………………………………………………………………………………..46
Appendix D…………………………………………………………………………………..50
v
List of Figures
Figure 1: Gasification processes and their products (Sadaka, 2011) 2
Figure 2: Fixed-bed reactors (Warnecke, 2000) 5
Figure 3: Schematic of a crossdraft reactor (Basu, 2010) 7
Figure 4: Schematic of a BFB (Williams et al, 2007) 8
Figure 5: Schematic of a CFB (Williams et al, 2007) 8
Figure 6: Schematic of an entrained flow reactor (Williams et al, 2007) 10
Figure 7: Schematic of NREL ablative reactor (Ringer et al, 2006) 12
Figure 8: Process flow diagram for BTG’s fast pyrolysis (BTG, 2012) 13
Figure 9: Flour mill cyclone (Hoffman et al, 2008) 14
Figure 10: Schematic of a common cyclone design (Goula et al, 2011) 15
Figure 11: Types of cyclone inlet (Svarovsky, 2009) 15
Figure 12: Flow diagram of a cyclone (Wang, 2004) 16
Figure 13: Schematic of the water jacket 28
Figure 14: Assumed model for the water jacket 28
Figure 15: Schematic representation of the reactor design 30
Figure 16: A sample of a K-type thermo-couple 31
Figure 17: FE electrode 32
Figure 18: TGI ignition transformer 32
Figure 19: A smart link advantage mass flow controller 33
Figure 20: Temperature distribution along the water jacket (2mm wall thickness) 32
Figure 21: Velocity distribution along the water jacket (2mm wall thickness) 34
Figure 22: Temperature distribution along the water jacket (3mm wall thickness) 34
Figure 23: Velocity distribution along the water jacket (3mm wall thickness) 35

vi
List of Tables
Table 1: Organisations with pyrolysis reactors and their capacities (Ringer et al, 2006) --- 13
Table 2: Dimensionless ratios for tangential entry cyclones (Goula et al, 2011) --------------17
Table 3: Biomass proximate analysis (Hassanieh, 2013) -----------------------------------------22
Table 4: Geometrical ratios for cyclone separators (Fodora et al, 2012) ---------------------- 24
Table 5: Required cyclone length as a function of area ratio (Perry et al, 2008) ------------- 25
Table 6: Temperatures from the Comsol simulation --------------------------------------------- 25

1
1. Background and Problem Description
1.1 Overview
The increase in world’s population has led to an increase in the world’s energy demand.
Consequently, the prices of fossil fuels have gone up, accompanied by escalating global
warming effects. These consequences have led to the call for the development and usage of
renewable energy. In recent years, scientists have responded by developing several renewable
processes, such as wind energy, solar energy, ocean energy, geothermal energy and bio-
energy, to attempt at mitigating these current problems. Scientists have also observed that the
usage of renewable energy has more advantages and less environmental impact than fossil
fuels. However, the order of energy consumption in the world is still; fossil fuels then
renewable energy. Recently, bio-energy is becoming the most widely used renewable energy
and its development is considered as the most likely prospect to substitute fossil fuels.
Biomass and municipal solid waste (MSW) are potential energy resources which are widely
available, renewable and CO2-neutral that are increasingly used as alternatives for fossil fuels
(Tanksale et al, 2010; Wang et al, 2008; and Grassi et al, 1990). There are several methods to
generate energy from biomass and municipal solid waste and these include thermal, physical,
biological and chemical methods. These methods could convert biomass and MSW to heat,
electricity, liquid fuels (such as bio-oils, ethanol and methanol) and gaseous fuels (such as
hydrogen and syngas), respectively (Chang et al, 2011).
In this thesis project, a small-scale fixed-bed reactor will be designed and constructed to
investigate gasification processes of several feed-stocks, such as biomass and municipal solid
waste, in single or mixed mode.
1.2 Gasification
Gasification is a thermo-chemical process of converting feed-stocks into energy or energy
carriers (Chang et al, 2011). Oxygen is used as the gasifying medium and its widely source
has been air, though steam can also be used as a source of oxygen. Gasification is a central
process between combustion (a thermal degradation with excess oxygen) and pyrolysis (a
thermal degradation in the absence of oxygen), it occurs between 600 - 1500ºC (Sadaka,
2011).
Gasification has been widely used to produce commercial fuels and chemicals especially in
the chemical manufacturing and petroleum refinery industries. Its striking features include the
ability to produce reliable and high quality syngas products that can be used for energy
production and the ability to accommodate a wide variety of feedstock (ranging from gaseous
to solid). Biomass and municipal solid waste has been successfully gasified and the
gasification of these materials has more benefits than disposal by incineration (Sadaka, 2011).
1.3 Gasification process
During biomass gasification, the material is heated to a high temperature. This leads to a
series of physical and chemical changes that result in the production of volatile products and
carbonaceous residues. The amount and compositions of the volatile products depend on the

2
reactor temperature, type and characteristics of the biomass material. The composition of the
product gas also depends on the degree of equilibrium reached by the various gas-phase
reactions, particularly the water-gas shift reaction. The char gasification stage is considered as
the limiting reaction step in biomass gasification because of rapid devolatilization of the char.
Gasification of char, in the absence of catalyst, with reactive gases such as O2, H2O and CO2
occurs at high temperatures between 700 – 1000ºC. When char is gasified with steam, the gas
produced comprises mainly of CO2, CO, H2 and CH4. Steam may be added externally or
internally from the dehydration of biomass. In reactors operating at low temperatures, low
heating rates and very high pressure, secondary reactions are very important because of long
residence time of the volatile products in the reaction zone. However, at low pressure, high
temperature and high heating rates, most of the volatile products escape instantaneously from
the biomass during pyrolysis, hence reducing the possibility of solid char-gas reaction.
In a typical gasification process as described by Basu (2010), the biomass is first dried by
heating and then it undergoes pyrolysis (a thermal degradation process). The products of
pyrolysis then react with themselves as well as with the gasifying medium to form the final
gasification products. The gasifying medium or agent is; air, oxygen, hydrogen or steam.
Figure 1 below shows gasification processes and their products.
Figure 1 Gasification processes and their products (Sadaka, 2011).
1.3.1 Air gasification
This gasification uses air as the gasifying medium and it is considered as the simplest
gasification process (Sadaka, 2011). The char formed during pyrolysis stage within the reactor
is burned with a limited supply of air. The product gas contains mainly hydrogen and carbon

3
monoxide diluted with the nitrogen from the air. The product gas has a heating value between
3.5 – 7.8 MJ/Nm3, which makes it suitable for use in boilers and engines (Sadaka, 2011).
Air gasification is being studied by several researchers for various types of biomass because
of its simplicity. The reactor temperature in this gasification depends on the air flow rate and
the biomass feed rate. Low inlet air leads to very low bed temperature, resulting in lower gas
and higher tar yields.
Groves et al. (1979) studied fluidized bed air partial oxidation of cotton gin trash over the
temperatures range of 649 to 871ºC, using a reactor of 3.0 cm internal diameter. The product
gas heating value and the energy recovery increased from 3.4 to 4.3 MJ/Nm3 and from 27 to
53% respectively. Lian et al. (1982) studied the air gasification of oak sawdust and discovered
that the tar and char yields decreased linearly with temperature from 6%wt. of dry wood at
650ºC to 0.5%wt. at 800ºC. The effect of air flow rate on the gas quality and quantity during
air gasification of wheat straw was studied by Ergundenler (1993) using a fluidized bed
reactor. He showed that, at equivalence ratio of 0.25, the mole fraction of the combustible
products is at their maximum. The air gasification of sawdust with a fluidized bed reactor
demonstrated by Cao et al. (2005) showed that under optimum operating conditions, a fuel
gas could be produced at a rate of 3.0 Nm3/kg of biomass and a heating value of about 5.0
MJ/Nm3. The study also show that the concentration of methane, carbon monoxide and
hydrogen in the gas produced were 4.21%, 9.25% and 9.27% respectively.
1.3.2 Steam gasification
Steam gasification uses steam as the gasifying medium. Unlike air gasification, the process
requires an external heat source if steam is used as the sole gasifying medium. However,
Steam gasification produces gases with higher energy content than air gasification (Sadaka,
2011). The gasification of biomass with/without air and steam has been a topic of discussion
among several researchers for example Kumar et al, 2009; He et al, 2009; Li et al, 2007;
Radmanesh et al, 2006 and Lv et al, 2004. Oxygen in the air will help to provide the energy,
by partial oxidation of the biomass, required to devolatilize the biomass to produce various
gases.
The effects of reactor temperature and steam to biomass ratio on product gas composition,
heating value and energy recovery were studied by Boateng et al. (1992). The produced gas,
which is rich in hydrogen, was found to have a heating value ranging from 11.1MJ/Nm3 at
700ºC to 12.1MJ/Nm3 at 800ºC. Energy recovery varied from 35 to 39% within the same
temperature range. Hoveland et al. (1982) conducted steam gasification of corn grain-dust in a
5cm internal diameter fluidized bed reactor. A mixture of sand and limestone was used as the
bed material. The product gas yield increased from 0.13m3/kg at 594ºC to 0.73m
3/kg at
760ºC. The heating value of the gas also increased from 9.4 to 11.5MJ/Nm3 at the same
temperature range. According to Slapak et al. (2000), steam gasification provides a possibility
for recycling waste using a bubbling fluidized bed reactor. Syngas, which is the main product,
has a heating value of 8.6MJ/Nm3 and can be employed for energy recovery.
1.3.3 Oxygen gasification
This process uses oxygen as the gasifying medium. The plant has a high capital cost due to
the high cost of the oxygen plant needed to supply the oxygen. However, the uses of pure
oxygen leads to the production of gases free of nitrogen and thus have a medium energy (12-
21MJ/Nm3). The gases can be distributed economically in pipeline network systems and
4
therefore, be conveniently used for process heat or possibly as synthesis gas to produce
chemicals and fuels.
Several researches that have been done on this process observed that increasing the oxygen
concentration in the fluidizing gas increases the compositions of the product gas (Bailie, 1979
and Tillman, 1987) as well as the heating value of the product gas (Bailie, 1979 and
Watkinson et al, 1987).
1.3.4 Hydrogen gasification
This process uses hydrogen under high pressures to convert feedstock to gaseous fuels. The
process is however not favourable because of the high price of hydrogen gas.
Nevertheless, hydrogen gasification has been observed to yield increased mole fractions of
produced gas (Weil et al, 1978).
1.4 Gasification reactors
Reactors are used for feedstock gasification. These reactors are classified, according to the
relative movement of the fuel and the gasifying medium, into three principal types: fixed-bed,
fluidized bed and entrained flow reactors.
1.4.1 Fixed-bed reactor
Fixed-bed reactors are particularly suited to solid fuel contacting operations that require close
temperature control, simple operation and minimum erosion of the body of the reactor. They
can also be built in small sizes with low cost, which is one of their major attractions. This is
why large numbers of small-scale fixed-bed reactors are in use around the world (Basu 2010).
Fixed-bed reactors can have either counter-current or co-current mass flow as shown in figure
2 below.

5
Drying
Pyrolysis
Gasification
Oxidation
Feedstock
Gas
Air
Drying
Pyrolysis
Oxidation
Gasification
Feedstock
Air Air
Gas
Counter-current
Co-current
Figure 2: Fixed-bed reactors.
In the counter-current mass flow, the fuel and the gasifying medium flow in opposite
directions, while in the co-current mass flow, the fuel and the gasifying medium flow in the
same direction. It can be up-stream or down-stream depending on the direction of the
gasifying medium (Warnecke, 2000).
The designs of fixed-bed reactors are often carried out with some simplifications, such as
assumption of plug flow and equally distributed porosity over the entire fixed-bed (Eppinger
et al, 2011). There are three major types of fixed-bed reactors: updraft, downdraft and
crossdraft fixed-bed reactors.
i. Updraft reactor
This reactor is the oldest and simplest reactor design known (Sadaka, 2011). In this
reactor, the gasifying medium is fed from the bottom and travels upward while the
feedstock introduced from the top moves downwards on a bed in a counter-current
direction to the gasifying agent. The produced gases leave the reactor from the top of
the reactor.

6
The feedstock descends through the drying, pyrolysis and oxidation zones of
progressively increasing temperatures. The oxidation zone, which has the highest
temperature, lies at the bottom of the reactor and the gasifying agent passes through
this zone reacting with the char, thereby releasing the heat requirement for the process.
The produced gases, tar and other volatiles leave from the top while the ashes are
removed at the bottom of the reactor.
The produced gases usually exit the updraft reactor at low temperatures and hence
contain high hydrocarbons and tar content. Hence, thorough cleaning is required
before the gases can be utilized in applications other than direct heating. However,
updraft reactors have the advantages of simple design and construction, low gas exit
temperature, high burnout and thermal efficiency.
ii. Downdraft reactor
A downdraft reactor is a co-current reactor in which the feedstock is introduced from
the top and the gasifying medium is fed from the sides of the reactor. The reaction
zones in this reactor are similar to those in the updraft reactor, but the locations of the
oxidation and reduction zones are interchanged.
In downdraft reactor the pyrolysis products pass through the high temperature
oxidation zone, and therefore undergo further decomposition. The final product gas
leaves the reactor from the bottom at high temperature and contains lesser tar than the
updraft reactor.
Downdraft reactor produces gases with low oil and tar contents, which means less
cleaning and filtering are required before using the gas in applications like internal
combustion engines. However, due to slag formation problems, this type of reactor is
found unsuitable for feedstock with high ash contents and low ash fusion
temperatures.
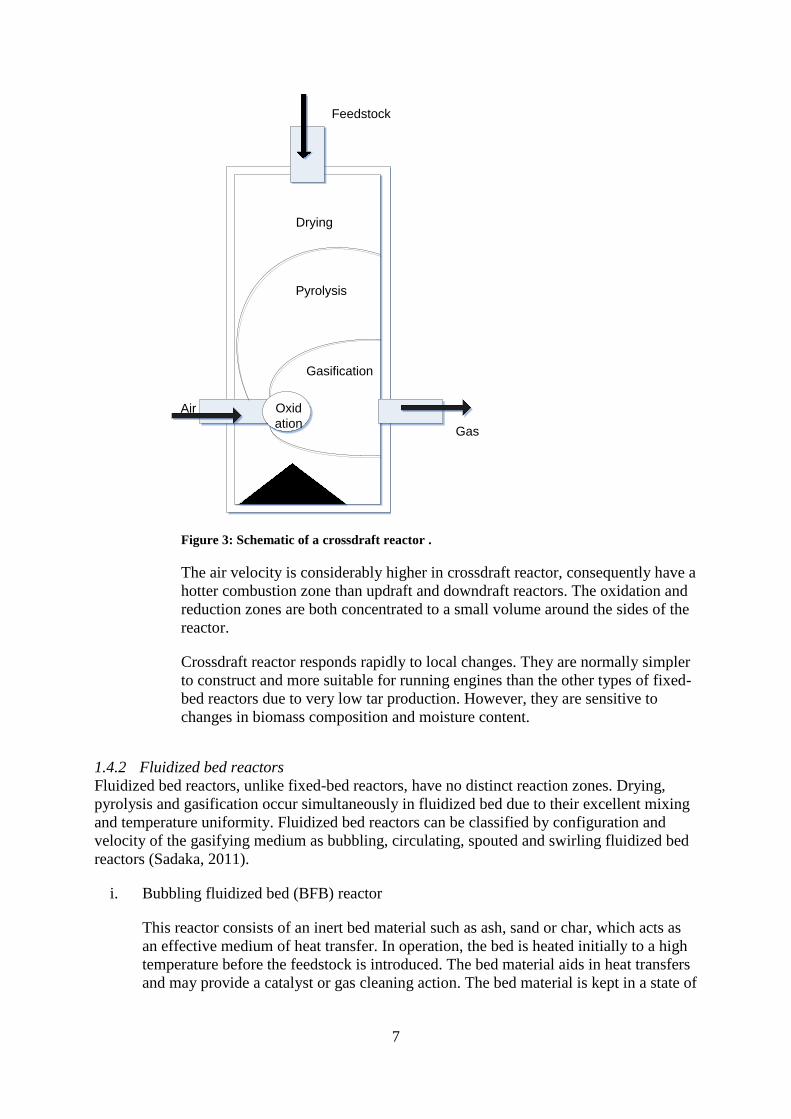
iii. Crossdraft reactor
This is a co-current reactor in which the feedstock is introduced from the top and the
gasifying medium is fed in from the side of the reactor near the bottom while the
product gas exit from the opposite side. Normally, an inlet air nozzle is used to bring
the air into the center of the combustion zone as shown in the figure below.
7
Feedstock
Gas
Air
Drying
Pyrolysis
Gasification
Oxid
ation
Figure 3: Schematic of a crossdraft reactor .
The air velocity is considerably higher in crossdraft reactor, consequently have a
hotter combustion zone than updraft and downdraft reactors. The oxidation and
reduction zones are both concentrated to a small volume around the sides of the
reactor.
Crossdraft reactor responds rapidly to local changes. They are normally simpler
to construct and more suitable for running engines than the other types of fixed-
bed reactors due to very low tar production. However, they are sensitive to
changes in biomass composition and moisture content.
1.4.2 Fluidized bed reactors
Fluidized bed reactors, unlike fixed-bed reactors, have no distinct reaction zones. Drying,
pyrolysis and gasification occur simultaneously in fluidized bed due to their excellent mixing
and temperature uniformity. Fluidized bed reactors can be classified by configuration and
velocity of the gasifying medium as bubbling, circulating, spouted and swirling fluidized bed
reactors (Sadaka, 2011).
i. Bubbling fluidized bed (BFB) reactor
This reactor consists of an inert bed material such as ash, sand or char, which acts as
an effective medium of heat transfer. In operation, the bed is heated initially to a high
temperature before the feedstock is introduced. The bed material aids in heat transfers
and may provide a catalyst or gas cleaning action. The bed material is kept in a state of
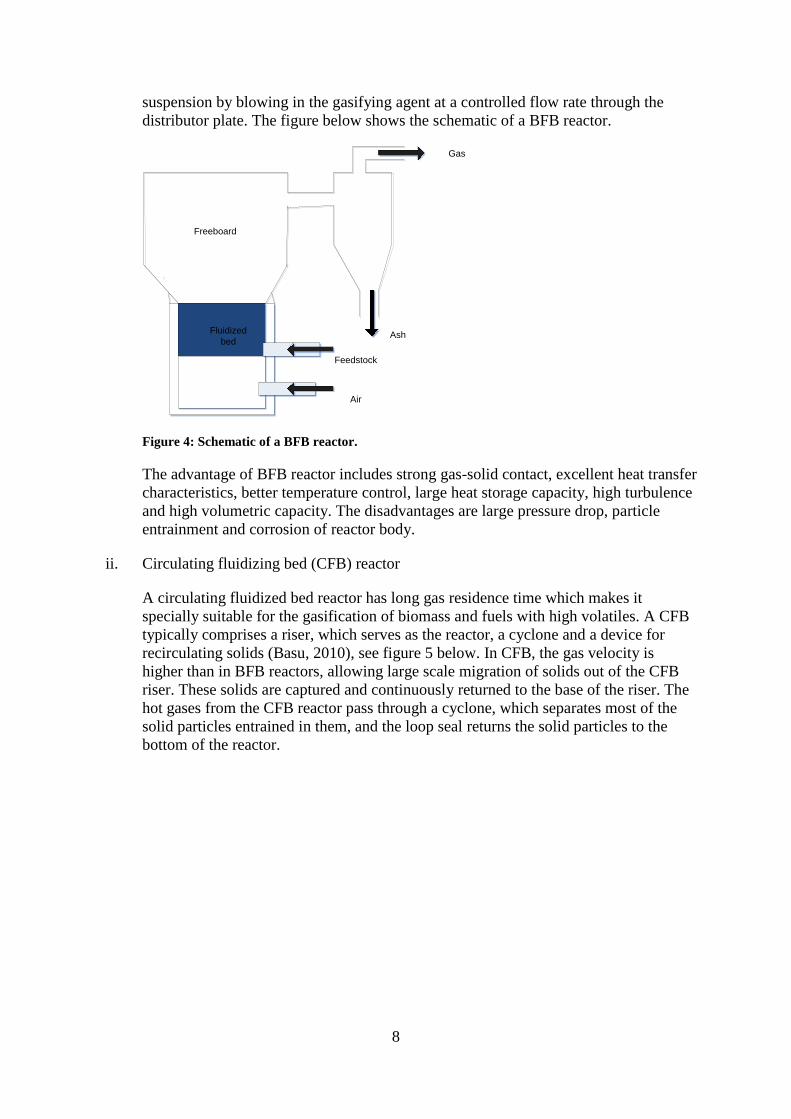
8
suspension by blowing in the gasifying agent at a controlled flow rate through the
distributor plate. The figure below shows the schematic of a BFB reactor.
Fluidized
bed
Gas
Feedstock
Ash
Air
Freeboard
Figure 4: Schematic of a BFB reactor.
The advantage of BFB reactor includes strong gas-solid contact, excellent heat transfer
characteristics, better temperature control, large heat storage capacity, high turbulence
and high volumetric capacity. The disadvantages are large pressure drop, particle
entrainment and corrosion of reactor body.
ii. Circulating fluidizing bed (CFB) reactor
A circulating fluidized bed reactor has long gas residence time which makes it
specially suitable for the gasification of biomass and fuels with high volatiles. A CFB
typically comprises a riser, which serves as the reactor, a cyclone and a device for
recirculating solids (Basu, 2010), see figure 5 below. In CFB, the gas velocity is
higher than in BFB reactors, allowing large scale migration of solids out of the CFB
riser. These solids are captured and continuously returned to the base of the riser. The
hot gases from the CFB reactor pass through a cyclone, which separates most of the
solid particles entrained in them, and the loop seal returns the solid particles to the
bottom of the reactor.

9
Gas
Fluidizing air
Feedstock
Figure 5: Schematic of a CFB reactor.
Circulating fluidized bed reactors have the advantages of higher processing capacity,
better gas-solid contact, and the ability to handle cohesive solids that might be difficult
to gasify in bubbling fluidized beds. Despite these advantages, CFB are still less used
than BFB, primarily due to their height which restrict their applications from cost
perspective.
iii. Spouted fluidized bed reactor
A spouted fluidized bed reactor comprises a bed of coarse particles. The gasifying
medium is injected through a relatively large opening at the base of the reactor. The
velocity is made high enough to force the particles to rise in a fountain at the center of
the bed and develop a cyclic motion on the bed as a whole. The bed motion can be
assisted by additional air at the base to produce a spouted fluidized bed. This type of
reactor had been used to gasify varies ranks of coal in air-steam and/or oxygen-steam
mixtures at atmospheric and elevated pressures. The minimum particle diameter at
which spouting appears practical is about 1mm (Sadaka, 2011).
iv. Swirling fluidized bed reactor
A swirling fluidized bed reactor consists of a bed of granular materials in a cylindrical
column. Primary air is fed in at the bottom of the bed through a distributor plate with
enough velocity to fluidized the bed material in a bubbling regime. Secondary air is
injected through a pair of openings into the freeboard region of the column to create a
swirl. The secondary swirling air helps to achieve high relative movement between the
air and the feedstock particles. A centrifugal action prevents the feedstock particles
above a certain minimum size from being eliminated and ensures that they are retained
in the combustion chamber. This increases the gas residence time and the degree of
mixing which increases the rate of reactions on the freeboard. This type of reactor is
mainly suited for steam gasification.
1.4.3 Entrained-flow reactors
These reactors are co-current plug-flow reactors. Their hydrodynamics are similar to that of
the pulverized-coal (PC) boilers, but differ in geometry and the amount of oxygen required.

10
Entrained-flow reactors work with a sub-stoichiometric supply of oxygen whereas a PC boiler
requires excess oxygen (Basu, 2010).
The gasification temperature of an entrained-flow reactor generally well exceeds 1000°C. This allows the production of a gas that is nearly tar-free and has a very low methane content.
A properly designed and operated entrained flow reactor can have a carbon conversion rate
close to 100%. The product gas, being very hot, must be cooled in downstream heat
exchanger that produces superheated steam required for gasification.
The feedstock and gasifying medium are mostly fed from the top of the reactor. The feedstock
need to be fine because of short residence time in the reactor. The high velocity jet of the
medium forms a recirculating zone near the entry point. Fine feedstock particles, having been
rapidly heated by radiative heat from the hot walls of the reactor chamber and from the hot
gases downstream, start to burn in the oxygen. The bulk of the feedstock is consumed near the
entrance zone through devolatilization. The combustion reaction consumes nearly all of the
supplied oxygen, so the residual char undergoes gasification reactions in CO2 and H2O
environment downstream of this zone. These reactions are relatively slow compared to the
devolatilization reaction, so the char takes much longer to complete its conversion to gases.
Hence, a large reactor length is required. A schematic of an entrained-flow reactor is given in
the figure.
Feedstock Air
Gas
Slag
Figure 6: Schematic of an entrained flow reactor.
Entrained-flow reactors are not very suitable for biomass gasification because of the difficulty
to grind fibrous biomass into fine particles and the low melting point of biomass ash with
alkali content. However, the reactors have the advantage of easily destroying tar, which is
very high in biomass and is a major issue in biomass gasification.
1.5 Gasification Applications
The product gases from the gasification of biomass contain both combustible and non-
combustible gases. These gases can be used in irrigation, industrial application areas,
vehicular power, direct heating and production of value added products.
11
1.6 Pyrolysis
Pyrolysis is the thermal decomposition of organic materials in the absence of oxygen or any
other agent (Fonts et al, 2009). The large complex molecules of the materials are broken
down into smaller molecules of gas, liquid (bio-oil) and solids (char). The type and yield of
products obtained are determined by certain factors, among which are, feedstock size,
pyrolysis temperature, rate of heat transfer, pressure, gas and solid phase retention time
(Ringer et al, 2006).
Pyrolysis could be referred to as slow or fast depending on the heating rate, pressure and
residence time of the feedstock. According to green light energy solutions, an online resource
for waste conversion pyrolysis, slow pyrolysis occurs in the temperature range 700 – 750°C
and the residence time is in the order of minutes. While the Biomass Technology Group, a
private group of companies that specialize in conversion of biomass to useful fuels and
energy, described fast pyrolysis as a process in which the feedstocks are heated rapidly to 450
– 600°C, with a short residence of a few seconds to milliseconds. Ringer et al, (2006) gave, on
weight basis, the distribution of gas, liquid and char from slow and fast pyrolysis as 35%,
30% and 35% and 13%, 75% and 12%, respectively. The bio-oil yield is more in fast
pyrolysis, hence the huge current interest in the process. The main products from fast
pyrolysis are bio-oil and ethylene-rich gases which can be used for the production of alcohols.
SunGrant Bioweb, an online resource for bioenergy and bio-products, revealed that the
biomass pyrolysis product of most interest is bio-oil, which can be used as heating oil, to
produce fuels for transportation and organic chemicals. Bio-oil is formed when volatile
compound, such as gases and tars, are cooled and condensed. They also revealed that bio-oil
contains less nitrogen than petroleum, and almost no metal or sulphur. Bio-oil has low
viscosity and can be pumped and transported through pipelines, and Nox emissions are low
when it is combusted. And that bio-oil does not mixed with petroleum derived fuels, do not
dissolved in water and less stable than fossil fuels.
Several kinds of reactors for pyrolysis are available. Being a precursor to gasification,
reactors used for gasification can also be used for pyrolysis. Several of such reactors (fixed-
beds and fluidized-bed) have been described in section 1.5. Other reactors such as ablative
and rotating cone reactors will be described below.
i. Ablative vortex reactor
This reactor was developed at the National Renewable Energy laboratory (NREL).
The design can accommodate particle sizes up to 20mm in contrast to the 2mm
required by fluidized beds. Feedstock particles are accelerated to very high
velocities by inert carrier gas and then introduced tangentially to the reactor. These
conditions force the particles to slide along the inner surface of the reactor (tubular
in shape) at high velocities, and centrifugal force at the high velocities applied a
normal force to the particles against the wall of the reactor which is maintained at
650°C. The heat effectively melts the particles with ease. The carrier gas removes
the vapours produced quickly from the reactor, enabling a vapour residence time
of 50 – 100 milliseconds. Hence, the design was suitable for fast pyrolysis and
demonstrated yields of 65% bio-oil.
Solid recycle loop was incorporated in the design to recycle the incompletely
pyrolysed particles back to the reactor for complete pyrolysis. However, the design

12
had issues of reactor erosion due to high particle velocity, excessive wear in the
recycle loop by solids and uncertainties in scaling up. The schematic of the reactor
is given in the figure below.
Figure 7: Schematic of NREL ablative reactor (modified from Ringer et al, 2006).
ii. Rotating cone reactor
This reactor is similar to the CFB design because it co-mingles sand with
feedstock to affect the pyrolysis reactions. The basic difference is that centrifugal
force resulting from a rotating cone is used for the transportation of feedstock
instead of a carrier gas. The feedstock and sand are fed in at the bottom of the cone
while spinning causes centrifugal force to move the solids upwards to the lip of the
cone. As the feedstock spill over the lip of the cone, the produced vapours are
directed to the condenser. The char and sand are sent to a combustor where the
sand is re-heated before being re-introduced at the base of the cone along with
fresh feedstock.
According to the Biomass Technology Group (BTG) who developed this reactor at
University of Twente, the design has demonstrated yields of 70% on a consistent
basis. The design has the advantages of not requiring a carrier gas for pyrolysis
which makes it easier to recover bio-oil produced, and has a less aggressive
transportation dynamics of the sand and feedstock thereby reducing wear
problems. However, the design has some disadvantages which are the complexity
of the process and the uncertainties of scaling up. The process flow diagram of
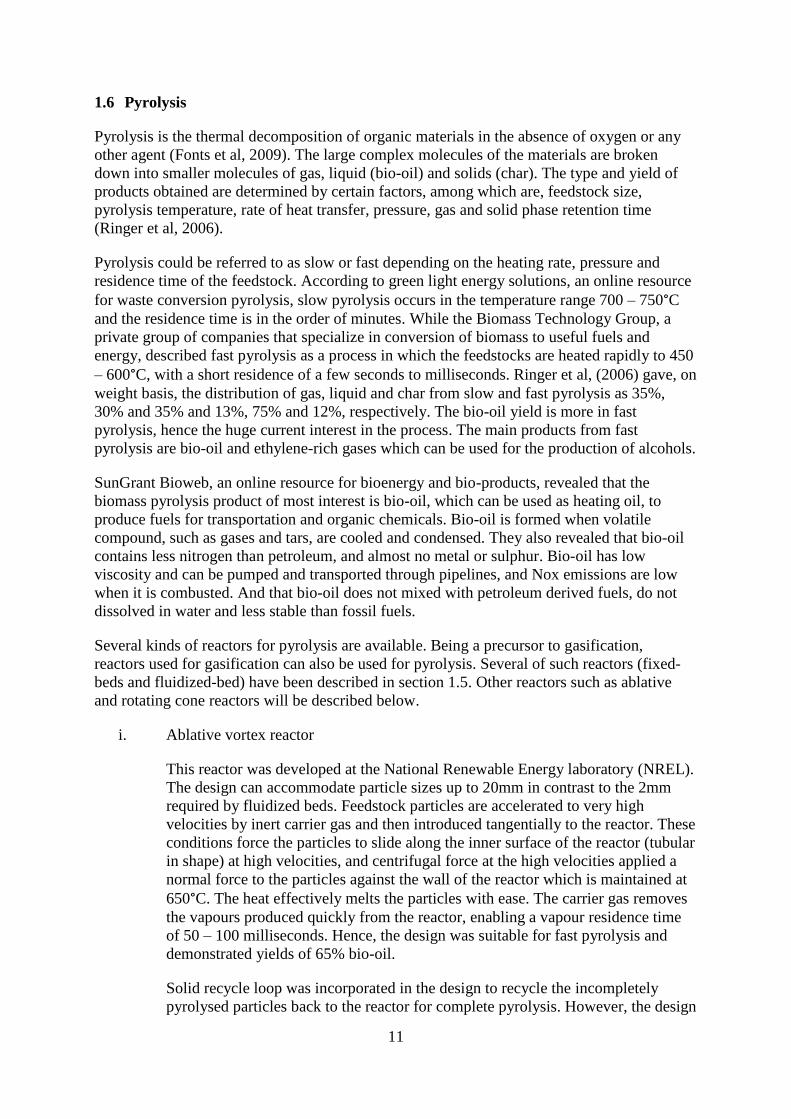
BTG’s fast pyrolysis is given in the figure below.
13
Figure 8: Process flow diagram for BTG's fast pyrolysis (modified from BTG, 2012).
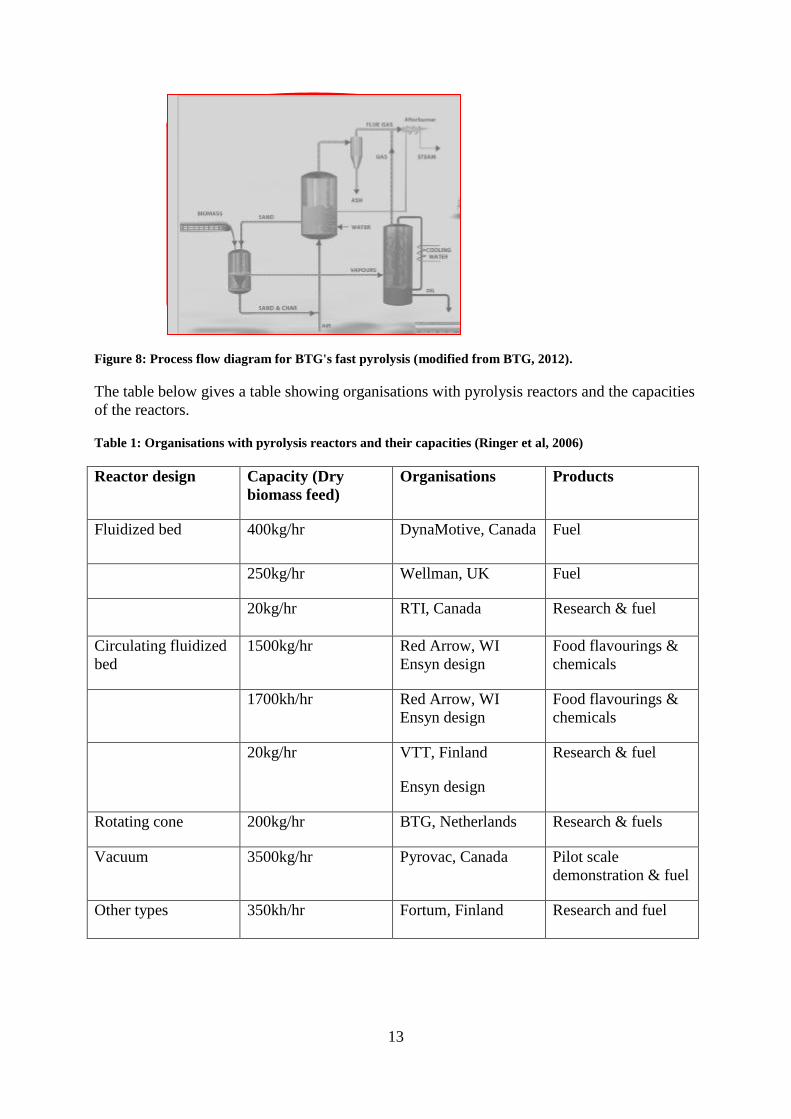
The table below gives a table showing organisations with pyrolysis reactors and the capacities
of the reactors.
Table 1: Organisations with pyrolysis reactors and their capacities (Ringer et al, 2006)
Reactor design Capacity (Dry
biomass feed)
Organisations Products
Fluidized bed 400kg/hr DynaMotive, Canada Fuel
250kg/hr Wellman, UK Fuel
20kg/hr RTI, Canada Research & fuel
Circulating fluidized
bed
1500kg/hr Red Arrow, WI
Ensyn design
Food flavourings &
chemicals
1700kh/hr Red Arrow, WI
Ensyn design
Food flavourings &
chemicals
20kg/hr VTT, Finland
Ensyn design
Research & fuel
Rotating cone 200kg/hr BTG, Netherlands Research & fuels
Vacuum 3500kg/hr Pyrovac, Canada Pilot scale
demonstration & fuel
Other types 350kh/hr Fortum, Finland Research and fuel
14
1.7 Cyclone separator
1.7.1 Historical background
Cyclones separators or simply cyclones are devices that employ centrifugal force generated
by spinning gas stream to separate particles from the carrier gas (Silva et al, 2008). The first
cyclone patent was granted to John Finch from the United States of America in 1885 and
assigned to the Knickerbocker Company. It was called dust collector and despite containing
the essence of today’s modern cyclones, the dust was collected from the side of its body,
rather than through a conical shape bottom. It was a rather complex device and bore little
resemblance to contemporary modern cyclones (Hoffman et al, 2008).
Hoffman et al (2008) also reveal that improvements in the design of cyclones followed
rapidly and by the early1900s, cyclones that bore more resemblance to contemporary modern
cyclones began to emerge. Due to their simple construction, low manufacturing cost,
compactness, lack of moving parts and relative ease of maintenance, cyclones continued to
grow in popularity and improve in both construction and operation. By the 1920s, they began
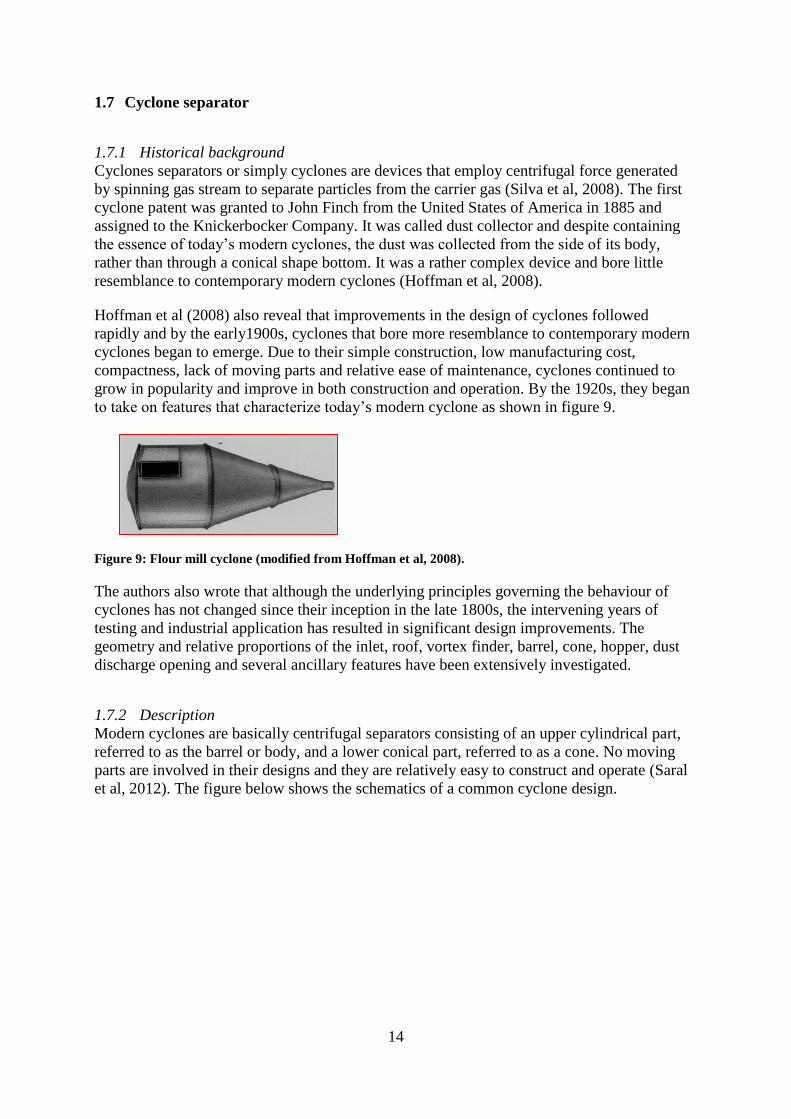
to take on features that characterize today’s modern cyclone as shown in figure 9.
Figure 9: Flour mill cyclone (modified from Hoffman et al, 2008).
The authors also wrote that although the underlying principles governing the behaviour of
cyclones has not changed since their inception in the late 1800s, the intervening years of
testing and industrial application has resulted in significant design improvements. The
geometry and relative proportions of the inlet, roof, vortex finder, barrel, cone, hopper, dust
discharge opening and several ancillary features have been extensively investigated.
1.7.2 Description
Modern cyclones are basically centrifugal separators consisting of an upper cylindrical part,
referred to as the barrel or body, and a lower conical part, referred to as a cone. No moving
parts are involved in their designs and they are relatively easy to construct and operate (Saral
et al, 2012). The figure below shows the schematics of a common cyclone design.

15
Figure 10: Schematics of a common cyclone design (Goula et al, 2011).
Where, D = body diameter, Lb = body height, Lc = cone height, H = inlet height, W = inlet
width, S = length of vortex finder, De = gas exit tube diameter, Dd = dust chamber diameter.
A cyclone separator comprises four major parts: inlet, body or barrel, cone and outlet. The
inlet structure is one of the major parts of the cyclone that governs its collection efficiency
(Saral et al, 2012). The gas stream is passed through an inlet pipe that has a relative small
cross-sectional area in order to increase the gas velocity. The cross-sectional area of the pipe
is preset to sustain high inlet velocities, which in turn, causes the gas to flow in a helical
manner along the body of the cyclone. There are different types of inlet used in gas cyclones;
tangential, helical, axial, or spiral as shown respectively in the figure below.
Figure 11: Types of cyclone inlet (modified from Svarovsky, 2009).
According to Hoffman and Stein, (2008) tangential inlet structures are the most common
designs due to their ease of construction and they generally give good performance.
The body of the cyclone is the main part of the cyclone where the collection occurs. As the
gas stream spins around the wall of the body, heavier particles in the gas stream are forced to
the wall of the body by centrifugal force acting on them. On coming in contact the wall, the

16
particles fall down toward the conical section and they are collected from the bottom of the
cone. Shepherd and Lapple (1939) and Stairmand (1949) have shown through their researches
that the height of the cyclone body should be 1 to 2 times the body diameter and must not be
less than this for best performance.
Within the cyclone, the gas stream makes a number of turns around the outer wall of the body
until it reaches a point within the conical section. It then changes direction and moves upward
towards the exit pipe to form an inner vortex. The purpose of the cone is, therefore, to redirect
the gas flow and to collect the particles. According to Elsayed and Lacor (2011), the bottom
of the conical part must include a hopper where the collected particles are withdrawn. The
hopper must be large enough to avoid particle accumulation, which disturbs the flow of gas
and causes reduced efficiency.
The final part of a cyclone is the exit pipe, also called the vortex finder, through which the
clean gas leaves the cyclone. The vortex finder is one of the most important parts of a cyclone
that governs the cyclone performance, that’s the collection efficiency and the pressure drop.
Chen and Shi (2007) stated that local and frictional losses are two major pressure drop terms
in a cyclone. While Elsayed and Lacor (2010) reported that the highest pressure drop within a
cyclone occurs at the exit pipe, determining the cyclone performance.
1.7.3 How cyclones work
The gas stream enters the cyclone tangentially at the top of the body and moves downward
into the cone forming an outer vortex. The increasing gas velocity in the outer vortex imposes
a centrifugal force on the particles separating them from the gas stream. When the gas reaches
the bottom of the cone, an inner vortex is formed reversing direction and exiting at the top of
the cyclone as clean gas. While the particles fall into the dust collection chamber attached to
the bottom of the cyclone. Figure 12 shows the flow diagram of a cyclone.
Figure12: Flow diagram of a cyclone (modified from Wang, 2004).
1.7.4 Types of cyclones
There are basically two types of cyclones depending on the direction in which the clean gas
leaves the cyclone: the reverse flow and straight through cyclones (Svarovsky, 2009). In the

17
straight through (uniflow) cyclone, the gas enters at one end of the cyclone and leaves at the
other end; it will not be discussed further, in this report, due to its limited use in the industry.
The reverse flow cyclone is the most commonly used type and its principle of operation and
main components have been described above. The reverse flow cyclone is the center of
discussion of this section. Cyclones are typically categorized as high efficiency, conventional
or high throughput (NPTEL). High efficiency cyclones have much smaller inlet cross-sections
leading to increased inlet velocities and resulting in improved collection efficiencies with
higher pressure drop. These cyclones must be used only for low flow rate with high particle
loading as the pressure drop in them are sensitive to flow rate. The high throughput designs
have much higher inlet and outlet cross-sections. These cyclones provide improved collection
efficiencies of large gas flow rate with a low pressure drop. Though, the collection
efficiencies are not as high the high efficiency designs. The conventional cyclones offer
higher collection efficiencies than the high throughputs and lower pressure drops than the
high efficiency designs. Hence, they are employed in most general designs.
Different levels of collection efficiency and operation are achieved by varying the standard
cyclone dimensions (Goula et al, 2011). The standard cyclone dimensions are given in the
figure below.
Table 2: Dimensionless ratios for tangential entry cyclones (Goula et al, 2011)
Name (Q/D2)
1 H/D W/D De/D S/D Lb/D Lc/D Dd/D
Lapple GP 6860 0.5 0.25 0.5 0.625 2.0 2.0 0.25
Stairmand high efficiency 5500 0.5 0.2 0.5 0.5 1.5 2.5 0.375
Stairmand high flow 16500 0.75 0.375 0.75 0.875 1.5 2.5 0.375
Swift high efficiency 4940 0.44 0.21 0.4 0.5 1.4 2.5 0.4
Swift GP 6680 0.5 0.25 0.5 0.6 1.75 2 0.4
Swift high flow 12500 0.8 0.35 0.75 0.85 1.7 2 0.4
Note1: m
3/hr.
It is noteworthy that cyclone dimensions are customarily expressed as a ratio of its body
diameter. According to Fraser et al (2000), the collection efficiency of cyclones varies as a
function of density, particle size and cyclone design. The efficiency will gradually increase
with increase in particle size and/or density; inlet duct velocity; cyclone body length; number
of gas revolutions in the cyclone; ratio of cyclone body diameter to gas exit diameter; inlet
particle loading; smoothness of the cyclone inner wall. Similarly, cyclone efficiency will
decrease with increase in gas viscosity; cyclone body diameter; gas exit diameter; gas inlet
duct area; gas density; leakage of air into the particle outlet.

18
1.7.5 Cyclone performance
Since cyclones came into use in the industries, several researches have been conducted with
focus on improving the performances of cyclones. The main variables describing the cyclone
performance are number of revolutions of the gas stream inside the cyclone, pressure drop,
efficiency and cut diameter (Slack, 2000).
i. Cut diameter (dpc)
The cut diameter is one of the major parameters in assessing the performance of a
cyclone. Saral et al (2012) defined it as the aerodynamic diameter of a particle for
which the cyclone collection efficiency is 50%. It indicates the size range of
particle that can be collected in the cyclone. The cut diameter is specific,
according to Saral et al (2012), for each design and must be calculated for each
case.
dpc = [9µW/{2∏NeVi(ρp - ρg)}] ----------------------------- (1)
ii. Number of effective turns (Ne)
This is the number of revolutions that the gas stream makes until it reaches the
vortex finder (saral et al, 2012).
Ne = [Lb + (Lc/2)] ---------------------------------------------- (2)
iii. Collection efficiency (hc)
The collection efficiency, also known as the overall efficiency, of a cyclone is the
weighted mean of the collection efficiencies for the various size ranges of the
particle. It can be calculated based on the cyclone frictional efficiency (Wang,
2004). The frictional efficiency is defined as the fraction of particles of a given
size collected in the cyclone, compared to those of that size going into the cyclone
(NPTEL). According to Perry et al (2008), the collection is inversely proportional
to the cut diameter.
hc = 1/dpc ---------------------------------------------------------- (3)
iv. Pressure drop (Dp)
The pressure drop in cyclones is another major parameter to be considered in the
process of designing a cyclone. According to Chen and Chi (2007), there are two
components of pressure drop within a cyclone: local losses and continuous losses.
A great fraction of local losses in the cyclone occur due to the expansion at the
inlet and the contraction at the outlet while most of the continuous losses occur
due to the friction with the cyclone’s wall and the exit pipe’s wall. Wang et al
(2006) investigated the pressure fields within a cyclone by inserting pressure
probes at five distinct positions in the cyclone. They reported that the highest
pressure gradients are formed in the radial distance from the center and the static
pressures showed a decreasing trend from the wall toward the center. Their study
also revealed that pressure drop increases with an increase in inlet velocity.

19
Holffman et al (1992) reported lower pressure drops for cyclones with higher
body/cone ratios and with higher dust loadings. This is due to the increased
friction loss along the outer vortex. Since the kinetic energy dissipation is in direct
proportion to the square of the gas velocity, increased friction factor of the cyclone
wall leads to higher kinetic energy dissipation, which in turn, reduces the gas
velocity as it enters the exit pipe. The resulting total pressure drop within the
cyclone is thus lower if the friction coefficient of the cyclone is higher.
In order to estimate overall pressure drop in a cyclone, it would be best to neglect
small compnents like friction. Adding up the expansion and contraction losses at
the inlet and outlet would be a good approach. Shepherd and Lapple (1939)
proposed an empirical relationship for the velocity heads at the inlet and outlet as
shown below’
NH = k(a.b/De2) ..................................................... (4)
Where a, b and De are the cyclone’s inlet and outlet dimenssions respectively, k is
an empirical constant with a value of 16 for tangential inlets and 7.5 for cyclones
with inlet vane, and NH is the sum of velocity heads at the inlet and outlet.
The pressure can be estimated from the velocity heads by using the following
empirical formular (Saral et al, 2012),
DP = 0.005627ρg vi2 NH .......................................... (5)
Where, ρg is gas density in kg/m3, vi is the inlet velocity in m/s and DP is the
estimated pressure drop in cmH2O.
1.7.6 Advantages and disadvantges of cyclones
a. Advantages:
i. Low capital cost due to few parts and ease of manufacture.
ii. Ability to operate at high temperatures since all the parts are metallic.
iii. Low maintenance requirements as a result of no moving parts.
b. Disadvantages:
i. Low collection efficiencies, especially for very small particles.
ii. High operating costs resulting from power required to overcome the large pressure
drop.
1.7.7 Applications of cyclones
Cyclones are widely used in various industries for removing dust and mists from gas stream.
Some of the industries making extensive use of the devices are:
i. Oil and gas,

20
ii. Power generation,
iii. Incineration plants,
iv. Ore sintering plants,
v. Cements plants,
vi. Iron and steel industries,
vii. Coaled fired plants,
viii. Grain processing facilities.
21
2. Purpose and limitations
The purpose of this thesis is to design and construct a small-scale fixed-bed reactor for
thermal investigation of processes from pyrolysis to combustion, of especially mixed
materials ranging from biomass to municipal solid waste. It is intended for the fixed-bed
reactor to mimic the furnace section inside a grate-fired boiler, hence more attention will be
given to the fuel, fuel combustion, air supply and the flue gases. Previously, some work have
been done by Hassanieh (2013), who determined the height of the reactor and the mass flow
rate of the fuel, so this thesis will commence by making a choice of the fuel feeder from
available alternatives provided by companies specialized in the area, and its position on the
reactor will be determined. Attempt will be made to determine the temperature of the flue
gases along the height of the reactor with the use of thermo-couples. The best positions of the
thermo-couples and gas extractors will also be determined. The best control of air flow to
obtain bio-oil from the gases using a cyclone separator will be considered.
The design for these units was done in house and outsourced from external companies who
are specialists in this field as there is no workshop at the University. A major problem that
besotted this project was slow responses from the specialist companies, especially those to
construct the major components. As the components are somewhat depended on each other
dimension-wise, this led to delays in the execution of the project.
3. Methodology
The thesis work was commenced by reviewing the previous work and projects that have been
done in this area. The positions of the feeder and thermocouple/gas extractor ports on the
oven were determined. How to assemble the feeder on the oven was modified after
discussions with the expert company to accommodate the cooling of the feeder tube using a
water cooler. The water jacket for the water cooler was modeled using Comsol Mulphysics
which aided to determine its capacity.
Top and bottom flanges were to be attached to the oven, they were designed and contracted to
a local workshop for construction. The bottom flange is to serve the multipurpose medium of
introducing the gasifying agents into the oven, preheating the gasifying agents, bed for the
feedstocks and ash collector. The bottom flange is to be assembled to the oven in such a way
that it can be taken off to dispose the ash and clean the oven when necessary. The top flange
is to connect the oven to the cyclone separator and directs the product gases into the cyclone
separator and allows for their cooling before entering the cyclone separator.
It was necessary to get the right thermocouples for the project, this informed a discussion with
a PhD student at the University of Boras, whose research involved the use of thermocouples.
The flow rate of the gasifying agents were calculated and several communications, via emails
and in person, were made with the expert company to identify the best mass flow controller
suitable for the flow rates as well as the project. After a search for ignition system
manufacturers, a company was contacted for possible supply of ignition system suitable for
the project.
A single cyclone separator was decided upon to be used in the project to extract both dust and
probably bio-oil form the product gases. The calculations were done based on certain
assumptions to determine the size of the cyclone and there after contracted to the workshop
constructing the flanges. The workshop was also contacted to construct the water jacket over
22
the feeder tube for the purpose of cooling the feeder tube. In the sections that follow, the
design for the cyclone separator and modeling of the water cooler will be described.
3.1 Cyclone separator
In order to design for the cyclone separator, the volume flow rate of the product gases from
the reactor had to be determined from their compositions.
To determine the product gases compositions, the following assumptions are made:
i. The biomass contains only carbon, hydrogen and oxygen and it is represented by the
general formula CHmOp,
ii. The gasifying agent is air,
iii. The reactions in the reactor are at thermodynamic equilibrium and at a pressure of
1bar,
iv. Heat losses in the reactor are neglected and the reactions proceed adiabatically,
v. The ashes are considered negligible and contains no carbon ,
vi. No tars and char in the product gases.
The table below shows the proximate analysis of the biomass.
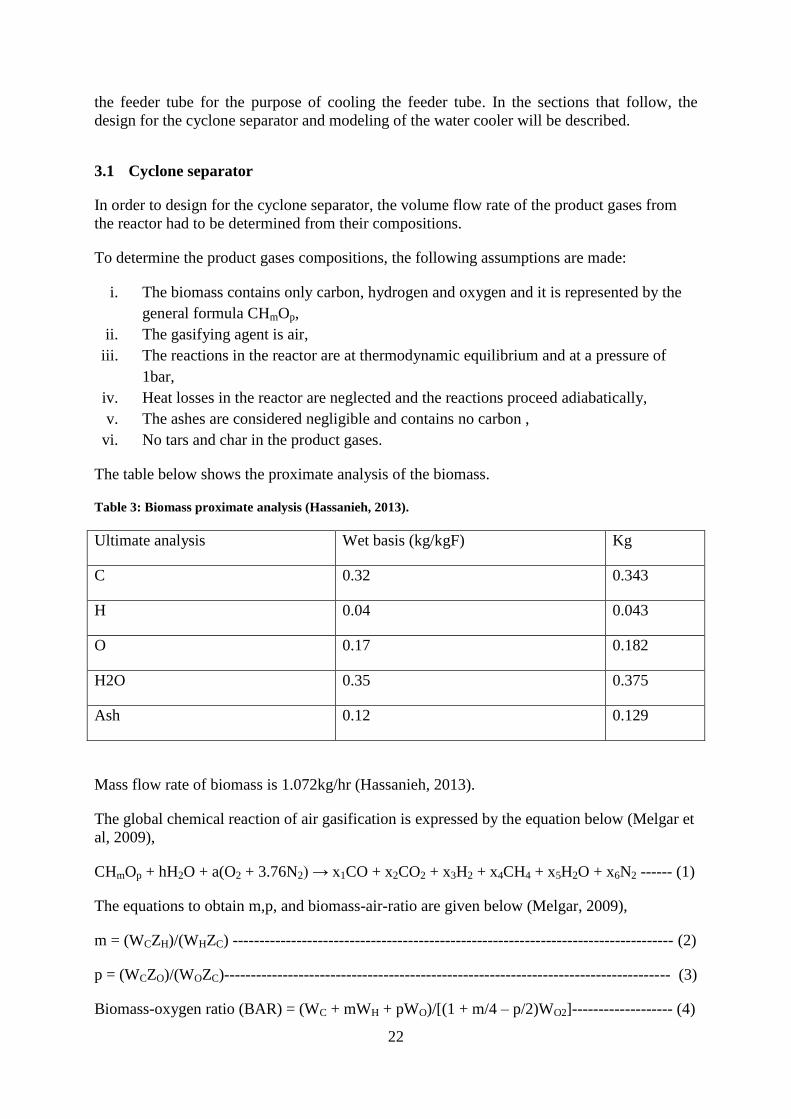
Table 3: Biomass proximate analysis (Hassanieh, 2013).
Ultimate analysis Wet basis (kg/kgF) Kg
C 0.32 0.343
H 0.04 0.043
O 0.17 0.182
H2O 0.35 0.375
Ash 0.12 0.129
Mass flow rate of biomass is 1.072kg/hr (Hassanieh, 2013).
The global chemical reaction of air gasification is expressed by the equation below (Melgar et
al, 2009),
CHmOp + hH2O + a(O2 + 3.76N2) → x1CO + x2CO2 + x3H2 + x4CH4 + x5H2O + x6N2 ------ (1)
The equations to obtain m,p, and biomass-air-ratio are given below (Melgar, 2009),
m = (WCZH)/(WHZC) ----------------------------------------------------------------------------------- (2)
p = (WCZO)/(WOZC)------------------------------------------------------------------------------------ (3)
Biomass-oxygen ratio (BAR) = (WC + mWH + pWO)/[(1 + m/4 – p/2)WO2]------------------- (4)

23
Where,
W = atomic weight,
Z = mass fraction,
C = carbon atom,
H = hydrogen atom,
O = oxygen atom.
m and p are the number of atoms of hydrogen and oxygen per carbon atom in the biomass. x1
,x2 ,x3 ,x4 ,x5 and x6 are the number of moles of carbon monoxide, carbon dioxide, hydrogen,
methane, moisture and nitrogen produced. h is the amount of moisture per kmol of the
biomass and a is the reacting moles of air.
m = (12 × 0.043)/(1 × 0.343)
= 1.5.
P = (12 × 0.182)/(16 × 0.343)
= 0.4.
h = nH2O/nF = (mH2O × MF)/(MH2O × mF)
Where,
n = number of moles, m = mass and M = molar mass
MF = 12 + (1.5 × 1) + (0.4 × 16)
= 19.9 kg/kmol.
h = (0.375 × 19.9)/ (18 × 1.072)
= 0.387.
Therefore, the general chemical reaction equation of air gasification in stoichiometric
condition can be re-written as shown below,
CH1.5O0.4 + 0.387H2O + a(O2 + 3.76N2) → x1CO2 + x2H2O + 3.76aN2 ----------- (5)
Performing atomic balance of each element present in equation (5) the following equations
below are obtained.
Carbon balance:
1 = x1 ----------------------------------------------------------------------- (6)
Hydrogen balance:

24
0.774 + 1.5 = 2x2 ------------------------------------------------------------ (7)
Therefore, x2 = 1.137
Oxygen balance:
0.4 + 0.387 + 2a = 1 + 1.137 ---------------------------------------------- (8)
Therefore, a = 0.675
Hence, moles of N2 = 3.76 × 0.675
= 2.538
Hence total mole of product gas = 1+ 1.137 + 2.538
= 4.675kmol/kmolF
= (4.675 × 1.072) / 19.9
= 0.25184kmol/h
= 6.996×10^-5kmol/s
Volume flow rate (Vf) = (nRT)/p
= (6.996×10^-5 × 1000 × 8.314 × 673)/101325
= 0.00386m3/s
To design for the cyclone separator, the following assumptions were made:
i. cyclone body diameter (D) = 120mm
ii. inlet diameter (Di) = 20mm.
Other geometric dimensions of the cyclone separator can be determined from the geometrical
ratios provided by Simplex and they are given in the table below;
Table 4: Geometrical ratios for cyclone separator (Fodora et al, 2012).
Diameter of gas exit De/D 0.25
Length of vortex finder, S/ De 3.0
Length of body, Lb/D 2.0
Length of cone, Lc/D 2.0
Diameter of dust exit, Dd/ De 1.1
25
De = 120/4
= 30mm.
S = 30 × 3
=90mm.
Lb = Lc = 2 × 120
= 240mm.
Dd = 30 × 1.1
= 33mm.
Cyclone inlet area (Ain) = (∏d2)/4
= [ ∏ × (0.02)2]/4
= 0.0003142m2
Area of gas exit (A0ut) = (∏d2)/4
= [ ∏ × (0.03)2]/4
= 0.00070695m2.
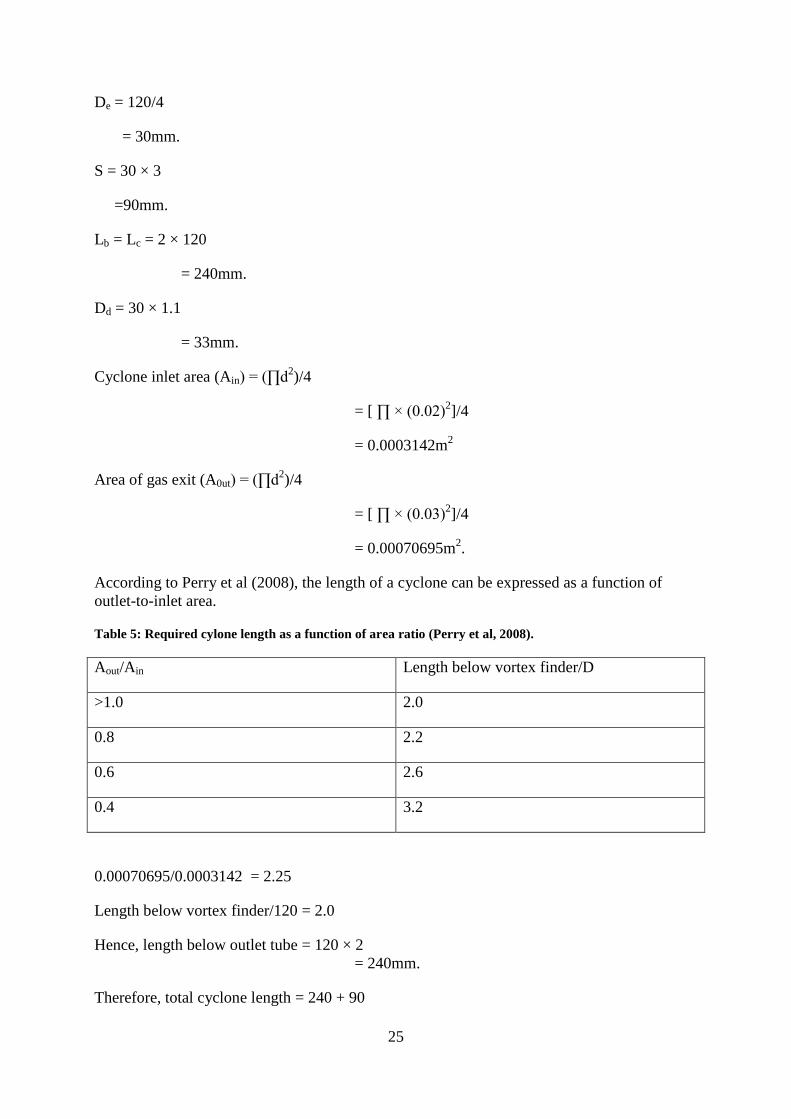
According to Perry et al (2008), the length of a cyclone can be expressed as a function of
outlet-to-inlet area.
Table 5: Required cylone length as a function of area ratio (Perry et al, 2008).
Aout/Ain Length below vortex finder/D
>1.0 2.0
0.8 2.2
0.6 2.6
0.4 3.2
0.00070695/0.0003142 = 2.25
Length below vortex finder/120 = 2.0
Hence, length below outlet tube = 120 × 2
= 240mm.
Therefore, total cyclone length = 240 + 90

26
= 330mm.
Assuming Lb = Lc = 330/2
= 165mm.
To determine the cut point diameter (d50) and the efficiency of the cyclone;
Tangential velocity (UT) = Vf / Ain
= 0.00386/0.0003142
= 12.3m/s.
Number of effective turns (Ne) = [Lb + ]
Ne = [165 + (165/2)] = 12.375
d50 = [9Wµ/2∏NeUT(∆p)]1/2
Where, µ = viscosity of product gas = µN2 = 2.822×10^-5kg/ms
W = 0.02m, UT = 12.3m/s,
Dρ = ρp – ρg
ρp = particle density and ρg = gas density
Hence, d50 = [(9×0.02× 2.822× 10^-5)/(2× 3.142× 12.375× 12.3∆p]1/2
= 0.0000736/√∆p
Efficiency (E) of the cyclone = 1/d50 (Perry et al, 2008)
Therefore, E = √∆p/0.0000736.
3.2 Water cooler simulation
The simulation of the water cooler was achieved using Comsol Multiphysics, a computer
software with a simulation environment that includes the possibility to add any physical effect
to models. It is a flexible platform that allows users to model all relevant physical aspects of
their designs with real world precision.
Several equations are incorporated in the Comsol software, which applies these equations
through different physics to model designs. The relevant equations to model the water cooler
are the heat transfer and flow equations given below (Chern, 2006),
Heat transfer equation: rvcp.VT = V. (kVT) + Q
Flow equation : ∑F = ∫∫c.s. ρv(v.n)dA + (∂/∂t)[ ∫∫∫c.v. ρvdv].

27
The heat transfer equation governs the transfer of heat to the water from the feeder tube while
the flow equation governs the flow of water around the feeder tube. The aim of the model is
to compute water outlet temperature.
To simulate the water cooler and determine its cooling capacity, the following assumptions
were made;
i. Volume flow rate of water is 2l/min (0.0000333m3/s),
ii. Thickness of water jacket : 2mm or 3mm were to be investigated,
iii. Inlet temperature of water to water jacket is 5°C,
iv. Non-Isothermal and laminar flow for water in the water jacket,
v. The whole system was modelled in 2D using an axisymmetric geometry based on a
rotational symmetry,
vi. No-slip conditions for the flow field on the boundaries between the feeder tube wall
and water,
vii. Heat transport via conduction only through the feeder tube wall,
viii. Convective heat flux boundary condition was used for boundaries between water and
feeder tube wall,
ix. The portion of the feeder tube in contact with heat to have a maximum temperature of
700°C and 45mm in length,
x. The portion of the feeder tube not in contact with heat to have a maximum
temperature of 25°C and 155mm in length,
xi. The water jacket is modelled as a pipe with flow in one direction and length doubled
to account for the reverse flow of water.
The simulation was done using 2mm and 3mm for the water jacket thickness separately to
determine which thickness provides better cooling capacity with respect to available area for
water flow. Other parameters used in the simulations and how they were obtained are
described below.
28
Water jacket wall
thickness
Feeder tube
wall
Water jacket
Water inWater
out
DC
A B
L
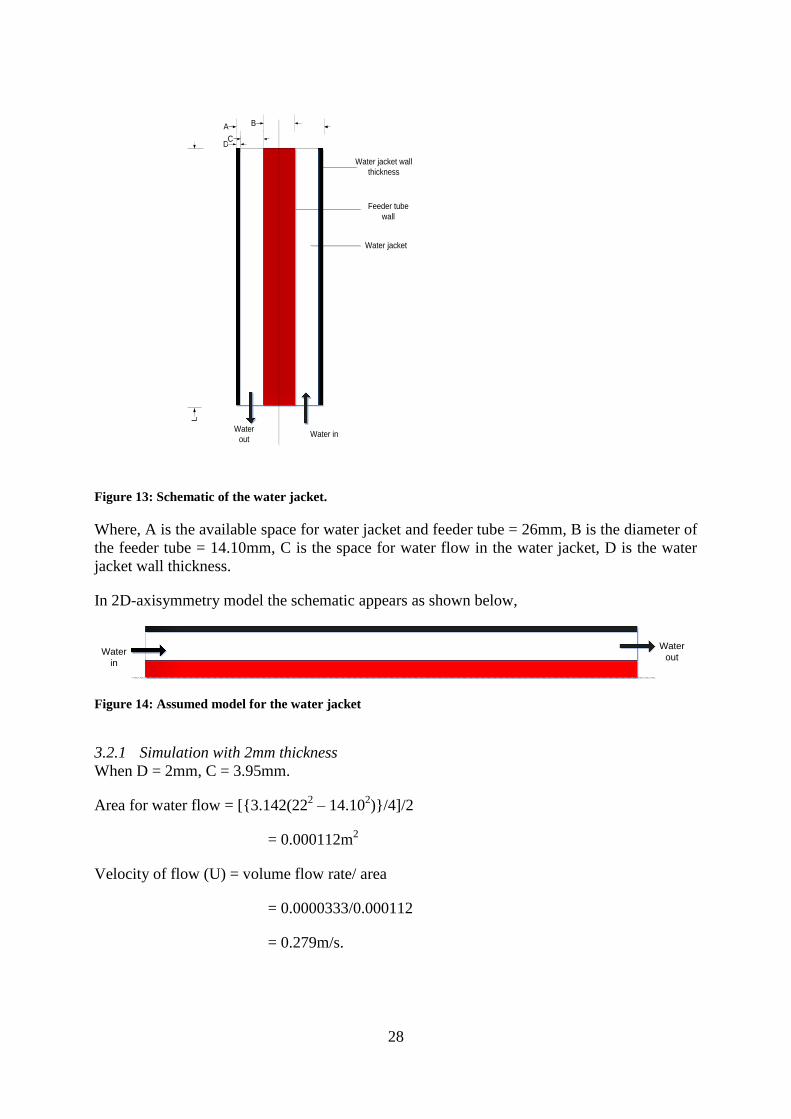
Figure 13: Schematic of the water jacket.
Where, A is the available space for water jacket and feeder tube = 26mm, B is the diameter of
the feeder tube = 14.10mm, C is the space for water flow in the water jacket, D is the water
jacket wall thickness.
In 2D-axisymmetry model the schematic appears as shown below,
Water
in
Water
out
Figure 14: Assumed model for the water jacket
3.2.1 Simulation with 2mm thickness
When D = 2mm, C = 3.95mm.
Area for water flow = [{3.142(222 – 14.10
2)}/4]/2
= 0.000112m2
Velocity of flow (U) = volume flow rate/ area
= 0.0000333/0.000112
= 0.279m/s.

29
Re = ρUC/µ
Where, Re is Reynolds number and µ is the dynamic viscosity of water
Re = (1000 × 0.279 × 3.95×10-3
)/1.519 × 10-3
= 773.15
This implies that the flow is laminar and hence, Nu = hC/K = 3.657 (Incropera et al, 2007).
h = (3.657 × 44.5)/ 3.95×10-3
= 41199.114W/m2K.
The values of U and h were imputed into the simulation and the average outlet temperature of
water from jacket was contained 303.97K (from Comsol model)
Hence, Cooling capacity of water cooler = 1000 × 0.0000333×4.187(303.97 -278.15)
= 3.6kW.
3.2.2 Simulation with 3mm thickness
When D = 3mm, C = 2.95mm
Area for water flow = [{3.142(202 – 14.10
2)}/4]/2
= 0.000079m2
Velocity of flow = 0.00003333/0.000079
= 0.42m/s.
Re = (1000 × 0.42 × 2.95×10-3
)/1.519 × 10-3
= 818.5
This implies laminar flow, hence Nu = hC/K = 3.657 (Incropera et al, 2007).
h = (3.657 × 44.5)/ 2.95×10-3
= 55164.92W/m2K.
Similarly, the values of U and h were imputed into the simulation and the average outlet
temperature of water from jacket was contained 309.21K (from Comsol model).
Hence, Cooling capacity of water cooler = 1000 × 0.0000333×4.187(309.21 -278.15)
= 4.33kW

30
4. The small-scale fixed-bed reactor and its components
The complete model of the reactor is shown in the figure below,
Thermo-
couples
ElectrodeSecondary air
inlet
Feeding
trough
Hopper
Oven
Insulator
Gasifying
agents inet
Top flange Cyclone
separator
Product gases
outlet
Figure 15: Schematic representation of the reactor design.
4.1 Oven
The oven is constructed from stainless steel, this is due to the high resistance of stainless steel
to high temperatures, oxidation and high temperature corrosion. The oven is 1m high and 7cm
in diameter with an outer diameter of 22cm for the purpose of insulation. The lower half of
the oven is only heated while the upper half is kept without heating to allow the product gases
to cool down before leaving the reactor. The heating is provided by Fibrothal heating
modules, which includes Kanthal A-1 heating resistance wires.
4.2 Screw feeder
A screw feeder was chosen for this project because it does not require much treatment of the
feedstock and consumes less energy. However, due to the low mass flow rate (approx. 1kg/hr)
of feedstock calculated for this project a volumetric screw feeder was selected. The feeder has
a residence time of 2.4mins, an RPM of 100 and a tube diameter of 14.10mm. To prevent the
feedstock from reacting along the feeder tube, a water jacket will be fitted around the tube to
provide cooling with the aid of a water cooler. To allow for its water cooing the feeder was
31
connected to the oven via a pipe at an angle of 45°. 45° inclination was chosen to enhance delivery of the feedstock into the oven. An inert gas, nitrogen, will be blown down the
inclined pipe to ensure the feed to ensure the feedstock moves towards the oven and to
provide cooling for the pipe.
4.3 Thermo-couples
A thermo-couple is a sensor used to measure temperature. Thermo-couples consist of two
wire legs made from different metals. These wire legs are welded together at one end,
creating a junction. This junction is where the temperature is measured. When the junction
experiences a change in temperature, a voltage is created. The voltage can then be read off an
adjoining computer.
There are several types of thermo-couples (J, K, T, N, E, etc.), each with its own unique
properties in terms of temperature range, chemical and vibration resistance, durability and
application compatibility.
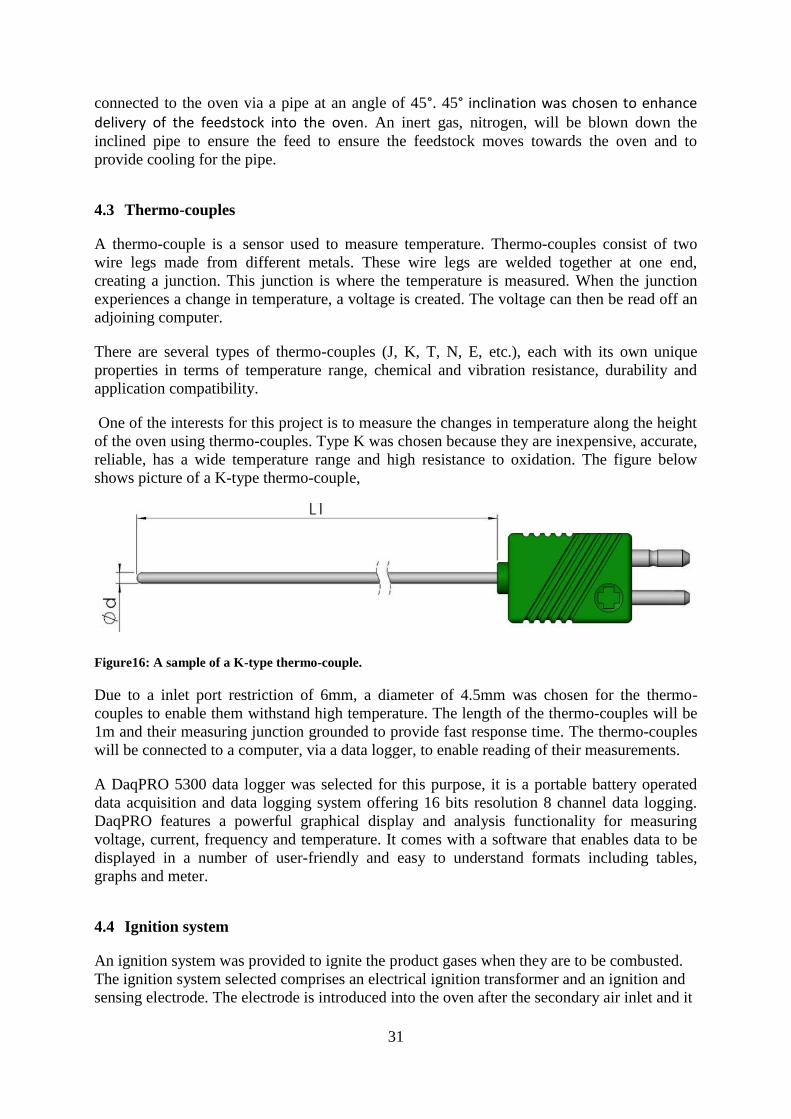
One of the interests for this project is to measure the changes in temperature along the height
of the oven using thermo-couples. Type K was chosen because they are inexpensive, accurate,
reliable, has a wide temperature range and high resistance to oxidation. The figure below
shows picture of a K-type thermo-couple,
Figure16: A sample of a K-type thermo-couple.
Due to a inlet port restriction of 6mm, a diameter of 4.5mm was chosen for the thermo-
couples to enable them withstand high temperature. The length of the thermo-couples will be
1m and their measuring junction grounded to provide fast response time. The thermo-couples
will be connected to a computer, via a data logger, to enable reading of their measurements.
A DaqPRO 5300 data logger was selected for this purpose, it is a portable battery operated
data acquisition and data logging system offering 16 bits resolution 8 channel data logging.
DaqPRO features a powerful graphical display and analysis functionality for measuring
voltage, current, frequency and temperature. It comes with a software that enables data to be
displayed in a number of user-friendly and easy to understand formats including tables,
graphs and meter.
4.4 Ignition system
An ignition system was provided to ignite the product gases when they are to be combusted.
The ignition system selected comprises an electrical ignition transformer and an ignition and
sensing electrode. The electrode is introduced into the oven after the secondary air inlet and it

32
comes in direct contact with the product gases. The figures below shows an FE model
electrode and a TGI ignition transformer respectively,
Figure 17: FE electrode.
Figure 18: TGI ignition transformer.
The transformer creates a high voltage that is transmitted to the electrode and generates a
spark between the electrode and the burner ground.
4.5 Gasifying agents and secondary air
Gasifying agents to be used will be air, nitrogen or carbon dioxide depending on the processes
considered in the reactor, whether pyrolysis only or gasification as well. The agents will be
fed into the reactor through a bottom flange where they will be heated before entering the
oven. The secondary air will be necessary when the product gases need to be combusted.
Mass flow controllers are required to supply these agents and secondary air to the reactor at
the needed flow rate. The figure below shows a Smart Link Advantage mass flow controller
selected for the purpose,
33
Figure 19: A smart link advantage mass flow controller.
This controller covers an extremely broad range of flow rates, it allows multi-gas and multi-
range capabilities with storage and pre-programming of several gas calibrations making it
possible to switch between different gases and range on the a single device. The coplanar
valve exhibits superior turndown, repeatability, stability and response time.
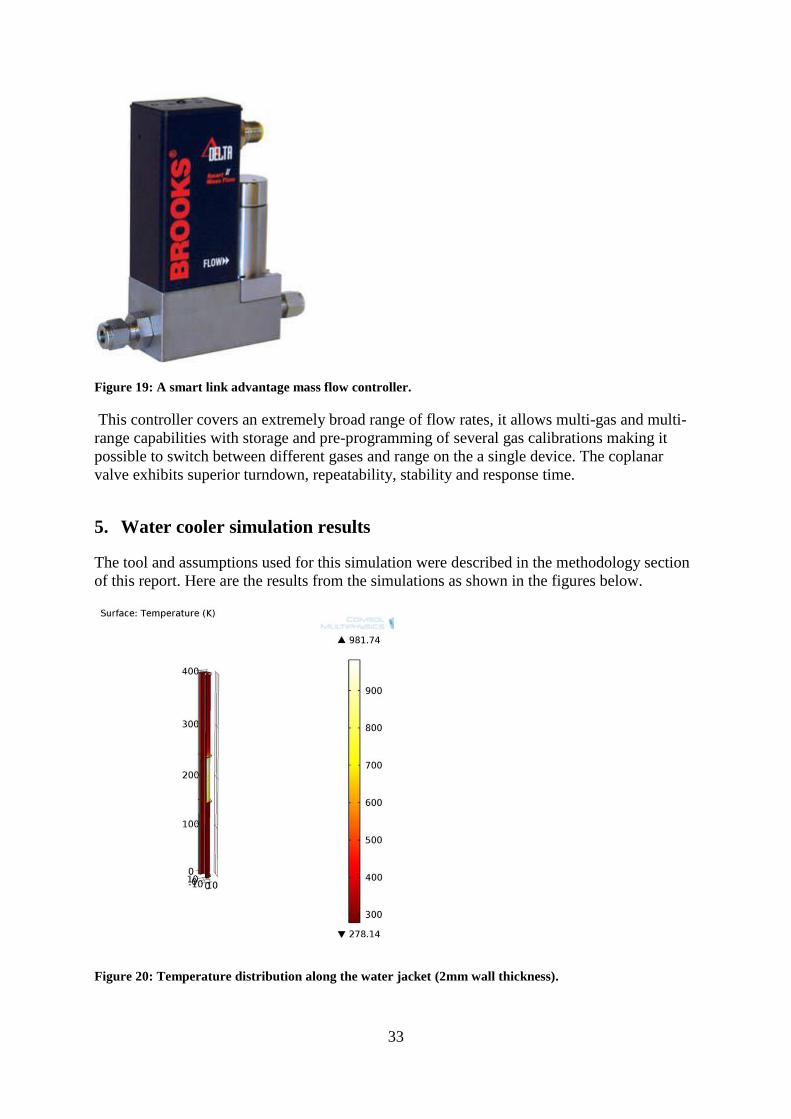
5. Water cooler simulation results
The tool and assumptions used for this simulation were described in the methodology section
of this report. Here are the results from the simulations as shown in the figures below.
Figure 20: Temperature distribution along the water jacket (2mm wall thickness).

34
Figure 21: Velocity distribution along the water jacket (2mm wall thickness).
Figure 22: Temperature distribution along the water jacket (3mm wall thickness).

35
Figure 23: Velocity distribution along the water jacket (3mm wall thickness).
Table 6:Temperatures from the Comsol simulation.
2mm wall thickness 3mm wall thickness
Water outlet average
temperature
303.92K 309.21K
Feeder tube maximum
temperature
278.3K 278.4K
Maximum average water
temperature
343.95K 344.80K
Figures 20 and 22 show the temperature distributions of the water along the water jacket with
2mm and 3mm wall thickness respectively. The temperature of the water can be seen to be
increasing from bottom to top (inlet to outlet) as it flows along the water jacket, due to heat
transferred to it from the wall of the water jacket, in both cases. It can be observed from table
6 that the water exit temperature is lower in the jacket with 2mm wall thickness than in the
jacket with 3mm wall thickness; this is due to the lower convective heat transfer co-efficient
in the 2mm set-up. The exit temperatures give an idea of the cooling capacity required to cool
the feeder tube, with the lower exit temperature resulting in a lower cooling capacity.

36
The maximum temperatures of water and feeder tube as observed also from table 6 indicate
the water average temperature at the region of the jacket exposed to the maximum oven
temperature and temperature of the feeder tube in the same region respectively for both cases.
The aim of the cooling system is to cool the feeder tube during operation, the maximum
feeder tube temperature gives an idea how well this is achieved and from the values in table 6
it can be assumed that the cooling system with the assumed volume flow rate can provide a
good insulation for the feeder tube. This implies less heat will get to the feeder tube thereby
achieving the aim of preventing the feedstock from reacting before entering the oven.

37
6. Conclusion
The designed small-scale fixed-bed reactor could serve as a research facility to convert
biomass and municipal solid wastes into energy or energy carriers. It can be used to
investigate pyrolysis, gasification or combustion processes depending on the gasifying agents
used and the operating temperature in the reactor.
The water jacket with 2mm wall thickness gave lower cooling capacity and maximum feeder
tube temperature and hence should be utilized for the cooling system.
Assembling the various components of the reactor and conducting experiments with the
reactor will contribute to completely achieving the aim of the project.

38
7. References
Bailie, R.C. (1979). Hessleman gas generator testing for solar energy research institute.
Contract No. AH-8-1077-1.
Basu, P., (2010). Biomass gasification, pyrolysis and torrefaction: practical design and
theory, 2nd
Ed. Academic Press, San Diego, USA.
Biomass Technology Group (2012). Fast pyrolysis. Available at
www.btgworld.com/en/rtd/technologies/fast-pyrolysis. (Accessed on 2013/10/10).
Bloor, M.I., Ingham, D.B., (1975). The leakage effect in the industrial cyclone. Chemical
Engineering Research and Design. Vol. 53; pg. 7-11.
Bloor, M.I., Ingham, D.B., (1975). Turbulent spin in a cyclone separator. Trans IchemE.
Vol. 53; pg. 1-6.
Boateng, A.A., Walawender, W.P., Fan, l.T. and Chee, C.S. (1992). Fluidized bed
gasification of rice hull. Bio-resource Technology. Vol. 40; pg. 235-239.
Cao, Y., Wang, Y., Riley, J. and Pan, W. (2005). A novel biomass air gasification process
for producing tar-free higher heating value fuel gas. Fuel Processing Technology. Vol.
87; pg. 343-353.
Chang, A.C., Chang, H., Lin, F., Lin, K., Chen, C., (2011). Biomass gasification for
hydrogen production. International Journal of Hydrogen Energy. Vol. 36; pg. 14252-60.
Charision, N.D., Tsevrenis, G.J. and Guola, M.A. (2011). Software Development of the
Design of Control Equipment for Particulate Pollutants. Proceedings of the 12th
International Conference on Environmental Science and Technology, Rhodes, Greece,
September 8-10.
Chern, M., (2006). Fluid Mechanics, 1st Ed. NTUST, Taipei, Taiwan.
Eppinger, T., Seidler, K., Kraume, M., (2011). DEM-CFD simulations of fixed bed
reactors with small tube to particle diameter ratios. Chemical Engineering Journal. Vol.
166; pg. 324-331.
Ergudenler, A. (1993). Gasification of wheat straw in a dual-distributor type fluidized bed
reactor. Unpublished Ph.D. Thesis. Technical University of Novia Scotia, Novia Scotia,
Canada. (Accessed on 2013/10/15).
Fonts, I., Juan, A., Gea, G., Murillo, M., and Sanchez, J., (2008). Sewage sludge pyrolysis
in fluidized bed, 1: Influence of operational conditions on the product distribution.
Industrial and Engineering Chemistry Research. Vol. 47; pg. 5376-85
Fraser, S.M., Abdel Razak, A.M., Abdullah, M.Z., (2000). Computational and
experimental investigations in cyclone dust separator. Proceedings of the Institution of
Mechanical Engineers Part-E. Vol. 211; pg. 241-57.
Grassi, G., Gosse, G., Dos-Santos, G., (1990). Biomass for energy and industry. Elsevier
Applied Science.

39
Green Light Energy Solutions: waste converstion pyrolysis. Available at
www.glescorp.com/en/energy_dep/technology_1.html. (Accessed on 2013/10/10).
Groves, J.D., Craig, J.D., Le Pori, W.A. and Anthony, R.G. (1979). Fluidized bed
gasification of cotton gin waste. ASAE paper No. 79-4547. Presented at ASAE winter
meeting, New Orleans, Louisiana.
Hassanie, S., (2013). Design and construction of a lab-scale grate-fired boiler. Master
thesis report, School of Engineering, University of Boras, Boras, Sweden.
He, M., Hu, Z., Xiao, B., Li, J., Guo, X., Luo, S., et al., (2009). Hydrogen-rich gas from
catalytic steam gasification of municipal solid waste (MSW): influence of catalyst and
temperature on yield and product composition. International Journal of Hydrogen Energy.
Vol. 34; pg. 195-203.
Hoffmann, A.C., and Stein, L.E. (2008). Gas Cyclones and Swirl Tubes, Principles,
Design and Operation. 2nd
Ed. Springer, New York.
Hoveland, A.D., Walawender, W.P., Fan, L.T. and Lai, F.S. (1982). Steam gasification of
grain dust in a fluidized bed reactor. Transactions of ASAE. Vol. 25; pg. 1074-1080.
Incropera, F.P., Dewitt, D.P., Bergman, T.L., and Lavine, A.S., (2007). Fundamentals of
Heat and Mass Transfer. 6th
Ed, John Wiley & Sons, Inc., New Jersey, USA.
Karagoz, I., Avci, A., (2003). Effects of flow and geometrical parameters on the collection
efficiency in cyclone separators. Journal of Aerosol Science. Vol. 34; pg 937-955.
Karagoz, I., Avci, A., (2005). Modelling of the pressure drop in tangential inlet cyclone
separators. Aerosol Science Technology. Vol. 113; pg. 97-108.
Karagoz, I., Avci, A., (2013). Design and performance evaluation of a new cyclone
separator. Journal of Aerosol Science. Vol. 59; pg 57-64.
Kaya, F., Karagoz, I., Avci, A., (2011). Effects of surface roughness on the performance
of tangential inlet cyclone separators. Aerosol Science Technology. Vol. 45; pg. 988-995.
Kumar, A., Eskridge, K., Jones, D.D., Hanna, M.A., (2009). Steam-air fluidized bed
gasification of distiller’s grains: effects of steam to biomass ratio, equivalence ratio and
gasification temperature. Bio-resource Technology. Vol. 100; pg. 2062-8.
Li, W.Z., Yan, Y.J., Li, T.C., Ren, Z.W., Huang, M., Wang, J., et al., (2007). Preparation
of hydrogen with a novel high strength catalyst. Energy Fuels. Vol. 22; pg. 1233-8.
Lian, C.K. and Findley, M.E. (1982). Air blown wood gasification in large fluidized bed
reactor. Industry & Engineering Chemistry Process design and Development. Vol. 21; pg.
699-701.
Lv, P., Chang, J., Xiong, Z., Huang, H., Wu, C., Chen, Y., et al., (2003). Biomass air-
steam gasification in a fluidized bed to produce hydrogen-rich gas. Energy Fuels. Vol. 17;
pg. 677-82.

40
Lv, P.M., Xiong, Z.H., Chang, J., Wu, C.Z., Chen, Y., Zhu, J.X., (2004). An experimental
study on biomass air-steam gasification in fluidized bed. Bio-resource Technology. Vol.
95; pg. 95-101.
Narvaez, I., Orio, A., Aznar, M.P., Corella, J., (1996). Biomass gasification with air in an
atmospheric bubbling fluidized bed. Effects of six operational variables on the quality of
the produced raw gas. Industrial and Engineering chemistry Research. Vol. 35; pg. 2110-
20.
Olivares, A., Aznar, M.P., Cabellero, M.A., Gil, J., Francis, E., Correla, J., (1997).
Biomass gasification: produced gas upgrading by in-bed use of dolomite. Industrial and
Engineering Chemistry Research. Vol. 36; pg. 5220-6.
Radmanesh, R., Chaouki, J., Guy, C., (2006). Biomass gasification in a bubbling fluidized
bed reactor: experiments and modelling. Aiche Journal. Vol. 52; pg. 4258-72.
Ringer, M., Putsche, V. and Scahill, J., (2006). Large-scale pyrolysis oil production: A
technology assessment and economic analysis. NREL/TP-510-377779. Available from
National Renewable Energy Laboratory, Golden, CO.
Sadaka, S., (2011). Gasification. Available at
http://bioweb.sungrant.org/NR/rdonlyres/F4AE220B-0D98-442C-899F-
177CFD725ADD/0/Gasification.pdf. (Accessed on 2013/10/10).
Saral, A. and Demir, S. (2012). Cyclone Separators.
Silva, M.K., Claumann, C.A., Machedo, R.A., and Quadri, M.B. (2008). CFD Modelling
of Lapple Cyclone for Gas Solid Separation.3rd
Latin America CFD meeting applied to oil
and gas industry, August 18-19.
Slack, M.D., (2000). Advances in cyclone modelling using unstructured grids. Trans
IchemE. Vol. 78; pg. 1098-104.
Slapak, M.J., Kasteren, J.M. and Drinkenburg, A.A. (200). Design of a process for steam
gasification of PVC waste. Resources, Conservation and Recycling. Vol. 30; pg. 81-93.
SunGrant Bioweb: an online resource for bioenergy and bioproducts. Availaable at
www.bioweb.sungrant.org/General/Biopower/Technologies?pyrolysis/Default.htm.
(Accessed on 2013/10/10).
Svarovsky, L. (2009). Gas cyclones. Elsevier, Amsterdam.
Tanksale, A., Beltramini, J.N., Lu, G.M., (2010). A review of catalytic hydrogen
production processes from biomass. Renewable and Sustainable Energy Reviews. Vol.
14; pg. 166-82.
Tillman, D.A. (1987). Biomass combustion. Biomass: Regenerable Energy. Hall, D.O. and
Overened, R.P. (eds). John Wiley and sons, pg. 203-219.
Wang, L. (2004). Theoretical Study of Cyclone Design. An unpublished PhD thesis,
department of Biological and Agricultural Engineering, Texas A & M University.

41
Wang, L., Weller, C.L., Jones, D.D., Hanna, M.A., (2008). Contemporary issues in
thermal gasification of biomass and its application to electricity and fuel production.
Biomass and Bio-energy. Vol. 32; pg. 573-81.
Warnecke, R., (2000). Gasification of biomass: comparison of fixed bed and fluidized bed
gasifiers. Biomass and bio-energy. Vol. 18; pg. 489-497.
Watkinson, A., Cheng, C., and Lim, C. (1987). Oxygen-steam gasification of coals in a
spouted bed. Journal of Chemical Engineers. Vol. 65; pg. 791-798.
Weil, S.A., Nandi, S.P., Punwani, D.V. and Johnson, J.L. (1978). Peat hydrogasification.
Presented at 176th
National meeting of ACS, Miami, Florida.
Williams, R., Parker, N., Yang, C., Ogden, J., and Jenkins, B. (2007). Hydrogen
Production via Biomass Gasification: Advanced Energy Pathways (AEP) Project. Task4.1
Technology Assessments of Vehicle Fuels and Technologies, Public Interest Energy
Research (PIER) Program, California Energy Commission. Prepared by UK Davis,
Institute of Transportation Studies (ITS-Davis) one Shields, Ave, Davis, Calif, USA.

42
APPENDIX A
FURNACE AND SCREW FEEDER

43

44

45
APPENDIX B
CYCLONE SEPARATOR

46
APPENDIX C
MASS FLOW CONTROLLER

47
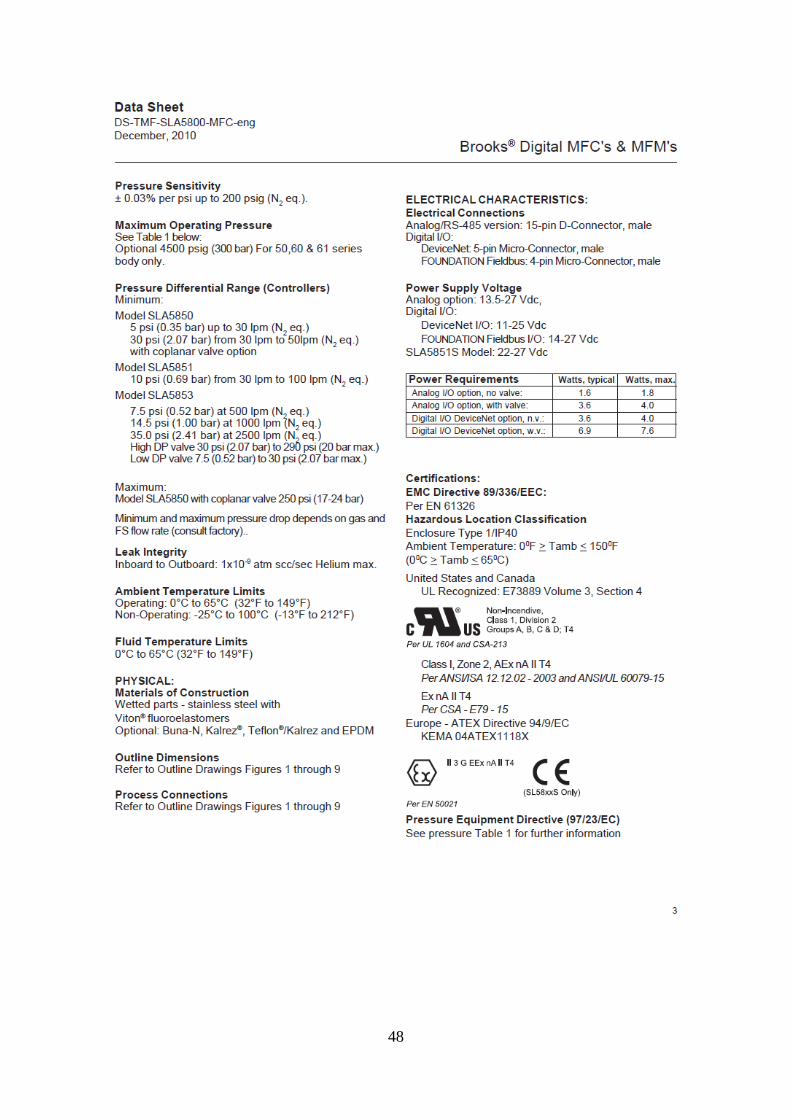
48

49

50
APPENDIX D
IGNITION SYSTEM
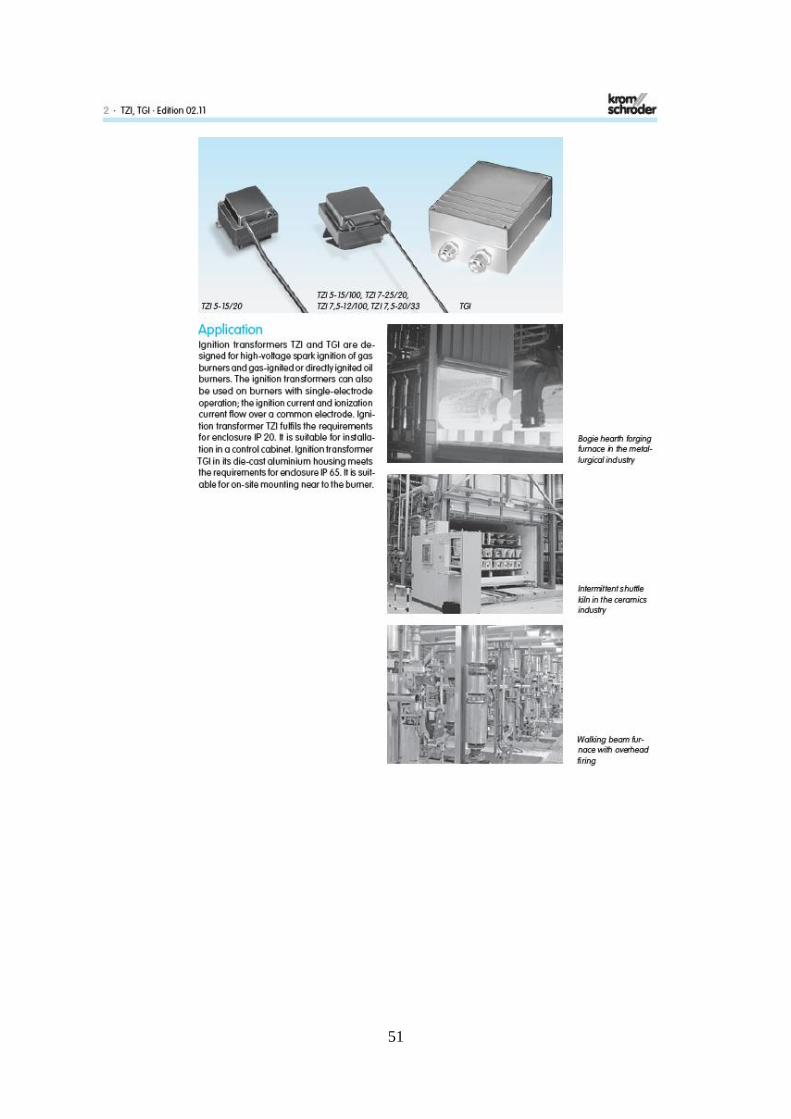
51

52
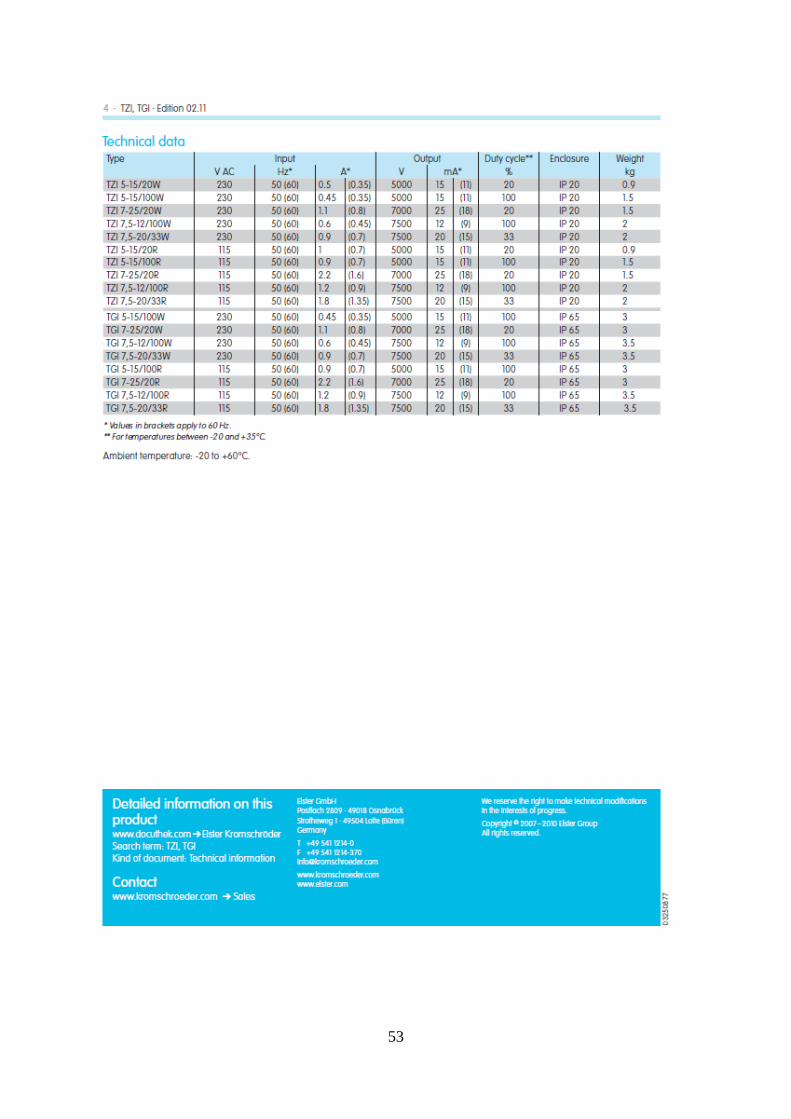
53

54
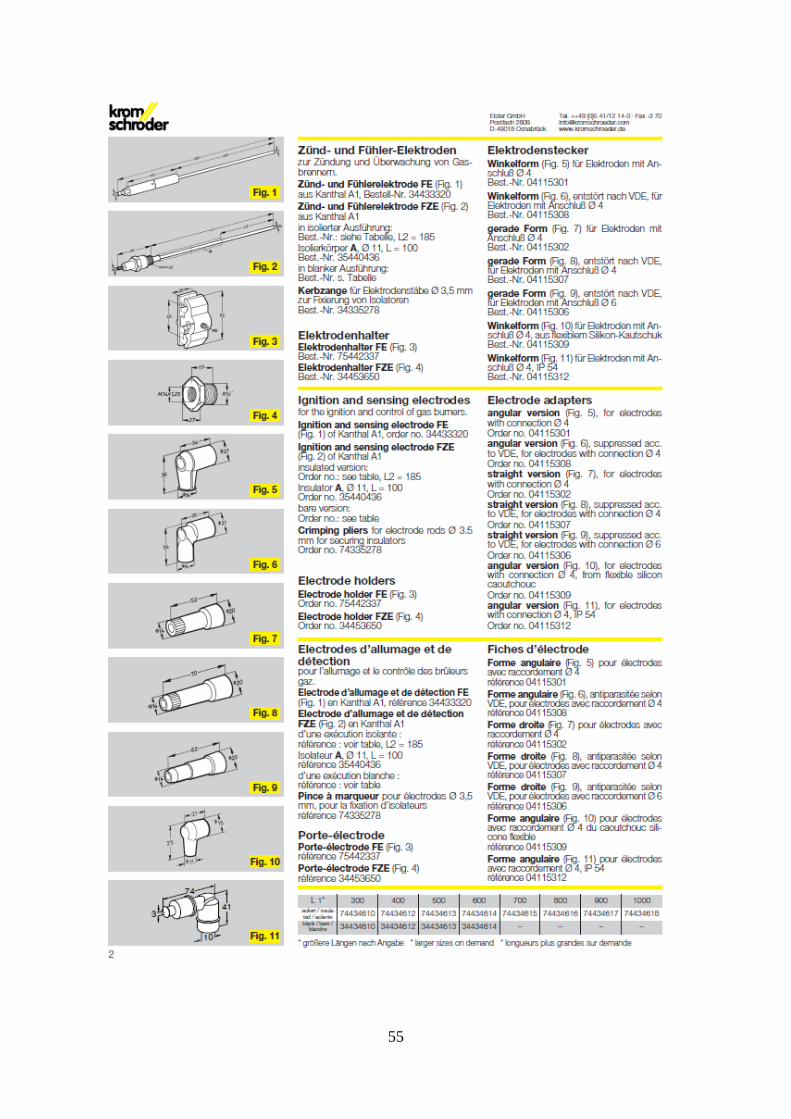
55