design and enforcement of environmental regulation in india and enforcement of environmental... ·...
TRANSCRIPT
Setting Audits Inspections
Design and Enforcement of EnvironmentalRegulation in India
Esther Duflo (MIT)
With Michael Greenstone (Chicago), Rohini Pande (Harvard)and Nicholas Ryan (Yale)
November 19th, 2015Stanford
Setting Audits Inspections
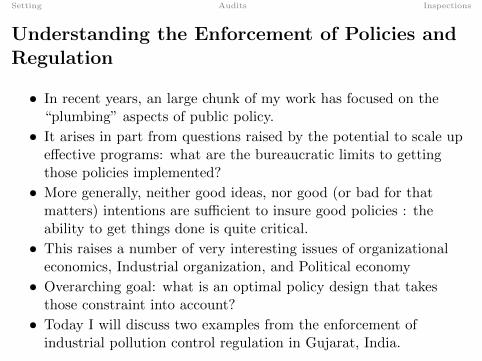
Understanding the Enforcement of Policies andRegulation
• In recent years, an large chunk of my work has focused on the“plumbing” aspects of public policy.
• It arises in part from questions raised by the potential to scale upeffective programs: what are the bureaucratic limits to gettingthose policies implemented?
• More generally, neither good ideas, nor good (or bad for thatmatters) intentions are sufficient to insure good policies : theability to get things done is quite critical.
• This raises a number of very interesting issues of organizationaleconomics, Industrial organization, and Political economy
• Overarching goal: what is an optimal policy design that takesthose constraint into account?
• Today I will discuss two examples from the enforcement ofindustrial pollution control regulation in Gujarat, India.
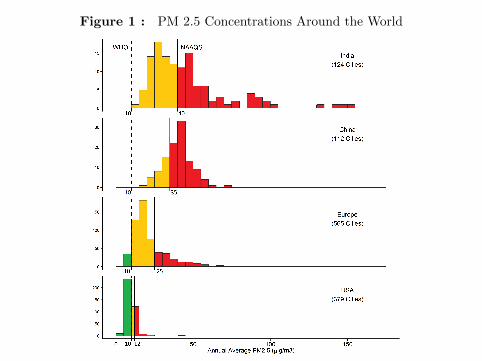
Figure 1 : PM 2.5 Concentrations Around the World
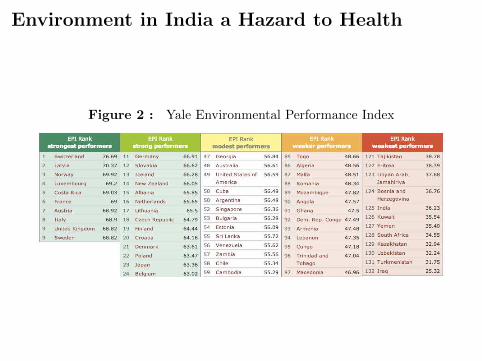
Environment in India a Hazard to Health
Figure 2 : Yale Environmental Performance Index
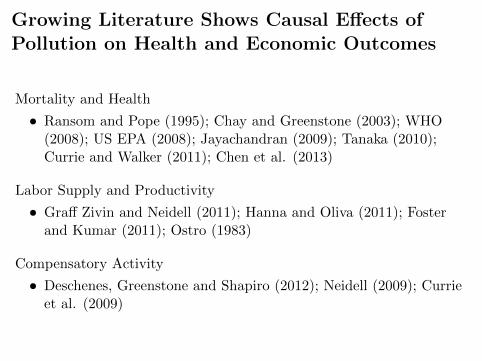
Growing Literature Shows Causal Effects ofPollution on Health and Economic Outcomes
Mortality and Health
• Ransom and Pope (1995); Chay and Greenstone (2003); WHO(2008); US EPA (2008); Jayachandran (2009); Tanaka (2010);Currie and Walker (2011); Chen et al. (2013)
Labor Supply and Productivity
• Graff Zivin and Neidell (2011); Hanna and Oliva (2011); Fosterand Kumar (2011); Ostro (1983)
Compensatory Activity
• Deschenes, Greenstone and Shapiro (2012); Neidell (2009); Currieet al. (2009)
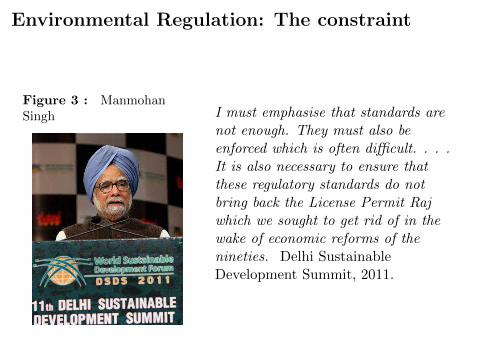
Environmental Regulation: The constraint
Figure 3 : ManmohanSingh I must emphasise that standards are
not enough. They must also beenforced which is often difficult. . . .It is also necessary to ensure thatthese regulatory standards do notbring back the License Permit Rajwhich we sought to get rid of in thewake of economic reforms of thenineties. Delhi SustainableDevelopment Summit, 2011.
Setting Audits Inspections
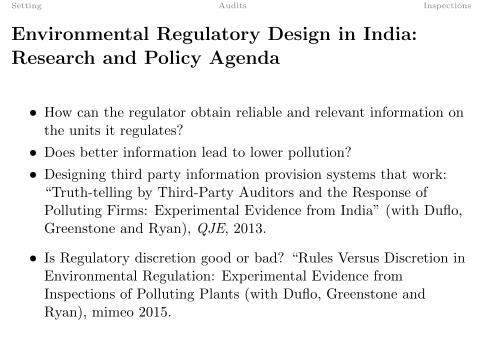
Environmental Regulatory Design in India:Research and Policy Agenda
• How can the regulator obtain reliable and relevant information onthe units it regulates?
• Does better information lead to lower pollution?
• Designing third party information provision systems that work:“Truth-telling by Third-Party Auditors and the Response ofPolluting Firms: Experimental Evidence from India” (with Duflo,Greenstone and Ryan), QJE, 2013.
• Is Regulatory discretion good or bad? “Rules Versus Discretion inEnvironmental Regulation: Experimental Evidence fromInspections of Polluting Plants (with Duflo, Greenstone andRyan), mimeo 2015.
Outline
1 Setting
2 Environmental Audits
3 Government Inspections
Setting Audits Inspections
States Enforce Environmental Regulation inIndia
Standards at the national level
• Command-and-control regulations set at the national level by theWater Act (1974), Air Act (1981) and Environment ProtectionAct (1986)
• Main standards maximum allowable concentrations for emissions,which states can tighten but not relax
• Severe, criminal sanctions for violations
Enforcement at the state level
• State Pollution Control Boards (SPCBs) created with Water Actand responsibility, but not staffing, increased with each later Act
• Experiments conducted with Gujarat Pollution Control Board;ongoing work also in partnership with national ministry
Industrialization and Pollution Both High inGujarat
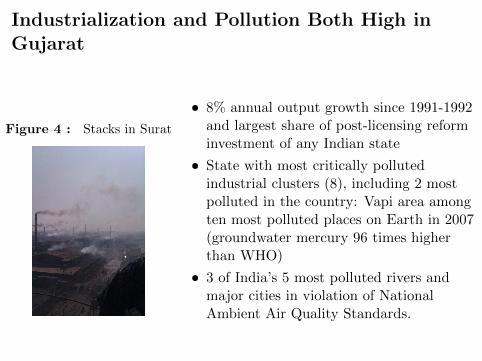
Figure 4 : Stacks in Surat
• 8% annual output growth since 1991-1992and largest share of post-licensing reforminvestment of any Indian state
• State with most critically pollutedindustrial clusters (8), including 2 mostpolluted in the country: Vapi area amongten most polluted places on Earth in 2007(groundwater mercury 96 times higherthan WHO)
• 3 of India’s 5 most polluted rivers andmajor cities in violation of NationalAmbient Air Quality Standards.
Setting Audits Inspections
Inspections And Audits as Regulatory Tools
• Key objective: Provide regulator information on plant compliancewith pollution standards
• Inspections: Staff engineers and scientists visit plant, observe andsample water and air emissions. Information summarised ininspection reports
• Audits: Third party auditors hired by firms provide regulatorannual audit reports
• Audits Can private-sector involvement substitute for low statecapacity? How should third-party audits be (re)designed to limitconflict of interest?
• Inspections Can a rule-based inspection assignment approachimprove pollution compliance? What are the social costs andbenefits of a rule-based system?

Outline
1 Setting
2 Environmental Audits
3 Government Inspections
Setting Audits Inspections
Third Party Auditing and Environmentalregulation
Private third-parties have a growing place in environmental regulation
• Potential advantages of capacity/expertise, flexibility and cost.
• Support environmental standards like ISO 14001 and carbonoffsets (Potoski and Prakash, 2005; Bhattacharyya, 2011).
But third-parties have mixed incentives
• Audited company hiring the auditor may create a conflict ofinterest for auditors needing to maintain their business.
• Many cases where audits have been unreliable. E.g. corporateaccounting scandals or credit ratings during the financial crisis.
Setting Audits Inspections
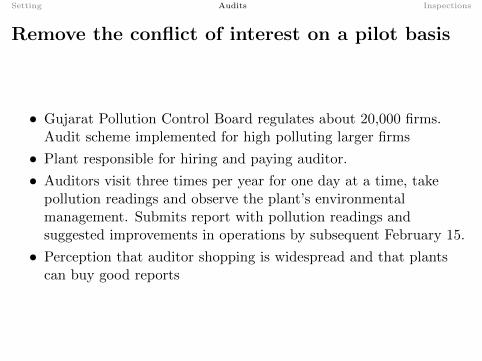
Remove the conflict of interest on a pilot basis
• Gujarat Pollution Control Board regulates about 20,000 firms.Audit scheme implemented for high polluting larger firms
• Plant responsible for hiring and paying auditor.
• Auditors visit three times per year for one day at a time, takepollution readings and observe the plant’s environmentalmanagement. Submits report with pollution readings andsuggested improvements in operations by subsequent February 15.
• Perception that auditor shopping is widespread and that plantscan buy good reports
Setting Audits Inspections
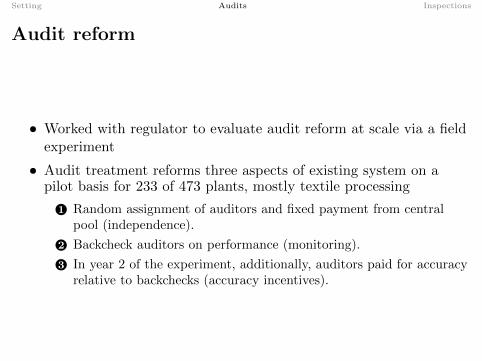
Audit reform
• Worked with regulator to evaluate audit reform at scale via a fieldexperiment
• Audit treatment reforms three aspects of existing system on apilot basis for 233 of 473 plants, mostly textile processing
1 Random assignment of auditors and fixed payment from centralpool (independence).
2 Backcheck auditors on performance (monitoring).
3 In year 2 of the experiment, additionally, auditors paid for accuracyrelative to backchecks (accuracy incentives).
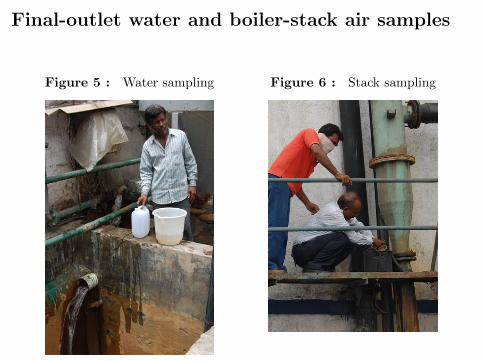
Final-outlet water and boiler-stack air samples
Figure 5 : Water sampling Figure 6 : Stack sampling
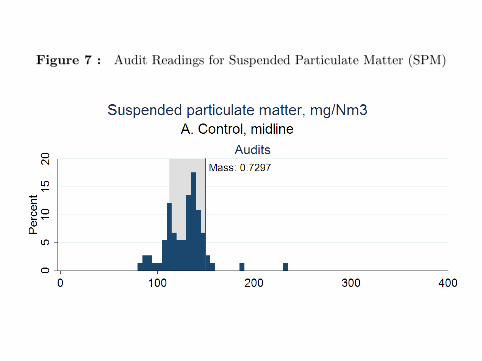
Figure 7 : Audit Readings for Suspended Particulate Matter (SPM)
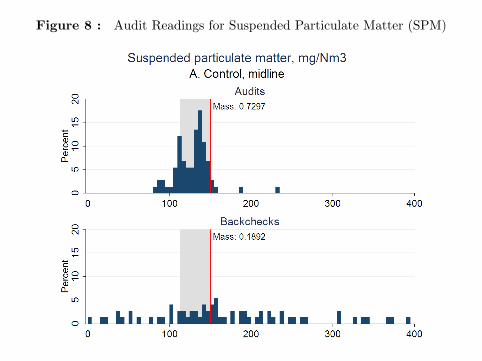
Figure 8 : Audit Readings for Suspended Particulate Matter (SPM)
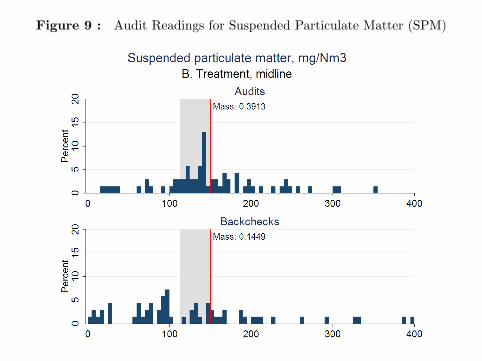
Figure 9 : Audit Readings for Suspended Particulate Matter (SPM)
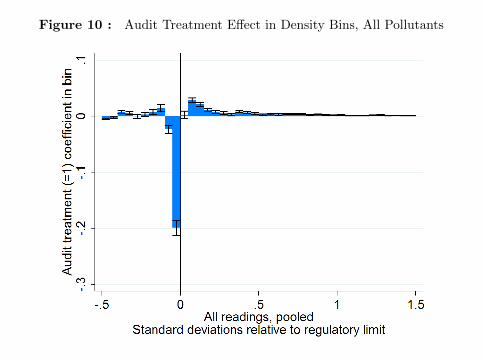
Figure 10 : Audit Treatment Effect in Density Bins, All Pollutants
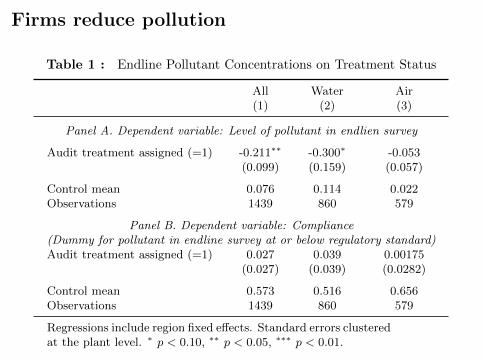
Firms reduce pollution
Table 1 : Endline Pollutant Concentrations on Treatment Status
All Water Air(1) (2) (3)
Panel A. Dependent variable: Level of pollutant in endlien survey
Audit treatment assigned (=1) -0.211∗∗ -0.300∗ -0.053(0.099) (0.159) (0.057)
Control mean 0.076 0.114 0.022Observations 1439 860 579
Panel B. Dependent variable: Compliance(Dummy for pollutant in endline survey at or below regulatory standard)Audit treatment assigned (=1) 0.027 0.039 0.00175
(0.027) (0.039) (0.0282)
Control mean 0.573 0.516 0.656Observations 1439 860 579
Regressions include region fixed effects. Standard errors clusteredat the plant level. ∗ p < 0.10, ∗∗ p < 0.05, ∗∗∗ p < 0.01.
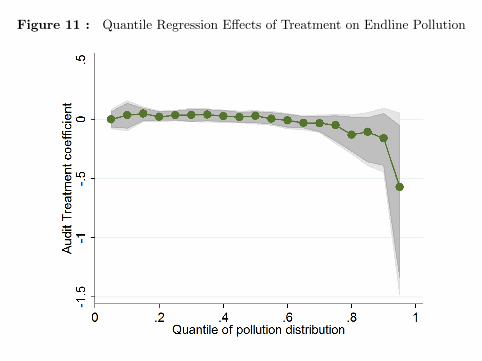
Figure 11 : Quantile Regression Effects of Treatment on Endline Pollution
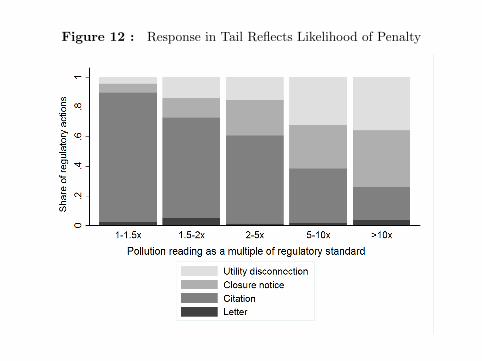
Figure 12 : Response in Tail Reflects Likelihood of Penalty
Outline
1 Setting
2 Environmental Audits
3 Government Inspections
Setting Audits Inspections
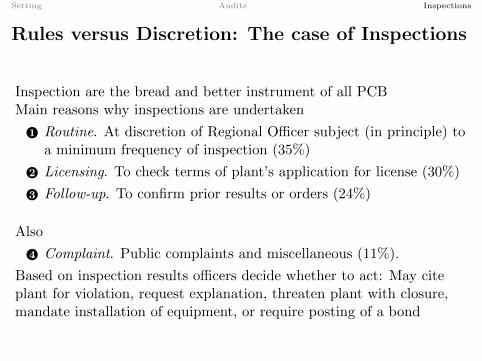
Rules versus Discretion: The case of Inspections
Inspection are the bread and better instrument of all PCBMain reasons why inspections are undertaken
1 Routine. At discretion of Regional Officer subject (in principle) toa minimum frequency of inspection (35%)
2 Licensing. To check terms of plant’s application for license (30%)
3 Follow-up. To confirm prior results or orders (24%)
Also
4 Complaint. Public complaints and miscellaneous (11%).
Based on inspection results officers decide whether to act: May citeplant for violation, request explanation, threaten plant with closure,mandate installation of equipment, or require posting of a bond
Setting Audits Inspections
Issues with inspections
• Not enough manpower for everything: plants are not inspected atthe prescribed rate
• Hence de facto large discretion, and perception of arbitrariness,and potentially bribes and rent seeking
• For labor inspections, Prime Minister Modi suggested removing alldiscretion and moving to a random schedule of inspection.
Setting Audits Inspections
Plants Not Inspected at Prescribed Rate
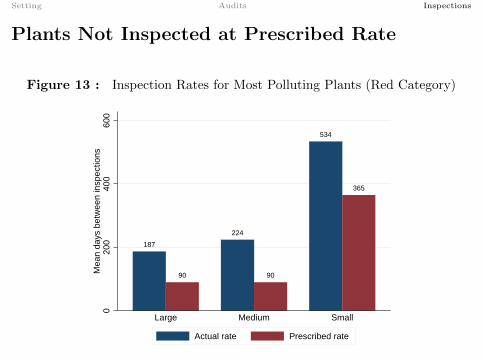
Figure 13 : Inspection Rates for Most Polluting Plants (Red Category)
187
90
224
90
534
365
020
040
060
0M
ean
days
bet
wee
n in
spec
tions
Large Medium Small
Actual rate Prescribed rate
• Distribution right-skewed; many plants not inspected at all
Setting Audits Inspections
This project
• For a random subset of firms we implement both suggestions:increasing the rate of inspection to inspect at prescribed rate, andentirely remove the initial discretion in the assignment of thoseinspections.
• We then provide reduced form evidence on the impact this had
• And tease out what this evidence has to tell us on the value (orcosts) of discretion, with much more data and some morestructure....
Setting Audits Inspections
Sample of Smaller, More Polluting Plants
GPCB regulates more than 20,000 plantsSample for this study
• Sample of 961 plants drawn in two tiers based on audit eligibility(applies to plants with still higher pollution potential):
1 All 473 plants eligible for environmental audit in the regions ofAhmedabad and Surat (cross-cut experimental arm).
2 Random 488 non-audit-eligible plants from the population
• Random half of plants assigned to be inspected more often,stratified on audit treatment
• Ran from about 2009 Q3 - 2011 Q1 inclusive.
Setting Audits Inspections
Logistics and Data
• Hard to hire but need additional inspections. GPCB foundrecently retired but interested staff in each region who were hired.
• Managed by GPCB officers and report in their typical inspectionsystem. Emphasized by management and confirmed in data thatthey would be treated equally: the initial inspection report isentered into the regular system and acted upon as any other.
• Two sources of data• Administrative data gives complete records of interactions between
regulator and plants before, during and after experiment, includingpollution readings and action taken at each stage.
• Endline survey conducted April through July of 2011, soon afterinspection treatment ends.
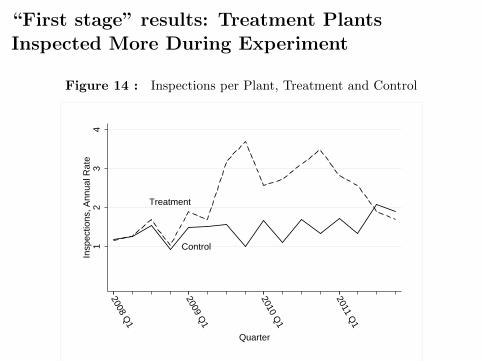
“First stage” results: Treatment PlantsInspected More During Experiment
Figure 14 : Inspections per Plant, Treatment and Control
Treatment
Control12
34
Insp
ectio
ns, A
nnua
l Rat
e
2008 Q1
2009 Q1
2010 Q1
2011 Q1
Quarter
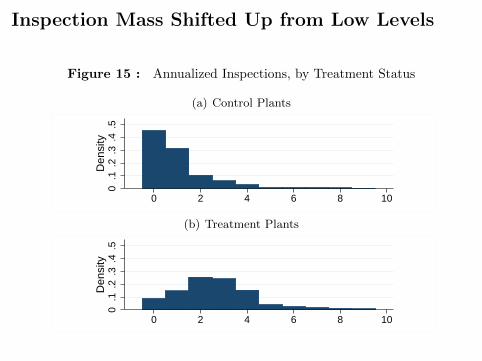
Inspection Mass Shifted Up from Low Levels
Figure 15 : Annualized Inspections, by Treatment Status
(a) Control Plants0
.1.2
.3.4
.5D
ensi
ty
0 2 4 6 8 10
(b) Treatment Plants
0.1
.2.3
.4.5
Den
sity
0 2 4 6 8 10
Setting Audits Inspections
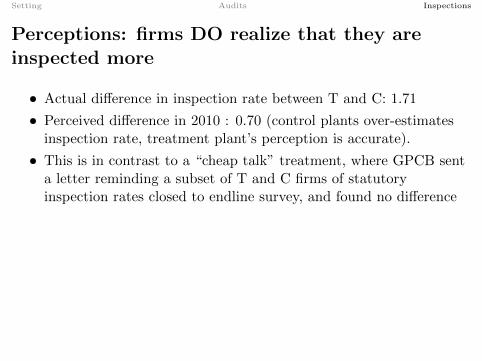
Perceptions: firms DO realize that they areinspected more
• Actual difference in inspection rate between T and C: 1.71
• Perceived difference in 2010 : 0.70 (control plants over-estimatesinspection rate, treatment plant’s perception is accurate).
• This is in contrast to a “cheap talk” treatment, where GPCB senta letter reminding a subset of T and C firms of statutoryinspection rates closed to endline survey, and found no difference
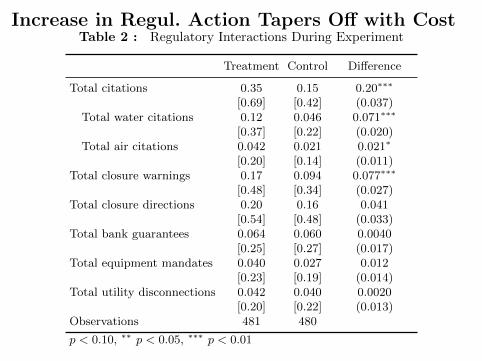
Increase in Regul. Action Tapers Off with CostTable 2 : Regulatory Interactions During Experiment
Treatment Control Difference
Total citations 0.35 0.15 0.20∗∗∗
[0.69] [0.42] (0.037)Total water citations 0.12 0.046 0.071∗∗∗
[0.37] [0.22] (0.020)Total air citations 0.042 0.021 0.021∗
[0.20] [0.14] (0.011)Total closure warnings 0.17 0.094 0.077∗∗∗
[0.48] [0.34] (0.027)Total closure directions 0.20 0.16 0.041
[0.54] [0.48] (0.033)Total bank guarantees 0.064 0.060 0.0040
[0.25] [0.27] (0.017)Total equipment mandates 0.040 0.027 0.012
[0.23] [0.19] (0.014)Total utility disconnections 0.042 0.040 0.0020
[0.20] [0.22] (0.013)Observations 481 480
p < 0.10, ∗∗ p < 0.05, ∗∗∗ p < 0.01
Setting Audits Inspections
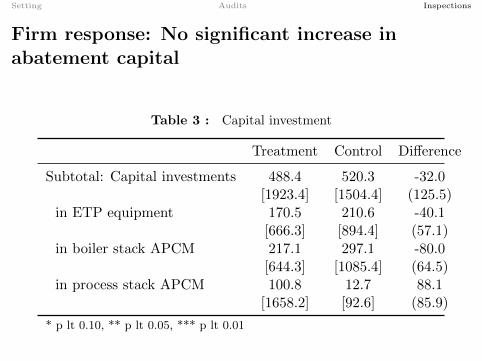
Firm response: No significant increase inabatement capital
Table 3 : Capital investment
Treatment Control Difference
Subtotal: Capital investments 488.4 520.3 -32.0[1923.4] [1504.4] (125.5)
in ETP equipment 170.5 210.6 -40.1[666.3] [894.4] (57.1)
in boiler stack APCM 217.1 297.1 -80.0[644.3] [1085.4] (64.5)
in process stack APCM 100.8 12.7 88.1[1658.2] [92.6] (85.9)
* p lt 0.10, ** p lt 0.05, *** p lt 0.01
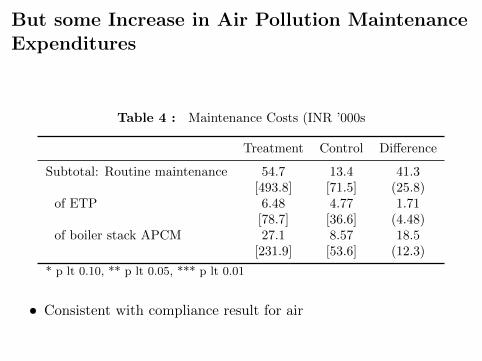
But some Increase in Air Pollution MaintenanceExpenditures
Table 4 : Maintenance Costs (INR ’000s
Treatment Control Difference
Subtotal: Routine maintenance 54.7 13.4 41.3[493.8] [71.5] (25.8)
of ETP 6.48 4.77 1.71[78.7] [36.6] (4.48)
of boiler stack APCM 27.1 8.57 18.5[231.9] [53.6] (12.3)
* p lt 0.10, ** p lt 0.05, *** p lt 0.01
• Consistent with compliance result for air
Setting Audits Inspections
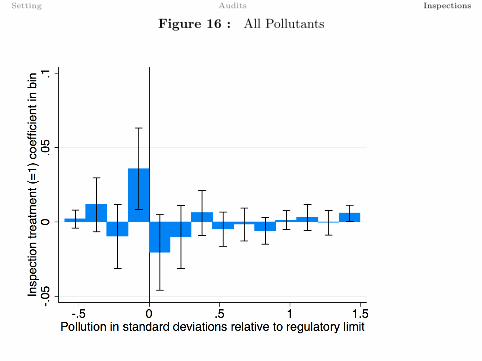
Figure 16 : All Pollutants
Setting Audits Inspections
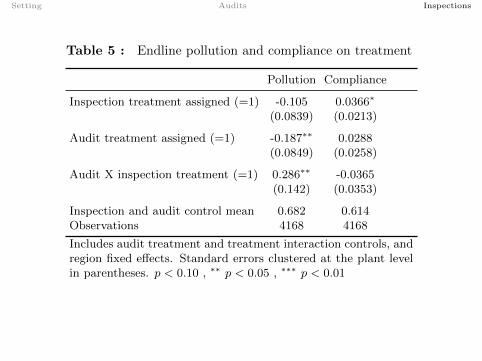
Table 5 : Endline pollution and compliance on treatment
Pollution Compliance
Inspection treatment assigned (=1) -0.105 0.0366∗
(0.0839) (0.0213)
Audit treatment assigned (=1) -0.187∗∗ 0.0288(0.0849) (0.0258)
Audit X inspection treatment (=1) 0.286∗∗ -0.0365(0.142) (0.0353)
Inspection and audit control mean 0.682 0.614Observations 4168 4168
Includes audit treatment and treatment interaction controls, andregion fixed effects. Standard errors clustered at the plant levelin parentheses. p < 0.10 , ∗∗ p < 0.05 , ∗∗∗ p < 0.01
Setting Audits Inspections
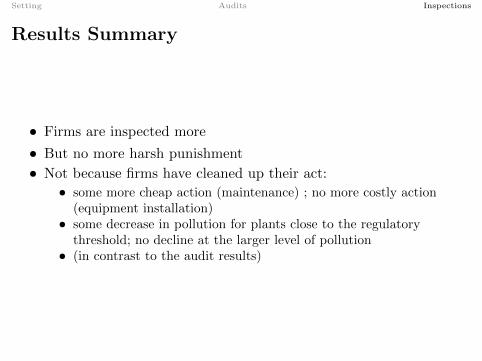
Results Summary
• Firms are inspected more
• But no more harsh punishment
• Not because firms have cleaned up their act:• some more cheap action (maintenance) ; no more costly action
(equipment installation)• some decrease in pollution for plants close to the regulatory
threshold; no decline at the larger level of pollution• (in contrast to the audit results)

Setting Audits Inspections
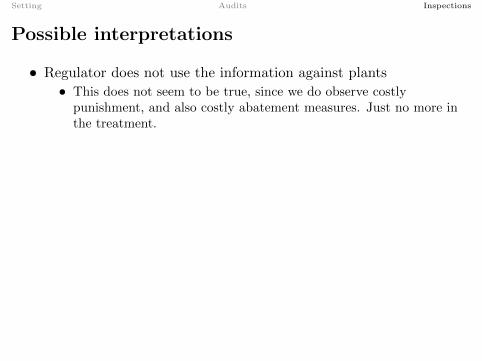
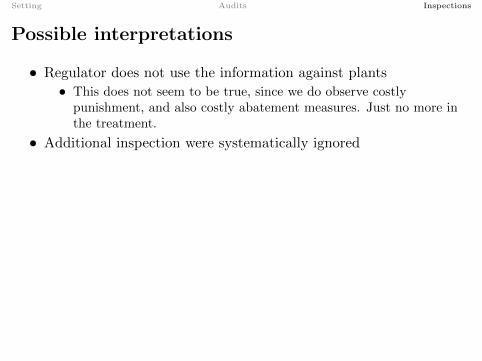
Possible interpretations
• Regulator does not use the information against plants
• This does not seem to be true, since we do observe costlypunishment, and also costly abatement measures. Just no more inthe treatment.
• Additional inspection were systematically ignored• This does not seem to be true, as the additional inspections were
entered into the system
• The information collected in the additional inspections wasdifferent than that of the average inspection.
• This is the hypothesis we will explore now
Setting Audits Inspections
Possible interpretations
• Regulator does not use the information against plants• This does not seem to be true, since we do observe costly
punishment, and also costly abatement measures. Just no more inthe treatment.
• Additional inspection were systematically ignored
• This does not seem to be true, as the additional inspections wereentered into the system
• The information collected in the additional inspections wasdifferent than that of the average inspection.
• This is the hypothesis we will explore now
Setting Audits Inspections
Possible interpretations
• Regulator does not use the information against plants• This does not seem to be true, since we do observe costly
punishment, and also costly abatement measures. Just no more inthe treatment.
• Additional inspection were systematically ignored• This does not seem to be true, as the additional inspections were
entered into the system
• The information collected in the additional inspections wasdifferent than that of the average inspection.
• This is the hypothesis we will explore now
Setting Audits Inspections
Possible interpretations
• Regulator does not use the information against plants• This does not seem to be true, since we do observe costly
punishment, and also costly abatement measures. Just no more inthe treatment.
• Additional inspection were systematically ignored• This does not seem to be true, as the additional inspections were
entered into the system
• The information collected in the additional inspections wasdifferent than that of the average inspection.
• This is the hypothesis we will explore now
Setting Audits Inspections
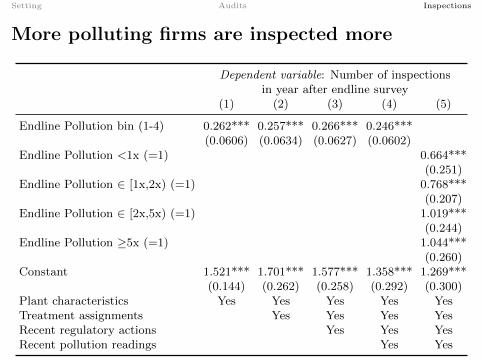
More polluting firms are inspected more
Dependent variable: Number of inspectionsin year after endline survey
(1) (2) (3) (4) (5)
Endline Pollution bin (1-4) 0.262*** 0.257*** 0.266*** 0.246***(0.0606) (0.0634) (0.0627) (0.0602)
Endline Pollution <1x (=1) 0.664***(0.251)
Endline Pollution ∈ [1x,2x) (=1) 0.768***(0.207)
Endline Pollution ∈ [2x,5x) (=1) 1.019***(0.244)
Endline Pollution ≥5x (=1) 1.044***(0.260)
Constant 1.521*** 1.701*** 1.577*** 1.358*** 1.269***(0.144) (0.262) (0.258) (0.292) (0.300)
Plant characteristics Yes Yes Yes Yes YesTreatment assignments Yes Yes Yes YesRecent regulatory actions Yes Yes YesRecent pollution readings Yes Yes
Setting Audits Inspections
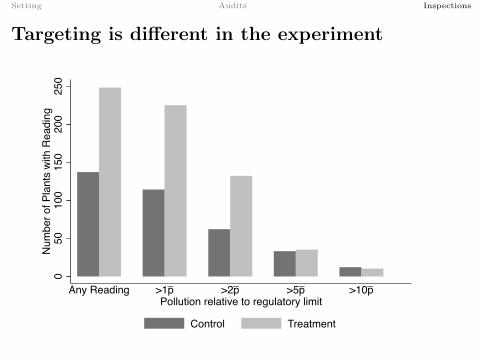
Targeting is different in the experiment
_ _ _ _050
100
150
200
250
Num
ber o
f Pla
nts
with
Rea
ding
Any Reading >1p >2p >5p >10pPollution relative to regulatory limit
Control Treatment
Setting Audits Inspections
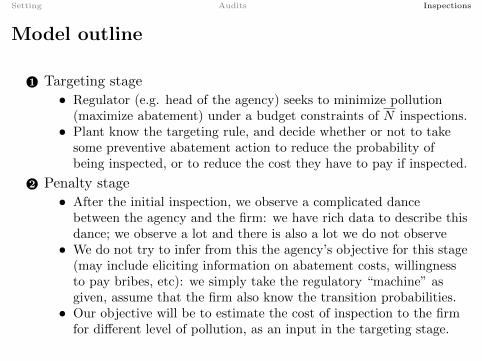
Model outline
1 Targeting stage• Regulator (e.g. head of the agency) seeks to minimize pollution
(maximize abatement) under a budget constraints of N inspections.• Plant know the targeting rule, and decide whether or not to take
some preventive abatement action to reduce the probability ofbeing inspected, or to reduce the cost they have to pay if inspected.
2 Penalty stage• After the initial inspection, we observe a complicated dance
between the agency and the firm: we have rich data to describe thisdance; we observe a lot and there is also a lot we do not observe
• We do not try to infer from this the agency’s objective for this stage(may include eliciting information on abatement costs, willingnessto pay bribes, etc): we simply take the regulatory “machine” asgiven, assume that the firm also know the transition probabilities.
• Our objective will be to estimate the cost of inspection to the firmfor different level of pollution, as an input in the targeting stage.
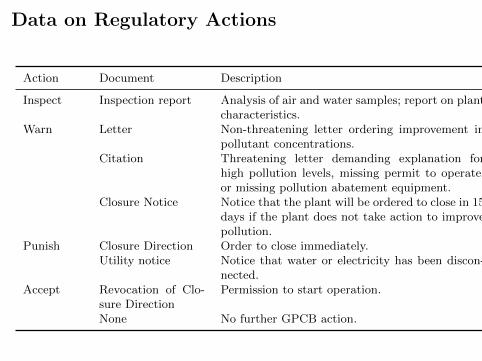
Data on Regulatory Actions
Action Document Description
Inspect Inspection report Analysis of air and water samples; report on plantcharacteristics.
Warn Letter Non-threatening letter ordering improvement inpollutant concentrations.
Citation Threatening letter demanding explanation forhigh pollution levels, missing permit to operate,or missing pollution abatement equipment.
Closure Notice Notice that the plant will be ordered to close in 15days if the plant does not take action to improvepollution.
Punish Closure Direction Order to close immediately.Utility notice Notice that water or electricity has been discon-
nected.Accept Revocation of Clo-
sure DirectionPermission to start operation.
None No further GPCB action.
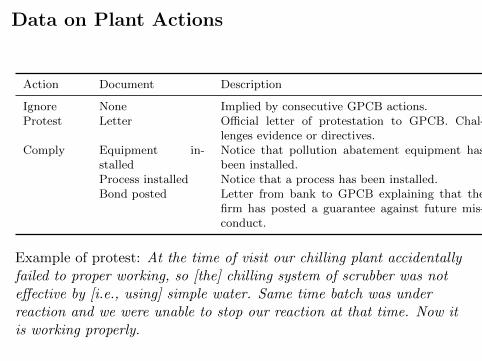
Data on Plant Actions
Action Document Description
Ignore None Implied by consecutive GPCB actions.Protest Letter Official letter of protestation to GPCB. Chal-
lenges evidence or directives.Comply Equipment in-
stalledNotice that pollution abatement equipment hasbeen installed.
Process installed Notice that a process has been installed.Bond posted Letter from bank to GPCB explaining that the
firm has posted a guarantee against future mis-conduct.
Example of protest: At the time of visit our chilling plant accidentallyfailed to proper working, so [the] chilling system of scrubber was noteffective by [i.e., using] simple water. Same time batch was underreaction and we were unable to stop our reaction at that time. Now itis working properly.
Penalty stage: the chain of actions
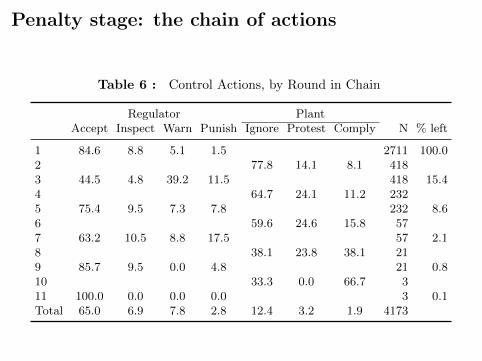
Table 6 : Control Actions, by Round in Chain
Regulator PlantAccept Inspect Warn Punish Ignore Protest Comply N % left
1 84.6 8.8 5.1 1.5 2711 100.02 77.8 14.1 8.1 4183 44.5 4.8 39.2 11.5 418 15.44 64.7 24.1 11.2 2325 75.4 9.5 7.3 7.8 232 8.66 59.6 24.6 15.8 577 63.2 10.5 8.8 17.5 57 2.18 38.1 23.8 38.1 219 85.7 9.5 0.0 4.8 21 0.810 33.3 0.0 66.7 311 100.0 0.0 0.0 0.0 3 0.1Total 65.0 6.9 7.8 2.8 12.4 3.2 1.9 4173
Unpacking the penalty stage
• We estimate a discrete dynamic game of regulation between theregulator and polluting plants using nearly 10,000 regulatoryinteractions
• Action structure: the inspectors observes a noisy signal on plantpollution and chooses whether to re-inspect plant, warn, punish oraccept plant as compliant.
• The plant can, in turn, comply by installing abatementequipment, protest a violation or ignore the regulator.
• We estimate when the regulator penalises the plant, when thegame finishes, and when it moves one stage
• Recover the cost of regulation (which comprise cost of penaltiessuch as plant closure, bribes, and cost of installing equipment) byplants revealed preference of when to comply (equipmentinstallation) and when to risk regulatory penalties, assuming theplant know the regulator’s policy functions (and takes them asgiven)
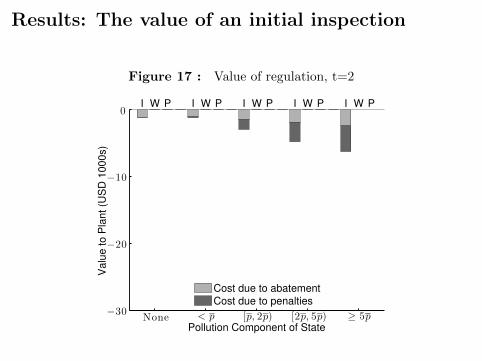
Results: The value of an initial inspection
Figure 17 : Value of regulation, t=2
Pollution Component of State
Valu
e to P
lant (U
SD
1000s)
I W P I W P I W P I W P I W P
None < p [p, 2p) [2p, 5p) ≥ 5p−30
−20
−10
0
Cost due to abatement
Cost due to penalties

Regulations become more costly if the gamelasts for several rounds
Figure 18 : Value of regulation, t=6
Pollution Component of State
Valu
e to P
lant (U
SD
1000s)
I W P I W P I W P I W P I W P
None < p [p, 2p) [2p, 5p) ≥ 5p−30
−20
−10
0
Cost due to abatement
Cost due to penalties
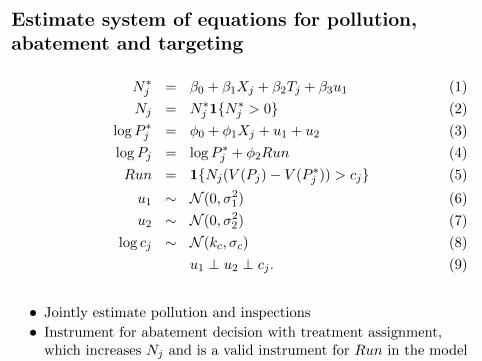
Estimate system of equations for pollution,abatement and targeting
N∗j = β0 + β1Xj + β2Tj + β3u1 (1)
Nj = N∗j 1{N∗
j > 0} (2)
logP ∗j = φ0 + φ1Xj + u1 + u2 (3)
logPj = logP ∗j + φ2Run (4)
Run = 1{Nj(V (Pj)− V (P ∗j )) > cj} (5)
u1 ∼ N (0, σ21) (6)
u2 ∼ N (0, σ22) (7)
log cj ∼ N (kc, σc) (8)
u1 ⊥ u2 ⊥ cj . (9)
• Jointly estimate pollution and inspections
• Instrument for abatement decision with treatment assignment,which increases Nj and is a valid instrument for Run in the model
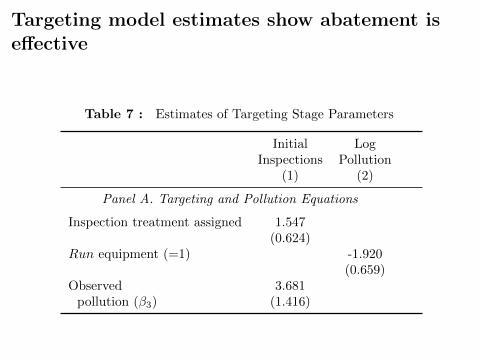
Targeting model estimates show abatement iseffective
Table 7 : Estimates of Targeting Stage Parameters
Initial LogInspections Pollution
(1) (2)
Panel A. Targeting and Pollution Equations
Inspection treatment assigned 1.547(0.624)
Run equipment (=1) -1.920(0.659)
Observed 3.681pollution (β3) (1.416)
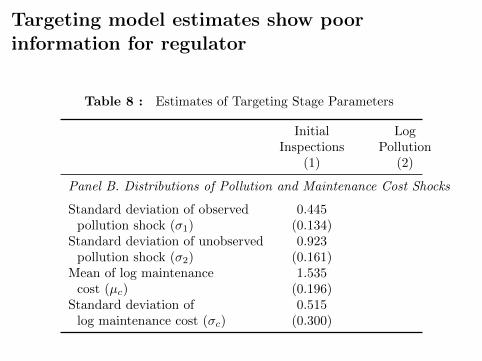
Targeting model estimates show poorinformation for regulator
Table 8 : Estimates of Targeting Stage Parameters
Initial LogInspections Pollution
(1) (2)
Panel B. Distributions of Pollution and Maintenance Cost Shocks
Standard deviation of observed 0.445pollution shock (σ1) (0.134)
Standard deviation of unobserved 0.923pollution shock (σ2) (0.161)
Mean of log maintenance 1.535cost (µc) (0.196)
Standard deviation of 0.515log maintenance cost (σc) (0.300)
Setting Audits Inspections
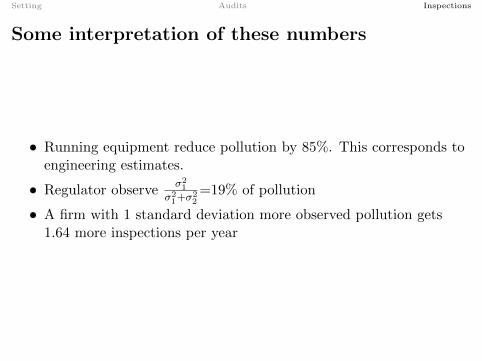
Some interpretation of these numbers
• Running equipment reduce pollution by 85%. This corresponds toengineering estimates.
• Regulator observeσ21
σ21+σ
22=19% of pollution
• A firm with 1 standard deviation more observed pollution gets1.64 more inspections per year
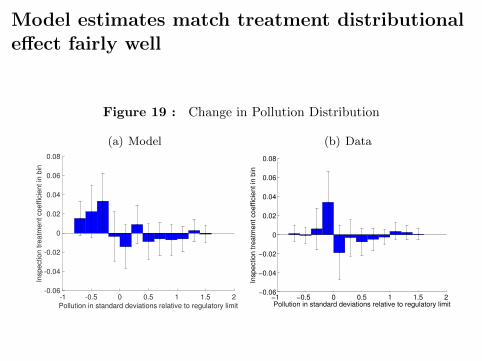
Model estimates match treatment distributionaleffect fairly well
Figure 19 : Change in Pollution Distribution
(a) Model
-1 -0.5 0 0.5 1 1.5 2
Pollution in standard deviations relative to regulatory limit
-0.06
-0.04
-0.02
0
0.02
0.04
0.06
0.08
Inspection tre
atm
ent coeffic
ient in
bin
(b) Data
−1 −0.5 0 0.5 1 1.5 2−0.06
−0.04
−0.02
0
0.02
0.04
0.06
0.08
Pollution in standard deviations relative to regulatory limit
Inspection tre
atm
ent coeffic
ient in
bin
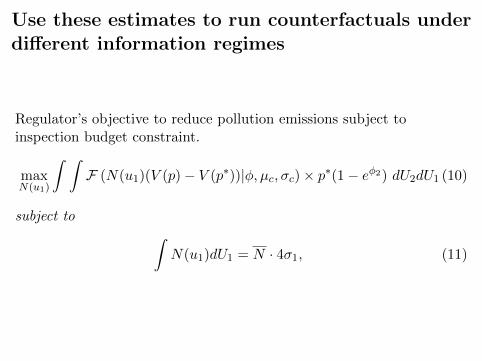
Use these estimates to run counterfactuals underdifferent information regimes
Regulator’s objective to reduce pollution emissions subject toinspection budget constraint.
maxN(u1)
∫ ∫F (N(u1)(V (p)− V (p∗))|φ, µc, σc)× p∗(1− eφ2) dU2dU1 (10)
subject to ∫N(u1)dU1 = N · 4σ1, (11)
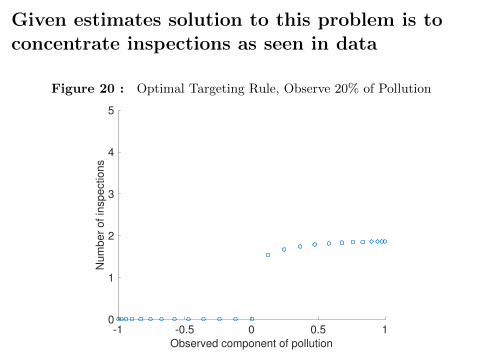
Given estimates solution to this problem is toconcentrate inspections as seen in data
Figure 20 : Optimal Targeting Rule, Observe 20% of Pollution
-1 -0.5 0 0.5 1
Observed component of pollution
0
1
2
3
4
5N
um
be
r o
f in
sp
ectio
ns
Intuition: target marginal plants
1 V (p) increasing in pollution, so easier to get high-polluting plantsto comply.
2 Uncertain about true level of pollution, so again wish to targetplants that appear dirtier, since they are more likely to be dirty infact.
3 However, these plants will comply in any case for many levels ofcost. This force offsets the above.
4 To understand the trade-offs in targeting we vary the informationavailable to the regulator
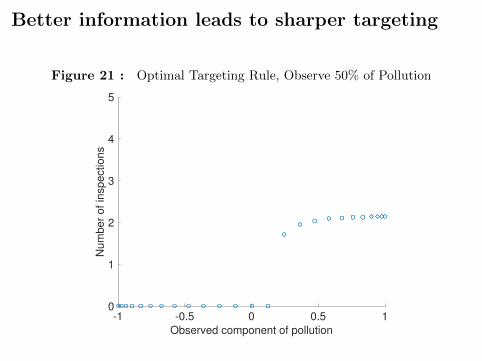
Better information leads to sharper targeting
Figure 21 : Optimal Targeting Rule, Observe 50% of Pollution
-1 -0.5 0 0.5 1
Observed component of pollution
0
1
2
3
4
5N
um
be
r o
f in
sp
ectio
ns
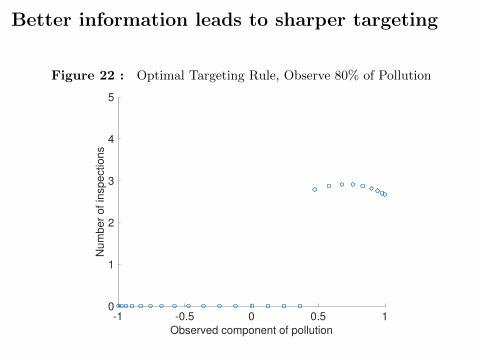
Better information leads to sharper targeting
Figure 22 : Optimal Targeting Rule, Observe 80% of Pollution
-1 -0.5 0 0.5 1
Observed component of pollution
0
1
2
3
4
5N
um
be
r o
f in
sp
ectio
ns
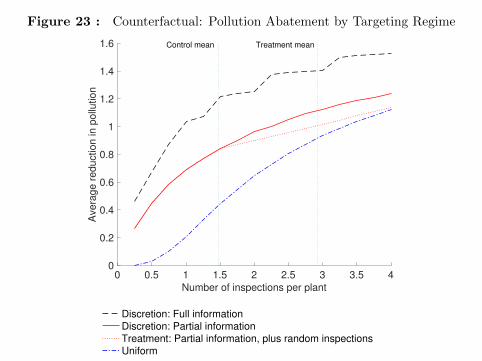
Figure 23 : Counterfactual: Pollution Abatement by Targeting Regime
0 0.5 1 1.5 2 2.5 3 3.5 4
Number of inspections per plant
0
0.2
0.4
0.6
0.8
1
1.2
1.4
1.6
Avera
ge r
eduction in p
ollu
tion
Control mean Treatment mean
Discretion: Full information
Discretion: Partial information
Treatment: Partial information, plus random inspections
Uniform
Value of discretion
• The treatment is estimated to increase compliance by 3.04percentage points in the model, as compared to our experimentalestimate of 3.66 percentage points (standard error 2.1 pp)
• The additional treatment inspections would have gone farther ifassigned to plants using the regulator’s partial information,yielding an increase in abatement of 0.28 standards and anincrease in compliance of 5.5 percentage points, greater than wasobserved.
• At the control rate of inspections, full information achievespollution about as low as would tripling the rate of inspection,under the current, partial information regime.
Setting Audits Inspections
Conclusions
• Resolving conflict of interest in audit system improved informationflows and induced heavy polluters to cut pollution
• Introducing rule-based inspector assignment in a system withcostly penalties increases social cost with limited gains in terms ofpollution compliance
• Root problem of poor informational environment, even if theregulator was entirely public-minded.
• Appears to be larger issue than manipulation (“inspector-raj”):little justification for purely random audits, which have much lessdeterrence effect than the current (poorly) targeted audit.
• Value of generating information• Greestone-Ryan-Pande: : Continuous Emissions Monitoring
Systems (CEMS) for better pollution monitoring• Banerjee-Duflo-Imbert-Pande: electronic trail for all invoices reduce
leakage in public program by 22%.