design and implementation of an architectural framework for
TRANSCRIPT


Sensors 2009, 9
5210
handles this key requirement efficiently by introducing multiple master nodes in each local region. These master nodes, which are operating in the low-speed network, are capable of managing the packets to/from low-speed and high speed networks. 4.2. Client’s Interaction over the Web Portal with and without Proposed Framework
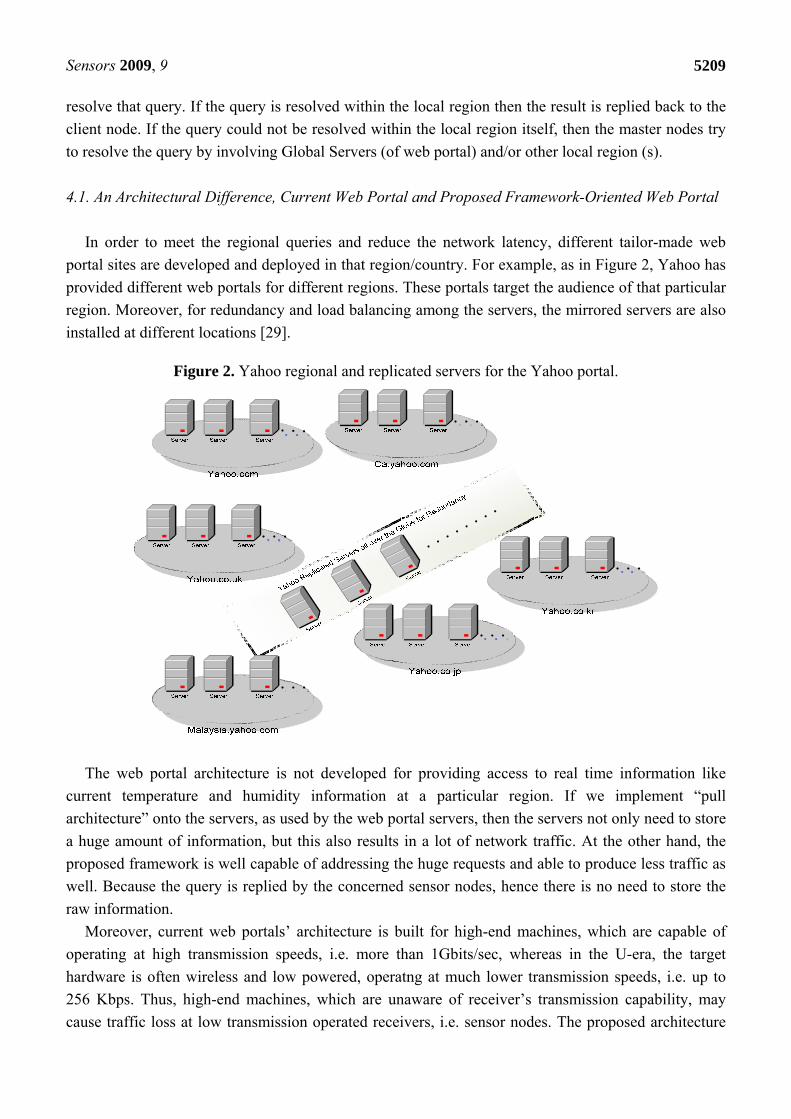
In this section, we diagrammatically describe the different ways of client interaction over the web portal. We have shown that the client may access the web portal through sensor networks (i.e. using IEEE802.15.4 technology), through Wi-Fi networks (i.e. IEEE802.11 technology), and through our proposed framework.
Figures 3-6 elaborate the possible ways of a client’s interaction over a web portal with and without proposed framework. In the case of current web portal architecture only, there are two possible ways of interaction of clients with the web portal. As shown in Figure 3, A) Client’s Interaction through sensor networks in general: The client that wants to make a query request, first listens to the network. If the network is busy, the transmission is held off until later.
Figure 3. Client interaction over a web portal through sensor networks in general.
Sensor
1. Req
uest
Sensor
Sensor
Sensor 2. Request-Relay
8. Reply
Gateway
5. Pull-Information
3. Request4. Request
6. Reply
7. Reply
9. R
eply
-Rel
ay
Client
- IEEE 802.15.4 standard suggests CSMA/CA as link layer protocol
On the other hand, if the medium remains free for a certain period of time (called DIFS for
Distributed Inter-frame Space), then the client can transmit the signals (make the request) to its nearest sensor node. In other words, we can say that both client and sensor nodes use CSMA/CA as link layer protocol [30], as defined by the IEEE 802.15.4 standard [30]. Client’s request is handled by the sensor node that will forward the request to the gateway (which then connects the internal network to the Internet). Once the gateway receives the request, then it connects with the web portal’s server in order to get the response.
In Figure 4, B) Client may access the portal through Wi-Fi: In case of Wi-Fi [31], once the client finds the medium as free, then it transmits a Ready to Send (RTS) packet containing information on the amount of data (i.e. request) that it wishes to send, and its transmission speed. The receiver (generally an Access Point (AP)) responds with a Clear to Send (CTS) packet; and then the client makes query request. When query request data sent by the client (i.e. client finishes its query request)

Sensors 2009, 9
5211
has been received, the receiver sends an acknowledgement notice (ACK) to the client. In other words, we can say that Wi-Fi uses CSMA/CA as underlying link layer protocol – supplemented by the exchange of RTS and CTS packets among the client and AP. At the other hand, when AP receives the request, it contacts the web portal’s server through the Internet in order to get the response, and then replies the client.
Figure 4. Client interaction over a web portal through Wi-Fi.
Gateway
8. Pull-Information
5. Request11. Reply
6. Request
7. Request
Access Point
1. R
TS
2. C
TS
3. R
eque
st
4. A
CK
9. Reply
10. Reply
12. R
eply
Client
As discussed earlier, in U-environment the most of the information would be real time information,
thus the portal servers need to implement pull architecture in order to get the information from the external entity. This communication introduces a huge traffic over the Internet. Moreover, the implementation of Wi-Fi in the U-era may provide the wireless access to the Internet, i.e. the concept of providing access to the web portal at anywhere and anytime. But, Wi-Fi cannot address the limitations of web portal in the U-era, as discussed in Section 3.1. At the other hand, in wireless sensor networks, the sensor nodes are not only capable of wireless communication but also cooperatively monitor physical or environmental conditions, such as temperature, sound, vibration, pressure, motion or pollutants, at different locations etc. Whereas enabling IPv6 over the sensor nodes make them accessible anywhere and anytime. Thus, these sensor nodes have not only the capability of network communication but also observe the real time information, which make them suitable technology over Wi-Fi for the flow of real time information.
Figures 5 and 6 best describe a client’s interaction scenario in our framework-oriented web portal architecture. A client makes a request to its immediate master node, which keeps the entry in its table. That master node discovers the service from the discovery server and directly contacts the target master node (that may be within the same local region, as shown in Figure 5, or within some different local region, as shown in Figure 6) that can resolve the query. On the reply from the query, the requested master node replies to the client. Note that due to the heterogeneous nature of the sensor network, the communication between the sensor nodes is over SML. Moreover, as described above in “Client’s Interaction through sensor networks in general”, the client, master nodes and the senor nodes use CSMA/CA as link layer protocol [30], as defined by the IEEE 802.15.4 standard [30], in our approach.

Sensors 2009, 9
5212
Figure 5. Client interaction over the proposed framework (within local region).
Local Region
Master node
1. Request-
HTML+SML
??1
RepSerReq
??1
RepSerReq
2. U
-Ser
vice
Disc
over
y
Master node
Master node
Master node
3. Request-SML
5. Reply-SML
Sensor
Sensor
Sensor
Sensor
7. Reply-
HTML+SML
Master node
4. Request (Relay)-SML
6. Reply-SML
- IEEE 802.15.4 standard suggests CSMA/CA as link layer protocol
Client
Figure 6. Client interaction over the proposed framework (outside local region).
Local Region
Master node
1. Request-
HTML+SML
??1
RepSerReq
??1
RepSerReq
2. U
-Ser
vice
Disc
over
y
3. Request-SML
10. Reply-SML
11. Reply-
HTML+SML
Gateway4. Request
Gateway6. Request
Master node
Sensor
Sensor
Sensor
Sensor
5. Request
Local Region
7. Reply
8. Reply
9. Request
- IEEE 802.15.4 standard suggests CSMA/CA as link layer protocol
Client
5. Analytical Evaluation of the Query Processing at the Servers
In this section, we provide an analytical model for the query processing at the servers for our framework-oriented web portal; whereas the network model has been studied through the testbed results, as in Section 6. There are various types of servers that have been introduced in our framework, i.e. Service Discovery servers, LD servers, MIB servers, and GD servers etc. Thus, it is important to

Sensors 2009, 9
5213
provide an analysis of query processing at these servers for our proposed framework. This analysis can be studied through an analytical evaluation, as its best.
We have benchmarked the web portal’s multi-tier architectural design for query processing at different servers for our framework. For web portal application, a single request is served by hundreds of applications operating in parallel [32]. Such elementary software applications, designed to be composed with each other, are commonly referred to as services. The data servers’ tier of our proposed framework and Global Servers tier of web portal are logically modeled into the business logic tier, and the servers tier. For fast query response, the business logic code generates multiple queries to its underlying databases (servers tier) to generate a single response.
There are various analysis models proposed for multi-tier web architecture that can be applied in our proposed framework-oriented web portal architecture, but the model presented in [33] best describes the approach. As described in [33], the query requests arrive according to a Poisson process with rate λ to a dedicated entry level 0 (where all requests arrive). If the query response is cached at caching tier 0 with probability P0, then the response will be made to the client, without any further processing. However, the business logic tier will execute the query, if the query needs to be processed with probability 1−P0, by service tier 0 and the other N levels in the queuing network, as depicted in Figure 7. The request is routed to each of the N levels in sequence, where at each level i, the request is served by caching tier i with probability Pi. If the request is not cached at the caching tier, with probability 1 − Pi, the request is served by service tier i. When the query is solved at level i, the results are sent back for processing to service tier 0. For fast query processing, a request that is sent from the business logic to each level i generates Ki requests back and forth, where Ki is a non-negative discrete random variable. Thus, a request has fully completed its service at level i after Ki service completions. Hence, every request that is served by service tier 0 passes this tier 1 + K1 + K2· · · + KN times, and finally leaves the system after having visited all N levels.
Figure 7. Analytical model for multi-tiered web applications.
Each caching tier i is modeled by an infinite-server queue having general service times with an average of γc,i time units for i = 0,...,N. Whereas, each service tier i is modeled by a processing sharing queue with an average service time of γs,i time units for i = 0,...,N. The mean response time of the service can be obtained through the sojourn time of the request in the system. Let Si
(k) be the sojourn time of the k-th visit to level i, and M = EK1 +· · · + EKN. Then, the expected sojourn time ES of an arbitrary request arriving to the system is given by:

Sensors 2009, 9
5214
⎥⎥
⎦
⎤
⎢⎢
⎣
⎡+= ∑∑∑
==
+
=
iK
j
ji
N
i
M
k
k SSEES1
)(
1
1
1
)(0
Now, we say that Lc,i and Ls,i denote the stationary number of requests at caching tier i, and service tier i for i = 1,...,N, respectively, we have:
∏∏==
==
====N
iisis
N
iicic
isisicic
lLXlLX
NilLlLX
0,,
0,,
,,,,
)()(
),...,0;,(
with lc,i and ls,i = 0, 1,... for i = 0,...,N. We can also determine the expected sojourn time at the entry node and the service nodes. Let ρc,0 = λP0γc,0 defines the load on the entry node’s caching tier, and ρs,0 = (M + 1)(1 − P0)λγs,0 for the service tier. Similarly, the load for the basic services is given by ρc,i = (1 − P0)Piλγc,i and ρs,i = (1 − P0)(1 − Pi)λγs,i for i = 1,...,N. Then, by Little’s Law, the expected sojourn time ESc,i at caching tier i is given by ESc,i = γc,i, whereas the expected sojourn time ESs,i at service tier i is given by ESs,i = γs,i/(1 − ρs,i) for i = 0,...,N. Combining all the expressions for the expected sojourn time at each tier in the network, we derive that the expected response time is given by:
{ }
⎥⎥⎦
⎤
⎢⎢⎣
⎡
−−+−
+−
+−+=
⎥⎥⎦
⎤
⎢⎢⎣
⎡−++−
+=⎥⎥
⎦
⎤
⎢⎢
⎣
⎡+=
∑
∑
∑∑∑
=
=
==
+
=
is
isiici
N
ii
s
sc
N
iisiiciis
c
K
j
ji
N
i
M
k
k
PPEKP
MPP
ESPESPEKESP
ESPSSEESi
,
,,
00
0,
0,00,0
1,,0,0
0,01
)(
1
1
1
)(0
1)1()1(
1)1(
)1(
)1()1(
ργ
γ
ργ
γ
6. Experimental Evaluation of the Proposed Framework
We have evaluated the proposed architecture based on three important aspects: i) total network delay with and without local region, ii) the behavior of the network, with and without framework-oriented web portal, during a heavy traffic, and iii) throughput under end-to-end delay for our proposed framework and receiver-oriented congestion control mechanism used by web portals [9]. 6.1. Network Model of the Testbed
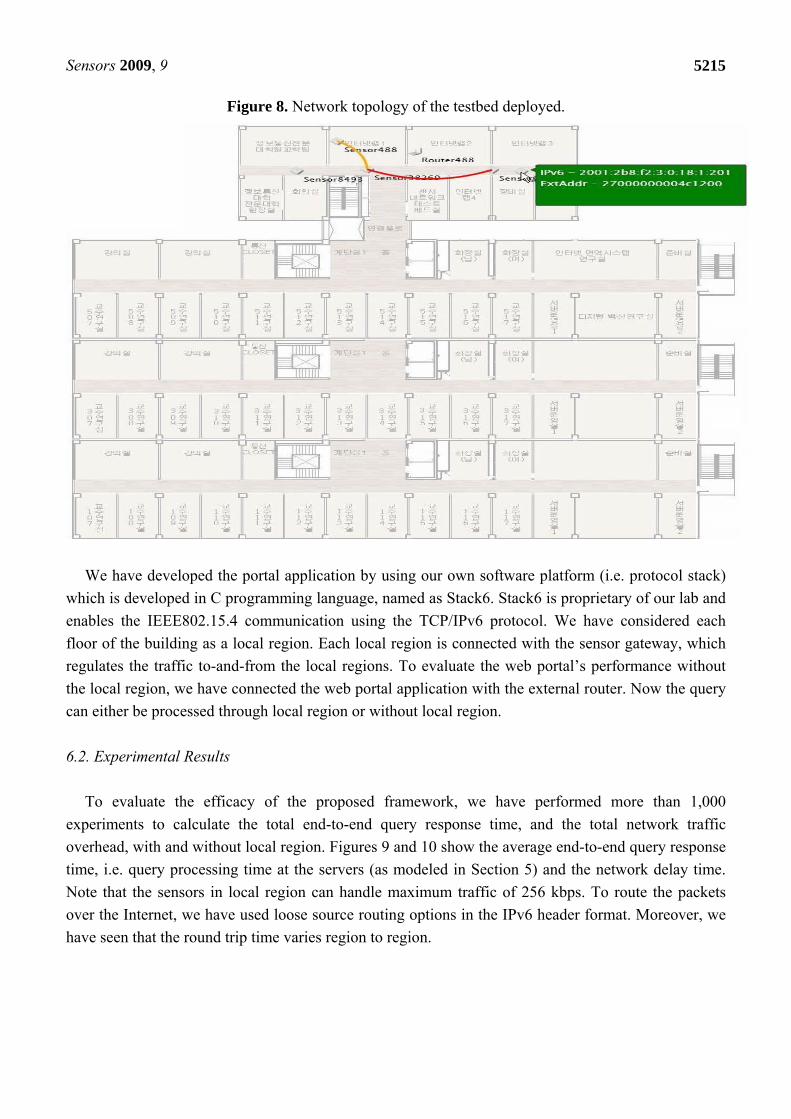
We examined the proposed framework architecture by deploying a testbed of 150 sensor nodes, in 1st, 3rd and 5th floor of eight-story building of Ajou University. We have used temperature sensors, heat sensors, humidity sensors, and sound sensors, for framework evaluation. Each sensor node contains Chipcon’s CC2420DB IEEE 802.15.4 compliant wireless mote. Each mote is assigned with an IPv6 address, and the total 50 nodes are installed in the rooms and corridors of each floor, with an average distance of 3 meters. Each Sensor mote is part of a PAN (Personal Area Networks), and there are total 5 PANs at each floor. There is one PAN coordinator within each PAN. The PAN coordinator is a powerful sensor node that is main powered, and acts as a master node. Figure 8 shows the network topology of the testbed deployed.
Sensors 2009, 9
5215
Figure 8. Network topology of the testbed deployed.
We have developed the portal application by using our own software platform (i.e. protocol stack)
which is developed in C programming language, named as Stack6. Stack6 is proprietary of our lab and enables the IEEE802.15.4 communication using the TCP/IPv6 protocol. We have considered each floor of the building as a local region. Each local region is connected with the sensor gateway, which regulates the traffic to-and-from the local regions. To evaluate the web portal’s performance without the local region, we have connected the web portal application with the external router. Now the query can either be processed through local region or without local region. 6.2. Experimental Results
To evaluate the efficacy of the proposed framework, we have performed more than 1,000 experiments to calculate the total end-to-end query response time, and the total network traffic overhead, with and without local region. Figures 9 and 10 show the average end-to-end query response time, i.e. query processing time at the servers (as modeled in Section 5) and the network delay time. Note that the sensors in local region can handle maximum traffic of 256 kbps. To route the packets over the Internet, we have used loose source routing options in the IPv6 header format. Moreover, we have seen that the round trip time varies region to region.

Sensors 2009, 9
5216
Figure 9. End-to-end delay when query is resolved within local region or over the Internet (same region).
Figure 10. End-to-end delay when query is resolved within local region or over the Internet (via Europe and via USA).
In Figure 9, the average delay of 2 ms is observed when the query is resolved within the local
region or within the same country (where the query is made), i.e. Korea. The delay within the local region is very smooth (almost constant), but different delay values are observed as shown in Figures 9 and 10. This is due to the reason that the query can be cached within the master node, which cause the minimum delay; whereas it usually requires two master nodes for processing the query, causing the delay of almost 136 ms. If the immediate master node, from the client, is busy then more than two

Sensors 2009, 9
5217
master nodes process the query, that adds more delays. At the other hand, as shown in Figure 10, a huge delay can be seen from 150 ms to 450 ms, when the query is routed via USA or Europe. It can be observed from Figures 9 and 10 that the query response time can be reduced when the query is resolved within the local region. Whereas routing the packet over the Internet adds processing, and queuing delay at each router of the Internet. If the service discovery time is added, then the query response time would dramatically increase in case of general web portal architecture; whereas in local region it would not affect a lot.
There are several factors, like link failure, change in routing path etc., which cause the network delay; but the network load is usually the main reason that causes fluctuation in the end-to-end delay and, therefore, can be thought as one of the most important reasons among all the factors that cause fluctuation in delay [34]. Figure 11 shows the cumulative distribution function (CDF) of end-to-end delay of Figure 11. We can observe from Figure 11, that different regions have different CDF values at the given point. We can observe the CDF graph of “within local region” is almost smooth, showing the balanced network load. Delays can indicate the network load situation very well based on the analysis of the CDF of end-to-end delay in a given path.
Figure 11. CDF of end-to-end delay analysis.
Congestion Control Comparison between Web Portal and Proposed Framework
Current web portal architecture exploits the information available only at receivers in order to improve latency and throughput in diverse scenarios of portal application. In other words, TCP protocols delegate key congestion control functions to the receivers [9]. Whereas in our proposed framework i) the local regions restrict the traffic within their proximity, hence avoiding the congestion to increase, ii) furthermore, the congestion is normalized among the multiple master nodes within the local region.

Sensors 2009, 9
5218
We have analytically compared the results obtained by Receiver-centric congestion control mechanism, described in [9], and with our proposed mechanism. In [9] the bandwidth consumption has been computed using the square-root TCP-friendly formula [35]. Thus, in order to provide a fair comparison, we have obtained our results with the same formula, as in [35]. In Figure 12, we plot the bandwidth of a single flow (on the y-axis) against variable end-to-end delay of the flows from 20 to 350 ms (as shown on the x-axis). It is observed that when all flows are well-behaved, the bandwidth share is fair [9] (the straight line in the figure). However, as the flows of end-to-end delay increase, the malicious flow steals more and more bandwidth, up to five times more than its fair share (the maximum for this scenario) when the end-to-end delay is 350 ms [9].
Figure 12. Throughput comparison with the delay.
0
0.1
0.2
0.3
0.4
0.5
0.6
0 50 100
150
200
250
300
350
End-to-End Delay (msec.)
Bandw
idth
Consum
ption (
norm
alized)
misbehaving flow [9]
fair share [9]
share by our framwork
But, in case of our proposed framework, the max end-to-end delay is observed to be 150 ms, and mostly it lies between 50 ms to 100 ms. Thus, the bandwidth occupied in our proposed framework is closer to the well behaved flows of the web portal (which is the ideal case of web portal). Also, at the end-to-end delay of 150 ms, our framework consumes half of the bandwidth, i.e. an improvement of 50%, compared to the misbehaving flow. But, as shown, increasing end-to-end delay of misbehaving flow causes more bandwidth consumption – thus, at one stage, our scheme proves to be up to five times better than the misbehaving flow.
In our experiments, we have also created a U-era scenario by generating a huge number of packets and injected them, from each floor, into the network with an interval of less than 1 ms. There are two types of packets that have been injected into the network; 1st ones that would be handled by the Internet router (as is always in the case of a web portal), and 2nd those that would be handled within local region or by the local region gateway. As mentioned before, we assert that in U-era the most of the applications would generate the traffic that is within the local scope of the application, such
Sensors 2009, 9
5219
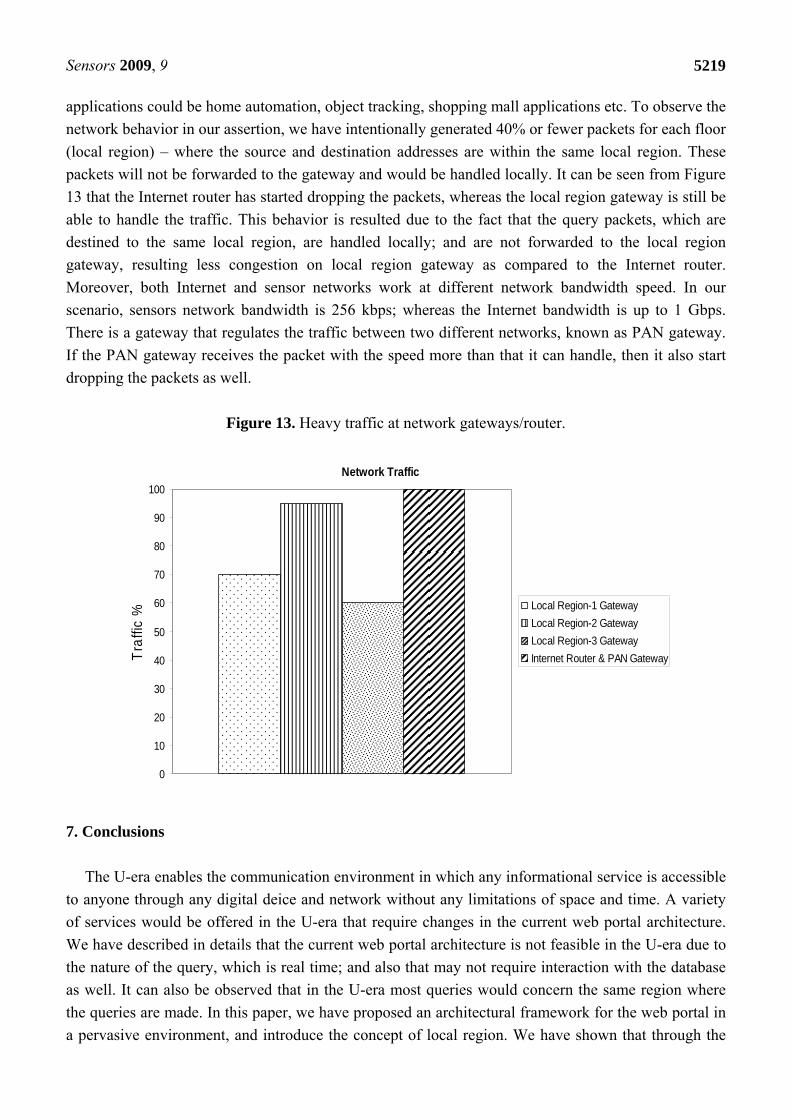
applications could be home automation, object tracking, shopping mall applications etc. To observe the network behavior in our assertion, we have intentionally generated 40% or fewer packets for each floor (local region) – where the source and destination addresses are within the same local region. These packets will not be forwarded to the gateway and would be handled locally. It can be seen from Figure 13 that the Internet router has started dropping the packets, whereas the local region gateway is still be able to handle the traffic. This behavior is resulted due to the fact that the query packets, which are destined to the same local region, are handled locally; and are not forwarded to the local region gateway, resulting less congestion on local region gateway as compared to the Internet router. Moreover, both Internet and sensor networks work at different network bandwidth speed. In our scenario, sensors network bandwidth is 256 kbps; whereas the Internet bandwidth is up to 1 Gbps. There is a gateway that regulates the traffic between two different networks, known as PAN gateway. If the PAN gateway receives the packet with the speed more than that it can handle, then it also start dropping the packets as well.
Figure 13. Heavy traffic at network gateways/router.
Network Traffic
0
10
20
30
40
50
60
70
80
90
100
Traf
fic %
Local Region-1 GatewayLocal Region-2 GatewayLocal Region-3 GatewayInternet Router & PAN Gateway
7. Conclusions
The U-era enables the communication environment in which any informational service is accessible to anyone through any digital deice and network without any limitations of space and time. A variety of services would be offered in the U-era that require changes in the current web portal architecture. We have described in details that the current web portal architecture is not feasible in the U-era due to the nature of the query, which is real time; and also that may not require interaction with the database as well. It can also be observed that in the U-era most queries would concern the same region where the queries are made. In this paper, we have proposed an architectural framework for the web portal in a pervasive environment, and introduce the concept of local region. We have shown that through the

Sensors 2009, 9
5220
concept of local region not only the query response time is improved but also the network overhead is reduced as well. We have evaluated our framework through one of the world’s largest IP based WSN testbed. We have observed that the web portal’s implementation with our proposed framework achieves the desired results and enhances the web portals requirement in U-era. 7.1. Future Work
As for our future work, we would verify the importance of MIB server, after deploying a large number of sensor nodes, and would discuss the management of sensor nodes. As the aim of this paper is to introduce web portal’s importance in the U-era, its concept and the architecture, i.e. framework for web portal; so our next step is to discuss the results from management of large number of sensors point of view.
Acknowledgements
This work is supported by the R&D program under Ministry of Knowledge Economy (MKE) of the
Republic of Korea. [2008-F-052, Scalable/Mobile/Reliable Wireless Sensor Network Technology]. We are also thankful to MIC/IITA for their support to authors towards the development of IP based sensor network (IP-USN) technology. Appendices:
A1: The Log file for the experiments.

Sensors 2009, 9
5221
A2: The message passing among the sensor node.
A3: The graph created from the sensor data.
References and Notes 1. Fukunaga, S.; Tagawa, T.; Fukui, K.; Tanimoto, K.; Kannoet, H. Development of Ubiquitous
Sensor Network. Oki Tech. Rev. 2004, 71, 24–29. 2. Crossbow Mica motes: http://www.xbow.com/ 3. Smart-its: http://www.smart-its.org/

Sensors 2009, 9
5222
4. Kawahara, Y.; Minami, M.; Morikawa, H.; Aoyama, T. Design and Implementation of a Sensor Network Node for Ubiquitous Computing Environment. IEEE 58th Vehicular Technology Conference, VTC 2003-Fall, Orlando, FL, USA, October 6-9, 2003.
5. Gibbons, P.B.; Karp, B.; Ke, Y.; Nath, S.; Srinivasan, S. IrisNet: An Architecture for a Worldwide Sensor Web. IEEE Pervasive Comput. 2003, 22–33.
6. A Sensor Model Language: http://www.sensorsmag.com/articles/0403/30/main.shtml 7. Culler, D. Secure, Low-power, IP-based Connectivity with IEEE 802.15.4 Wireless Networks,
2007. Available online: http://www.archrock.com/downloads/resources/ArchRock.Sum07.pdf. 8. Stankovic, J.A. When Sensor and Actuator Networks Cover the World. ETRI J. 2008, 30,
627–633. 9. Kuzmanovic, A.; Knightly, E.W. Receiver-Centric Congestion Control with a Misbehaving
Receiver: Vulnerabilities and End-point Solutions. Elsevier Comput. Network. 2007, 51, 2717–2737.
10. Delin, K.A. The Sensor Web: A Distributed, Wireless Monitoring System. Sensors Mag. April 1, 2004.
11. Sensor Web: http://en.wikipedia.org/wiki/Sensor_Web. 12. Botts, M.; McKee, L. A Sensor Model Language: Moving Sensor Data onto the Internet. Sensors
Mag. April 1, 2003. 13. Delicato, F.; Pires, P.; Pirmez, L.; Carmo, L. A Service Approach for Architecting Application
Independent Wireless Sensor Networks. Cluster Comput. 2005, 8, 211–221. 14. Sivavakeesar, S.; Gonzalez, O.F.; Pavlou, G. Service Discovery Strategies in Ubiquitous
Communication Environments. IEEE Comm. Mag. 2006, 44, 106–113. 15. Riem-Vis, R. Cold Chain Management using an Ultra Low Power Wireless Sensor Network.
Workshop on Applications of Mobile Embedded Systems, Boston, MA, USA, 2004; pp. 21–23. 16. Romer K.; Mattern, F. Design Space of Wireless Sensor Networks. IEEE Wireless Commun. 2004,
11, 54–61. 17. Berkeley, U.C.; Co, M.L.B. The 29 Palms Experiment: Tracking vehicles with a UAV-delivered
sensor network. Twentynine, Palms, CA, March 12-14, 2001. Available at: http://robotics.eecs.berkeley.edu/~pister/29Palms0103/.
18. Xue, W.; Luo, Q.; Chen, L.; Liu, Y. Contour Map Matching for Event Detection in Sensor Networks. Proceedings of the 2006 ACM SIGMOD international conference on Management of data, Chicago, IL, USA, 2006; pp. 145–156.
19. Abadi, D.J.; Madden, S.; Lindner, W. REED: Robust, Efficient Filtering and Event Detection in Sensor Networks, 2005. Citable URL: http://hdl.handle.net/1721.1/30452.
20. Guralnik, V.; Srivastava, J. Event Detection from Time Series Data. Proceedings of the Fifth ACM SIGKDD International Conference on Knowledge Discovery and Data Mining, ACM: New York, NY, USA, 1999; pp. 33–42.
21. Intel Lab Data. URL: http://berkeley.intel-research.net/labdata/ 22. Papadimitriou, S.; Brockwell, A.; Faloutsos, C. Adaptive, Hands-off Stream Mining. 29th
International Conference on Very Large Databases (VLDB’03), Berlin, Germany, September 9-12, 2003.

Sensors 2009, 9
5223
23. Szewczyk, R.; Polastre, J.; Mainwaring, A.; Culler, D. Lessons from a Sensor Network Expedition. EWSN 2004: European workshop on wireless sensor networks, Berlin, Germany, 2004; pp. 307–322.
24. Shah R.C.; Roy, S.; Jain, S.; Brunette, W. Data MULEs: Modeling a Three-Tier Architecture for Sparse Sensor Networks, 1st IEEE International Workshop on Sensor Network Protocols and Applications, Anchorage, AK, USA, 2003; pp. 30–41.
25. Kulkarni P.; Ganesan, D.; Shenoy, P.; Lu, Q.F. SensEye: A Multi-tier Camera Sensor Network. 13th Annual ACM international Conference on Multimedia, Singapore, November 06-11, 2005; pp. 229–238.
26. Yap, K.K.; Srinivasan, V.; Motani, M. MAX: Human-Centric Search of the Physical World. SenSys’05, San Diego, CA, USA, 2005.
27. Duan, Z.; Dong, Y.F.; Gopalan, K. Push vs. Pull: Implications of Protocol Design on Controlling Unwanted Traffic. USENIX Steps to Reducing Unwanted Traffic on the Internet Workshop, SRUTI’06, San Jose, CA, USA, 2005.
28. HTTP Performance Overview: http://www.w3.org/Protocols/HTTP/Performance/. 29. Web sites handle the load of millions of visitors:
http://computer.howstuffworks.com/question342.htm 30. Gutierrez, J.A. Wireless Medium Access Control and Physical Layer Specifications for Low-Rate
Wireless Personal Area Networks. IEEE Press: New York, NY, USA, September 2006. 31. 802.11 Technical Section: http://wifi.cs.st-andrews.ac.uk/wifistandard.html. 32. Vogels, W. Learning from the Amazon technology platform-ACM Queue 4(4), June 5, 2006. 33. Bhulai, S.; Sivasubramanian, S.; van der Mei, R.; van Steen, M. Analysis of End to End Response
Time of Multi Tier Internet Service. Technical Report WS2006-11, Vrije Universiteit: Amsterdam, The Netherlands, 2006.
34. Zhang, W.; He, J.S. Modeling End-to-End Delay Using Pareto Distribution. Second International Conference on Internet Monitoring and Protection, 2007. ICIMP 2007, San Jose, CA, USA, 1-5 July, 2007; p. 21.
35. TCP-Friendly Unicast Rate-Based Flow Control: http://www.psc.edu/networking/papers/tcp_friendly.html#equation2.
© 2009 by the authors; licensee Molecular Diversity Preservation International, Basel, Switzerland. This article is an open-access article distributed under the terms and conditions of the Creative Commons Attribution license (http://creativecommons.org/licenses/by/3.0/).