design and implementation of neighborhood control optimal
TRANSCRIPT

Vol. 11, No. 1, March 2018, pp. 12 - 27 ISSN 2006-1781
E. Nwelih, P. O. Asagba and C. Ugwu (2018), Design and Implementation of Neighborhood Control
© 2018 Afr. J. Comp. & ICT – All Rights Reserved
https://afrjcict.net
Design and Implementation of Neighborhood
Control Optimal GSM Base Transceiver Station
Placement Using Genetic Algorithm
E. Nwelih1, P. O. Asagba
2 and C. Ugwu
3
Department of Computer Science,1
University of Benin, Benin City Nigeria
Email: [email protected] [email protected]
1
Department of Computer Science,2,3
University of Port Harcourt, Rivers State Nigeria
Email: [email protected] [email protected]
3
ABSTRACT This study looked at the problems of placement of Base Transceiver System (BTS) for Global System for mobile
Communication (GSM) in Nigeria and the degree of compliance by the GSM operator to lay down rules and
regulations. To achieve this, existing data from a GSM service provider operator on placement of BTS was used as
input in this study, to compare with our optimal global system for mobile communication base transceiver station
placement using genetic algorithm design writing in java programming language. The result shows that existing system
have not totally complied with NCC and NESREA regulations but our implementation showed a greater improvement to
the adherence to these regulations in terms of neighborhoods considerations.
Keywords: Global System for Mobile communication (GSM), Base Transceiver Station (BTS),Neighborhood
Consideration (NHC), Genetic Algorithm (GA), Nigerian Communications Commission (NCC) and the National Environmental Standard Regulatory Agency (NESREA)
_________________________________________________
African Journal of Computing & ICT Reference Format:
E. Nwelih, P. O. Asagba and C. Ugwu (2018), Design and Implementation of Neighborhood Control Optimal GSM Base Transceiver Station Placement Using Genetic Algorithm, Afr. J. Comp. & ICT, Vol.11, No.1, pp. 12-27.
© Afr. J. Comp. ICT, March 2018; ISSN 2006-1781
1. INTRODUCTION
Given the mode of operation of GSM technology, Base
Transceiver Stations (BTS) are required for the provision
of GSM services. Consequently, network of base stations
were established in areas that enjoyed the GSM services
all over Nigeria. Mobile network are leading the evolution
of the information and communications society towards the mobile information society [2]. However, studies have
shown that exposure to GSM radiations are linked to
health hazards such as fatigue, headache, decreased
concentration, dizziness, local irritation, tumour
Vol. 11, No. 1, March 2018, pp. 12 - 27 ISSN 2006-1781
E. Nwelih, P. O. Asagba and C. Ugwu (2018), Design and Implementation of Neighborhood Control
© 2018 Afr. J. Comp. & ICT – All Rights Reserved
https://afrjcict.net
induction, sperm motility, morphology and viability,
cancer, especially brain tumour and leukaemia, viral and infectious diseases [1,6]. Given these potential health
impacts of BTS on humans, the National Environmental
Standards and Regulations Enforcement Agency
(NESREA) established guidelines for National
Environmental Standards for Telecommunications and
Broadcasting Facilities. The guidelines provided for the
establishment of BTS within a minimum setback of ten
(10) meters from the perimeter wall (fence) of
residential/business premises, schools and hospitals.
Similarly, where there is no perimeter wall (fence), the
BTS must be at a minimum of twelve (12) meters from
the wall of residential, business premises schools and hospitals[4,12] .There is no doubt that the
telecommunication system in Nigeria has undergone a
revolution since the deregulation of the GSM market.
Similarly, the Nigeria Communication Commission NCC,
seeing the robust growth in the sector, encouraged the
entry of more mobile operators into the GSM market in
the year 2001 [8,18].
The mobile telecommunication industry in Nigeria is
growing and is still undergoing extraordinary changes
brought about by the introduction of new technology according to [3,14]. The changes have led to an increase
of BTS in cities, towns and villages in Nigeria. This led to
the concept of neighborhood control in this study, which
is the inclusion of consideration of the structure in the
immediate environment (neighbor) in the selection of a
suitable site for the BTS. This involves the consideration
of many issues amongst which are: the availability of
land, safety and health considerations, accessibility for
maintenance purposes, issues of radio frequency
requirements, capacity issues, line of sight and height of
the neighboring buildings. The key problem identified in
the placement of base station in Nigeria is the manual inspection of proposed site by engineers. The engineers’
then leaves the process of cell planning to a team of radio
planners for the final decision of the Base Station
Transceiver (BST) site, who take these decisions based on
their experience. The final decision can be subjective,
giving room for bias and not give opportunity for a wider
consultation for other option. The importance of
environmental consideration in BST placement has
resulted in operator views by many with the notion of
their placement requirement. The shutting down of a BST
over regulatory breach has multiple effects as it results in loss of network coverage for the area and a big financial
loss for the operator [1]. The neighborhood concept was
born out of the need for more efficient and automated cell
planning tool that takes compliance to regulation into
consideration and gives the operator the opportunity to
search for a larger space for a near optimal placement. In the presence of agitation and public concern for the
installation of base station in residential area, in Nigeria
however there is cooperation between the ministries of
environment, health and the ministries involve with the
telecommunication regulation in putting in place an
acceptable legal and regulatory framework. In this study,
we look at the existing BST architecture and designed a
BTS architecture which includes Genetic Algorithm (GA)
for optimizing the placement of the BTS and taking the
neighborhood into consideration in determining its
location by BTS, with maximum and minimum distance
from populated environment in Nigeria.
The challenges facing the GSM and other industries in
Nigeria is the lack of engineers and professional, and also
inadequate power supply, theft, multiple taxation by the
government, poor telecommunication infrastructure and
inadequate skilled manpower and that these challenges
could be combated through technological innovation
coupled with extensive research and development [5].
These challenges was further buttress by [4] in a study
that was conducted in Ile-Ife Oshun state Nigeria, that the
location of GSM Communication Base Transceiver Station in Ile-Ife has been investigated in other to verify
the compliance of BTS providers in accordance to NCC
and NESREA guidelines on installation and placement of
BTS. The results of the research show that 79 BTS were
installed and 72.5 % are in operation. 45.6% of the BTS
has setback to building structures at 5 m while 59.5 %
executed setback of 10 m, in accordance to NESREA and
NCC guidelines. Despite the challenges confronting the
GSM service providers, deregulation of the sector has
brought about positive socio-economic changes in the
lives of the subscribers [15]. [6] in his study has claimed
that the introduction of Global System for Mobile Communications (GSM) phone with the un-regulated
sitting of communication towers have increased the
exposure of great percentage of the population to
electromagnetic radiation and the concomitants health
hazard in Nigeria and concluded, that the community
should always be involved in any decision to erect a base
station in their neighborhoods. But [16] concluded that the
conventional GSM architecture must be designed in order
to allow BTS to be installed outside populated areas,
while keeping a relative small MSC transmission power
and with a suitable solution we could reduce human exposure to GSM radiation levels. While [13] tried the
adjustment of parameters in antenna placement problem
using GA and was evaluated by assuming a flat area but

Vol. 11, No. 1, March 2018, pp. 12 - 27 ISSN 2006-1781
E. Nwelih, P. O. Asagba and C. Ugwu (2018), Design and Implementation of Neighborhood Control
© 2018 Afr. J. Comp. & ICT – All Rights Reserved
https://afrjcict.net
insisted that further work should be done on the algorithm
so that it can consider the terrain features.
According to [9] in their work on characterization of the
radiofrequency radiation potential of Alakahia and Choba
communities in Port Harcourt, Rivers State, Nigeria,
advised that residential and office buildings should be
located hundreds of meters away from base stations.
There should be prudent avoidance of exposure to RFR
from base stations. Manufactures of base station antennas
should consider the principle of reducing the output
power intensity as low as reasonably achievable. This is
to ensure that the proposed site will not create any adverse
economic, safety and aesthetic impact on nearby properties and the overall community. The surrounding
here referred to as ‘neighbors’ to a BST site. These are
pertinent issues and great challenge to wireless
communication providers and regulators. The fear of the
impact of the facilities has added to the many agitation,
conflict, legal issues and refusal for permission to be
granted for site that would have given optimal coverage
and better service delivery [19]. The international
telecommunication union (ITU) in collaboration with
other relevant bodies like world health organization
(WHO), international commission on Non-ionizing radiation protection (ICNIRP), have come up with radio
regulation bordering on safety to guide the operation of
telecommunications regulation in various countries to
developed their legal and policy framework to guide the
operation of the telecommunication services [17]. The
literature review so far agreed that a better understanding
of the policy framework guiding the deployment of radio
base station and the placement of base station is a must
for GSM operators in Nigeria for the safety and health
implications of the growing populations in the
neighborhoods.
2. MATERIALS AND METHOD
The method applied in this study, is to use data from the
existing placement of BTS from a GSM operator to
compare with our neighborhood control optimal global
system for mobile communication base transceiver station
placement using genetic algorithm design. The
Neighborhood Control (NHC) design is a novel method
which is applied to the BTS. This method approached the
BTS problem as a Wideband Code Division Multiple Access (WCDMA) placement problem which can be
addressed through optimization, because it has several
objectives to be optimized. As the number of objectives of
the problem increases, the complexity of the problem
becomes high as the objectives considered are
contradictory to one another, since multiple solutions obtained as candidate solutions of the problem. Genetic
Algorithm (GA) has the potential advantage as a multi-
point search tool for optimization problems with multiple
objectives. However, GA has been mainly applied to
optimization problems with a single objective. This work
considers the BTS placement process as a multi objective
problem which considers the working area where the BST
must be installed. Assuming the number of BTS that will
be located in the neighborhood area being conceded is S
such that S is assigned {1,2,...,n} . The possible locations
have to be defined since BTS cannot be placed at arbitrary
locations such as residential buildings, public roads and inside the stadiums. The design also considered looking at
a set of test points (TP) within the neighborhood area,
where a TP is assigned {1,2,...,m} and a test point is a
location where a signal must be received above a
minimum specified service threshold to ensure a required
quality of service. A particular test point is said to be
covered by a BTS (A) if P – PL ≥ Sq, where Sq is the
coverage threshold required by the receiving equipment,
and P is the power transmitted by the BTS. In a WCDMA
BTS placement problem, one wishes to select a subset of
possible locations within the set S where to install BTS, and to assign Test Point (TP) to the available base stations
taking into account the traffic demand, and the signal
quality in terms of Signal to Interference Ratio (SIR) in
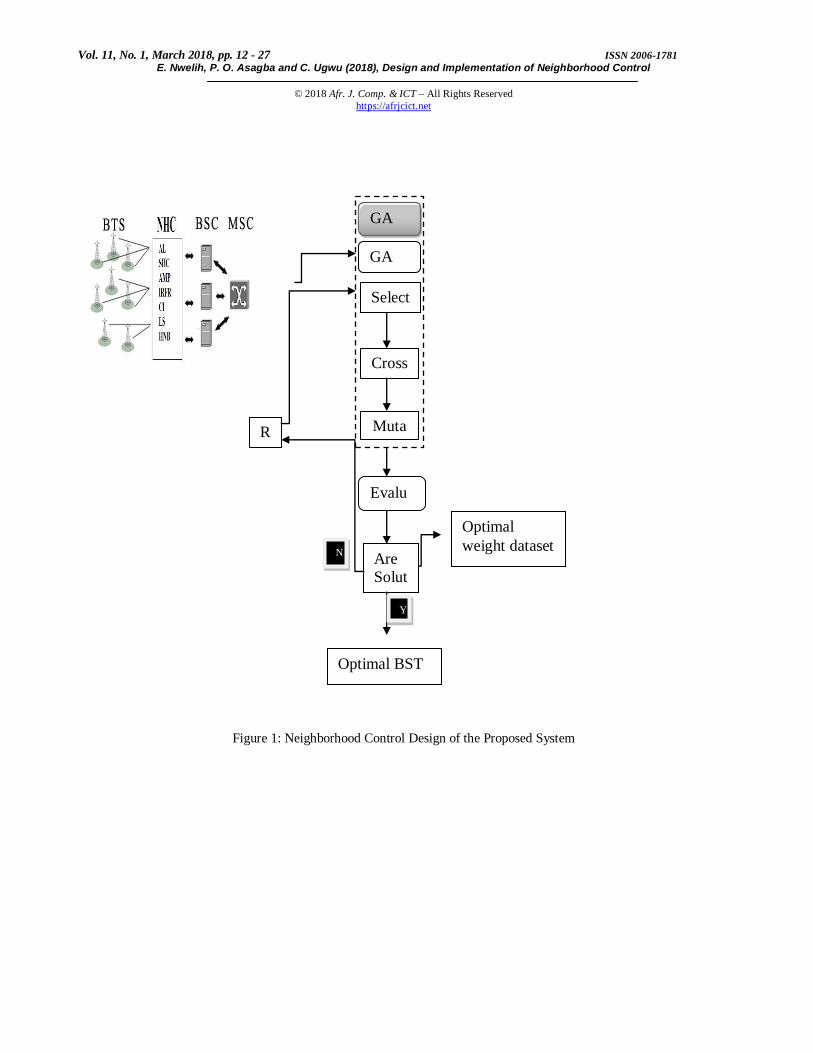
the design. Figure 1 shows the neighborhood control
design.
The Neighborhood Control (NHC) design is in charge of
the geographic land mark futures, which helps the
prospective network owners to place BTS within the
control location. The NHC equations were derived from
the formula, Population Density = Number of
People/Land Area, was used to derive the NHC equations (1),(2),(5) and (9).
http://education.nationalgeographic.com/education/activit
y/calculating-population-density/?ar_a=1
Area type (AT) is the number of people living within a square meter of the neighborhood (cell area) and this
includes the buildings in that cell area. This can be
calculated as given by equation (1)
AT = Number of people within a square mile (1)
Number of buildings within a square mile
Optimal
weight dataset

Vol. 11, No. 1, March 2018, pp. 12 - 27 ISSN 2006-1781
E. Nwelih, P. O. Asagba and C. Ugwu (2018), Design and Implementation of Neighborhood Control
© 2018 Afr. J. Comp. & ICT – All Rights Reserved
https://afrjcict.net
Availability of land (AL) is the total area occupied by
buildings in the neighborhood (cell area). It can be calculated as given by equation (2)
AL = Total area (2)
Area occupied by buildings
Safety and health considerations (SHC), is the velocity of dispersed radiation by the mast in the neighborhood (cell
area) as given by equation (3) and (4) which is derived
from [11].
.
SHC = Q. (3)
L*D*W
D = V (4)
1 -
d
d
D = Dispersion
Q = Amount of Released
L = Distance of Residential Area from Mast
D = Dispersion
W = Wind Speed
V = Velocity
λ = Wavelength
= Refractive index
Accessibility for maintenance purposes (AMP) of the base transceiver station, through flat land that is available in
the area type is given by equation (5).
AMP = Height difference from A to B (5)
Horizontal distance from A to B
Issues of radio frequency requirements (IRFR) is the amount of signal frequency wavelength dispersed and it is
derived from the principle of electromagnetic waves
propagate of Calculating wavelength with the energy
equation which is given by equation (6)
http://www.kentchemistry.com/links/AtomicStructure/wa
veequations.htm
IRFR = (4Лd)2 (6)
(λ)2
where:
d = distance from transmitter
Л = pie
λ = wavelength
Capacity issues (CI) is the capacity within cell area
limited by available bandwidth and operational
requirements. Each network operator has to size cells area to handle expected traffic demand. To calculate the total
capacity available, the volume is adjusted according to the
period being considered. The available capacity is
difference between the required capacity and planned
operating capacity [10]. This is given by equation (7).
CI = Actual output (7)
Maximum possible output
Line of Sight is an imaginary line that exists between two
objects. Radio transmissions require a clear path between
antennas known as radio Line of Sight. Line of sight
propagation is a characteristic of electromagnetic radiation or acoustic wave propagation which means
waves travel in a direct path from the source to the
receiver. Electromagnetic transmission includes light
emissions traveling in a straight line. The rays or waves
may be diffracted, refracted, reflected, or absorbed by the
atmosphere and obstructions with material and generally
cannot travel over the horizon or behind obstacles [7].
Line of sight (LS) is the ability of a mast to receive signals from another mast within the neighborhood where
it is located is given by equation (8).
LS = +
(8)
Height of the neighboring building (HNB) is the height of the mast over the heights of the building is given by
equation (9).
HNB = Height of mast (9)
Height of building
Genetic Algorithm(GA) is based on the principle of
evolution and natural genetics it has been successful in solving many optimization problems including the BTS
placement problem. The design of a GA starts with
solution encoding, creation of individuals that make a
population, and evaluation of the individuals. During the
evaluation each individual is assigned a fitness value
according to a certain fitness function. Based on the
fitness value, some of the better individuals are selected to
seed the next generation by applying crossover and

Vol. 11, No. 1, March 2018, pp. 12 - 27 ISSN 2006-1781
E. Nwelih, P. O. Asagba and C. Ugwu (2018), Design and Implementation of Neighborhood Control
© 2018 Afr. J. Comp. & ICT – All Rights Reserved
https://afrjcict.net
mutation to them. In GA, the variables can be represented
in binary, integer, and real. This paper considers the value encoding scheme. To evaluate the performance of the
proposed algorithm, the network data given in for 64kbps
uplink and 144kbps downlink data service are used for the
cell planning process which goes through the selection
process to find out which individuals can be taken as
parents for crossover. The individuals are selected based
on their fitness values. An individual with higher fitness
value is likely to be selected. The best six individuals are
selected for crossover. The crossover produces new
individuals in combining the information contained in the
parents. Depending on the representation of the variables,
different methods must be used. Basic crossover methods include one-point crossover, multi-point crossover, and
uniform crossover. After the creation of all the children,
the mutation operator possibly changes them. It scans
each gene of all children and changes the value of a gene
with the mutation probability. Different mutation
probability values between 0 and 1 were evaluated and the
optimum value of 0.6 was used. For binary operation, the
mutation was implemented by changing 1s to 0s or 0s to
1s in a randomly selected point in chromosomes. After the
mutation process was finished the children needed to be
evaluated. The best chromosome is then found and the algorithm started with selection again. The stopping
criterion is fulfilled if the number of generations is
reached. Fitness is a function which takes a candidate
solution to the problem as input and produces as
output how “fit” or how “good” the solution is with
respect to the problem in consideration. Calculation of
fitness value is done repeatedly in a GA and therefore it
should be sufficiently fast. A slow computation of the
fitness value can adversely affect a GA and make it
exceptionally slow. In most cases the fitness function and
the objective function are the same as the objective is to
either maximize or minimize the given objective function. However, for more complex problems with multiple
objectives and constraints, an algorithm designer might
choose to have a different fitness function, the objective
function derived from equations 1 to 9 using algebraic
method is given by equation (10).
Objective function = (AT*AMP*AL*LS*CI*AMP) (10)
(HI*IRFR*HNB)
3. RESULTS AND DISCUSSIONS
After the system model was developed using Java, its
performance was carefully assessed and evaluated. The
system evaluation is based on criteria that are clearly
relevant with defined standards of interpretation. The
desired characteristics of the data are that they provide an
accurate representation of the environment to be tested and that there are sufficient data to allow for robust
inference.
Results from data set used in generating the important
optimum values parameters, was generated following the
Nigeria Environmental Standard and Regulation
Enforcement Agency (NESREA) and Nigeria
Communication Commission (NCC) rules and policies.
The ten base transceiver stations are also assumed to be
ten solutions and locations on the geographical area. The
task of the algorithm is to find the most suitable set of
solutions and locations among the ten predefined
geographical area, taking into account the following objectives:
i. Maximizing the network coverage with the aim
of covering all the locations.
ii. Minimizing the safety and health conditions.
iii. Minimization of the cost of the network by using
fewer locations.
The Genetic Algorithm steps for the BTS system is
outlined below:
Step 1: Input population initialization Step 2: Evaluation of individual
Step 3: Optimization criteria met
Step 4: Selection
Step 5: Crossover
Step 6: Mutation
Step 7: New population
Step 7: Continue from step 2 until best
individual is gotten with result.
Step 8: Stop.
The working area with possible BTS solutions and
locations is illustrated in figure 1. Each solution and location represents the possible base station location while
the symbol (+) represent High Rise Buildings with colour
red , the symbol (*) represent Population with colour blue,
the symbol (#) represent Flatland with colour green, and
the symbol (%) represent Solution with colour black. The
solutions and locations are randomly distributed in the
entire working area.
During the initialization phase, 10 individuals are
randomly generated with an initialization probability.
Each individual is encoded as a value string. The length of
each individual is 8 bits since the set of available genes are made of 8 elements. The initialization probability of
0.1 or 10% is found to be optimum after the evaluation of
different values between 0 and 1. This means that 90% of
the base stations are set to be active. These active genes

Vol. 11, No. 1, March 2018, pp. 12 - 27 ISSN 2006-1781
E. Nwelih, P. O. Asagba and C. Ugwu (2018), Design and Implementation of Neighborhood Control
© 2018 Afr. J. Comp. & ICT – All Rights Reserved
https://afrjcict.net
are randomly distributed in the individual. Simulations
were carried out on a natural environment as described previously. In order to get good results, the genetic
algorithm parameters must be tuned before the algorithm
is used. There are three parameters that must be tuned for
the algorithm to converge optimally. These parameters
include the initialization probability, the crossover
probability, and the mutation probability.
Table 2: BTS map solution and locations
The chromosomes and gene value of the initialization
dataset, before crossover and mutation as shown in table1
which shows the initial Genes which are Area Type (AT),
Availability of Land (AL), Safety and Health Condition
(SHC), Accessibility and Maintenance Purpose (AMP),
Issues of radio Frequency Requirement (IRFR), Capacity Issue (CI), Line of Sight (LS) and Height of Neighboring
Building (HNB), and the chromosomes from data1 to
data10. It should be noted that there are changes in values
of data 1, 2 and 3 while data 4, 5, 6, 7, 8, 9 and 10 remain
constant, because crossover and mutation has not taken
place it is still in the initialization state. When it was
uploaded into the GA, it gave a maximum of three BTS
map solutions and locations in the result, as shown in
Figure 2.
Table 4:BTS map solution and locations
Table 2 shows BTS map which represents the optimal
solutions and location for generation 0, where the
solutions and locations are geographical map areas of the
longitude and latitude position of the BTS. These are solution 7 at location 456, 70; solution 6 at location 408,
282 and solution 4 at location 133, 432. Figure 3 shows a
chart representation of table 1, it shows the chromosomes
present in the population and their gene values.
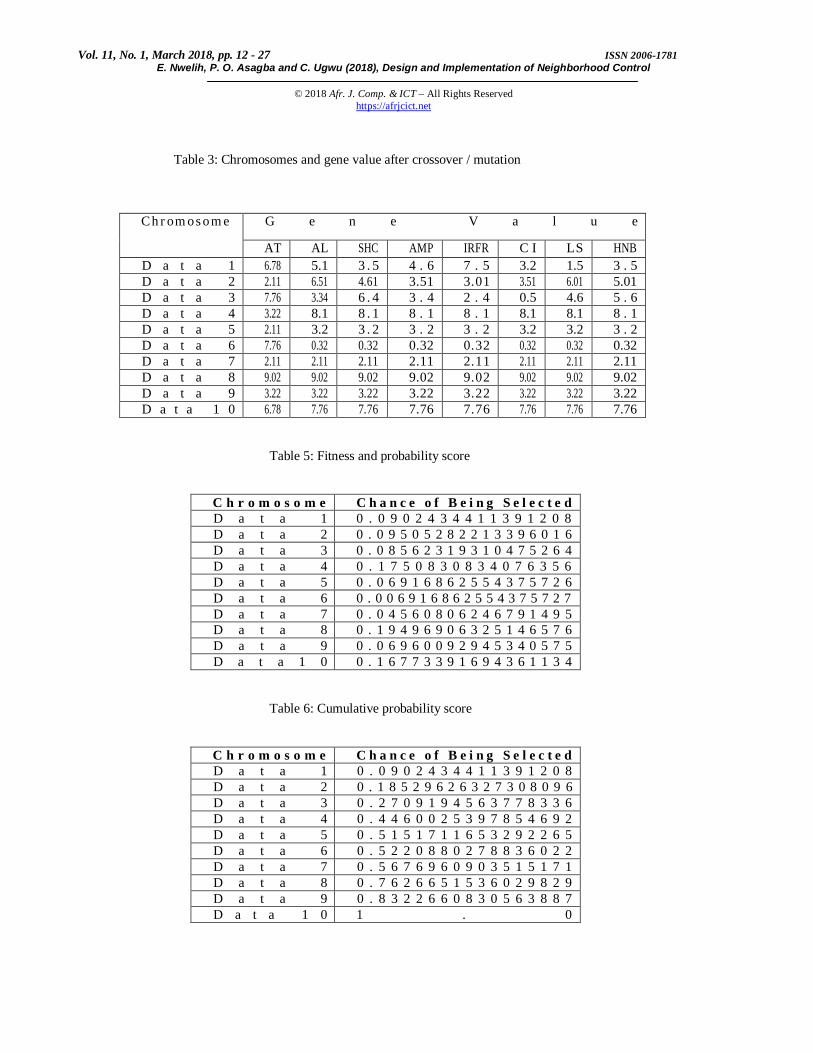
Table 3 shows the changes in data 1, 2, 3, 4, 5, 6, and 10
while there are no changes in values of data 7, 8 and 9 which remain constant, because GA selects data for
crossover and mutation. The crossover and mutation
produces new individuals in combining the information
contained in the parents. The uniform crossover is used in
this study. After the creation of all the children, the
mutation operator possibly changes them. It scans each
gene of all children and changes the value of a gene with
the mutation probability. Different mutation probability
values between 0 and 1 were evaluated, the result from
the fitness and probability score shows that only optimum
value of 0.1 will be used. For value encoding, the
mutation was implemented by random, only improving chromosomes are randomly chosen and exchanged only if
they improve solution (increase fitness). After the
mutation process was finished the children needed to be
evaluated. The best chromosome was then found and the
algorithm started with selection again. The stopping
criterion was fulfilled if the number of generations was
reached. The next generations (new offspring’s) optimal
solution results when compared with the initial generation
optimal results, it can be seen that there are differences in
the solutions and locations which will best suit the GSM
operators to select from. Figure 4 shows the screen short for Generation 1 optimal solution.
Figure 4: Screen short of the BTS optimal map solutions
and locations for generation 1
Table 4 shows BTS map which represents the optimal
solutions and location for generation 1, where the solutions and locations are geographical map areas of the
longitude and latitude position of the BTS, with solution 6
at location 264, 63 and solution 4 at location 17, 261.
Solutions L o c a t i o n s
7 4 5 6 , 7 0
6 4 0 8 , 2 8 2
4 1 3 3 , 4 3 2
S o l u t i o n s L o c a t i o n s
6 2 6 4 , 6 3
4 1 7 , 2 6 1
Vol. 11, No. 1, March 2018, pp. 12 - 27 ISSN 2006-1781
E. Nwelih, P. O. Asagba and C. Ugwu (2018), Design and Implementation of Neighborhood Control
© 2018 Afr. J. Comp. & ICT – All Rights Reserved
https://afrjcict.net
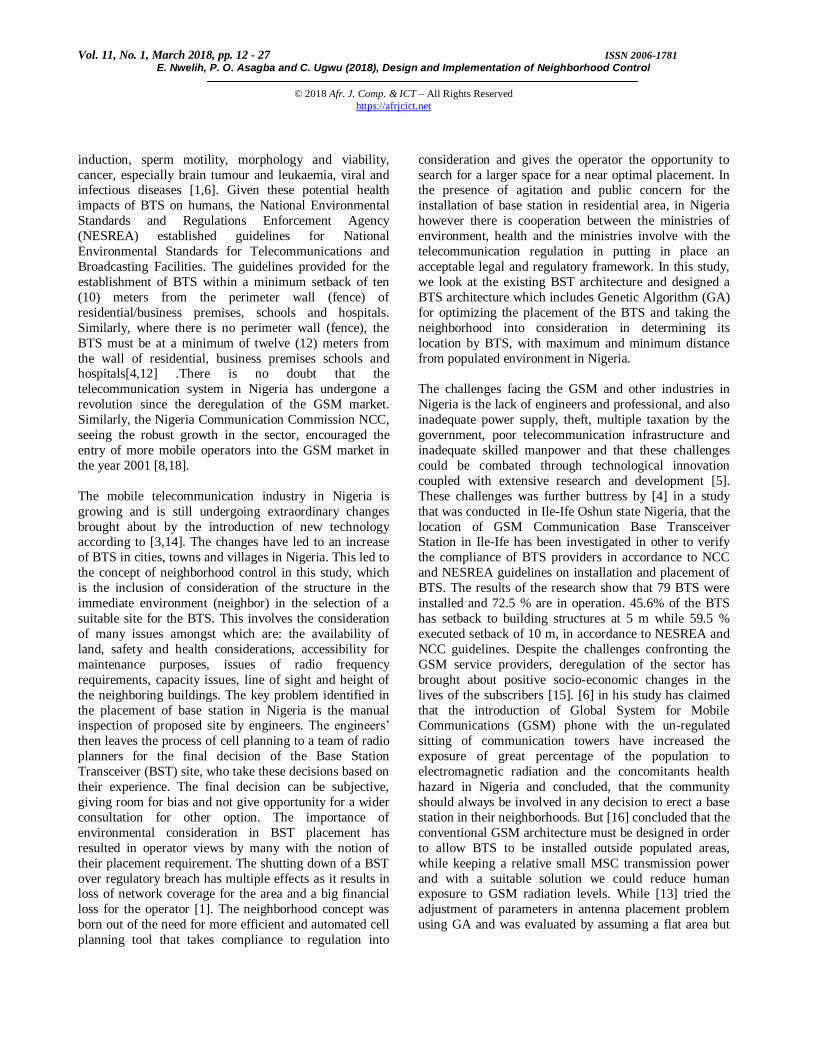
Figure 5: Screen short chart for the fitness score
Figure 6: Screen short chart for the probability score
Table 5 shows the fitness and probability score, which
shows that chromosomes 8, 4, 10, 2, 1, and 3 stand a
chance of being selected for next crossover and mutation.
And this is shown clearly in the chart for fitness score in
figure 5, and the chart for probability of being selected in
figure 6.
Figure 7: Screen short chart for the cumulative probability
score
Table 6 shows the cumulative probability score of 1.0. The chart in figure 7 shows this clearly.
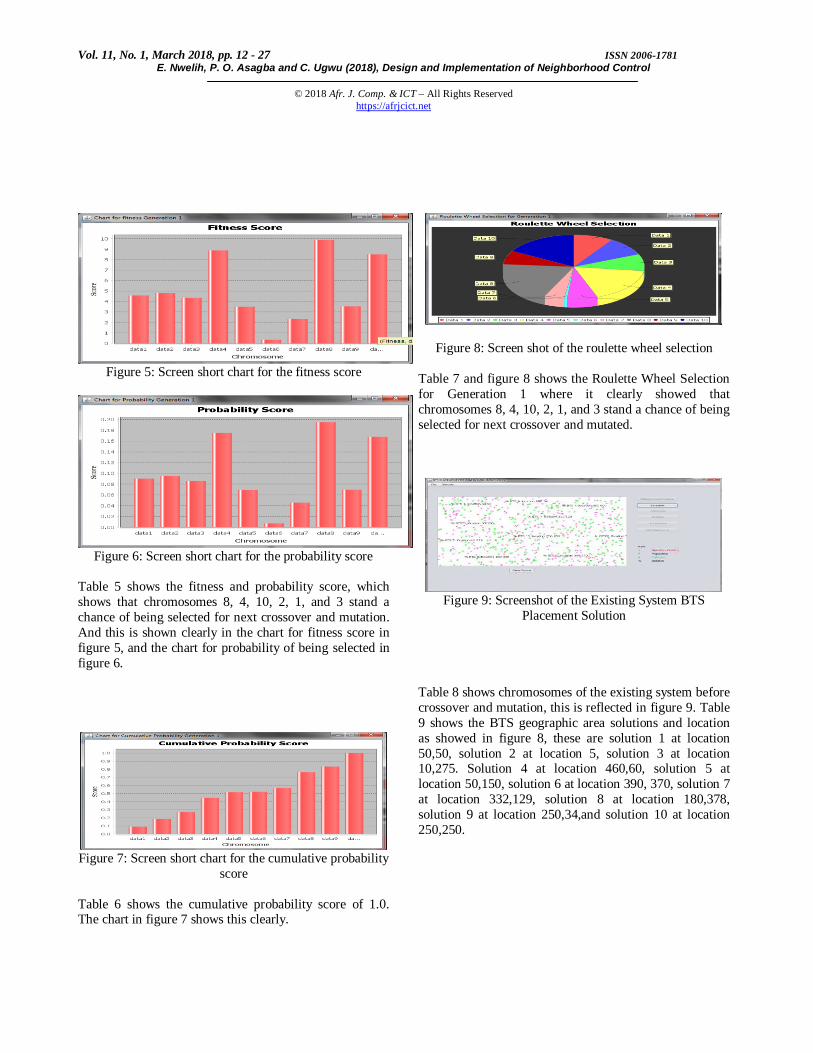
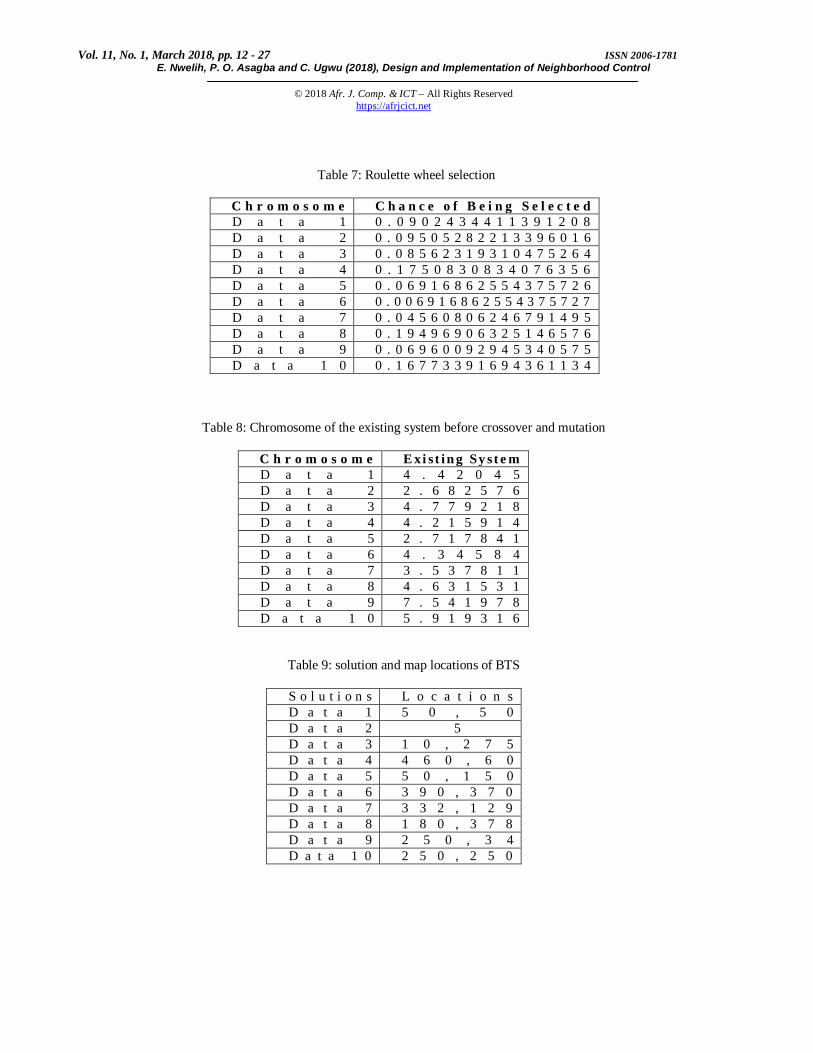
Figure 8: Screen shot of the roulette wheel selection
Table 7 and figure 8 shows the Roulette Wheel Selection
for Generation 1 where it clearly showed that
chromosomes 8, 4, 10, 2, 1, and 3 stand a chance of being
selected for next crossover and mutated.
Figure 9: Screenshot of the Existing System BTS
Placement Solution
Table 8 shows chromosomes of the existing system before
crossover and mutation, this is reflected in figure 9. Table
9 shows the BTS geographic area solutions and location
as showed in figure 8, these are solution 1 at location
50,50, solution 2 at location 5, solution 3 at location 10,275. Solution 4 at location 460,60, solution 5 at
location 50,150, solution 6 at location 390, 370, solution 7
at location 332,129, solution 8 at location 180,378,
solution 9 at location 250,34,and solution 10 at location
250,250.
Vol. 11, No. 1, March 2018, pp. 12 - 27 ISSN 2006-1781
E. Nwelih, P. O. Asagba and C. Ugwu (2018), Design and Implementation of Neighborhood Control
© 2018 Afr. J. Comp. & ICT – All Rights Reserved
https://afrjcict.net
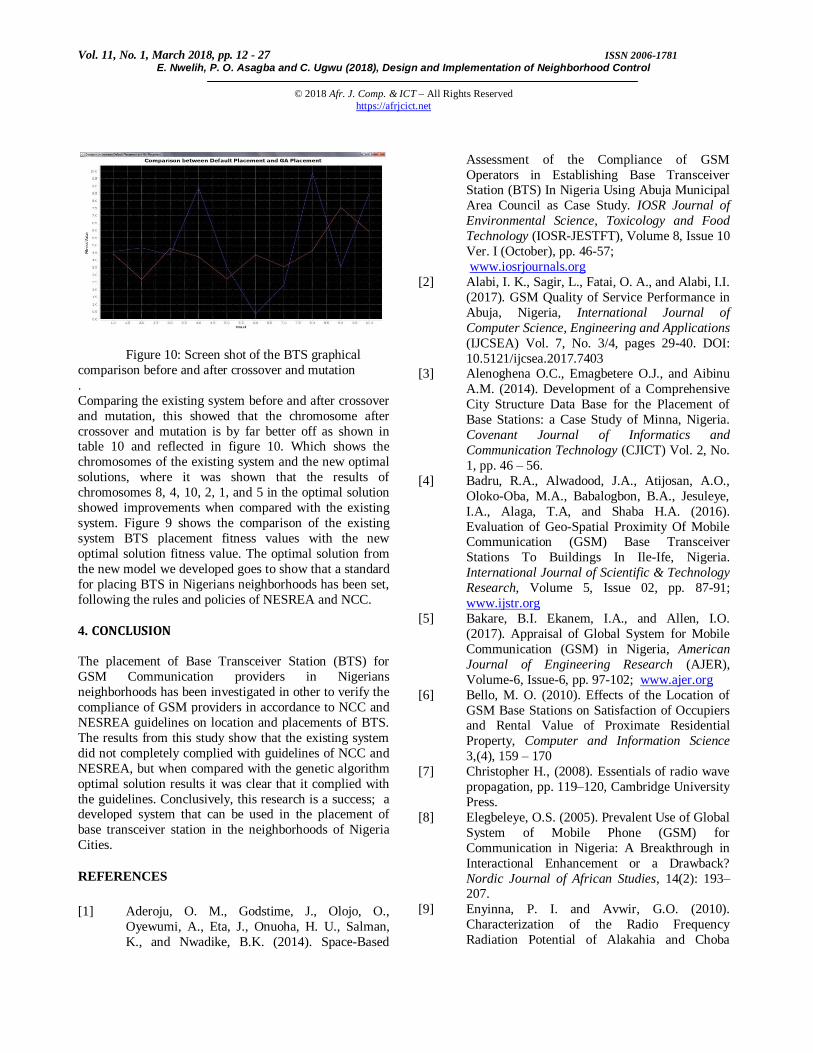
Figure 10: Screen shot of the BTS graphical
comparison before and after crossover and mutation
.
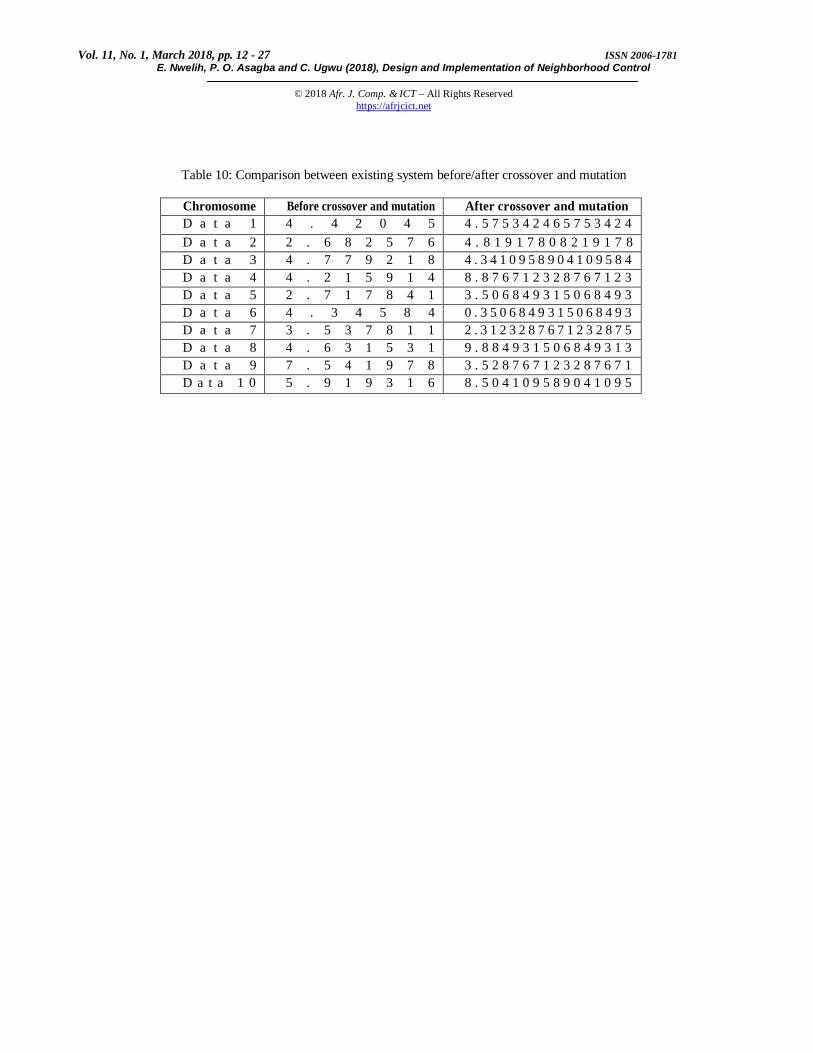
Comparing the existing system before and after crossover
and mutation, this showed that the chromosome after
crossover and mutation is by far better off as shown in table 10 and reflected in figure 10. Which shows the
chromosomes of the existing system and the new optimal
solutions, where it was shown that the results of
chromosomes 8, 4, 10, 2, 1, and 5 in the optimal solution
showed improvements when compared with the existing
system. Figure 9 shows the comparison of the existing
system BTS placement fitness values with the new
optimal solution fitness value. The optimal solution from
the new model we developed goes to show that a standard
for placing BTS in Nigerians neighborhoods has been set,
following the rules and policies of NESREA and NCC.
4. CONCLUSION
The placement of Base Transceiver Station (BTS) for
GSM Communication providers in Nigerians
neighborhoods has been investigated in other to verify the
compliance of GSM providers in accordance to NCC and
NESREA guidelines on location and placements of BTS.
The results from this study show that the existing system
did not completely complied with guidelines of NCC and
NESREA, but when compared with the genetic algorithm
optimal solution results it was clear that it complied with
the guidelines. Conclusively, this research is a success; a developed system that can be used in the placement of
base transceiver station in the neighborhoods of Nigeria
Cities.
REFERENCES
[1] Aderoju, O. M., Godstime, J., Olojo, O.,
Oyewumi, A., Eta, J., Onuoha, H. U., Salman,
K., and Nwadike, B.K. (2014). Space-Based
Assessment of the Compliance of GSM
Operators in Establishing Base Transceiver Station (BTS) In Nigeria Using Abuja Municipal
Area Council as Case Study. IOSR Journal of
Environmental Science, Toxicology and Food
Technology (IOSR-JESTFT), Volume 8, Issue 10
Ver. I (October), pp. 46-57;
www.iosrjournals.org
[2] Alabi, I. K., Sagir, L., Fatai, O. A., and Alabi, I.I.
(2017). GSM Quality of Service Performance in
Abuja, Nigeria, International Journal of
Computer Science, Engineering and Applications
(IJCSEA) Vol. 7, No. 3/4, pages 29-40. DOI:
10.5121/ijcsea.2017.7403 [3] Alenoghena O.C., Emagbetere O.J., and Aibinu
A.M. (2014). Development of a Comprehensive
City Structure Data Base for the Placement of
Base Stations: a Case Study of Minna, Nigeria.
Covenant Journal of Informatics and
Communication Technology (CJICT) Vol. 2, No.
1, pp. 46 – 56.
[4] Badru, R.A., Alwadood, J.A., Atijosan, A.O.,
Oloko-Oba, M.A., Babalogbon, B.A., Jesuleye,
I.A., Alaga, T.A, and Shaba H.A. (2016).
Evaluation of Geo-Spatial Proximity Of Mobile Communication (GSM) Base Transceiver
Stations To Buildings In Ile-Ife, Nigeria.
International Journal of Scientific & Technology
Research, Volume 5, Issue 02, pp. 87-91;
www.ijstr.org
[5] Bakare, B.I. Ekanem, I.A., and Allen, I.O.
(2017). Appraisal of Global System for Mobile
Communication (GSM) in Nigeria, American
Journal of Engineering Research (AJER),
Volume-6, Issue-6, pp. 97-102; www.ajer.org [6] Bello, M. O. (2010). Effects of the Location of
GSM Base Stations on Satisfaction of Occupiers and Rental Value of Proximate Residential
Property, Computer and Information Science
3,(4), 159 – 170
[7] Christopher H., (2008). Essentials of radio wave
propagation, pp. 119–120, Cambridge University
Press.
[8] Elegbeleye, O.S. (2005). Prevalent Use of Global
System of Mobile Phone (GSM) for
Communication in Nigeria: A Breakthrough in
Interactional Enhancement or a Drawback?
Nordic Journal of African Studies, 14(2): 193–207.
[9] Enyinna, P. I. and Avwir, G.O. (2010).
Characterization of the Radio Frequency
Radiation Potential of Alakahia and Choba
Vol. 11, No. 1, March 2018, pp. 12 - 27 ISSN 2006-1781
E. Nwelih, P. O. Asagba and C. Ugwu (2018), Design and Implementation of Neighborhood Control
© 2018 Afr. J. Comp. & ICT – All Rights Reserved
https://afrjcict.net
Communities, Nigeria. Facta Universitatis
Series:Working and Living Environmental Protection, Vol. 7, No 1, 2010, pp. 25 – 31 UDC
613.648.2:613.62(662.6 Niger).
[10] Gunther, N. J. (2007). Guerrilla Capacity
Planning, A Tactical Approach to Planning for
Highly Scalable Applications and Services.
Springer, pp. 27 – 64. .
[11] Hofmann, P., (2008) Solid State Physics: An Introduction. Wiley-VCH, 2008;
http://www.philiphofmann.net/book_material/not
es/groupphasevelocity2.pdf
[12] Husain, M. A., Gwary, M. S., Yusuf, M. I. and
Yusuf, I. D. (2017). Appraisal of Spatial
Distribution of Global System for Mobile
Telecommunications (GSM) Infrastructure in
Gombe Metropolis, Nigeria, International
Journal of Engineering Science Invention,
www.ijesi.org. Volume 6, Issue 8, pp. 45-55.
[13] Job, M; Anish, K., and Ben, V.W. (2008). Optimization of Antenna Placement in 3G
Networks using Genetic Algorithms, Proc IEEE
Third International Conference on Broadband
communication, Information Technology and
Biomedical Applications pp. 30 – 37.
[14] Joseph I. (2013). Harnessing
Telecommunications Revolution in Nigeria: A
Case Study. Journal of Wireless and Mobile
Technologies. 1(1), pp. 20-24 DOI:
10.12691/wmt-1-1-4;
http://www.sciepub.com/journal/wmt
[15] Micah, D. J. and Alabi, J. T. (2016). Challenges of operators of global system for mobile
telecommunication services in Nigeria: Towards
mitigating the pain, Direct Research Journal of
Social Science and Educational Studies
(DRJSSES). Vol. 3(3), pp. 44-50;
directresearchpublisher.org/journal/drjsses/
[16] Mu˜noz-Gea, J. P.. Vales-Alonso, J. Garc´ıa-
Haro, J., and Gonz´alez-Casta˜no, F. J. (2006). A
Simulation Study on the Health Concerns
Derived from GSM Base Station Placement.
IEEE MELECON, Benalmadena (Malaga), Spain 1-4244-0088-0/06.
[17] Oliver, B. and Danielle, S. (2005). Regulating
the Risks of Mobile Phone Base Stations: A
Comparative Study in five Countries, World
Health Organization Workshop on Base Stations
and Wireless Network, pp. 113-126.
[18] Olukotun, G. A., James, O. O. and Olorunfemi,
K. (2013). The Introduction of GSM Services in
Anyigba Community and its Impact on Students
Expenditure Pattern, Global Journal of
Management and Business Research Finance, 13 (8), pp. 71-81.
[19] Thomas, A. W. (2002). Cell Towers proliferation
in the United States. The Geographical Review,
92(1), pp. 46-62.
APPENDIX
Snapshots/sample source codes of the implementation
using Java.
/**
* * @author Nwelih Emmanuel
*/
public class Simulation extends javax.swing.JFrame {
int count=0;
Graphics2D population;
Graphics2D flat;
Graphics2D highrise;
Graphics2D solution;
int generationcount=0;
List <String> popx=new ArrayList<String>(); List <String> popy=new ArrayList<String>();
List <String> highx=new ArrayList<String>();
List <String> highy=new ArrayList<String>();
List <String> flatx=new ArrayList<String>();
List <String> flaty=new ArrayList<String>();
int mastx[]={0,0,0,0,0,0,0,0,0,0};
int masty[]={0,0,0,0,0,0,0,0,0,0};
int select[]={0,0,0,0,0,0,0,0,0,0};
double fitness[]={0,0,0,0,0,0,0,0,0,0};
double proba[]={0,0,0,0,0,0,0,0,0,0};
double cumproba[]={0,0,0,0,0,0,0,0,0,0};
double
at[]={4.50,3.01,5.45,8.10,3.20,0.32,2.11,9.02,3.22,7.76};
double
al[]={5.10,6.51,3.34,8.10,3.20,0.32,2.11,9.02,3.22,7.76};
double shc[]={3.50,4.61,6.4,8.10,3.20,0.32,2.11,9.02,3.22,7.76};
double
amp[]={4.60,3.51,3.4,8.10,3.20,0.32,2.11,9.02,3.22,7.76}
;

Vol. 11, No. 1, March 2018, pp. 12 - 27 ISSN 2006-1781
E. Nwelih, P. O. Asagba and C. Ugwu (2018), Design and Implementation of Neighborhood Control
© 2018 Afr. J. Comp. & ICT – All Rights Reserved
https://afrjcict.net
double
irfr[]={7.50,3.01,2.4,8.10,3.20,0.32,2.11,9.02,3.22,7.76}; double
ci[]={3.20,3.51,0.5,8.10,3.20,0.32,2.11,9.02,3.22,7.76};
double
ls[]={1.50,6.01,4.6,8.10,3.20,0.32,2.11,9.02,3.22,7.76};
double
hnb[]={3.50,5.01,5.6,8.10,3.20,0.32,2.11,9.02,3.22,7.76};
double
at1[]={4.50,3.01,5.45,8.10,3.20,0.32,2.11,9.02,3.22,7.76}
;
double
al1[]={5.10,6.51,3.34,8.10,3.20,0.32,2.11,9.02,3.22,7.76};
double
shc1[]={3.50,4.61,6.4,8.10,3.20,0.32,2.11,9.02,3.22,7.76}
;
double
amp1[]={4.60,3.51,3.4,8.10,3.20,0.32,2.11,9.02,3.22,7.76
};
double
irfr1[]={7.50,3.01,2.4,8.10,3.20,0.32,2.11,9.02,3.22,7.76}
;
double ci1[]={3.20,3.51,0.5,8.10,3.20,0.32,2.11,9.02,3.22,7.76};
double
ls1[]={1.50,6.01,4.6,8.10,3.20,0.32,2.11,9.02,3.22,7.76};
double
hnb1[]={3.50,5.01,5.6,8.10,3.20,0.32,2.11,9.02,3.22,7.76
};
/** Creates new form Simulation */
public Simulation() {
initComponents();
jButton2.setEnabled(false);
jButton3.setEnabled(false); jButton4.setEnabled(false);
jButton5.setEnabled(false);
jButton6.setEnabled(false);
}
/** This method is called from within the constructor to
* initialize the form.
* WARNING: Do NOT modify this code. The content
of this method is
* always regenerated by the Form Editor.
*/ @SuppressWarnings("unchecked")
// <editor-fold defaultstate="collapsed"
desc="Generated Code">//GEN-BEGIN:initComponents
private void initComponents() {
jFileChooser1 = new javax.swing.JFileChooser();
jPanel5 = new javax.swing.JPanel(); jTabbedPane1 = new javax.swing.JTabbedPane();
jPanel1 = new javax.swing.JPanel();
jPanel10 = new javax.swing.JPanel();
jPanel11 = new javax.swing.JPanel();
jPanel12 = new javax.swing.JPanel();
jTextField1 = new javax.swing.JTextField();
jButton8 = new javax.swing.JButton();
jButton9 = new javax.swing.JButton();
jPanel13 = new javax.swing.JPanel();
jButton10 = new javax.swing.JButton();
jPanel14 = new javax.swing.JPanel();
jLabel7 = new javax.swing.JLabel(); jLabel8 = new javax.swing.JLabel();
jLabel9 = new javax.swing.JLabel();
jLabel10 = new javax.swing.JLabel();
jLabel11 = new javax.swing.JLabel();
jLabel12 = new javax.swing.JLabel();
jLabel13 = new javax.swing.JLabel();
jLabel14 = new javax.swing.JLabel();
jButton11 = new javax.swing.JButton();
jComboBox1 = new javax.swing.JComboBox();
jComboBox2 = new javax.swing.JComboBox();
jComboBox3 = new javax.swing.JComboBox(); jComboBox4 = new javax.swing.JComboBox();
jComboBox5 = new javax.swing.JComboBox();
jComboBox6 = new javax.swing.JComboBox();
jComboBox7 = new javax.swing.JComboBox();
jComboBox8 = new javax.swing.JComboBox();
jButton12 = new javax.swing.JButton();
jPanel2 = new javax.swing.JPanel();
jLabel16 = new javax.swing.JLabel();
jTextField2 = new javax.swing.JTextField();
jButton13 = new javax.swing.JButton();
jButton14 = new javax.swing.JButton();
jSeparator1 = new javax.swing.JSeparator(); jLabel17 = new javax.swing.JLabel();
jButton15 = new javax.swing.JButton();
jSeparator2 = new javax.swing.JSeparator();
jLabel18 = new javax.swing.JLabel();
jLabel19 = new javax.swing.JLabel();
jSeparator3 = new javax.swing.JSeparator();
jLabel20 = new javax.swing.JLabel();
jLabel21 = new javax.swing.JLabel();
jLabel22 = new javax.swing.JLabel();
Vol. 11, No. 1, March 2018, pp. 12 - 27 ISSN 2006-1781
E. Nwelih, P. O. Asagba and C. Ugwu (2018), Design and Implementation of Neighborhood Control
© 2018 Afr. J. Comp. & ICT – All Rights Reserved
https://afrjcict.net
Figure 1: Neighborhood Control Design of the Proposed System
Are
Solut
ions
opti
mal?
Evalu
ate
Fitnes
ss
R
e
v
is
e
N
o
Y
e
s
GA
initial
izatio
n Select
ion
Cross
over
Muta
tion
GA
Algor
ithm
Optimal BST
Optimal
weight dataset

Vol. 11, No. 1, March 2018, pp. 12 - 27 ISSN 2006-1781
E. Nwelih, P. O. Asagba and C. Ugwu (2018), Design and Implementation of Neighborhood Control
© 2018 Afr. J. Comp. & ICT – All Rights Reserved
https://afrjcict.net
Table 1: Chromosomes and gene value of the initialization before mutation and crossover
C h r o m o s o m e G e n e V a l u e
A T A L S H C A M P IRFR C I L S H N B
D a t a 1 4 . 5 5 . 1 3 . 5 4 . 6 7 . 5 3 . 2 1 . 5 3 . 5
D a t a 2 3.01 6 . 5 1 4 . 6 1 3 . 5 1 3 . 0 1 3 . 5 1 6 . 0 1 5 . 0 1
D a t a 3 5.45 3 . 3 4 6 . 4 3 . 4 2 . 4 0 . 5 4 . 6 5 . 6
D a t a 4 8 . 1 8 . 1 8 . 1 8 . 1 8 . 1 8 . 1 8 . 1 8 . 1
D a t a 5 3 . 2 3 . 2 3 . 2 3 . 2 3 . 2 3 . 2 3 . 2 3 . 2
D a t a 6 0.32 0 . 3 2 0 . 3 2 0 . 3 2 0 . 3 2 0 . 3 2 0 . 3 2 0 . 3 2
D a t a 7 2.11 2 . 1 1 2 . 1 1 2 . 1 1 2 . 1 1 2 . 1 1 2 . 1 1 2 . 1 1
D a t a 8 9.02 9 . 0 2 9 . 0 2 9 . 0 2 9 . 0 2 9 . 0 2 9 . 0 2 9 . 0 2
D a t a 9 3.22 3 . 2 2 3 . 2 2 3 . 2 2 3 . 2 2 3 . 2 2 3 . 2 2 3 . 2 2
D a t a 1 0 7.76 7 . 7 6 7 . 7 6 7 . 7 6 7 . 7 6 7 . 7 6 7 . 7 6 7 . 7 6
Figure 2: Screen short of the BTS optimal map solutions and locations for generation 0

Vol. 11, No. 1, March 2018, pp. 12 - 27 ISSN 2006-1781
E. Nwelih, P. O. Asagba and C. Ugwu (2018), Design and Implementation of Neighborhood Control
© 2018 Afr. J. Comp. & ICT – All Rights Reserved
https://afrjcict.net
Figure 3: Screen short of the initial population
Vol. 11, No. 1, March 2018, pp. 12 - 27 ISSN 2006-1781
E. Nwelih, P. O. Asagba and C. Ugwu (2018), Design and Implementation of Neighborhood Control
© 2018 Afr. J. Comp. & ICT – All Rights Reserved
https://afrjcict.net
Table 3: Chromosomes and gene value after crossover / mutation
Ch r om os om e G e n e V a l u e
AT AL SHC AMP IRFR C I LS HNB
D a t a 1 6.78 5.1 3 . 5 4 . 6 7 . 5 3.2 1.5 3 . 5
D a t a 2 2.11 6.51 4.61 3.51 3.01 3.51 6.01 5.01
D a t a 3 7.76 3.34 6 . 4 3 . 4 2 . 4 0.5 4.6 5 . 6
D a t a 4 3.22 8.1 8 . 1 8 . 1 8 . 1 8.1 8.1 8 . 1
D a t a 5 2.11 3.2 3 . 2 3 . 2 3 . 2 3.2 3.2 3 . 2
D a t a 6 7.76 0.32 0.32 0.32 0.32 0.32 0.32 0.32
D a t a 7 2.11 2.11 2.11 2.11 2.11 2.11 2.11 2.11
D a t a 8 9.02 9.02 9.02 9.02 9.02 9.02 9.02 9.02
D a t a 9 3.22 3.22 3.22 3.22 3.22 3.22 3.22 3.22
D a t a 1 0 6.78 7.76 7.76 7.76 7.76 7.76 7.76 7.76
Table 5: Fitness and probability score
C h r o m o s o m e C h a n c e o f B e i n g S e l e c t e d
D a t a 1 0 . 0 9 0 2 4 3 4 4 1 1 3 9 1 2 0 8
D a t a 2 0 . 0 9 5 0 5 2 8 2 2 1 3 3 9 6 0 1 6
D a t a 3 0 . 0 8 5 6 2 3 1 9 3 1 0 4 7 5 2 6 4
D a t a 4 0 . 1 7 5 0 8 3 0 8 3 4 0 7 6 3 5 6
D a t a 5 0 . 0 6 9 1 6 8 6 2 5 5 4 3 7 5 7 2 6
D a t a 6 0 . 0 0 6 9 1 6 8 6 2 5 5 4 3 7 5 7 2 7
D a t a 7 0 . 0 4 5 6 0 8 0 6 2 4 6 7 9 1 4 9 5
D a t a 8 0 . 1 9 4 9 6 9 0 6 3 2 5 1 4 6 5 7 6
D a t a 9 0 . 0 6 9 6 0 0 9 2 9 4 5 3 4 0 5 7 5
D a t a 1 0 0 . 1 6 7 7 3 3 9 1 6 9 4 3 6 1 1 3 4
Table 6: Cumulative probability score
C h r o m o s o m e C h a n c e o f B e i n g S e l e c t e d
D a t a 1 0 . 0 9 0 2 4 3 4 4 1 1 3 9 1 2 0 8
D a t a 2 0 . 1 8 5 2 9 6 2 6 3 2 7 3 0 8 0 9 6
D a t a 3 0 . 2 7 0 9 1 9 4 5 6 3 7 7 8 3 3 6
D a t a 4 0 . 4 4 6 0 0 2 5 3 9 7 8 5 4 6 9 2
D a t a 5 0 . 5 1 5 1 7 1 1 6 5 3 2 9 2 2 6 5
D a t a 6 0 . 5 2 2 0 8 8 0 2 7 8 8 3 6 0 2 2
D a t a 7 0 . 5 6 7 6 9 6 0 9 0 3 5 1 5 1 7 1
D a t a 8 0 . 7 6 2 6 6 5 1 5 3 6 0 2 9 8 2 9
D a t a 9 0 . 8 3 2 2 6 6 0 8 3 0 5 6 3 8 8 7
D a t a 1 0 1 . 0
Vol. 11, No. 1, March 2018, pp. 12 - 27 ISSN 2006-1781
E. Nwelih, P. O. Asagba and C. Ugwu (2018), Design and Implementation of Neighborhood Control
© 2018 Afr. J. Comp. & ICT – All Rights Reserved
https://afrjcict.net
Table 7: Roulette wheel selection
C h r o m o s o m e C h a n c e o f B e i n g S e l e c t e d
D a t a 1 0 . 0 9 0 2 4 3 4 4 1 1 3 9 1 2 0 8
D a t a 2 0 . 0 9 5 0 5 2 8 2 2 1 3 3 9 6 0 1 6
D a t a 3 0 . 0 8 5 6 2 3 1 9 3 1 0 4 7 5 2 6 4
D a t a 4 0 . 1 7 5 0 8 3 0 8 3 4 0 7 6 3 5 6
D a t a 5 0 . 0 6 9 1 6 8 6 2 5 5 4 3 7 5 7 2 6
D a t a 6 0 . 0 0 6 9 1 6 8 6 2 5 5 4 3 7 5 7 2 7
D a t a 7 0 . 0 4 5 6 0 8 0 6 2 4 6 7 9 1 4 9 5
D a t a 8 0 . 1 9 4 9 6 9 0 6 3 2 5 1 4 6 5 7 6
D a t a 9 0 . 0 6 9 6 0 0 9 2 9 4 5 3 4 0 5 7 5
D a t a 1 0 0 . 1 6 7 7 3 3 9 1 6 9 4 3 6 1 1 3 4
Table 8: Chromosome of the existing system before crossover and mutation
C h r o m o s o m e E xi s t i n g Sy st e m
D a t a 1 4 . 4 2 0 4 5
D a t a 2 2 . 6 8 2 5 7 6
D a t a 3 4 . 7 7 9 2 1 8
D a t a 4 4 . 2 1 5 9 1 4
D a t a 5 2 . 7 1 7 8 4 1
D a t a 6 4 . 3 4 5 8 4
D a t a 7 3 . 5 3 7 8 1 1
D a t a 8 4 . 6 3 1 5 3 1
D a t a 9 7 . 5 4 1 9 7 8
D a t a 1 0 5 . 9 1 9 3 1 6
Table 9: solution and map locations of BTS
S o l u t i o n s L o c a t i o n s
D a t a 1 5 0 , 5 0
D a t a 2 5
D a t a 3 1 0 , 2 7 5
D a t a 4 4 6 0 , 6 0
D a t a 5 5 0 , 1 5 0
D a t a 6 3 9 0 , 3 7 0
D a t a 7 3 3 2 , 1 2 9
D a t a 8 1 8 0 , 3 7 8
D a t a 9 2 5 0 , 3 4
D a t a 1 0 2 5 0 , 2 5 0
Vol. 11, No. 1, March 2018, pp. 12 - 27 ISSN 2006-1781
E. Nwelih, P. O. Asagba and C. Ugwu (2018), Design and Implementation of Neighborhood Control
© 2018 Afr. J. Comp. & ICT – All Rights Reserved
https://afrjcict.net
Table 10: Comparison between existing system before/after crossover and mutation
Chromosome Before crossover and mutation After crossover and mutation
D a t a 1 4 . 4 2 0 4 5 4 . 5 7 5 3 4 2 4 6 5 7 5 3 4 2 4
D a t a 2 2 . 6 8 2 5 7 6 4 . 8 1 9 1 7 8 0 8 2 1 9 1 7 8
D a t a 3 4 . 7 7 9 2 1 8 4 . 3 4 1 0 9 5 8 9 0 4 1 0 9 5 8 4
D a t a 4 4 . 2 1 5 9 1 4 8 . 8 7 6 7 1 2 3 2 8 7 6 7 1 2 3
D a t a 5 2 . 7 1 7 8 4 1 3 . 5 0 6 8 4 9 3 1 5 0 6 8 4 9 3
D a t a 6 4 . 3 4 5 8 4 0 . 3 5 0 6 8 4 9 3 1 5 0 6 8 4 9 3
D a t a 7 3 . 5 3 7 8 1 1 2 . 3 1 2 3 2 8 7 6 7 1 2 3 2 8 7 5
D a t a 8 4 . 6 3 1 5 3 1 9 . 8 8 4 9 3 1 5 0 6 8 4 9 3 1 3
D a t a 9 7 . 5 4 1 9 7 8 3 . 5 2 8 7 6 7 1 2 3 2 8 7 6 7 1
D a t a 1 0 5 . 9 1 9 3 1 6 8 . 5 0 4 1 0 9 5 8 9 0 4 1 0 9 5