design and operational modifications to model iv fccus to
TRANSCRIPT

TECHNICAL MEMORANDUM NO. CIT-CDS 94-007 March 7,1994
"Design and Operational Modifications to Model IV FCCUs to Improve Dynamic Perf ormanceN Iftikhar Huq, Manfred Morari and Ronald Sorensen
Control and Dynamical Systems California Institute of Technology
Pasadena, CA 91125

Design and Operational Modifications to Model IV FCCUs to Improve Dynamic Performance
Iftikhar Huq Manfred Morari*
Chemical Engineering, 210-41 California Institute of Technology
Pasadena, CA 91125
Ronald C. Sorensen
Chevron Research and Technology Company 100 Chevron Way
Richmond, CA 94802 - 0627
March 7, 1994
Submitted to AIChE Journal
Abstract
Model IV Fluid Catalytic Cracking Units (FCCUs) differ from other cracking units in that model IV FCCUs do not have slide valves in the catalyst circulation lines to enable direct control of catalyst circulation rate through the unit. Reducing fluctuations in catalyst circulation rate is found to significantly improve closed loop performance of the FCCU. Some design and operational modifications that can be made to model IV FCCUs to improve closed loop performance at the regulatory level based on this insight are modeled and compared. Closed loop performance of a model IV FCCU operated with the weir and standpipe always flooded is examined. The achievable performance is significantly better than that of the standard model IV FCCU. The closed loop performance of the model IV FCCU modified to incorporate slide valves in the catalyst circulation lines is also examined. The performance of the FCCU with slide valves is better than the performance achievable by the FCCU with the weir flooded. It is found that model IV FCCUs are ill-conditioned owing to the use of the weir and standpipe arrangement in the regenerator section. Both the operational and design modifications studied reduce plant ill-conditioning appreciably.
'To whom all correspondence should be addressed: phone (818)395-4186, fax (818)568-8743, e-mail: [email protected]
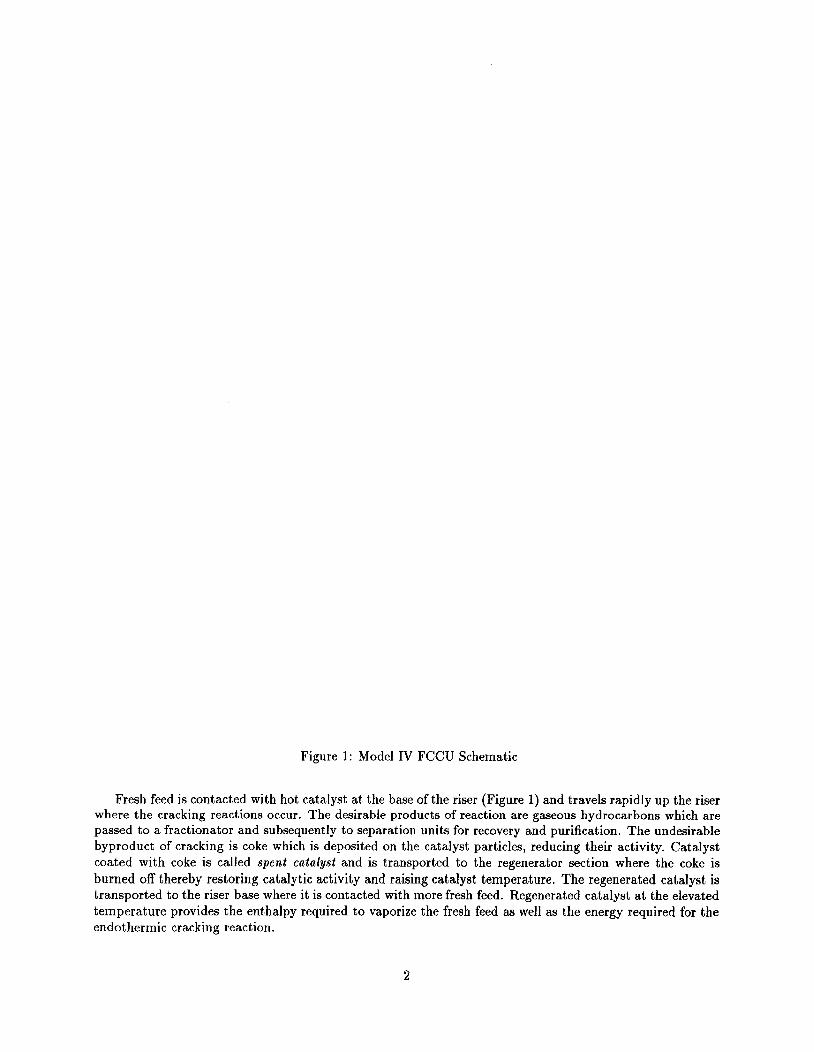
Figure 1: Model IV FCCU Schematic
Fresh feed is contacted with hot catalyst at the base of the riser (Figure 1) and travels rapidly up the riser where the cracking reactions occur. The desirable products of reaction are gaseous hydrocarbons which are passed to a fractionator and subsequently to separation units for recovery and purification. The undesirable byproduct of cracking is coke which is deposited on the catalyst particles, reducing their activity. Catalyst coated with coke is called spent catalyst and is transported to the regenerator section where the coke is burned off thereby restoring catalytic activity and raising catalyst temperature. The regenerated catalyst is transported to the riser base where it is contacted with more fresh feed. Regenerated catalyst at the elevated temperature provides the enthalpy required to vaporize the fresh feed as well as the energy required for the endothermic cracking reaction.
The distinguishing feature of a model IV FCCU is that there is no direct control of catalyst circulation rate between the reactor and regenerator. Only indirect control is possible by varying the driving force for catalyst flow. In this paper we examine both design and operational modifications that can be made to model IV FCCUs to improve closed loop performance. The operational modification studied is the flooding of the weir and standpipe in the regenerator section while the design modification studied is the introduction of slide valves in the catalyst flow U-bends to control directly the catalyst circulation rate through the unit.
Fundamental modeling work on FCCUs has been reported by Lee e t al. [ll], Felipe e t al. [5], Kurihara [lo] and McFarlane et al. [13]. All the models except the one by McFarlane e t al. assume that the FCCU is equipped with slide valves to control catalyst circulation rate. Elnasahie et al. [4] developed a steady state model of a Model IV FCCU and later extended it to include dynamics [3]. Several control studies on FCCUs with slide valves have been reported. A sample of recent control studies on FCCUs include the works by Hovd e t al. [8], Grosdidier et al. [6], Monge et al. [14] and Arbel e t al. [I]. The above list of authors is by no means exhaustive but for continuity of presentation, we will not digress into a more detailed literature survey.
The model by McFarlane et al. [13] was selected for this study since it provides a comprehensive de- scription of both the reactor and regenerator. Although the riser model is very simple, it provides sufficient information for regulatory control studies. Furthermore, the catalyst flow interactions between the reactor and regenerator are accounted for. Catalyst flow interactions between the reactor and regenerator sections are not addressed in any of the other models. This model is currently also used for educational purposes at Lehigh University [9]. While a specific model is used for this study, the conclusions are explained qualitatively on physical grounds. Therefore, the results are believed to be generic to Model IV FCCU operation.
2 Preliminaries
The operating points used for the simulations are tabulated in Appendix A. In order to facilitate easy comparisons of different inputs, outputs and disturbances, the system was made dimensionless as follows:
The scaling factors used to scale the inputs and outputs are tabulated in Appendix A as well. Note that ii, 9, and d are vectors since we have a MIMO system and that at steady state the inputs, disturbances and outputs are all zero vectors. Furthermore y is the output error vector. Each element of the input vector ii is scaled so that all physically implementable manipulated variable inputs are of magnitude less than one. The output error vector is scaled to make each error element equally significant to the process. The modeled disturbances to the system are:
1. d l - variations in ambient temperature
2. d2 - changes in feed coking characteristics resulting from variations in feed quality
3. d3 - pressure fluctuations propagating back from the main fractionator to the reactor section of the FCCU
An additional disturbance often cited in the literature [8, 111 is variations in inlet feed temperature. Here it is assumed that feed temperature is maintained at a pre-specified setpoint by a local temperature controller and is therefore not considered a disturbance to the system.

Variations in ambient temperature affect compressor throughput and therefore the ability to burn off coke deposited on the catalyst particles. High ambient temperatures lead to lower oxygen supply to the regenerator and reduce the amount of coke that can be burnt off (and therefore the fresh feed rate that can be processed). Feed quality refers to the coking characteristics of incoming feed i.e. how much coke will be deposited on the catalyst particles after completion of the cracking reaction. Changes in feed quality are reported to be a significant process disturbance [13, 6, 81 as it directly affects the coke deposition rate on the catalyst and therefore the feed processing rate. A number of process disturbances (including changes in feed quality) eventually affect reactor pressure. Of significance are fluctuations in main fractionator pressure that affect reactor pressure. Changes in main fractionator pressure can arise when vapor flow rate is altered (e.g. as a result of changes in wet gas compressor suction flow rate). Variations in internal vapor and liquid traffic in the main fractionator (due to changes in condenser/reboiler duty) can also lead to changes in main fractionator pressure. In the original model a constant pressure drop between the main fractionator and reactor section of 9.5psi (APjra,) was assumed. Fluctuations in fractionator pressure can be effectively modeled as variations in APfr,,. Pressure disturbances in down-stream recovery units (down-stream from wet gas compressor) can also be effectively modeled as changes in APfra,.
Variations in ambient temperature (which affects compressor throughput) were modeled as ramps with a period of 24 hours. The designed controllers were capable of rejecting disturbances in ambient temperature rapidly. Fluctuations in feed quality (disturbance d2) were modeled as steps because the fresh feed com- position in the feed holdup tank changes rapidly when heavy oil cuts of different compositions are added. Since pressure fluctuations in the reactor are expected to occur on time scales of tens of seconds, the fluctu- ations were modeled as steps. The 'typical' peak deviation assumed for changes in APjra, is tabulated in Appendix A. Each disturbance is scaled by its maximum expected deviation from steady state. Thus any disturbance input vector element of magnitude one represents the largest (smallest) expected disturbance. Nominal values for the disturbances and corresponding scaling factors are tabulated in Appendix A.
In this paper both design and operational modifications to model IV FCCUs are studied. For notational convenience different modifications to the original model are referred to as model B and model C (this notation will be explicitly stated as required). Model A refers to the original model IV FCCU. To compare the different models, the following control schemes were considered:
Notation I Controlled Variables I Manipulated Variables ". I - - I ., -
The output variables are the same for all control schemes. Maintaining riser temperature (T,) at a pre- determined setpoint is critical to overall process economics as it strongly affects product yield. It is necessary to maintain flue gas oxygen concentration (C02,sg) above a pre-specified minimum to prevent operation in the transitional zone between total combustion and partial combustion modes which is reported to be unstable [6]. Lift air supply (determined by T/laft) is always a manipulated variable as it is the only source of additional air supply to the regenerator (the combustion air blower is operated at full capacity). Other available manipulated variables such as fresh feed rate (F3) , flue gas valve opening (h4) and feed temperature (T2) are examined in conjunction with Ksft. There are several other manipulated variables and many other possible output variables and the most common of these will be discussed.
SII I CoZ,sg, Tr SIII I CoZ,sg, Tr
Combustion air supply is sometimes used as a manipulated variable. However, for maximum economic benefit of the investment made in the blower, the combustion air blower is operated close to maximum capacity. Therefore, changing the compressor speed does not result in appreciable changes in air flow rate. Combustion air supply is thus not used as a manipulated variable. This is consistent with industrial practice where the combustion air blower is operated close to maximum capacity with the blower speed regulator operated manually. Wet gas compressor throughput is often used to regulate reactor pressure. Since it was intended to examine the effect of variations in reactor pressure on overall FCCU operation, the wet gas
Table 1 - Notation for Different Control Schemes
Kift, K4
Gi j t , T2 t

compressor throughput was not used as a manipulated variable. The wet gas compressor is also operated near maximum capacity.
Regenerator dense bed temperature, regenerator cyclone temperature and flue gas CO concentration are sometimes used as controlled variables [ l l , 8, 131. Owing to the strong interaction between the reactor and regenerator sections, regenerator temperature and reactor riser temperature are closely related. Recall that riser temperature influences product yield and distribution and therefore plant economics. Regenerator temperature responds relatively slowly to process changes owing to the large thermal inertia of the regenerator section [8]. Therefore riser temperature is generally the controlled variable. Similar arguments apply to flue gas C O and O2 concentrations. Low concentrations of CO (ppm range) or excess 0 2 in the flue gas line indicates total combustion operation. However, energy is required to provide 0 2 (air) and it is economically beneficial to have just enough excess of 0 2 to ensure operation in the total combustion mode. Controlling C O concentration in the flue gas line would not guarantee minimal excess O2 in the flue gas line. Therefore 0 2 concentration is the controlled variable.
In total combustion operation, there is relatively little afterburn in the regenerator catalyst disengag- ing zone and cyclone temperatures are well below the metallurgical limits. This is not the case for partial combustion operation where afterburn can raise cyclone temperatures close to the metallurgical limits. In partial combustion mode, cyclone temperatures must be controlled to prevent meltdowns. In total combus- tion mode, the cyclone temperatures are only monitored to ensure safe operation. It is assumed that cyclone temperatures are well below the metallurgical limit since the FCCU is operated in total combustion mode.
2.1 Uncertainty and Performance Description
Our analysis is based on linear models derived by linearizing the nonlinear model around the operating point tabulated in Appendix A. Open loop step responses to selected disturbances and manipulated variables for the linear and nonlinear models are compared in Appendix A. The state space models for several selected control schemes are listed in Appendix B. The frequency range of interest was taken to be 10-5rad/s to 10-2rad/s which corresponds to process variations on time scales of minutes to hours.
The model adopted for this study is only an approximate description of the actual FCCU process. In practice, model uncertainty is always present. An uncertainty model based on heuristic arguments has been adopted for this study and will be described shortly. An important aspect of this study is examining and comparing the best achievable closed loop performance of different control schemes for the different FCCU designs. The achievable closed loop performance depends on the controller structure (single loop, multivariable) as well as controller tuning.
It is most common to use single loop PI(D) controllers at the regulatory level. However, the selection of controller tuning parameters that would guarantee 'optimal' performance in some sense using these single loop controllers is not obvious. The situation is even more complicated if acceptable performance and stability are required in the presence of model uncertainty. Furthermore, using PI(D) controllers restricts controller structure. The best achievable performance with any controller would be just as good or better than that achievable with PI(D) controllers. The desired controller should therefore have no restrictions on controller structure and explicitly account for model uncertainty during synthesis. yoptimal controllers satisfy both these requirements [15]. The achievable closed loop robust performance in the presence of model uncertainty is quantified using the structured singular value (commonly referred to as p). A significant advantage of using the structured singular value is that robust stability and robust performance can be addressed in a rigorous and consistent manner.
Since our control objective is effective disturbance rejection, the p-optimal controllers were designed to minimize the oo-norm of the weighted sensitivity function. Thus for each control scheme an optimal controller was synthesized and the closed loop performance achievable with this controller examined. The controllers were synthesized using software availablein the p - Analysis and Synthesis Toolbox [2] in MATLAB. Excellent descriptions of the calculation, interpretation and use of p are given in [2,15]. A reasonable representation of
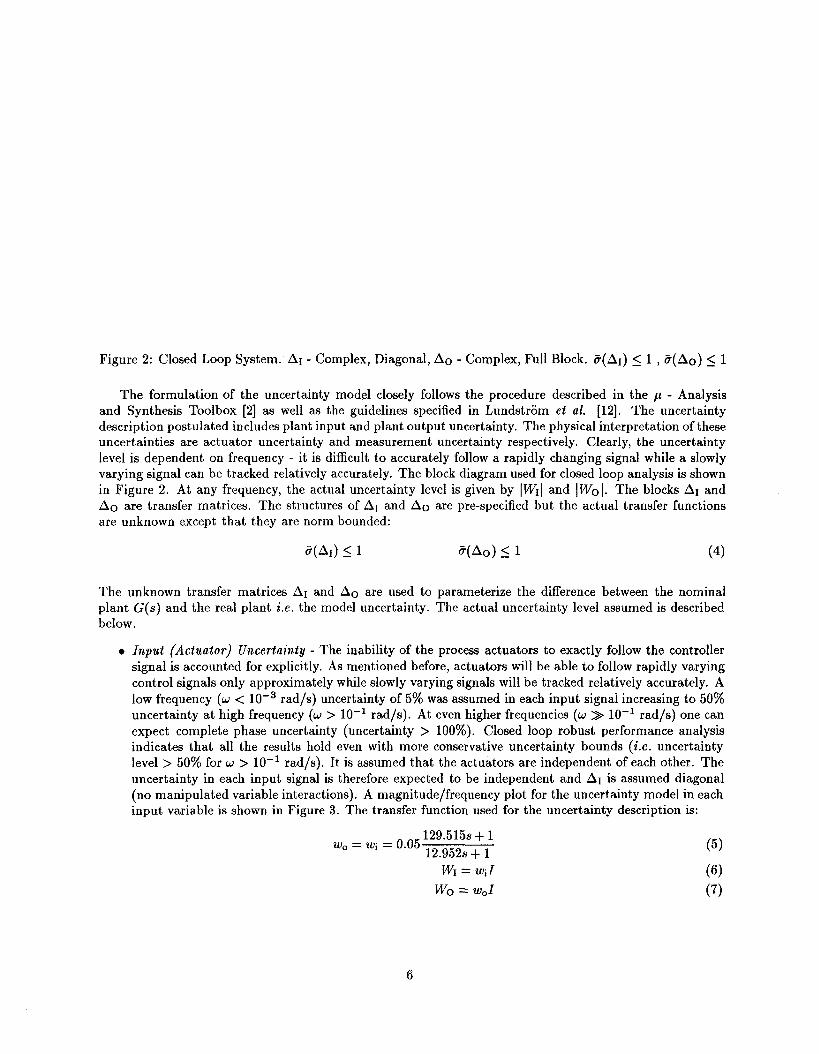
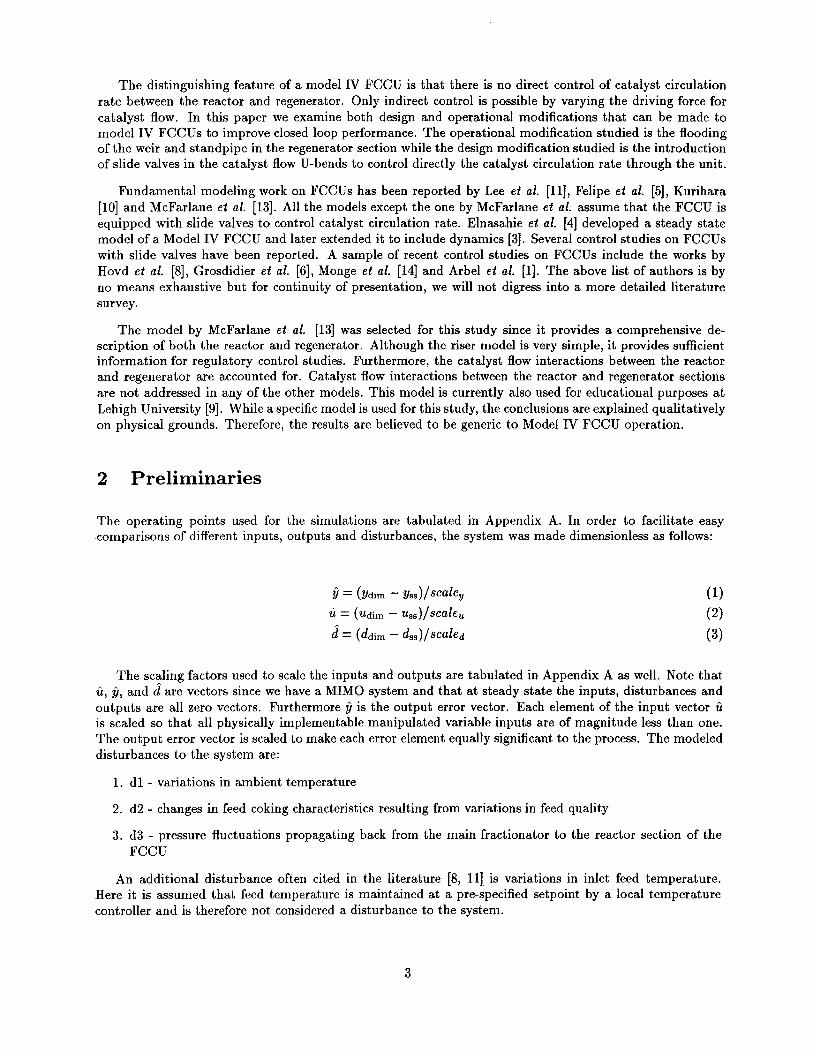
Figure 2: Closed Loop System. AI - Complex, Diagonal, A. - Complex, Full Block. @(AI) 5 1 , @(Ao) < - 1
The formulation of the uncertainty model closely follows the procedure described in the p - Analysis and Synthesis Toolbox [2] as well as the guidelines specified in Lundstrom et al. [12]. The uncertainty description postulated includes plant input and plant output uncertainty. The physical interpretation of these uncertainties are actuator uncertainty and measurement uncertainty respectively. Clearly, the uncertainty level is dependent on frequency - it is difficult to accurately follow a rapidly changing signal while a slowly varying signal can be tracked relatively accurately. The block diagram used for closed loop analysis is shown in Figure 2. At any frequency, the actual uncertainty level is given by lWIl and IWol. The blocks AI and A. are transfer matrices. The structures of AI and A0 are pre-specified but the actual transfer functions are unknown except that they are norm bounded:
The unknown transfer matrices AI and A. are used to parameterize the difference between the nominal plant G(s) and the real plant i . e . the model uncertainty. The actual uncertainty level assumed is described below.
Input (Actuator) Uncertainly - The inability of the process actuators to exactly follow the controller signal is accounted for explicitly. As mentioned before, actuators will be able to follow rapidly varying control signals only approximately while slowly varying signals will be tracked relatively accurately. A low frequency (w < rad/s) uncertainty of 5% was assumed in each input signal increasing to 50% uncertainty at high frequency (w > lo-' rad/s). At even higher frequencies (w >> 10-I rad/s) one can expect complete phase uncertainty (uncertainty > 100%). Closed loop robust performance analysis indicates that all the results hold even with more conservative uncertainty bounds ( i .e . uncertainty level > 50% for w > 10-I rad/s). It is assumed that the actuators are independent of each other. The uncertainty in each input signal is therefore expected to be independent and AI is assumed diagonal (no manipulated variable interactions). A magnitudelfrequency plot for the uncertainty model in each input variable is shown in Figure 3. The transfer function used for the uncertainty description is:

,, Uncertainty Weight Performance Weight
lo' 7
Figure 3: Uncertainty and Performance Specifications. wp = 0.1 rad/s.
Output (Measurement) Uncertainty - Owing to sensor limitations, the actual plant output may differ from what is measured. Uncertainty in each output signal was modeled in the same manner as input uncertainty and Wo is assumed diagonal. It is more difficult to ascribe output uncertainty to sensor error only. Other factors including unmodeled plant dynamics may also contribute to output uncer- tainty. Such possible interactions between different output signals are accounted for by making A. full block.
Performance Specification - The control objective for all cases in this paper is effective disturbance rejection. The performance requirements are:
1. high frequency disturbance amplification by a factor of at most 2.5
2. steady state offset of at most 0.5 %
The transfer function for the performance weights is :
The performance requirement for each output variable was assumed to be the same. This is justified since the output variables were scaled so that any output error was equally significant. A magni- tudelfrequency plot for the performance weight is plotted in Figure 3. The 'corner frequency' wp (eq 8) is used as an adjustable parameter to quantify the best achievable performance for a given control scheme. Higher wp (Figure 3) implies faster closed loop response [12].
The presence of right half plane transmission zeros (RHPT zeros) within the desired bandwidth will limit achievable closed loop performance of the process regardless of the controller type used [7, 161. Several of the control structures formulated have significant RHPT zeros i.e. RHPT zeros within the desired bandwidth which will limit achievable closed loop performance. The model by McFarlane et al. indicates that the model IV FCCU is ill-conditioned i .e . the plant gain is strongly dependent on the input direction. Ill-conditioned plants are characterized by strong directionality i .e. inputs in the direction of high plant gain are strongly amplified while inputs in the direction of low plant gain are not [15, 181.
3 Analysis of Model A (Original Model IV FCCU)
3.1 Open Loop Analysis of Model A
Figure 4 is a plot of the maximum and minimum singular values of the plants corresponding to control schemes SI, SII and SIII as a function of frequency. The maximum singular value of the disturbance transfer function matrix (i?(Gd)) is also plotted. Note that the maximum plant gain for scheme SI is smaller than
Model A Control Schemes Model A Control Schemes
frequency (radfs) frequency (radls)
Figure 4: Frequency Response Plots For Disturbance Model and Schemes SI, SII & SIII, Model A
the maximum disturbance gain suggesting that the available control action might be insufficient to reject expected disturbances.
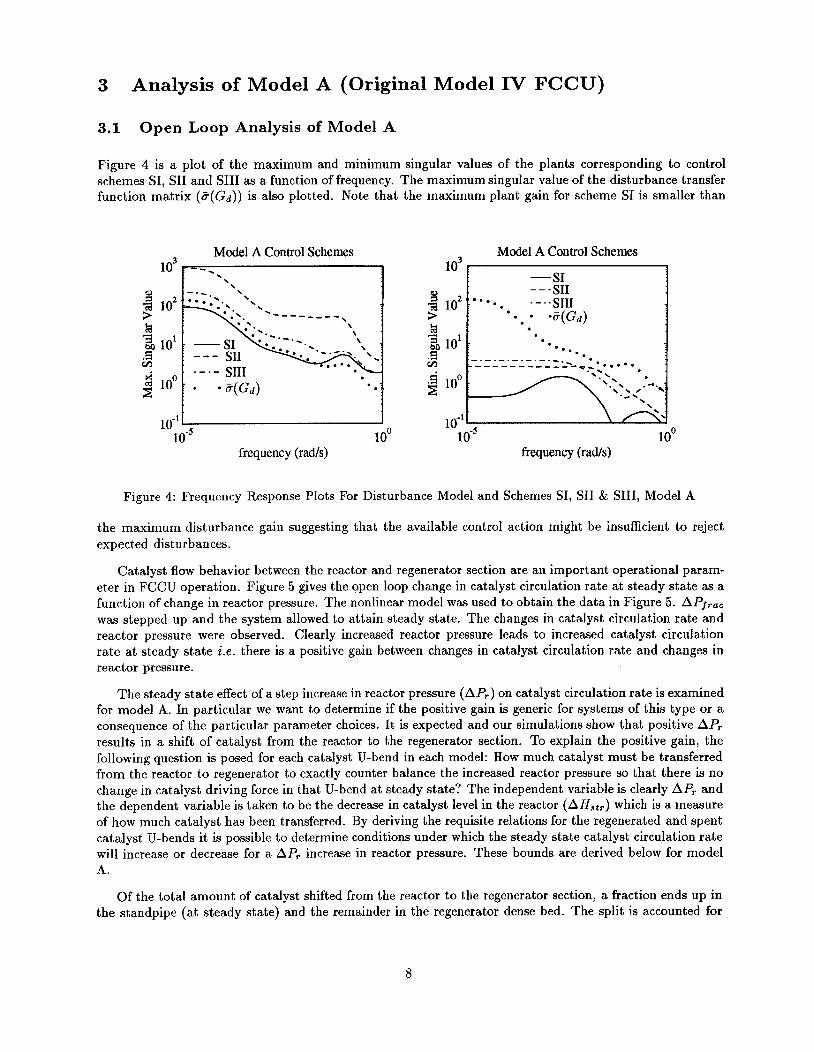
Catalyst flow behavior between the reactor and regenerator section are an important operational param- eter in FCCU operation. Figure 5 gives the open loop change in catalyst circulation rate at steady state as a function of change in reactor pressure. The nonlinear model was used to obtain the data in Figure 5. AP!,,, was stepped up and the system allowed to attain steady state. The changes in catalyst circulation rate and reactor pressure were observed. Clearly increased reactor pressure leads to increased catalyst circulation rate at steady state i .e . there is a positive gain between changes in catalyst circulation rate and changes in reactor pressure.
The steady state effect of a step increase in reactor pressure (AP,) on catalyst circulation rate is examined for model A. In particular we want to determine if the positive gain is generic for systems of this type or a consequence of the particular parameter choices. It is expected and our simulations show that positive A19, results in a shift of catalyst from the reactor to the regenerator section. To explain the positive gain, the following question is posed for each catalyst U-bend in each model: How much catalyst must be transferred from the reactor to regenerator to exactly counter balance the increased reactor pressure so that there is no change in catalyst driving force in that U-bend at steady state? The independent variable is clearly AF, and the dependent variable is taken to be the decrease in catalyst level in the reactor (AH,t,) which is a measure of how much catalyst has been transferred. By deriving the requisite relations for the regenerated and spent catalyst U-bends it is possible to determine conditions under which the steady state catalyst circulation rate will increase or decrease for a AP, increase in reactor pressure. These bounds are derived below for model A.
Of the total amount of catalyst shifted from the reactor to the regenerator section, a fraction ends up in the standpipe (at steady state) and the remainder in the regenerator dense bed. The split is accounted for

model A
SS Increase in Reactor Pressure (psia)
Figure 5: Model A Dependence of Catalyst Circulation Rate on Changes in Reactor Pressure (AP,) at Steady State
by defining a parameter a as follows: A Wsp a=- AWstr
The condition for net increase in regenerated catalyst flow rate at steady state for step increase in AP, is:
The condition for net increase in spent catalyst flow rate at steady state for a step increase in APr is:
Therefore bounds on AHstr/APr for which there will be a net increase in catalyst circulation rate at steady state for an increase in reactor pressure are:
In model A a is close to one for all observed cases (cr > 0.9 typically). Thus after a process upset essentially all the catalyst shifted from the reactor to the regenerator section ends up in the standpipe once the system settles. Substituting a = 1 in eq. 13 yields:
Note that for Asp < ASt, (as in Model A) there will be an increase in catalyst circulation rate at steady state for an increase in reactor pressure.
The steady state plant condition numbers as well as any RHPT zeros for model A schemes SI, SII and SIII are summarized in Table 2. All three schemes are ill-conditioned indicating that while nominal performance and robust stability might be satisfied, robust performance could be unsatisfactory [15, 181.
Table 2 - Steady state plant condition number and location of RHPT zero for Model A Control Schemes
9
Scheme SI SII SIII
Condition # 207 363 59.4
RHPT zero none 0.273 none

3.2 Closed Loop Analysis of Model A
Figure 6 is a plot of the robust performance p, (pRp) for model A control schemes SI, SII and SIII. For all three cases p ~ p > 1 over the frequency range of interest indicating that there are allowable 'perturbed plants' for which the designed controllers would be unable to provide the requisite performance. However in all three cases, robust stability was achieved (plot not shown) and the closed loop system would be stable for all allowable perturbations.
0 L 10.' lo-z
frequency (rad/s)
Figure 6: Robust Performance Comparison for Model A, schemes SI, SII & SIII, wp = 0.01
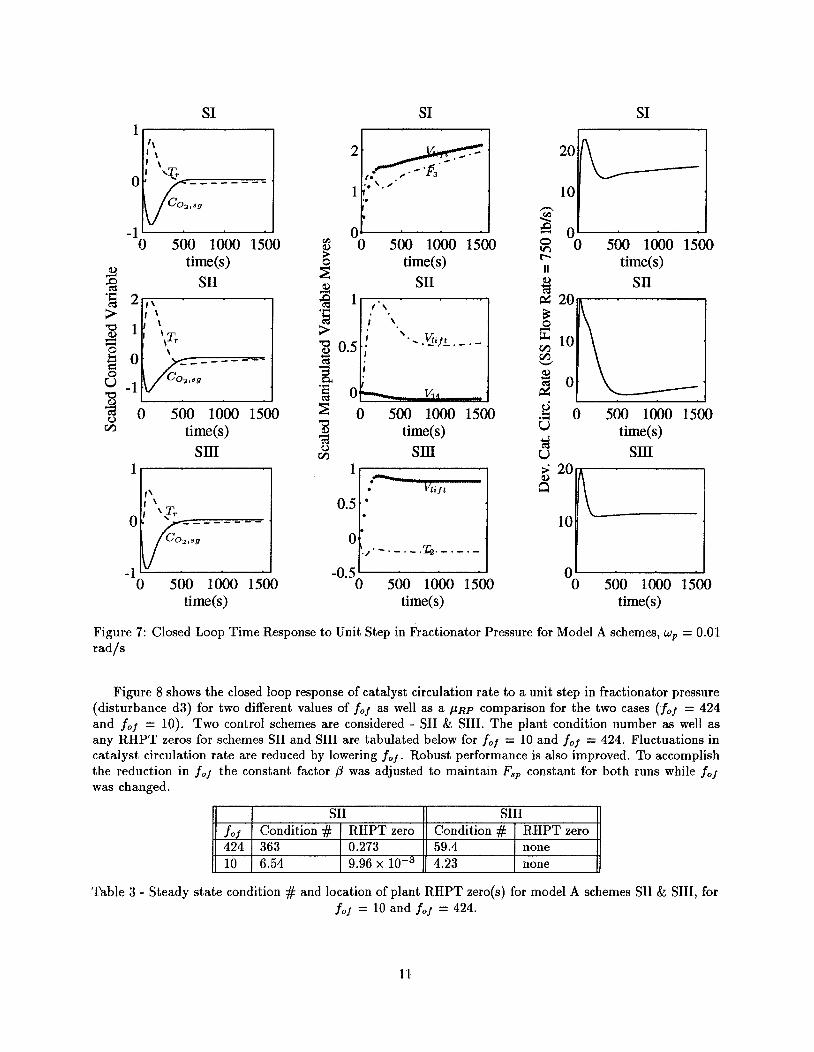
The time responses of model A schemes (nominal plants) to a unit step in AP!,,, (disturbance d3) are shown in Figure 7. Pressure upsets in down stream units propagating back to the FCC section are the most severe disturbances for this system. The other significant disturbance is variations in feed quality, but this disturbance eventually affects reactor pressure as well. In practice it is desirable to reject disturbances within about twenty minutes from the onset and therefore wp = 0.01 for all cases considered in model A. The controlled variables (Figure 7) display relatively large deviations from their steady state values during the disturbance transient period. In addition it is not possible to reject a unit step disturbance in d3 using scheme SI (more control action required than is available). Note that the transient deviations of the controlled variables from steady state are largest for scheme SII (largest p ~ p over frequency) and smallest for scheme SIII (smallest p ~ p over frequency).
Catalyst circulation rates are also observed to undergo large fluctuations (Figure 7). It is shown later that in open loop the deviation of output variables from steady state is directly related to the deviation of catalyst flow rate from steady state. Large fluctuations in controlled variables and catalyst flow rate are expected for model A owing to the use of an overflow weir and standpipe setup in the regenerator section which serves to convey regenerated catalyst to the riser. Regenerator dense bed catalyst is fluidized by passage of combustion air through it and flows over the weir into the standpipe (Figure 1). Since catalyst particles are small and the bed is fluidized, slight variations in regenerator bed height cause relatively large variations in catalyst flow rate over the weir. Furthermore, since the cross-sectional area of the standpipe is small compared to the cross-sectional area of the regenerator (7ft2 vs 590 ft2) small variations in regenerator bed height will result in significant variations in standpipe inventory level and therefore regenerated catalyst flow rate. The equation governing catalyst flow over the weir is given by:
where fof is the overflow factor. For a given standpipe area, fof measures sensitivity of catalyst flow over the weir to changes in dense bed height. In the original problem formulation, this factor was 424. Small changes in dense bed height therefore result in relatively large changes in catalyst flow over the weir - leading to large changes in regenerated catalyst flow rate to the riser. Lowering fof would be expected to reduce changes in flow rate over the weir and minimize variations in catalyst flow rate.
time(s) 24 s SII SII
time(s) SII
Figure 7: Closed Loop Time Response to Unit Step in Fractionator Pressure for Model A schemes, wp = 0.01 rad/s
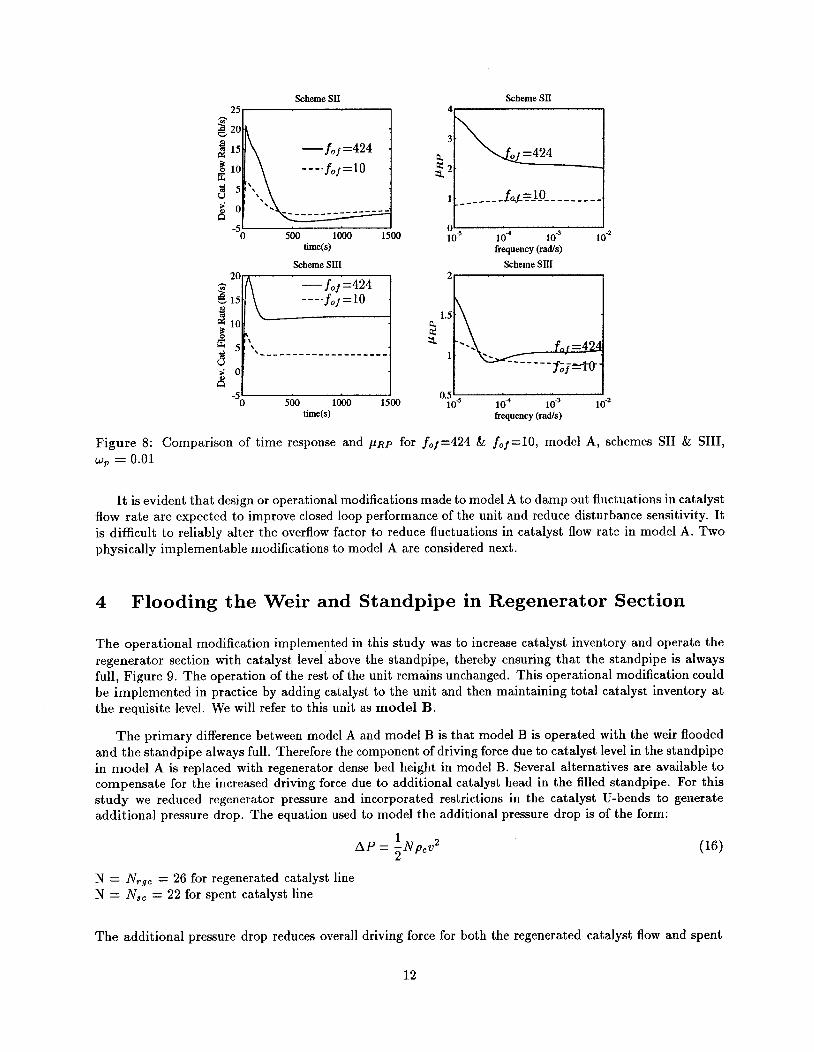
Figure 8 shows the closed loop response of catalyst circulation rate to a unit step in fractionator pressure (disturbance d3) for two different values of fof as well as a p ~ p comparison for the two cases (fof = 424 and fof = 10). Two control schemes are considered - SII & SIII. The plant condition number as well as any RHPT zeros for schemes SII and SIII are tabulated below for fof = 10 and fof = 424. Fluctuations in catalyst circulation rate are reduced by lowering fof. Robust performance is also improved. To accomplish the reduction in fof the constant factor was adjusted to maintain F,, constant for both runs while fof was changed.
Table 3 - Steady state condition # and location of plant RHPT zero(s) for model A schemes SII & SIII, for fof = 10 and fof = 424.
11
fof
424 10
SII Condition # 363 6.54
J
RHPT zero 0.273 9.96 x
SIII Condition # 59.4 4.23
RHPT zero none none
Scheme SII Scheme SII
time($
Scheme SIII - 20 -r? - fof =424 % 15. ---.f -10 . s o f -
2 10 $ ti '--------------------
5 0 n
500 loo0 1500
frequency (radls) Scheme SJII
time(s) frequency (radls)
Figure 8: Comparison of time response and p ~ p for fof=424 & f o f = l O , model A, schemes SII & SIII, w, = 0.01
It is evident that design or operational modifications made to model A to damp out fluctuations in catalyst flow rate are expected to improve closed loop performance of the unit and reduce disturbance sensitivity. It is difficult to reliably alter the overflow factor to reduce fluctuations in catalyst flow sate in model A. Two physically implementable modifications to model A are considered next.
4 Flooding the Weir and Standpipe in Regenerator Section
The operational modification implemented in this study was to increase catalyst inventory and operate the regenerator section with catalyst level above the standpipe, thereby ensuring that the standpipe is always full, Figure 9. The operation of the rest of the unit remains unchanged. This operational modification could be implemented in practice by adding catalyst to the unit and then maintaining total catalyst inventory a t the requisite level. We will refer to this unit as model B.
The primary difference between model A and model B is that model B is operated with the weir flooded and the standpipe always full. Therefore the component of driving force due to catalyst level in the standpipe in model A is replaced with regenerator dense bed height in model B. Several alternatives are available to compensate for the increased driving force due to additional catalyst head in the filled standpipe. For this study we reduced regenerator pressure and incorporated restrictions in the catalyst U-bends to generate additional pressure drop. The equation used to model the additional pressure drop is of the form:
1 A P = - N ~ , V ~
2
N = NrgC = 26 for regenerated catalyst line N = N,, = 22 for spent catalyst line
The additional pressure drop reduces overall driving force for both the regenerated catalyst flow and spent
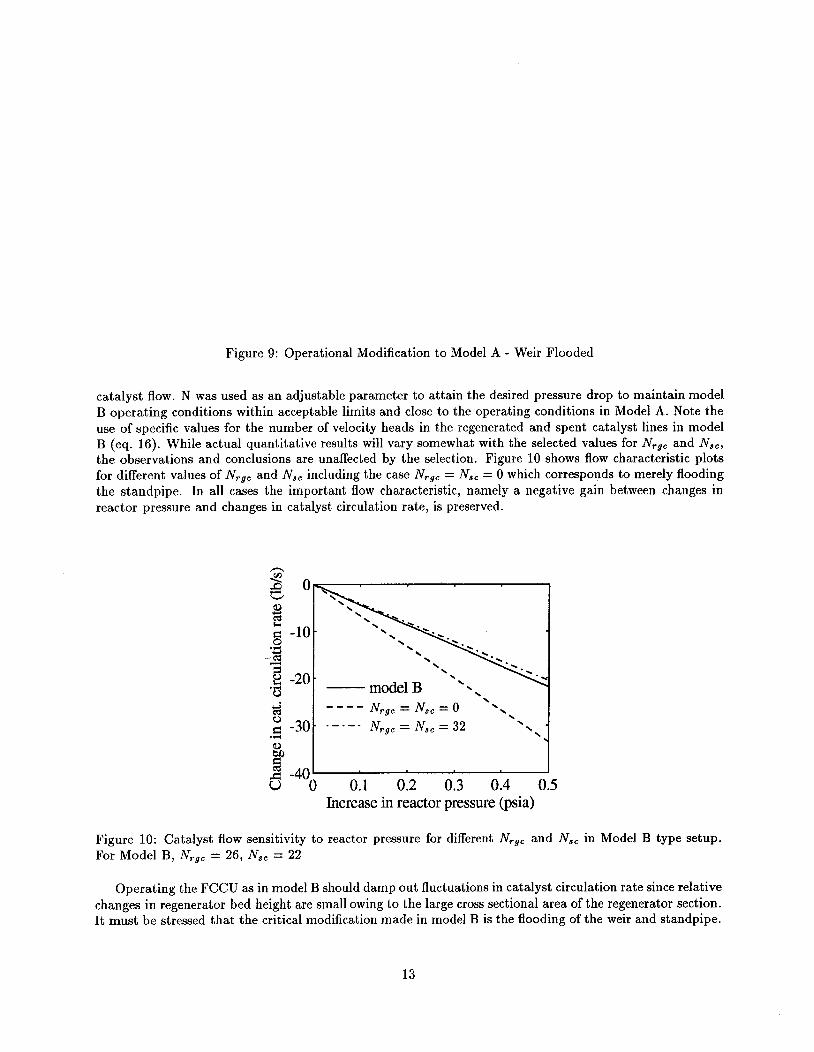
Figure 9: Operational Modification to Model A - Weir Flooded
catalyst flow. N was used as an adjustable parameter to attain the desired pressure drop to maintain model B operating conditions within acceptable limits and close to the operating conditions in Model A. Note the use of specific values for the number of velocity heads in the regenerated and spent catalyst lines in model B (eq. 16). While actual quantitative results will vary somewhat with the selected values for Nrgc and N,,, the observations and conclusions are unaffected by the selection. Figure 10 shows flow characteristic plots for different values of NrgC and N,, including the case N,.,, = Nsc = 0 which corresponds to merely flooding the standpipe. In all cases the important flow characteristic, namely a negative gain between changes in reactor pressure and changes in catalyst circulation rate, is preserved.
Increase in reactor pressure (psia)
Figure 10: Catalyst flow sensitivity to reactor pressure for different Nrgc and N,, in Model B type setup. For Model B, NrgC = 26, N,, = 22
Operating the FCCU as in model B should damp out fluctuations in catalyst circulation rate since relative changes in regenerator bed height are small owing to the large cross sectional area of the regenerator section. It must be stressed that the critical modification made in model B is the flooding of the weir and standpipe.

4.1 Open Loop Analysis of Model B
Figure 11 is a plot of the maximum and minimum singular values of the control schemes SI, SII and SIII as a function of frequency. The maximum singular value of the disturbance transfer function matrix is also plotted. Note that as in model A the maximum plant gain for scheme SI is smaller than the maximum
Model B Control Schemes lo2
Model B Control Schemes lo2 1 - S1 4
frequency (rad/s) frequency (rads)
0
4 1 0
8 - 1 84 .a * lo0
f4 I 0-'
Figure 11: Frequency Response Plots For Disturbance Model and Schemes SI, SII & SIII, Model B
- - - SII . - - - SIII
; 8(Gd) I..........**'. ------- , . m ' - - ~ ? , C ,-- *. : .-.-.-. -.---:-- \ <\
.
disturbance gain suggesting possible manipulated variable constraint problems.
1 o - ~ lo0
Catalyst flow characteristics for model B are different from those in model A. In model B increased reactor pressure results in decreased catalyst circulation rate at steady state i . e . negative gain between changes in catalyst flow rate and changes in reactor pressure (Figure 12). Figure 12 was obtained in the same manner as Figure 5.
model B
Increase in Reactor Pressure (psia)*100
Figure 12: Model B Dependence of Catalyst Circulation Rate on Changes in Reactor Pressure at Steady State
Bounds similar to those for model A regarding the dependence of changes in catalyst circulation rate on changes in reactor pressure are derived for model B. Note that the parameter cu described for model A does not apply to model B. To decrease regenerated catalyst flow rate at steady state for a step increase in APT we reauire:
AH8tr Areg 1 <-- APT Astr PC
To decrease spent catalyst flow rate at steady state for a step increase in APr we require:
AHstr > Areg - 1 APr Areg + Astr PC
Combining these two conditions gives bounds on AHstr/APr for which there will be a decrease in catalyst flow rate for an increase in reactor pressure:
Areg -<-<-- 1 AHstr Areg 1 Areg + Astr PC APr Astr pc
Clearly an increase in reactor pressure cannot possibly lead to an increase in catalyst circulation rate at steady state for model B regardless of the cross-sectional areas of any of the units (Asp,Areg,Astr). The bounds for model A which would result in a decrease in catalyst circulation rate are given by eq 13
Areg 1 AHstr 1 Asp 1 -< - < Areg + (1 - a)Astr PC APr a Astr PC
By suitable interpretation of a (for model B) the bounds for model A and model B can be shown to be similar. Note that Asp in model A must be replaced by Areg in model B.
The steady state plant condition numbers as well as any RHPT zeros for model B schemes SI, SII and SIII are summarized in Table 4.
Table 4 - Steady state plant condition number and location of RHPT zero for Model B Control Schemes
The steady state plant condition numbers for model B schemes are much lower than the corresponding values for model A schemes. Control scheme SII has a RHPT zero outside the frequency range of interest and should not limit the achievable performance. However schemes SI and SIII have RHPT zeros which are within the frequency range of operation and limit the achievable performance. p ~ p 21 4 for scheme SI and p ~ p 7 for scheme SIII. In rejecting unit step disturbances, large overshoots in controlled variables were observed for schemes SI and SIII compared to scheme SII. The plots are not shown for brevity.
RHPT zero 2.86 x 1 .858f i l l . 1 1.762 x
Scheme SI SII SIII
4.2 Closed Loop Analysis For Model B
Condition # 4.22 10.2 3.51
Figure 13 is a p ~ p plot for model A scheme SII and model B scheme SII for identical uncertainty and performance specifications. Note that wp = 0.01 for both cases although model B should be expected to have faster closed loop response. A p-controller was designed for model B that guaranteed robust performance while the p-controller for model A could not guarantee desired performance given the expected uncertainties, disturbances and performance requirements.
Figure 14 shows the closed loop response of model B, control scheme SII to a unit step disturbance in fractionator pressure. Compared to the closed loop response for model A, scheme SII (Figure 7) the fluctuations in catalyst flow rate as well as controlled variable deviations from their steady state values during the process transients are significantly reduced. Model B response is also faster than Model A response. A significant improvement in closed loop robust performance of the model IV FCCU is attainable simply by operating the unit as in model B. Physical justification for the improved performance of model B compared to model A will be discussed next in the context of the different flow characteristics of models A and B.

Control Scheme SII __I
model B '1 Figure 13: Robust Performance Comparison for Model A & Model B. Identical Uncertainty & Performance Specs. wp = 0.01
5 Comparison of Flow Characteristics for Models A and B
Figure 15 shows steady state changes in catalyst flow rate as a function of increase in reactor pressure for models A and B. In addition to reactor pressure fluctuations, temperature variations in the reactor and regenerator also affect catalyst circulation rates as follows:
Regenerator - variations in regenerator dense bed temperature affect regenerator gas pressure. However regenerator temperature does not change appreciably under normal conditions (f 15O F) and segener- ator gas volume is large. Regenerator gas pressure changes are thus small and are ignored.
Reactor riser - temperature variations in the reactor riser affect wet gas production rate which in turn affects reactor pressure.
Thus reactor temperature has the most significant effect on catalyst circulation rate. We show that due to the effect of temperature changes on catalyst circulation rate it is desirable to have a decrease in catalyst circulation rate at steady state for an increase in reactor pressure (negative gain between reactor pressure changes and catalyst circulation rate changes).
Suppose an FCCU such as model A where there is a positive gain between reactor pressure and catalyst circulation rate is subjected to a disturbance which increases reactor pressure. Catalyst flow rate increases, elevating riser temperature. Increased riser temperature results in higher wet gas production rate and yet higher reactor pressure. Steady state is reached when the net increase in driving force (due to pressure and catalyst head) is balanced by the additional pressure drop due to increased catalyst circulation rate. The effect of the disturbance is therefore amplified for FCCUs with positive gain between changes in reactor pressure and catalyst circulation rate.
The argument can be reversed for a setup like model B with a negative gain between changes in reactor pressure and changes in catalyst circulation rate. In model B the net effect of disturbances is reduced. This phenomenon is shown in Figure 16a where the actual reactor pressure change at steady state is plotted as a function of change in APfraC. The solid line is the expected reactor pressure change (APfrac) in the absence of any other effects. The actual reactor pressure changes are larger than expected for model A and lower than expected for model B as predicted. Figure 16b shows the corresponding steady state change in catalyst circulation rate. For each model the change in catalyst circulation rate is plotted as a function of the change in APfrac when temperature effects are ignored and when temperature effects are taken into consideration. Note that for model A the increase in catalyst circulation rate for the actual process operation is much

Model B, Scheme SII SII
Figure 14: Closed Loop Time Response of Model B, scheme SII to a Unit Step in Apt,,,. up = 0.01
larger than if temperature effects were ignored - showing that the effect of the disturbance is amplified in model A. For model B the absolute change in catalyst circulation rate is lower in actual operation than when temperature effects are ignored.
Note from Figure 15 that for a given increase in reactor pressure, the absolute change in catalyst circula- tion rate is essentially the same for models A and B. Furthermore, the changes in catalyst circulation rate are proportional to changes in reactor pressure for both models. Figure 16a shows that there are larger changes in reactor pressure for model A than model B for identical disturbances (APf, , , ) to the systems. Thus if one could independently control reactor pressure in model A and keep variation in reactor pressure small, then the fluctuations in catalyst circulation rates would be reduced for model A. It is common practice in industry to control reactor pressure by manipulating the wet gas compressor throughput [8, 111. Our quantitative arguments support this practice.
Important controlled variables like riser temperature and flue gas Oz concentration are directly related to catalyst circulation rate. Changes in circulation rates lead to proportional changes in controlled variables (Figure 17). Increased catalyst flow for model A results in higher coke transport rate to the regenerator which consumes additional O2 from the air supply and Co,,,g decreases in the absence of any corrective action. Reactor temperature rises with increased regenerator temperature. Since catalyst circulation rate is lower for model B there is less coke being transported to the regenerator and less Oz being consumed in combustion and Co,,,g goes up. Reactor temperature decreases with regenerator temperature.
5.1 FCCU Design Objective
From the discussions in the last section the following design guidelines can be deduced so that FCCUs have low disturbance sensitivity. Ideally there should be no variations in catalyst circulation rate in the face of disturbances. In practice the objectives should be:
1. Design the FCCU so that the gain between changes in reactor pressure and changes in catalyst circu- lation rate at steady state is negative.
2. Design the FCCU flow system so that only small variations in catalyst flow rate occur when subjected to disturbances.

Figure 15: Steady state variation in catalyst flow rate with increase in reactor pressure (nonlinear models)
1 2 3 4 5 "0 1 2 3 4 5 XXXXXXXXXXXXXXXXXXX XXXXXXXXXXXXXXXXXXX
a b
Figure 16: Effect of Change in APf,,, on Models A & B (nonlinear models)
expected increase . 4 '
.-.-. model A 0 .
0 . 0
---- modelB ,.*' 0 - /. /.
/
C' C /.
/
/I
/
I' - ______-- - - - - - - - - - -
, 25 rn \ D G Q CI
8 .* 10- a'
cd 0 0 5- .*
2 8 -<
4 ,
4 0 .r
20.- A, ignoring temp. , , I' 0
15.---- A, temp. ef[ecf ' 0
0 0
0 , .-.-. 0 B, ignoring temp:
/ I . . . . . .
/ / /
B, temp. effect .
oi-.-- --.-*-..--.-..................: - . - - - - - . - . - ._ .___.

Change in Cat. Circulation Rate (lbfs) Change in Cat. Circ. Rate (lb/s)
h -e Model A Model B 0 3 5 - 0 0
8 0.3 3 # 22 V
0 - m 0
a2 0 d ' - ~ , V 3 0.2. z 0 . 0.1 - C)
0 - 0
Figure 17: Relation between Controlled Vars. and Changes in Catalyst Circ. Rate (nonlinear models)
0 0 -0.1 .r(
.r( 8 -0.2. C
Most FCCUs have slide valves installed in the catalyst circulation lines to actively control catalyst circulation rate. The improvement in achievable performance when slide valves are installed in the catalyst U-bends of model B is now compared to the achievable performance of model B.
0
# 0
# - d 0
0 T'00 0
0 - d
6 Installing Control Slide Valves in Catalyst Flow Lines
-0.3 -1.5 -1 -0.5 0
The main objective of using control slide valves in catalyst circulation lines is to control catalyst flow rates but these are not available in model A or model B except for emergency closure in the event of catalyst flow reversal. Model IV FCCUs are sometimes refitted to incorporate slide valves that can be used to control catalyst circulation rate between the reactor and regenerator. This design modification was modeled and studied. The slide valve model used is described in detail in Appendix C. Slide valves were introduced into both the regenerated catalyst line and the spent catalyst line and were nominally 50% open. To regain some of the pressure drop across the slide valves it was necessary to implement the following design modifications as well, Figure 18:
1. fresh feed inlet point was lowered from 124.5 ft to 118 ft
2. lift air inlet to standpipe was lowered from 134 ft to 98 ft
3. length of lift pipe was increased from 34 ft to 70 ft
4. J-bends were introduced to assist in feed oil and lift air entry
5. overall catalyst inventory was raised so that catalyst level in the regenerator was higher than the weir. Thus the weir was flooded and standpipe was operated so that is was always full (dense bed height = 19.7 f t ) [this is an identical situation to model B].
The last modification was necessary since variations in pressure drop across the regenerated catalyst line result in large fluctuations in catalyst levels in the standpipe leading to occasional standpipe overflow. Such an overflow would result in significant process disturbances since process dynamics when the standpipe is not flooded and when it is flooded are considerably different. We will refer to the original model IV FCCU modified to incorporate slide valves and including modifications (1) - (5) above as Model C. Model C has 2 additional manipulated variables - slide valve opening on regenerated and spent catalyst lines. The following additional control scheme will therefore be considered:
Figure 18: Design Modification to Model A - Slide Valves in Catalyst Flow Lines
Table 5 - Additional Control scheme for Model C
6.1 Open Loop Analysis of Model C
Manipulated Variables Qift Xsv,rge
Notation SIV
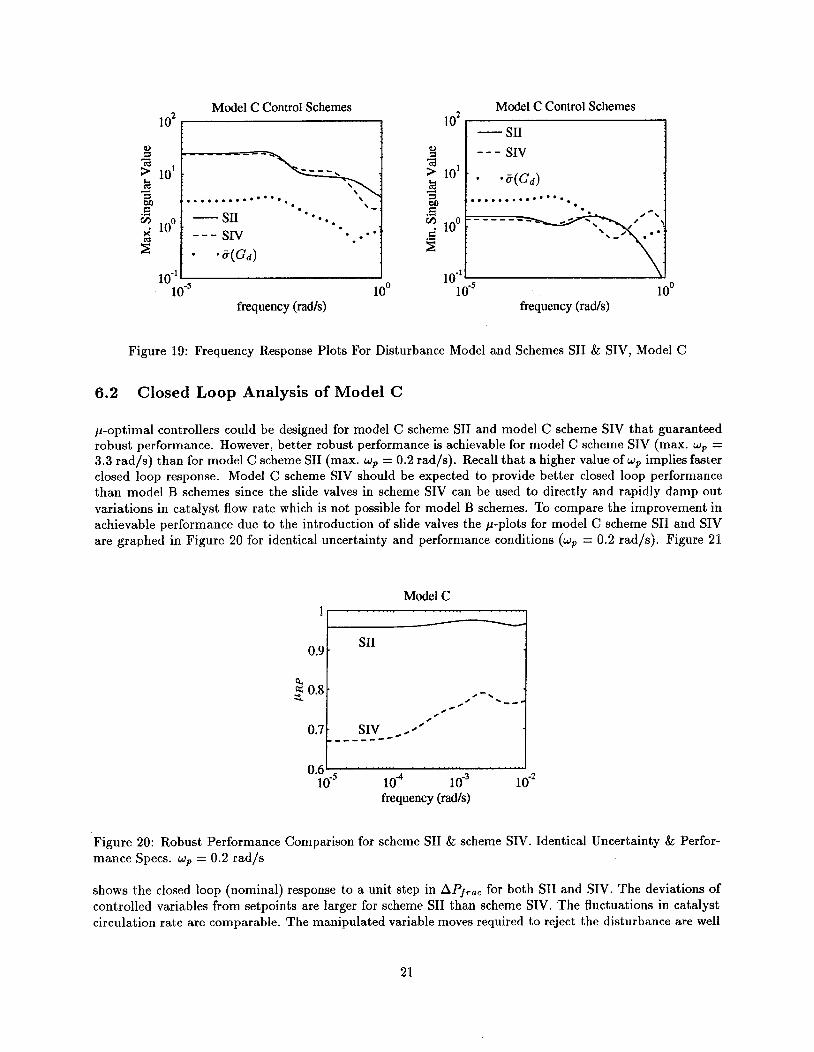
Figure 19 is a plot of the maximum and minimum singular values of the control schemes SII and SIV as a function of frequency. The maximum singular value of the disturbance transfer function matrix is also plotted. The flow characteristics for model C are very similar to those of model B. In model C as in model B, an increase in reactor pressure results in decreased catalyst circulation rate at steady state (negative gain). The steady state plant condition numbers as well as any RHPT zeros for model C schemes SII, and SIV are summarized in Table 6. Both control schemes have lower condition numbers than model A schemes. Scheme SIV has no RHPT zeros and should not have any inherent performance limitations. Scheme SII has a RHPT zero although it is outside the frequency range of interest.
Controlled Variables Coa,sg, T r
SIV 17.3 none
Table 6 - Steady state plant condition number and location of RHPT zero for Model C Control Schemes
It might be argued that if slide valves were installed to control catalyst flow rate that they would be used as manipulated variables and control schemes like SI, SII and SIII would not be considered. However, the aim is to compare model B modifications with model C modifications. In fact, model C, scheme 11 (in this case the slide valve openings were held constant) is identical to model B, scheme SII except for the pressure drop across the J-bends which are not considered in model B and different cross-sectional areas for the slide valves.
frequency (radls) frequency (radfs)
Model C Control Schemes Model C Control Schemes lo2 j
Figure 19: Frequency Response Plots For Disturbance Model and Schemes SII & SIV, Model C
0
3 > 10' 3 - ..........=**.. 1
6.2 Closed Loop Analysis of Model C
: - SII
- - - SIV
. . .@(Gd) ..........-**..
p-optimal controllers could be designed for model C scheme SII and model C scheme SIV that guaranteed robust performance. However, better robust performance is achievable for model C scheme SIV (max. wp = 3.3 rad/s) than for model C scheme SII (max. wp = 0.2 rad/s). Recall that a higher value of wp implies faster closed loop response. Model C scheme SIV should be expected to provide better closed loop performance than model B schemes since the slide valves in scheme SIV can be used to directly and rapidly damp out variations in catalyst flow rate which is not possible for model B schemes. To compare the improvement in achievable performance due to the introduction of slide valves the p-plots for model C scheme SII and SIV are graphed in Figure 20 for identical uncertainty and performance conditions (wp = 0.2 rad/s). Figure 21
G iij ;
lo0
Model C
'1 0.9 1 SII
frequency (radls)
Figure 20: Robust Performance Comparison for scheme SII & scheme SIV. Identical Uncertainty & Perfor- mance Specs. up = 0.2 rad/s
shows the closed loop (nominal) response to a unit step in APf,,, for both SII and SIV. The deviations of controlled variables from setpoints are larger for scheme SII than scheme SIV. The fluctuations in catalyst circulation rate are comparable. The manipulated variable moves required to reject the disturbance are well
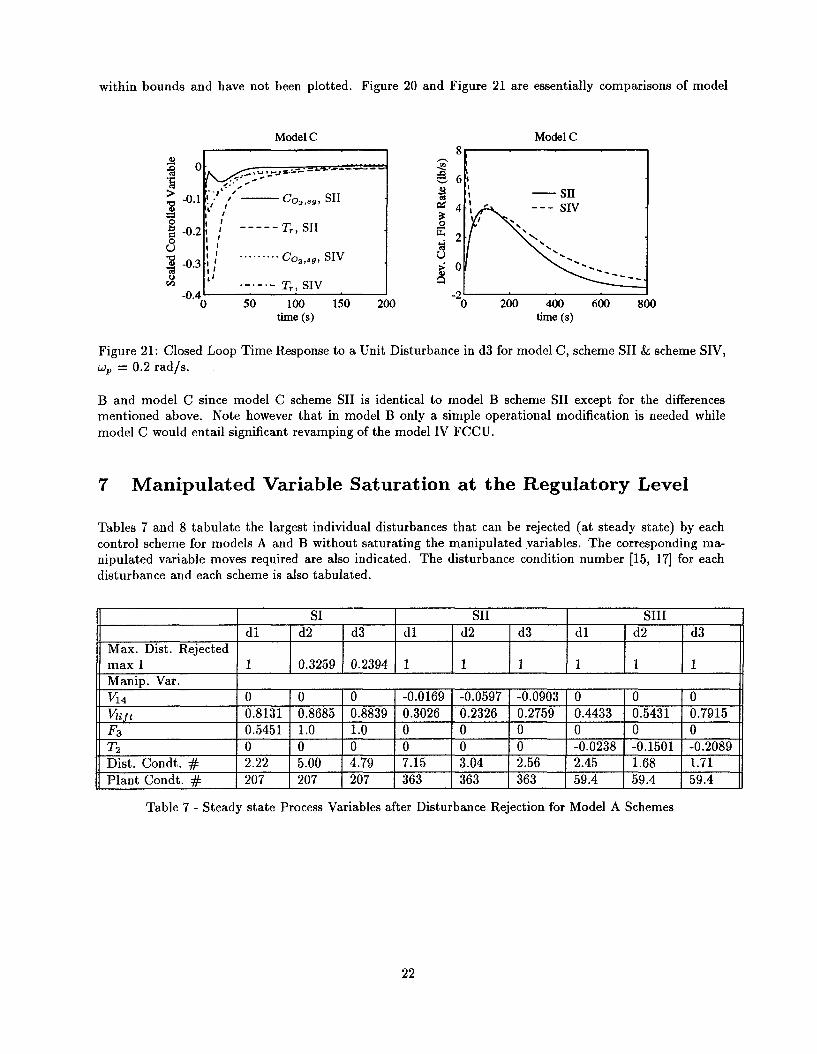
within bounds and have not been plotted. Figure 20 and Figure 21 are essentially comparisons of model
Model C Model C
h
8 r \ $ 64 B : - SII
- -. -2 0 200 400 600 800
time (s) time (s)
Figure 21: Closed Loop Time Response to a Unit Disturbance in d3 for model C, scheme SII & scheme SIV, w, = 0.2 rad/s.
B and model C since model C scheme SII is identical to model B scheme SII except for the differences mentioned above. Note however that in model B only a simple operational modification is needed while model C would entail significant revamping of the model IV FCCU.
7 Manipulated Variable Saturation at the Regulatory Level
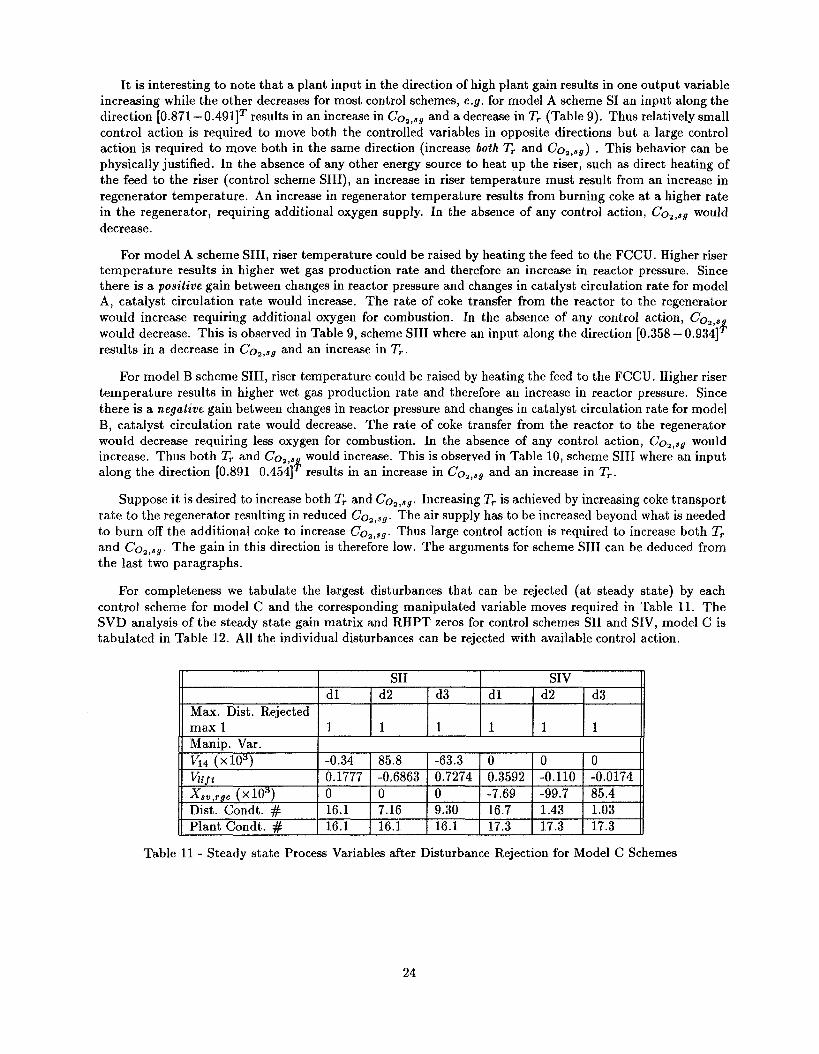
Tables 7 and 8 tabulate the largest individual disturbances that can be rejected (at steady state) by each control scheme for models A and B without saturating the manipulated variables. The corresponding ma- nipulated variable moves required are also indicated. The disturbance condition number [15, 171 for each disturbance and each scheme is also tabulated.
Table 7 - Steady state Process Variables after Disturbance Rejection for Model A Schemes

Table 8 - Steady state Process Variables after Disturbance Rejection for Model B Schemes
Tables 7 and 8 indicate that constraints are sometimes encountered in rejecting expected disturbances re- gardless of the configuration (model A or model B). Note however that in all cases the disturbance condition numbers are much smaller than the plant condition number indicating that individual disturbances are closely aligned with the best disturbance direction. The best disturbance direction is the disturbance input direction requiring the least action by the manipulated variables. A disturbance input aligned exactly with the best direction has a disturbance condition number of 1.
Table 9 gives a singular value decomposition (SVD), (eq 21) of the steady state gain matrix for the three control schemes in Table 6 for model A. Any significant RHPT zeros are also tabulated. Table 10 tabulates the corresponding values for model B.
G(0) = UCV* (21)
The maximum singular value of the plant gain matrix in schemes SI for both models A and B are significantly lower than the maximum singular value in schemes SII for models A and B. The manipulated variable combination in scheme SI does not have a strong enough effect on the outputs to compensate for the effect of expected disturbances. This is also evident in the open loop frequency response plots for model A (Figure 4) and model B (Figure 11) where the maximum disturbance gain is often greater than the maximum plant gain. Note that scheme ,9111, model B cannot compensate for expected disturbances in $3 for a similar reason.
Table 9 - Steady state SVD analysis and Plant RHPT zeros, Model A Control Schemes
Scheme
SI
SII
SIII
Table 10 - Steady state SVD analysis and Plant RHPT zeros, Model B Control Schemes
23
U 0.663 0.749
-0.749 0.663 -0.635 -0.772
0.772 -0.635 -0.627 -0.779
0.779 -0.627
C 92.8 0 0 0.449 957 0 0 2.64 225 0 0 3.80
Scheme
SI
SII
SIII
V 0.871 -0.491
-0.491 -0.871 0.996 -0.084
-0.084 -0.996 0.358 -0.934
-0.934 -0.358
U -0.036 1.00
1.00 0.036 0.866 -0.500
-0.500 -0.866 0.333 -0.943 0.943 0.333
C 3.43 0 0 0.81 28.4 0 0 2.79 6.72 0 0 1.92
V 0.920 -0.391
-0.391 -0.920 0.998 -0.067
-0.067 0.998 0.891 -0.454 0.454 0.891
- Cond. #
207
363
59.4
RHPT Zero
none
0.273
none
Condition #
4.22
10.2
3.51
RHPT Zero
2.860 x
1.86 f i l l . 1
1.762 x
-
It is interesting to note that a plant input in the direction of high plant gain results in one output variable increasing while the other decreases for most control schemes, e.g. for model A scheme SI an input along the direction [0.871 -0.491IT results in an increase in Co,,,g and a decrease in T, (Table 9). Thus relatively small control action is required to move both the controlled variables in opposite directions but a large control action is required to move both in the same direction (increase both T, and C O , , , ~ ) . This behavior can be physically justified. In the absence of any other energy source to heat up the riser, such as direct heating of the feed to the riser (control scheme SIII), an increase in riser temperature must result from an increase in regenerator temperature. An increase in regenerator temperature results from burning coke at a higher rate in the regenerator, requiring additional oxygen supply. In the absence of any control action, C O , , , ~ would decrease.
For model A scheme SIII, riser temperature could be raised by heating the feed to the FCCU. Higher riser temperature results in higher wet gas production rate and therefore an increase in reactor pressure. Since there is a posatave gain between changes in reactor pressure and changes in catalyst circulation rate for model A, catalyst circulation rate would increase. The rate of coke transfer from the reactor to the regenerator would increase requiring additional oxygen for combustion. In the absence of any control action, Co2,,, would decrease. This is observed in Table 9, scheme SIII where an input along the direction [0.358 - 0.934IT results in a decrease in Co,,,, and an increase in T,.
For model B scheme SIII, riser temperature could be raised by heating the feed to the FCCU. Higher riser temperature results in higher wet gas production rate and therefore an increase in reactor pressure. Since there is a negative gain between changes in reactor pressure and changes in catalyst circulation rate for model B, catalyst circulation rate would decrease. The rate of coke transfer from the reactor to the regenerator would decrease requiring less oxygen for combustion. In the absence of any control action, Co,,,g would increase. Thus both T, and Co,,,, would increase. This is observed in Table 10, scheme SIII where an input along the direction [0.891 0.4541~ results in an increase in Co,,,, and an increase in T,.
Suppose it is desired to increase both T, and Co,,,g. Increasing T, is achieved by increasing coke transport rate to the regenerator resulting in reduced Co,,,g. The air supply has to be increased beyond what is needed to burn off the additional coke to increase Co,,,g. Thus large control action is required to increase both T, and Co,,,g. The gain in this direction is therefore low. The arguments for scheme SIII can be deduced from the last two paragraphs.
For completeness we tabulate the largest disturbances that can be rejected (at steady state) by each control scheme for model C and the corresponding manipulated variable moves required in Table 11. The SVD analysis of the steady state gain matrix and RHPT zeros for control schemes SII and SIV, model C is tabulated in Table 12. All the individual disturbances can be rejected with available control action.
Table 11 - Steady state Process Variables after Disturbance Rejection for Model C Schemes
&a f t Xsv,rgc ( ~ 1 0 ~ ) Dist. Condt. # Plant Condt. #
0.1777 0 16.1 16.1
-0.6863 0 7.16 16.1
0.7274 0 9.30 16.1
0.3592 -7.69 16.7 17.3
-0.110 -99.7 1.43 17.3
-0.0174 85.4 1.03 17.3
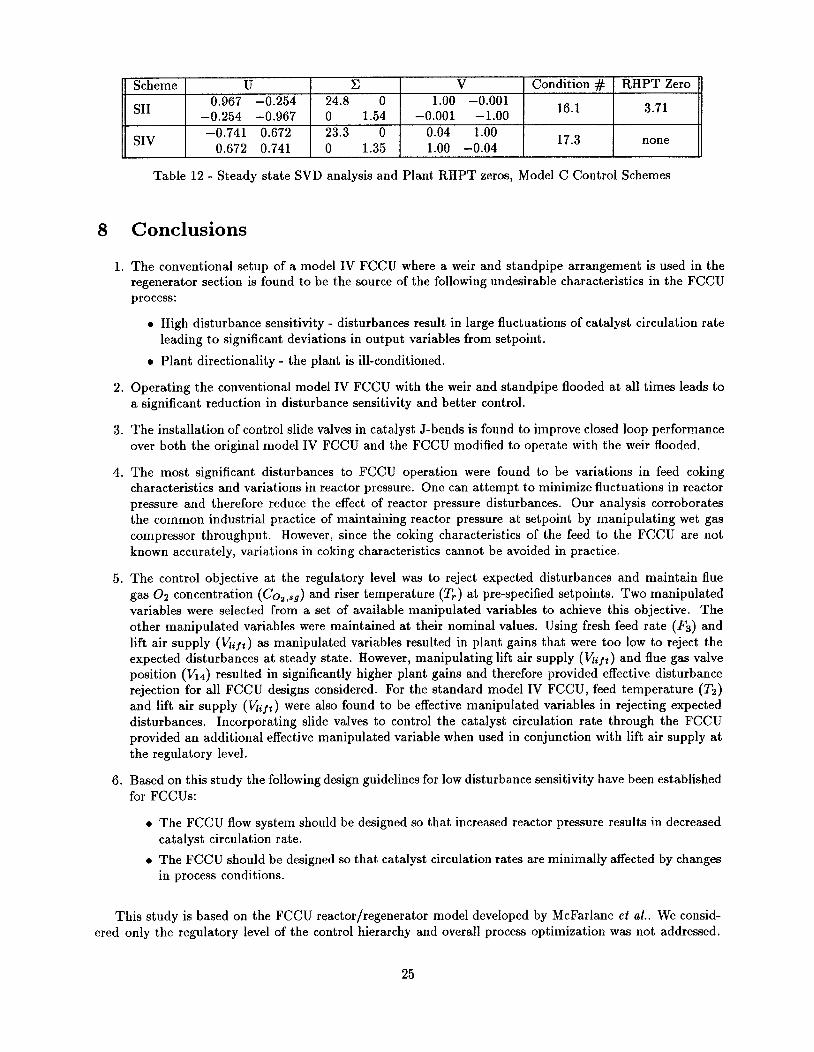
Table 12 - Steady state SVD analysis and Plant RHPT zeros, Model C Control Schemes
8 Conclusions
1. The conventional setup of a model IV FCCU where a weir and standpipe arrangement is used in the regenerator section is found to be the source of the following undesirable characteristics in the FCCU process:
V 1.00 -0.001
-0.001 -1.00 0.04 1.00 1.00 -0.04
Condition #
16.1
17.3
Scheme
SII
SIV
High disturbance sensitivity - disturbances result in large fluctuations of catalyst circulation rate leading to significant deviations in output variables from setpoint.
Plant directionality - the plant is ill-conditioned.
RHPT Zero
3.71
none
2. Operating the conventional model IV FCCU with the weir and standpipe flooded at all times leads to a significant reduction in disturbance sensitivity and better control.
U 0.967 -0.254
-0.254 -0.967 -0.741 0.672
0.672 0.741
3. The installation of control slide valves in catalyst J-bends is found to improve closed loop performance over both the original model IV FCCU and the FCCU modified to operate with the weir flooded.
C 24.8 0 0 1.54 23.3 0 0 1.35
4. The most significant disturbances to FCCU operation were found to be variations in feed coking characteristics and variations in reactor pressure. One can attempt to minimize fluctuations in reactor pressure and therefore reduce the effect of reactor pressure disturbances. Our analysis corroborates the common industrial practice of maintaining reactor pressure at setpoint by manipulating wet gas compressor throughput. However, since the coking characteristics of the feed to the FCCU are not known accurately, variations in coking characteristics cannot be avoided in practice.
5. The control objective at the regulatory level was to reject expected disturbances and maintain flue gas 0 2 concentration (Co,,,g) and riser temperature (T,) at pre-specified setpoints. Two manipulated variables were selected from a set of available manipulated variables to achieve this objective. The other manipulated variables were maintained at their nominal values. Using fresh feed rate (Fa) and lift air supply ( F i f t ) as manipulated variables resulted in plant gains that were too low to reject the expected disturbances at steady state. However, manipulating lift air supply ( Q i f l ) and flue gas valve position (VI4) resulted in significantly higher plant gains and therefore provided effective disturbance rejection for all FCCU designs considered. For the standard model IV FCCU, feed temperature (T2)
and lift air supply (Kaft) were also found to be effective manipulated variables in rejecting expected disturbances. Incorporating slide valves to control the catalyst circulation rate through the FCCU provided an additional effective manipulated variable when used in conjunction with lift air supply at the regulatory level.
6. Based on this study the following design guidelines for low disturbance sensitivity have been established for FCCUs:
0 The FCCU flow system should be designed so that increased reactor pressure results in decreased catalyst circulation rate.
The FCCU should be designed so that catalyst circulation rates are minimally affected by changes in process conditions.
This study is based on the FCCU reactorlregenerator model developed by McFarlane et al.. We consid- ered only the regulatory level of the control hierarchy and overall process optimization was not addressed.

The emphasis was on understanding those aspects (both design and operational) of model IV FCCUs that render them difficult to control. The aim was not to design controllers for actual model IV FCCUs based on this model. Instead, controllers were designed for similar performance and stability objectives to compare alternate operating modes and different possible design modifications to the model IV FCCU. Based on our observations we identified some desirable characteristics of FCCUs that make control easier.
It must be stressed that the findings reported in this paper for the original model IV FCCU are based on the assumption that the underlying nonlinear model adopted from McFarlane et al. captures the dynamic characteristics of model IV FCCU operation with a reasonable degree of accuracy.
We have not explicitly considered process constraints in this analysis except to the extent of determining the largest individual disturbances that can be rejected at steady state. Industrial experience indicates that constraints are effectively handled at higher levels of the control hierarchy (above the regulatory level). The focus of this work was at the regulatory level and process constraints were not considered in the analysis.
Our linear analysis strictly applies to a narrow region around the operating point described. However, the dynamic characteristics of the FCCU are essentially the same as long as the FCCU is operated under total combustion [I]. Therefore, the results are generally valid for FCCU operation in the total combustion mode.
9 Acknowledgments
Financial support from Chevron Research and Technology Company is gratefully acknowledged. We would also like to thank Serban Agachi, John Bomberger and Bruno Donno for their help with this project. Finally, we thank Professor Reuel Shinnar for some enlightening discussions.
10 Nomenclature
cross-sectional area of unit i (ft2) flue gas O2 conc. (mol %) non-dimensional input disturbance steady-state disturbance value elevation of regenerator lift air injection (ft) elevation where oil enters reactor riser (ft) weir overflow factor fresh feed rate (lb/s) regenerated catalyst flow rate (lb/s) catalyst flow rate over weir (lb/s) plant transfer function matrix evaluated at s = jw height of lift pipe (ft) # of velocity heads ambient temperature (OF) riser temperature (OF) regenerator temperature (OF) feed temperature to riser base (OF) non-dimensional input variable steady-state input value left singular vectors of G(0) velocity through restriction (ft/s) right singular vectors of G(0) lift air steam governor position
Vs Kl K4
'w i
w 0
w~ WI w o WP Xsv,rgc Xsv,sc 0 Yss
Zbed
P APjrac APr A wj A Ha $JF
PC C
combustion air blower suction valve position (0-1) wet gas compressor suction valve position (0-1) flue gas slide valve position (0-1) freq. dependent uncertainty wt. for each input variable freq. dependent uncertainty wt. for each output variable freq. dependent performance wt. for each output variable diagonal matrix of input uncertainty wts, diag(wi) diagonal matrix of output uncertainty wts, diag(w,) diagonal matrix of performance wts, diag(wp) regenerated catalyst U-bend slide valve position (0-1) spent catalyst U-bend slide valve position (0-1) non-dimensional output variable steady-state output value regenerator dense bed height (ft) constant (lb/s) pressure drop between reactor and main fractionator (psia) change in reactor pressure (psia) catalyst inventory change in unit i (lb) catalyst level change in unit i (ft) effective coke factor for gas-oil feed settled catalyst density (45 lb/ft3) diagonal matrix of plant gains
Subscripts:
re!?' - regenerator
rgc regenerated catalyst line sc spent catalyst line S P standpipe str reactor stripper
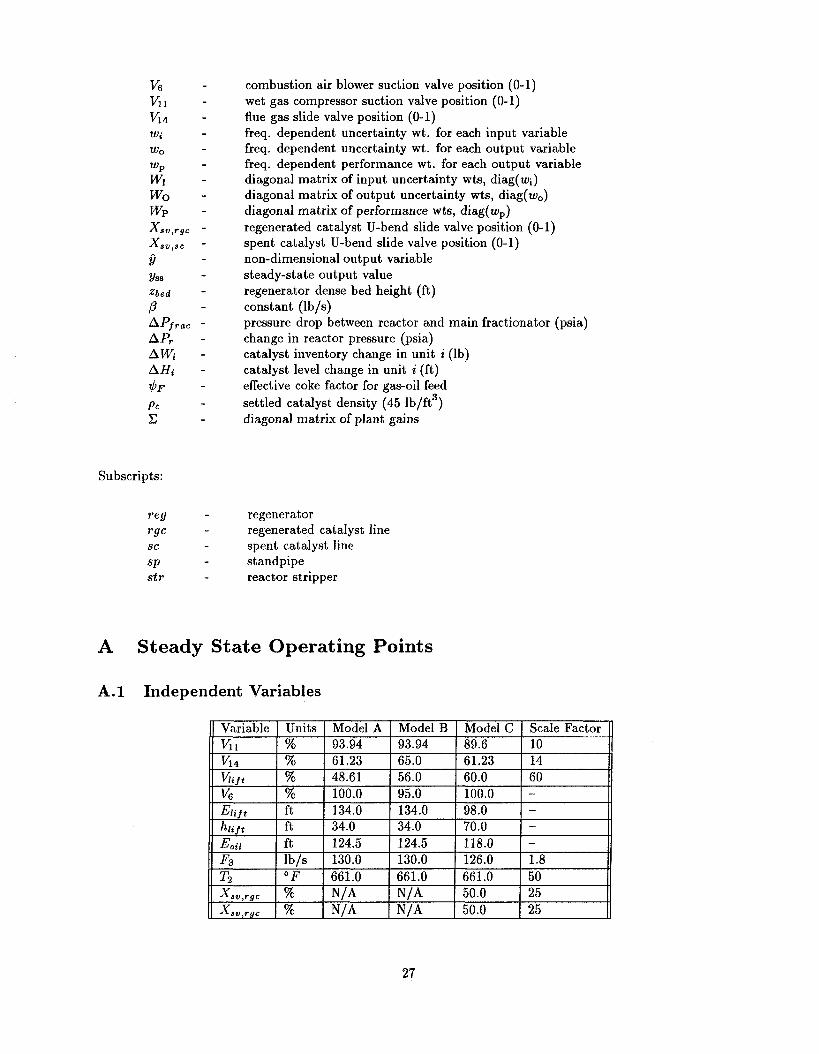
A Steady State Operating Points
A. 1 Independent Variables
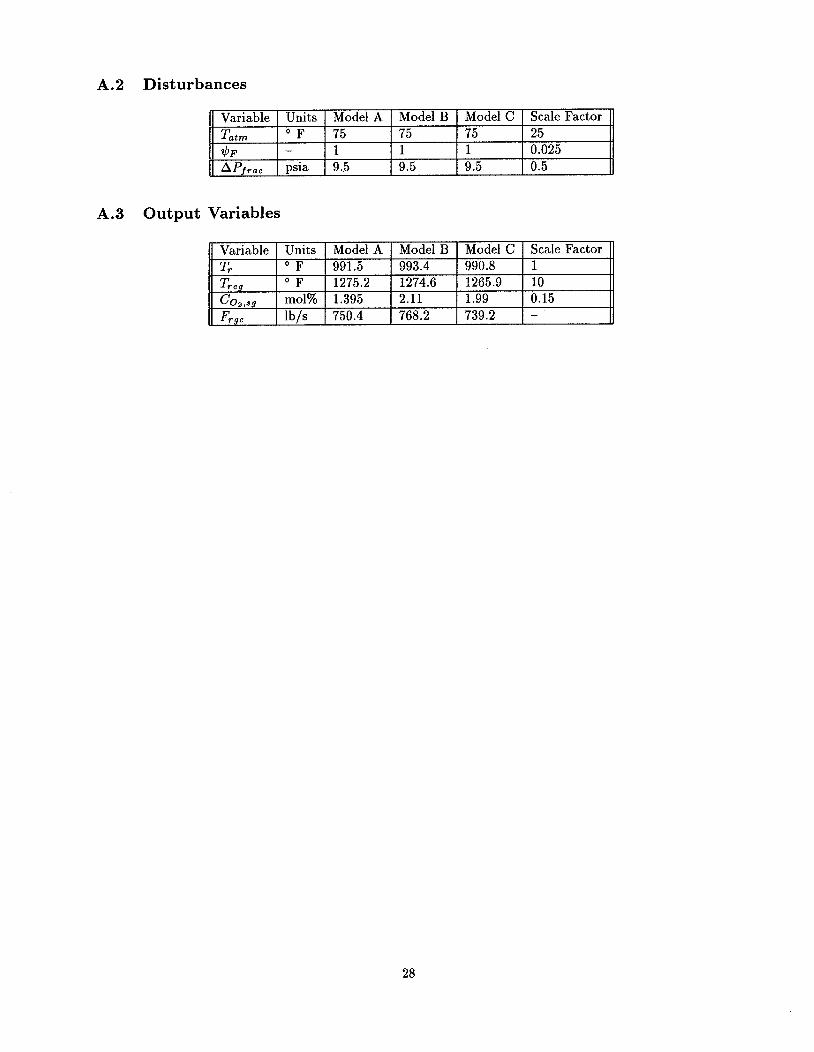
A.2 Disturbances
A.3 Output Variables
Scale Factor 25 0.025 0.5
Model C 75 1 9.5 L
Model B 75 1 9.5
Model A 75 1 9.5
Units OF -
psia
. -
Variable Tatna
$F
APfrac
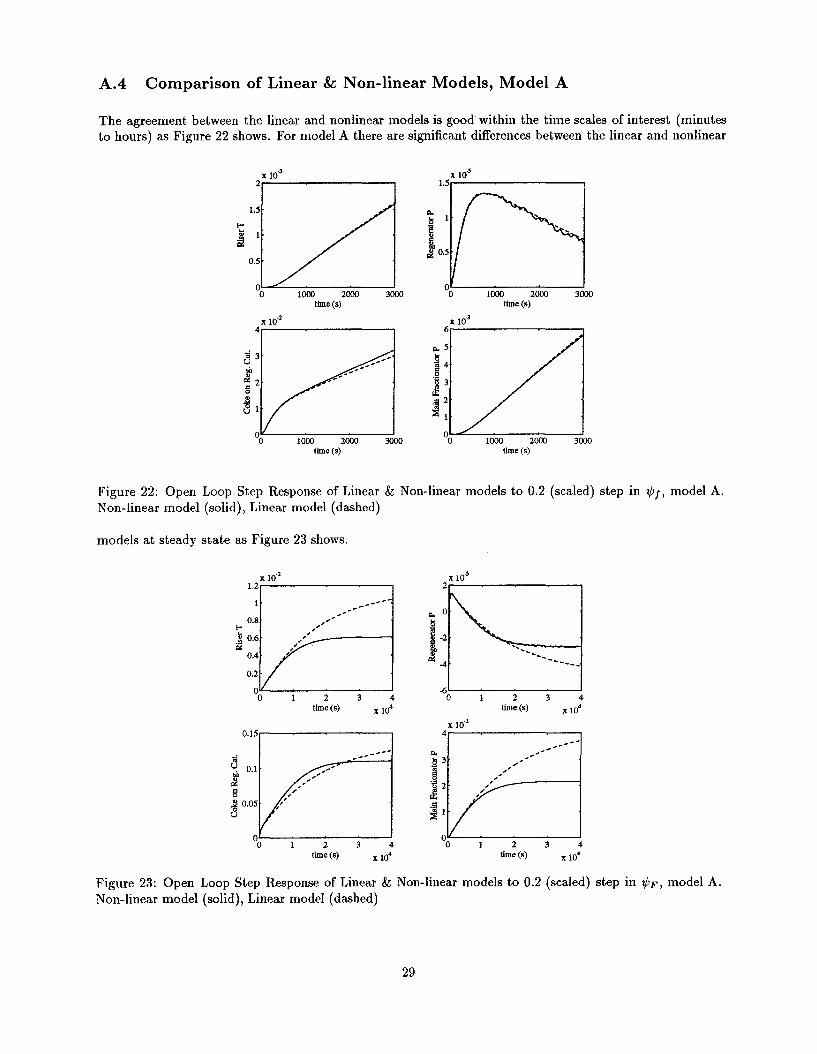
A.4 Comparison of Linear & Non-linear Models, Model A
The agreement between the linear and nonlinear models is good within the time scales of interest (minutes to hours) as Figure 22 shows. For model A there are significant differences between the linear and nonlinear
time (s) time (s)
time (s) time (s)
Figure 22: Open Loop Step Response of Linear & Non-linear models to 0.2 (scaled) step in $ f , model A. Non-linear model (solid), Linear model (dashed)
models at steady state as Figure 23 shows.
time (s) lo4 time (s) lo4
x lo'=
time (s) x 10' time (s) lo4
Figure 23: Open Loop Step Response of Linear & Non-linear models to 0.2 (scaled) step in +F, model A. Non-linear model (solid), Linear model (dashed)
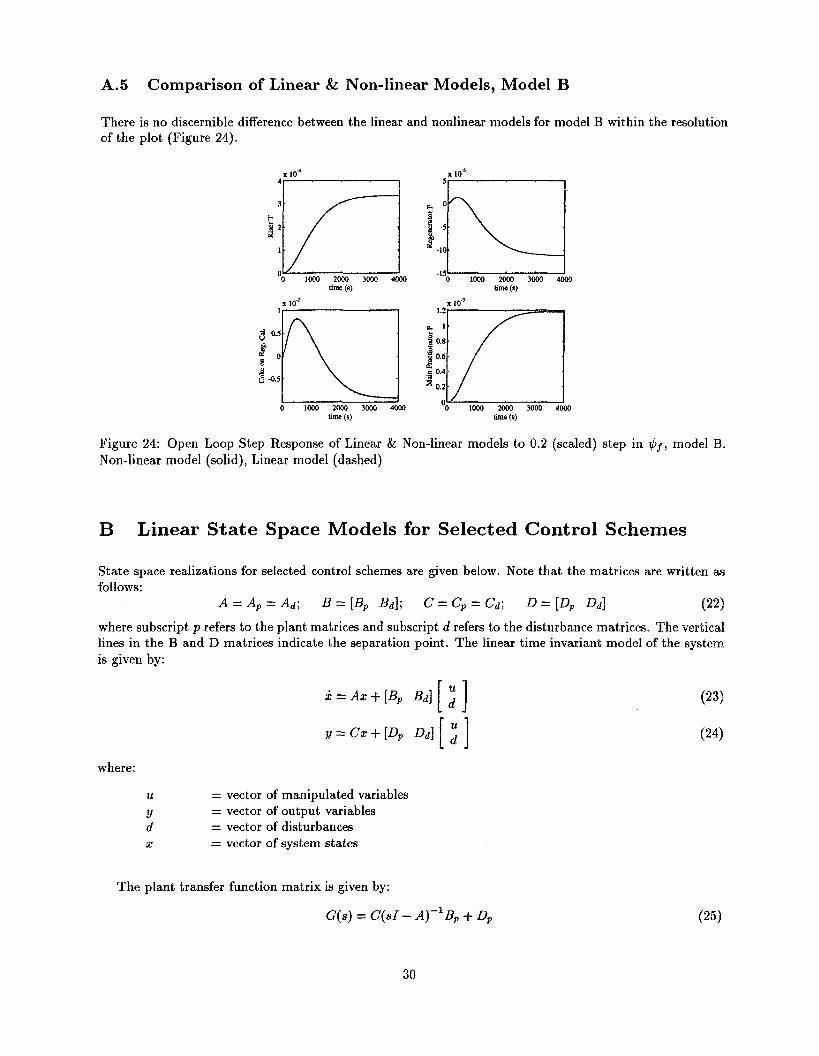
A.5 Comparison of Linear & Non-linear Models, Model B
There is no discernible difference between the linear and nonlinear models for model B within the resolution of the plot (Figure 24).
lime (s)
x to"
lime (6)
Figure 24: Open Loop Step Response of Linear & Non-linear models to 0.2 (scaled) step in $f, model B. Non-linear model (solid), Linear model (dashed)
B Linear State Space Models for Selected Control Schemes
State space realizations for selected control schemes are given below. Note that the matrices are written as follows:
A = A p = A d ; B = [ B p Bd]; C = C p = C d ; D = [ D p Dd] (22)
where subscript p refers to the plant matrices and subscript d refers to the disturbance matrices. The vertical lines in the B and D matrices indicate the separation point. The linear time invariant model of the system is given by:
where:
u = vector of manipulated variables Y = vector of output variables d = vector of disturbances x = vector of system states
The plant transfer function matrix is given by:
G(S) = C(SI - ~ 1 - l ~ ~ + D~

and the disturbance transfer function matrix is given by:
The input and output vectors are specified individually for each model. The disturbances are always the same, namely dT = [ d l d2 d3] .
m1 - -&-L-- 2- - - L L --.- lat: s b a b e s uu ll u b Ilavt: aa obious phjy'sice! interpretation a the mcde! dimer?sicr, was reduced after linearization. The original linear system was balanced and the Hankel singular values examined to determine truncation order. The balanced system was then truncated, yielding the reduced order linear model. This procedure is described by Balas et al. [2] .
B. l Model A, SII
B.2 Model B, SII

B.3 Model C, SII
B.4 Model C, SIV

C Slide Valve Model
The pressure drop across each slide valve is given by :
where:
F e a t - catalyst flow rate (ton/min) I< - dimensional constant (0.7) A,, - open area of slide valve (213 in2) XSV - fractional opening of slide valve
PC - settled catalyst density (45 lb/ft3)
The pressure drop across each J-bend is given by:
where:
- # of velocity heads (20) - settled catalyst density (45 lb/ft3) - velocity through J-bend (ft/s)
References
[I] A. Arbel, Z. Huang, I.H. Rinard, and R. Shinnar. Paper 149k - Partial Control of FCC Units: Input Multiplicities and Control Structures. Presented at AIChE Annual Meeting, 1993, St. Louis Mo.
[2] G. J. Balas, J. C. Doyle, K. Glover, A. Packard, R. Smith. p- Analysis and Synihesis Idbolbox, Users Guide The Math Works, Inc., 1991.
[3] S. S. E. H. Elnashaie and S. S. Elshishini. Digital Simulation of Industrial; Fluid Catalytic Cracking Units - IV. Dynamic Behavior. Chem. Eng. Sci., 48(3): 567 - 583, 1993.

[4] S. S. E. H. Elnashaie and I. M. El-Hennawi. Multiplicity of the Steady State in Fluidized Bed Reactors - IV. Fluid Catalytic Cracking (FCC). Chem. Eng. Sci., 34: 1113 - 1121, 1979.
[5] L. I. Felipe. Dynamic Modeling of an Industrial Fluid Catalytic Cracking Unit. Presented at European Symposium on Computer Aided Process Engineering - 1, Escape 1, Elsinore, Denmark, S139 - S148, 1992.
[6] P. Grosdidier, A. Mason, A. Aitolahti, P. Heinonen and V. Vanhambki. FCC Unit Reactor-Regenerator Control. Computers and Chemical Engineering, 17(2): 165-179, 1993.
[7] B. R. Holt and M. Morari. Design of Resilient Processing Plants - VI. The Effect of Right-Half-Plane Zeros on Dynamic Resilience. Chem. Eng. Sci., 40(1), 59 - 74, 1985.
[8] M. Hovd and S. Skogestad. Procedure for Regulatory Control Structure Selection with Application to the FCC Process. AIChE J., 39(12) , 1938-1953, 1993.
[9] L. Kalra, J. F. Bartee, and C. Georgakis. On the Use of the Amoco FCCU Model in a Graduate Process Control Class. Presented at AIChE Annual Meeting, 1993, St. Louis, Mo.
[lo] H. Kurihara. Optimal Control of Fluid Catalytic Cracking Processes. PhD. Thesis, MIT, 1967
[ l l ] E. Lee and F. R. Groves Jr. Mathematical Modeling of the Fluidized Bed Catalytic Cracking Plant. Trans. Soc. Comp. Szm., 2(3), 219-236, 1985.
[12] P. Lundstrom, S. Skogestad and Z. Wang. Performance Weight Selection for H-infinity and p-Control Methods. Trans. Inst. MC, 13(5), 241-252, 1991.
[13] R. C. McFarlane, R. C. Reineman, J . F. Bartee, and C. Georgakis. Dynamic Simulator for a Model IV Fluid Catalytic Cracking Unit. Comp. 0 Chem. Eng., 17(3), 275-300, 1993.
[14] J. J. Monge and C. Georgakis. Multivariable Control of Catalytic Cracking Processes. Chem. Eng. Comm., 61, 197 - 225, 1987.
[15] M. Morari and E. Zafiriou. Robust Process Control. Prentice-Hall, Inc., Englewood Cliffs, N. J., 1989.
[16] M. Morari, E. Zafiriou, and B. Holt. Design of Resilient Processing Plants - New Characterization of the effect of RHP Zeros Chem. Eng. Sci., 42(10), 2425 - 2428, 1987.
[17] S. Skogestad and M. Morari. Effect of Disturbance Direction on Closed Loop Performance. Ind. Eng. Chem. Res., 26(10), 2029-2035, 1987.
[18] S. Skogestad, M. Morari and J. C. Doyle. Robust Control of Ill-Conditioned Plants: High-Purity Distillation IEEE Trans. Auto. Ctrl., 33(12), 1092 - 1105, 1988.