design and optimization of small scale factory ...umpir.ump.edu.my/1145/1/lee_wen_yin.pdf · design...
TRANSCRIPT

DESIGN AND OPTIMIZATION OF SMALL SCALE FACTORY
MANUFACTURING SYSTEM
LEE WEN YIN
Report submitted in partial fulfillment of the requirements
for the award of Bachelor of
Mechanical Engineering with Manufacturing Engineering
Faculty of Mechanical Engineering
UNIVERSITI MALAYSIA PAHANG
NOVEMBER 2009
ii
SUPERVISOR’S DECLARATION
I hereby declare that I have checked this project and in my opinion, this project is
adequate in terms of scope and quality for the award of the degree of Bachelor of
Mechanical Engineering with Manufacturing Engineering.
Signature
Name of Supervisor: MUHAMAD ZUHAIRI SULAIMAN
Position: LECTURE
Date:
iii
STUDENT’S DECLARATION
I hereby declare that the work in this project is my own except for quotations and
summaries which have been duly acknowledged. The project has not been accepted for
any degree and is not concurrently submitted for award of other degree.
Signature
Name: LEE WEN YIN
ID Number: ME06025
Date: 20-11-2009
iv
ACKNOWLEDGEMENTS
I am grateful and would like to express my sincere gratitude to my supervisor En. Muhamad Zuhairi Sulaiman for his germinal ideas, invaluable guidance, continuous encouragement and constant support in making this research possible. He has always impressed me with his outstanding professional conduct, his strong conviction for science, and his belief that a Degree program is only a start of a life-long learning experience. I appreciate his consistent support from the first day I applied to graduate program to these concluding moments. I am truly grateful for his progressive vision about my training in science, his tolerance of my naïve mistakes, and his commitment to my future career.
My sincere thanks go to all my friends and members of the staff of the Mechanical Engineering Department, UMP, who helped me in many ways and made my stay at UMP pleasant and unforgettable.
I acknowledge my sincere indebtedness and gratitude to my parents for their love, dream and sacrifice throughout my life. Special thanks should be given to my committee members. I would like to acknowledge their comments and suggestions, which was crucial for the successful completion of this study.

Dedicated to my parents,
brothers and
all my best friends

v
ABSTRACT
Investigation on manufacturing system of small scale factory has been carried out in this project. The main manufacturing system focused in this thesis is the factory layout. Poor layout design is determine as a major problem contribution in small scale factory. It will affect the productivity and also line efficiency. Through the study aim is to propose new layout to the factory to improve the productivity and reduce the waste to get more profit so that they can survive even facing competition from bigger factory. This study starts with selection of a suitable factory to be the case study target. After that, visit the factory and identify the problems that occur in the factory layout that affect the productivity of the factory. Get all the data needed and redesign the factory layout to improve productivity of the factory. Simulate the layout using computer aided tools to know the effectiveness of the new layout design. In this study, the application of computer aided tools is Witness software. Two layouts are designed to improve the productivity of the factory. Manual calculation is used to calculate the data get from the factory before insert into software. Mean time and worker efficiency is calculated to improve the accuracy of the simulation result. Productivity and line efficiency of the layout is get from the result to know the performance of the layout. Propose layout 2 can contribute 16.5% increment of productivity compares to original layout and 14.4% of productivity compares to propose layout 1. Propose layout 2 can get higher value of productivity and line efficiency so propose layout 2 is a better layout that can increase the performance of the factory.
vi
ABSTRAK
Tesis ini membentang tentang sistem manufaktur bagi kilang yang kecil. Isu utama sistem manufaktur yang dibentang dalam tesis ini adalah susun atur kilang. Susun atur kilang yang lemah telah dikenal pasti sebagai masalah utama bagi kilang yang kecil. Ia akan mempengaruhi produktiviti dan kecekapan pembuatan. Sasaran utama pengajian ini adalah mencadangkan susun atur kilang yang baru untuk meningkatkan produktiviti dan mengurangkan pembaziran. Ini dapat meningkatkan penguntungan supaya dapat bertahan samasa manghadap cabaran daripada kilang yang lebih besar. Pengajian ini bermula dengan mancari kilang yang sesuai untuk kajian. Selepas itu, melawat kilang dan mengenalpasti masalah dalam susun atur kilang yang mempengaruhi produktiviti kilang itu. Mendapatkan semua nilai yang diperlukan dan mereka semula susun atur kilang untuk meningkatkan produktiviti. Mensimulasikan susun atur dengan menggunakan komputer untuk mengenalpasti keberkesanan susun atur yang baru. Program Witness digunakan dalam pengajian ini. Dua susun atur yang baru direka unutk meningkatkan produktiviti kilang itu. Semua nilai yang didapat dalam kilang itu dikira untuk isi dalam program itu. Mengambil kira masa berati dan kecekapan perkerja untuk meningkatkan ketepatan keputusan simulasi. Mendapatkan nilai produktiviti dan kecekapan pembuatan daripada keputusan untuk mengetahui prestasi susun atur kilang.Susun atur kedua boleh meningkatkan nilai produktiviti sebanyak 16.5% berbanding dengan susun atur asal dan 14.4% berbanding dengan susun atur pertama. Susun atur kedua yang dibentangkan mendapat nilai produktiviti dan kecekapan pembuatan yang lebih tinggi. Jadi, susun atur kilang kedua adalah susun atur kilang yang lebih baik dan dapat meningkatkan prestasi kilang itu.
vii
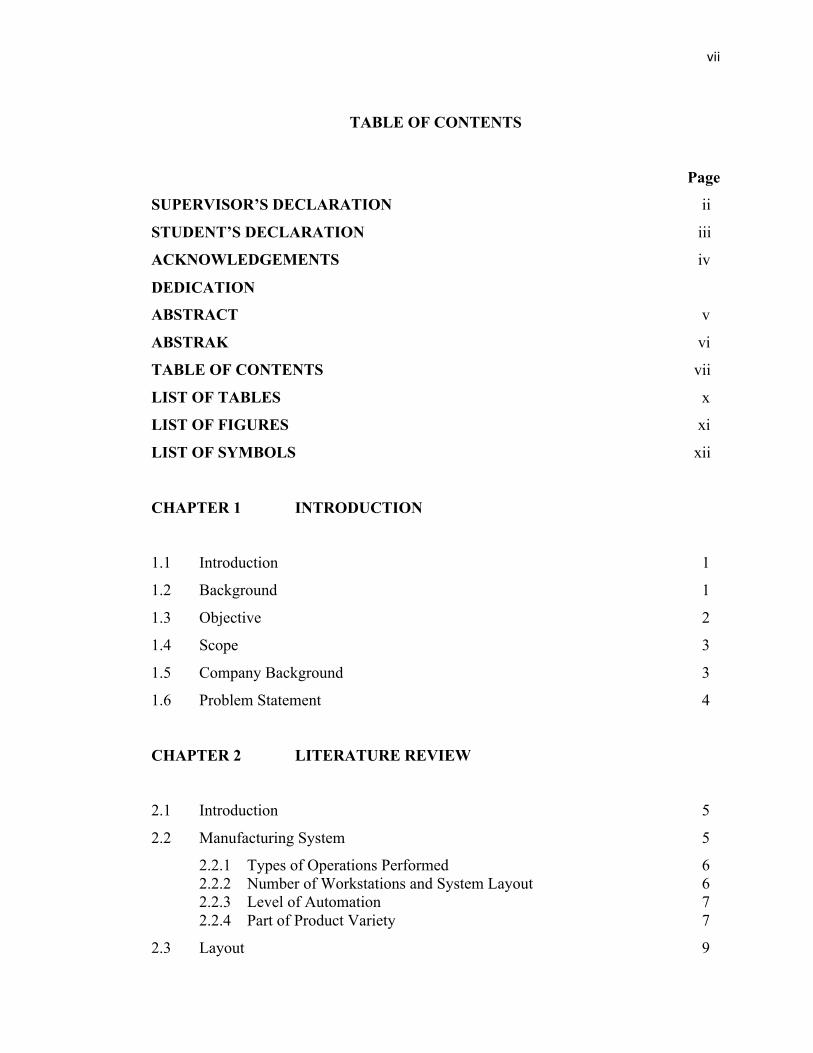
TABLE OF CONTENTS
Page
SUPERVISOR’S DECLARATION ii
STUDENT’S DECLARATION iii
ACKNOWLEDGEMENTS iv
DEDICATION
ABSTRACT v
ABSTRAK vi
TABLE OF CONTENTS vii
LIST OF TABLES x
LIST OF FIGURES xi
LIST OF SYMBOLS xii
CHAPTER 1 INTRODUCTION
1.1 Introduction 1
1.2 Background 1
1.3 Objective 2
1.4 Scope 3
1.5 Company Background 3
1.6 Problem Statement 4
CHAPTER 2 LITERATURE REVIEW
2.1 Introduction 5
2.2 Manufacturing System 5
2.2.1 Types of Operations Performed 62.2.2 Number of Workstations and System Layout 62.2.3 Level of Automation 72.2.4 Part of Product Variety 7
2.3 Layout 9
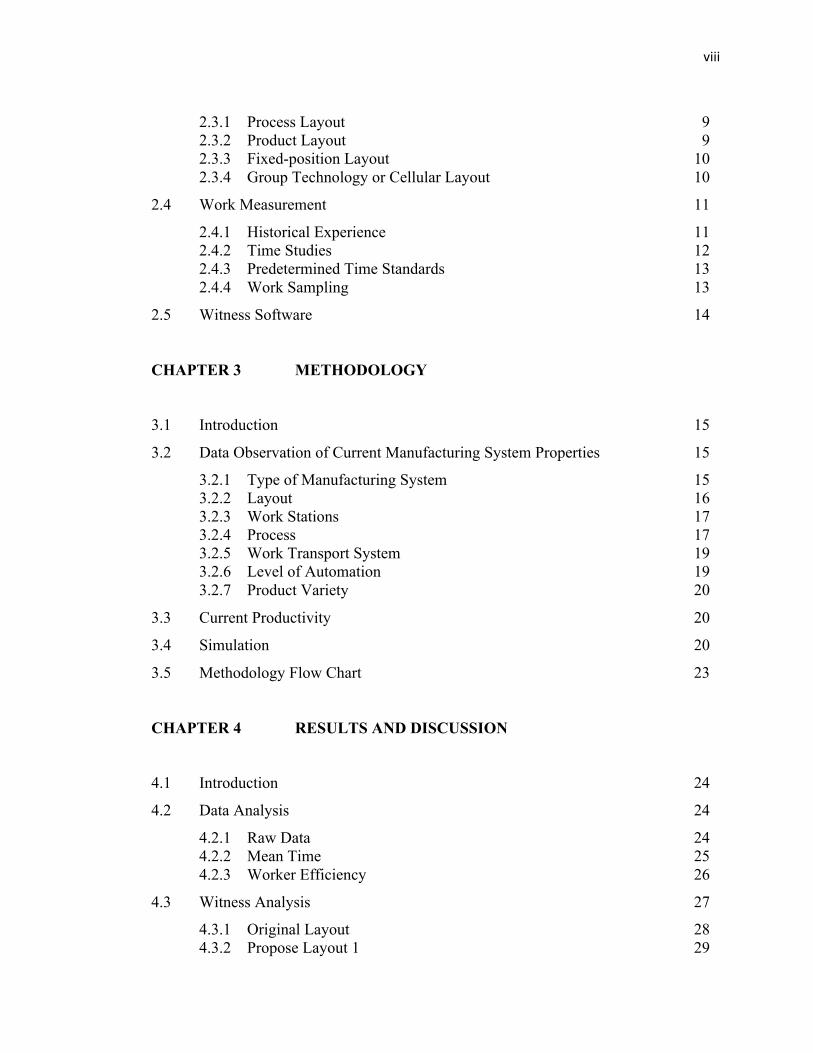
viii
2.3.1 Process Layout 92.3.2 Product Layout 92.3.3 Fixed-position Layout 102.3.4 Group Technology or Cellular Layout 10
2.4 Work Measurement 11
2.4.1 Historical Experience 112.4.2 Time Studies 122.4.3 Predetermined Time Standards 132.4.4 Work Sampling 13
2.5 Witness Software 14
CHAPTER 3 METHODOLOGY
3.1 Introduction 15
3.2 Data Observation of Current Manufacturing System Properties 15
3.2.1 Type of Manufacturing System 153.2.2 Layout 163.2.3 Work Stations 173.2.4 Process 173.2.5 Work Transport System 193.2.6 Level of Automation 193.2.7 Product Variety 20
3.3 Current Productivity 20
3.4 Simulation 20
3.5 Methodology Flow Chart 23
CHAPTER 4 RESULTS AND DISCUSSION
4.1 Introduction 24
4.2 Data Analysis 24
4.2.1 Raw Data 244.2.2 Mean Time 254.2.3 Worker Efficiency 26
4.3 Witness Analysis 27
4.3.1 Original Layout 284.3.2 Propose Layout 1 29

ix
4.3.3 Propose Layout 2 30
4.4 Productivity 31
4.5 Line Efficiency 32
4.6 Discussion 33
4.6.1 Productivity 334.6.2 Line Efficiency 33
4.7 Limitation of Software 34
CHAPTER 5 CONCLUSION
5.1 Introduction 35
5.2 Conclusions 35
5.3 Recommendation 36
REFERENCE 37
APPENDICES
A Figure of Manufacturing Process 38
B Result of Original Layout 39
C Result of propose layout 1 40
D Result of propose layout 2 41
x
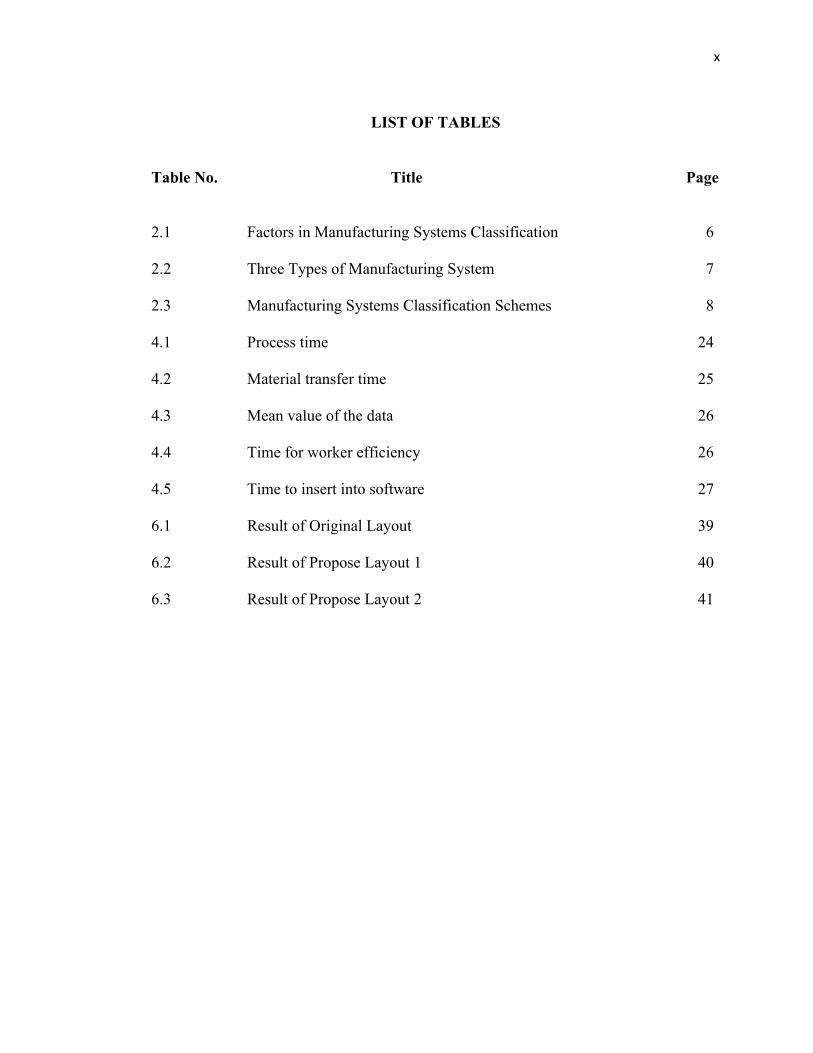
LIST OF TABLES
Table No. Title Page
2.1 Factors in Manufacturing Systems Classification 6
2.2 Three Types of Manufacturing System 7
2.3 Manufacturing Systems Classification Schemes 8
4.1 Process time 24
4.2 Material transfer time 25
4.3 Mean value of the data 26
4.4 Time for worker efficiency 26
4.5 Time to insert into software 27
6.1 Result of Original Layout 39
6.2 Result of Propose Layout 1 40
6.3 Result of Propose Layout 2 41

xi
LIST OF FIGURES
Figure No. Title Page
1.1 A typical manufacturing system 2
3.1 Process Layout of the factory 16
3.2 Process of the Manufacturing System 17
3.3 Example of product after process 18
3.4 Examples of semi-auto machine 19
3.5 Icon represents the process 21
3.6 Icon represents the material 21
3.7 Symbol of link 21
3.8 Text box of icon 22
3.9 Methodology flow chart 23
4.1 Graph Process Time versus Sample 25
4.2 Graph Material Transfer Time versus Sample 25
4.3 Original Layout 28
4.4 Propose Layout 1 29
4.5 Propose Layout 2 30
4.6 Graph Productivity versus Layout 31
4.7 Graph Line Efficiency versus Layout 32
6.1 Figure of Manufacturing Process 38
xii
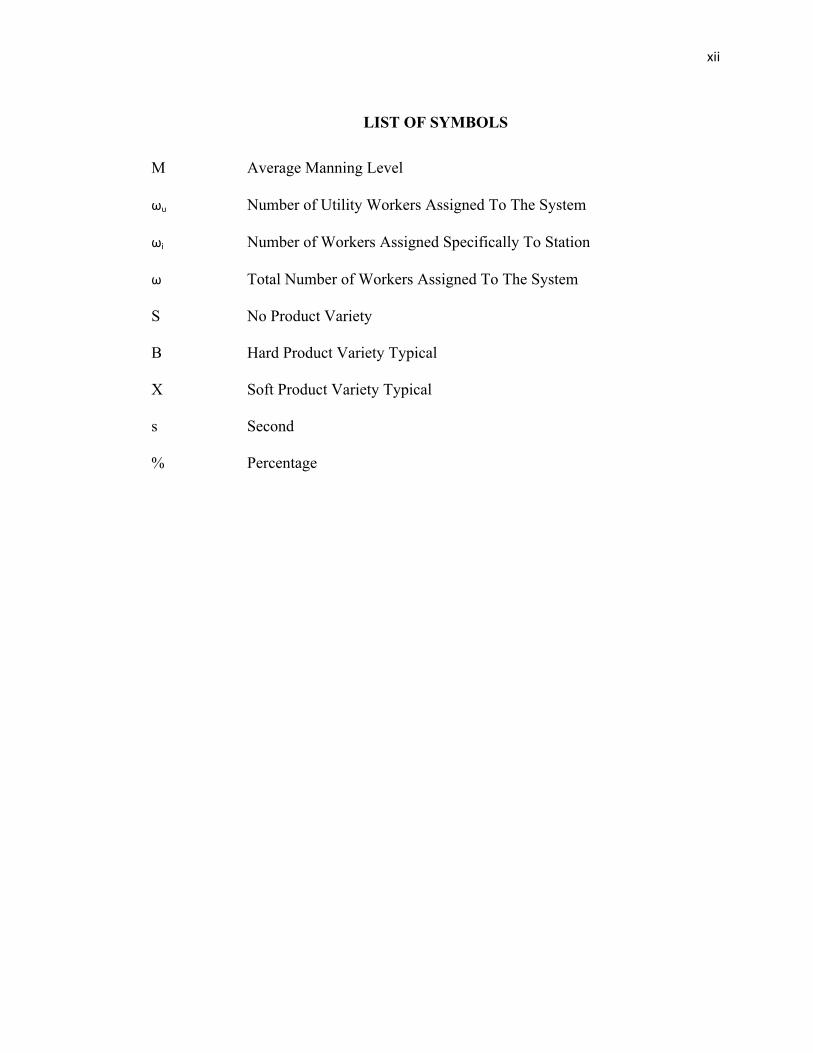
LIST OF SYMBOLS
M Average Manning Level
ωu Number of Utility Workers Assigned To The System
ωi Number of Workers Assigned Specifically To Station
ω Total Number of Workers Assigned To The System
S No Product Variety
B Hard Product Variety Typical
X Soft Product Variety Typical
s Second
% Percentage

CHAPTER 1
INTRODUCTION
1.1 INTRODUCTION
This chapter briefly discuss about the background of this study. Objective and
scopes will be listed and briefly explain about the background of the case study
company. Problem statement will also discuss in this chapter.
1.2 BACKGROUND
In the early industrial revolution, manufacturing was not undertaken
systematically. Any jobs were done by worker either alone or in small groups.
Factories in modern sense did not exist. After the industrial revolution, the nature of
manufacturing changed. By 1850, most production took place in factories. While
manufacturing technology has improved widely, the factories of the mid-nineteenth
century would be immediately recognizable to modern engineers. Factories normally
consist of a number of individual processes linked together, it call manufacturing
system. Figure 2.1 presents a sample of typical manufacturing system.

2
Figure 1.1: A typical manufacturing system
Source: Harrison (2002)
The manufacturing system has been supported by a number of functional
departments. The activities of these departments are coordinated by production
planning over the short or medium term. Note also that there are links between the
organization and the outside world.(Harrison, 2002) The entire system is to
transforming basic raw materials into products for end users.
1.3 OJECTIVE
The objective of this project is to:
1. Study and enhance the knowledge to investigate of manufacturing system
of small scale factory.
2. Improve manufacturing system of the factory for the production
optimization purpose.
3. Propose the solution to increase the productivity.
3
1.4 SCOPE
This project is focuses on case study in factory. There are three scopes in this
project. First scope of this project is focus on small scale factory manufacturing
system. Second scope is emphasis on layout and line assembly and the last scope is to
propose possible optimization of the performance for improving the selected
manufacturing system.
1.5 COMPANY BACKGROUND
Twin Star Furniture Marketing is a furniture manufacture company. The
company started in year 1989; almost 10 years history. The factory is located in Batu
Pahat; Johor. The factory address is 6, Jalan Budi 15, Taman Industri Wawasan,
83000 Batu Pahat, Johor.
The owner of this company is Pua Siew Lian. The company now is operating
by 2nd generation. The main product of this company is sofa. Besides that, the
company also produces bed. It is almost 70% of the product is sofa. The company
produces many types of sofa.
The factory has around 40 workers. All the workers are labour. The labours are
come from Bangladesh. Basically, Twin Star Furniture Marketing is a supplier. The
company will send the product to the customers which are traders. The traders will
sell the products in shops. The company main customers are in Singapore.
4
1.6 PROBLEM STATEMENT
Many of the factories especially the small scale factory have less awareness on
manufacturing system optimization and lack of knowledge about it and just follow the
traditional way of management. The company do not realize the benefit of the
manufacturing system.
The knowledge of manufacturing system can be use to improve the system of a
factory to get a better performance. It can help to increase productivity and reduce
waste to get more profit. So, it is important for factory to learn the knowledge of
manufacturing system so that they can face the competition from others factory and
they can survive even facing competition from bigger factory.
CHAPTER 2
LITERATURE REVIEW
2.1 INTRODUCTION
This chapter introduces the fundamental concepts that are necessary to
understand and step using to improve the manufacturing system of factory. There are
including the classification of manufacturing system and procedure to implement
manufacturing. It will briefly discuss about the layout and work measurement to make
our work more efficiency.
2.2 MANUFACTURING SYSTEM
Manufacturing system is defined to be a collection of integrated equipment and
human resources. The integrated equipment includes production machines, tools,
material handling, work positioning devices and computer system. Human resource is
the people who perform the process on the raw material to become a product.
Manufacturing system can classification based on the factors that define and
distinguish the different types. The factors are: (1) types of operations performed, (2)
number of workstations and system layout, (3) level of automation, and (4) part of
product variety. The four factors are defined in Table 2.1.

6
Table 2.1: Factors in Manufacturing Systems Classification
Factor AlternativesTypes of operations performed
Processing operations versus assembly operationType of processing or assembly operation
Number of workstations and system layout
One station versus more than one stationFor more than one station, variable routing versus fixed routing
Level of automation Manual or semi-automated workstations that require full-time operation attention versus fully automated that require only periodic worker attention
Part of product variety All work units identical versus variations in work units that require differences in processing
Source: Groover (2001)
2.2.1 Types of Operations Performed
Types of operations performed are (1) processing operations on individual
work units and (2) assembly operations to combine individual parts into assembled
entities. Other parameters to determining the manufacturing system are type of
material processed, size and weight of the part or product, and part geometry.
Manufacturing system that performs machining operations must be distinguished
according to whether they make rotational or non-rotational parts. The distinction is
important because machining processes, machining tool required and material
handling system must be engineered differently for the two cases.
2.2.2 Number of Workstations and System Layout
Number of workstations exerts a strong influence on the performance of the
manufacturing system in terms of production capacity, productivity, cost per unit, and
maintainability. Amount of work that can accomplish by the system will increase with
the increase in the number of work station. It will also make the system become more
complex and therefore more difficult to manage and maintain. The layout of the
stations is an important factor to determine the most appropriate material handling
system.
7
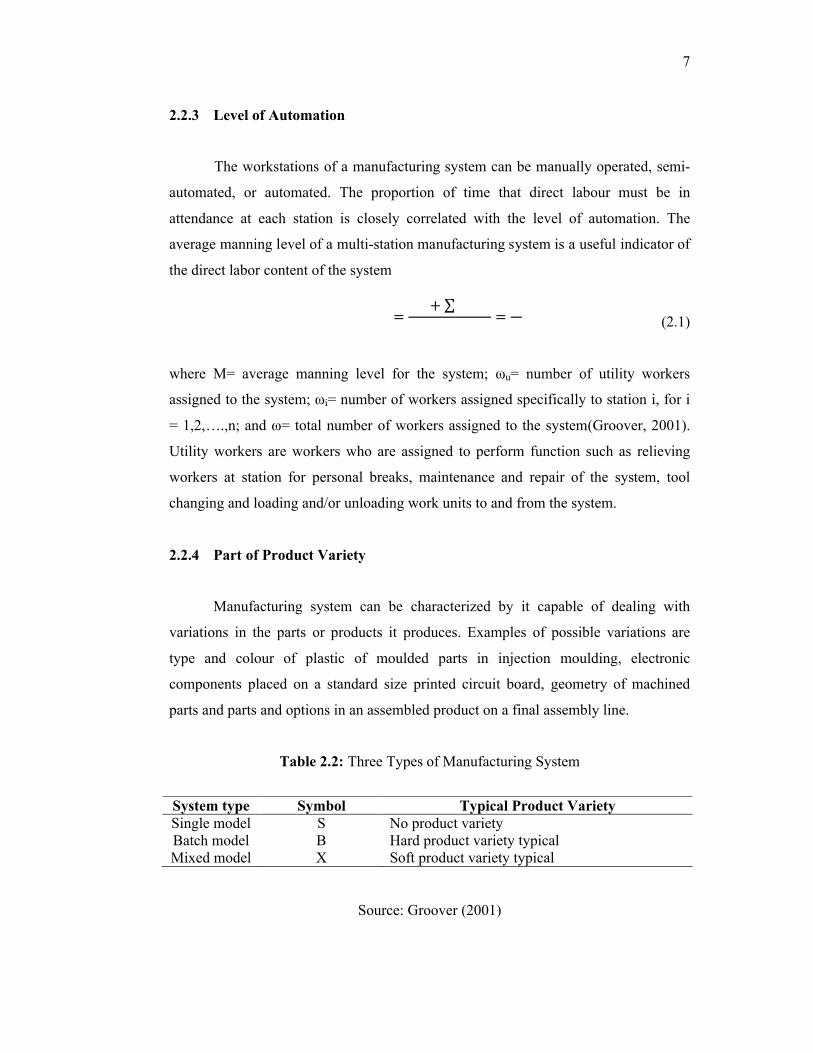
2.2.3 Level of Automation
The workstations of a manufacturing system can be manually operated, semi-
automated, or automated. The proportion of time that direct labour must be in
attendance at each station is closely correlated with the level of automation. The
average manning level of a multi-station manufacturing system is a useful indicator of
the direct labor content of the system
(2.1)
where M= average manning level for the system; ωu= number of utility workers
assigned to the system; ωi= number of workers assigned specifically to station i, for i
= 1,2,….,n; and ω= total number of workers assigned to the system(Groover, 2001).
Utility workers are workers who are assigned to perform function such as relieving
workers at station for personal breaks, maintenance and repair of the system, tool
changing and loading and/or unloading work units to and from the system.
2.2.4 Part of Product Variety
Manufacturing system can be characterized by it capable of dealing with
variations in the parts or products it produces. Examples of possible variations are
type and colour of plastic of moulded parts in injection moulding, electronic
components placed on a standard size printed circuit board, geometry of machined
parts and parts and options in an assembled product on a final assembly line.
Table 2.2: Three Types of Manufacturing System
System type Symbol Typical Product VarietySingle model S No product varietyBatch model B Hard product variety typicalMixed model X Soft product variety typical
Source: Groover (2001)
= + ∑ =
8
Manufacturing systems can be distinguished according to their capability to
deal with variety in the work units produces. For single model, products made by the
manufacturing system are identical. Different products are made by using batch
model. Changeover of the manufacturing system is required because the differences in
product style are significant enough that the system cannot cope unless changes in
tolling and programming are made. Mixed model is also making different products but
the system is able to handle these differences without the need for changeover in setup
or program.
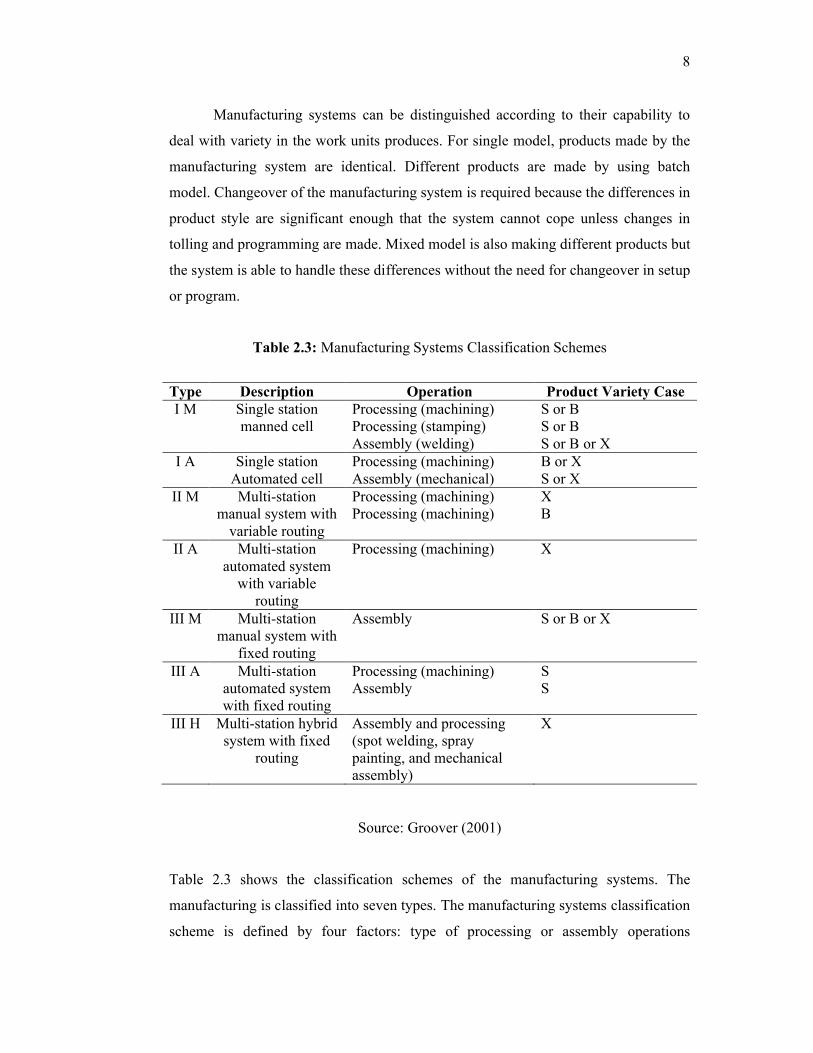
Table 2.3: Manufacturing Systems Classification Schemes
Type Description Operation Product Variety CaseI M Single station
manned cellProcessing (machining)Processing (stamping)Assembly (welding)
S or BS or BS or B or X
I A Single station Automated cell
Processing (machining)Assembly (mechanical)
B or XS or X
II M Multi-station manual system with
variable routing
Processing (machining)Processing (machining)
XB
II A Multi-station automated system
with variable routing
Processing (machining) X
III M Multi-station manual system with
fixed routing
Assembly S or B or X
III A Multi-station automated system with fixed routing
Processing (machining)Assembly
SS
III H Multi-station hybrid system with fixed
routing
Assembly and processing (spot welding, spray painting, and mechanical assembly)
X
Source: Groover (2001)
Table 2.3 shows the classification schemes of the manufacturing systems. The
manufacturing is classified into seven types. The manufacturing systems classification
scheme is defined by four factors: type of processing or assembly operations
9
performed, number of workstations and layout, automation level, and flexibility to
deal with part or product variety.
2.3 LAYOUT
The arrangement of the department in a factory is defined by the general
pattern of work flow. There are four types of layout:
i. Process layout
ii. Product layout
iii. Fixed-position layout
iv. Group technology layout or cellular layout
2.3.1 Process Layout
This layout also called a job-shop or functional layout. It is a format in which
similar equipment or functions are grouped together. A part being worked on the
travels, according to the established sequence of operations, from area to area, where
the proper machines are located for each operation. This type of layout is typical of
hospital, where areas are dedicated to particular types of medical care, such as
maternity wards and intensive care units.
2.3.2 Product Layout
It also called a flow-shop layout. It is one in which equipment or work
processes are arranged according to the progressive steps by which the product is
made. The path for each part is in a straight line. Production lines for shoes, chemical
plants, and car washes are all product layout.

10
2.3.3 Fixed-position Layout
The product in this layout is remains at one location. Manufacturing equipment
is moved to the product rather than moving the product to the equipment. Ship yards,
construction sites and movie lots are example of this layout.
2.3.4 Group Technology or Cellular Layout
This layout is groups the dissimilar machines into work centre to work on
products that have similar shapes and processing requirement. Group technology is
refers to the parts classification and coding system used to specify machine types that
go into the cell. Group technology layout is similar to a process layout in the cell are
designed to perform a specific set of processes, and it is similar to product layout in
that the cells are dedicated to a limited range of products.(Chase, 2001)
Many manufacturing factory present a combination of more than one layout
types. A good factory layout can provide real competitive advantages by facilitating
material, information flow processes and also enhance employees’ work life. Marks of
a good layout for manufacturing system are:
i. Straight-line flow pattern.
ii. Backtracking kept to a minimum.
iii. Production time predictable.
iv. Little inter stage storage of material.
v. Open plant floors so everyone can see what happening.
vi. Bottleneck operations under control.
vii. Workstations close together.
viii. Orderly handling and storage of materials.
ix. No unnecessary rehandling of materials.
x. Easily adjustable to changing conditions.
11
2.4 WORK MEASUREMENT
Work measurement is a term which covers several different ways of finding
out how long a job or part of a job should take to complete. It can be defined as the
systematic determination, through the use of various techniques, of the amount of
effective physical and mental work in terms of work units in a specified task.
Work measurement use to set reasonable targets for the worker and forms a
basis of comparison between work methods and performance of workers. It is
important to know how much time each task taken to carry out line balancing.
The time taken to complete any job is the time which a qualified worker would
take, if working without overexertion throughout a normal period while applying
himself to the job. The definition assumes that the worker has the required knowledge,
skill, attitude and other attributes necessary to carry out the jobs.(Khanna, 2007)
Properly set labour standards represent the amount of time that it should take
an average employee to perform specific job activities under normal working
conditions. Labour standards are set in four ways:
i. Historical experience.
ii. Time studies.
iii. Predetermined time standards.
iv. Work sampling.
2.4.1 Historical Experience
Labour standards can be set by using the labour-hours were required to do a
task the last time it was performed. Historical standards have the advantage of being
relatively easy and inexpensive to obtain. But the accuracy of the standards does not
know, whether they represent a reasonable or a poor work pace, and whether unusual
occurrences are included because these variable are unknown.