design and performance of 40 cm ion optics
TRANSCRIPT
NASA/TM--2001-211275 IEPC-01-090
Design and Performance of 40 cm Ion Optics
George C. SoulasGlenn Research Center, Cleveland, Ohio
Prepared for the
27th International Electric Propulsion Conference
cosponsored by the AFRL, CNES, ERPS, GRC, JRL, MSFC, and NASA
Pasadena, California, October 14-19, 2001
National Aeronautics and
Space Administration
Glenn Research Center
December 2001
This report contains preliminary
findings, subject to revision as
analysis proceeds.
NASA Center for Aerospace Information7121 Standard Drive
Hanover, MD 21076
Available from
National Technical Information Service
5285 Port Royal Road
Springfield, VA 22100
Available electronically at http://gltrs.grc.nasa.gov/GLTRS
Design and Performance of 40 cm Ion Optics
George C. Soulas
National Aeronautics and Space AdministrationGlenn Research Center
Cleveland, Ohio 44135Phone: 216-977-7419
Email: G_L_...!._g._._..(.._._.:._...._.?..u....!._.a.._._(_:2!_.q-_.!._._.!._._`_.!5'
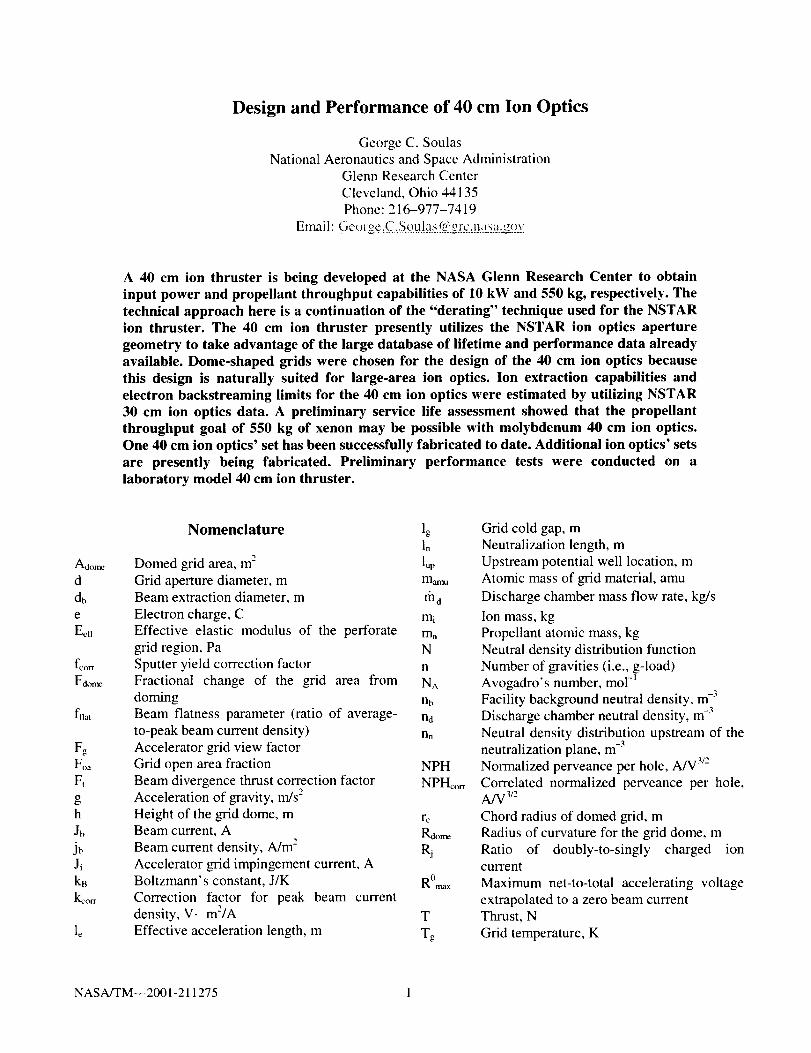
A 40 cm ion thruster is being developed at the NASA Glenn Research Center to obtain
input power and propellant throughput capabilities of 10 kW and 550 kg, respectively. The
technical approach here is a continuation of the "derating" technique used for the NSTARion thruster. The 40 cm ion thruster presently utilizes the NSTAR ion optics aperture
geometry to take advantage of the large database of lifetime and performance data already
available. Dome-shaped grids were chosen for the design of the 40 cm ion optics becausethis design is naturally suited for large-area ion optics. Ion extraction capabilities and
electron backstreaming limits for the 40 cm ion optics were estimated by utilizing NSTAR30 cm ion optics data. A preliminary service life assessment showed that the propellant
throughput goal of 550 kg of xenon may be possible with molybdenum 40 cm ion optics.
One 40 cm ion optics' set has been successfully fabricated to date. Additional ion optics' setsare presently being fabricated. Preliminary performance tests were conducted on a
laboratory model 40 cm ion thruster.
Adome
d
db
e
Eeff
fflat
Fg
Fo.Ft
gh
Jh
jbJi
kB]%orr
le
Nomenclature lg
In
Domed grid area, m2 lu0
Grid aperture diameter, m m_Beam extraction diameter, m rh d
Electron charge, C mi
Effective elastic modulus of the perforate m.grid region, Pa NSputter yield correction factor n
Fractional change of the grid area from NA
doming nbBeam flatness parameter (ratio of average- nd
to-peak beam current density) n,Accelerator grid view factorGrid open area fraction NPH
Beam divergence thrust correction factor NPI-L,,,_Acceleration of gravity, m/s 2
Height of the grid dome, m rcBeam current, A R_on_
Beam current density, A/m-" RjAccelerator grid impingement current, A
Boltzmann's constant, J/K R°m,_xCorrection factor for peak beam current
density, V- mZ/A T
Effective acceleration length, m Tg
Grid cold gap, m
Neutralization length, mUpstream potential well location, m
Atomic mass of grid material, amu
Discharge chamber mass flow rate, kg/s
Ion mass, kgPropellant atomic mass, kgNeutral density distribution function
Number of gravities (i.e., g-load)Avogadro's number, mol -I
-3
Facility background neutral density, m-3
Discharge chamber neutral density, m
Neutral density distribution upstream of theneutralization plane, m -3
Normalized perveance per hole, A/V 3/2
Correlated normalized perveance per hole,m/W 3/2
Chord radius of domed grid, mRadius of curvature for the grid dome, m
Ratio of doubly-to-singly charged ioncurrent
Maximum net-to-total accelerating voltageextrapolated to a zero beam currentThrust, N
Grid temperature, K
NASA/TM--2001-211275 1
Wn
T_
kVb
Vdgeb
Vt lim
Vp_g
• p
V_
V,
Y
z
Neutral propellant temperature, KStiffener temperature, K
Screen grid thickness, m
Beam voltage, VDischarge voltage, V
Electron backstreaming limit voltage, V
Impingement-limited total voltage. V
Accelerator grid pit and groove volumetric
erosion rate per aperture, m3/s
Screen grid volumetric erosion rate per
aperture, m3/s
Accelerator grid aperture wall volumetric
erosion rate per aperture, m3/s
Sputter yield at an orthogonal angle ofincidence
Axial dimension, m
(t
OEg
_s
rid++
Orn_
Veff
P
pelf
(_C -e
(Yhoop r°ax
(_merid max
cp
(Pi
Thrust correction factor for doubly-to-singlycharged ion current
Grid material thermal expansion coefficient,1/C °
Stiffener material thermal expansioncoefficient, I/C °
Discharge chamber propellant utilizationefficiency accounting for doubly chargedions
Maximum dome angle from the grid axialcenterline, rad
Effective Poisson's ratio of the perforate
grid regionPi (3.141593)
Grid material mass density, kg/m 3
Effective mass density of the perforate gridregion, kg/m 3
Charge-exchange cross-section, m2
Peak circumferential (i.e., hoop) stress, PaPeak meridional stress, Pa
Neutral transparency of the ion optics
Screen grid transparency to discharge ions
Superscriptsa Accelerator grida,,g Averageaw, Charge-exchange ions created downstream
of the neutralization planehot Temperature during thruster operation
n Orthogonal to the grid surfaceNSXAR NSTAR ion thruster
pk Peak
n Room temperature
Screen grid
up Charge-exchange ions created upstream of
the neutralization plane• Per aperture
+ Singly charged ion++ Doubly charged ion
Subscripts. Accelerator grid
Screen grid
Introduction
The success of the NSTAR (i.e., NASA Solar Electric
Propulsion Technology Applications Readiness
Program) 30 cm ion thruster system on the DeepSpace 1 mission has demonstrated the viability of ion
• 12propulsion for deep space missions. As a result, ionpropulsion is a candidate for several deep space
missions, such as the Neptune Orbiter, Titan Explorer,Mars Sample Return, Europa Lander, and others.
However, ion propulsion system mass and volumecould be significantly reduced for many of these
missions by increasing the NSTAR thruster's
propellant throughput and peak input powercapabilities beyond the 140 kg and 2.3 kW,respectively, demonstrated by past and ongoing weartests >5 Propulsion system mass and volume
reductions occur because fewer thrusters and,
therefore, fewer accompanying power processors and
propellant feed system components, would berequired.
Increasing propellant throughput and thruster power islimited, in part, by sputter erosion of the ion optics. 6'7
Significant charge-exchange accelerator grid sputtererosion can lead to electron backstreaming due toaccelerator aperture enlargement, grid structural
failure due to pit and groove erosion of the
downstream surface, or an unclearable grid short by aflake from sputter-eroded accelerator grid material.
Significant screen grid sputter erosion by dischargechamber ions can lead to structural failure of the
screen grid, as well as exacerbating theaforementioned accelerator grid failure mechanisms
from direct beam ion impingement.
Long duration tests in the NSTAR program 3-s and
others 6'7 have demonstrated, however, that sputter
erosion of the downstream surface and aperture walls
NASA/TM--2001-211275 2
of the accelerator grid must be addressed to increase
ion optics" longevity. Wear test results from Ref. [3]have shown that screen grid sputter erosion is minimal
for the NSTAR thruster, likely due to the derated
operating conditions of this engine. Although screengrid erosion must be addressed in any ion optics"service life assessment, lifetimes well beyond those
demonstrated in Refs. [3] to [5] are expected as long as
the low discharge voltages and plasma densities are
maintained and the ratio of doubly-to-singly charged
ions is not significantly increased.
Several methods of extending ion optics" service life
are presently being pursued at the NASA GlennResearch Center (GRC). s One method involves
changing the ion optics" material to one with a lower
volumetric sputter erosion rate than molybdenum. Grid
material technologies presently investigated includecarbon-based materials, titanium, and ion-implantedmaterials. 8-_j Another method for increasing ion optics
service life involves increasing the accelerator grid
thickness to provide more material for sputtererosion. 1-"This prevents the loss of the large database
already available with molybdenum ion optics while
providing an anticipated 2x improvement inaccelerator grid service life. While all of these
methods allow for increases in thruster propellant
throughput and input power, most improvements areanticipated to be modest if the 30 cm thruster diameteris maintained. 9
To obtain input power and propellant throughputcapabilities of 10 kW and 550 kg, respectively, a40 cm ion thruster is being developed at NASA
Glenn. 13This engine has twice the beam area as theNSTAR 30 cm ion thruster, whose beam diameter is
28 cm. The technical approach here is a continuation
of the "derating" technique used for the NSTAR ionthruster. With regards to the ion optics, this approachmaintains low beam current densities across the ion
optics to extend ion optics service life. Therefore, the40 cm ion thruster can, at minimum, double input
power and propellant throughput per thruster for thesame thrust densities as the NSTAR thruster. The
40 cm thruster can further offer increased input power
and propellant throughput when other grid
technologies are used, such as thick-accelerator-grid(TAG) ion optics.12
This paper reports on the preliminary results of thedevelopment of 40 cm ion optics for the 40 cm ion
thruster. Results to date include ion optics design
considerations, and preliminary service lifeassessments and test results.
Design Considerations
Ion Thruster Performance Goals
The design goals of the 40 cm ion thruster include a
1 to 10 kW input power throttling range and a 550 kgxenon propellant throughput capability. Emphasis was
placed on providing a flat beam profile to furtherimprove ion optics service life. j3 This improvement
occurs because several ion optics failure mechanisms
are a result of the local sputter erosion of the ion opticsthat are a function of the local beam current density.
Ion Optics' Geometry PerformanceThe 40 cm ion thruster is presently envisioned to use
the NSTAR ion optics aperture geometry, described inRefs. [14] and [15], and the thick-accelerator-grid
geometry, described in Ref. [12]. The following
analyses will focus on the use of the NSTARgeometry. Analyses with this aperture geometry allow
the 40 cm thruster to take advantage of the largedatabase of lifetime and performance data already
available with this geometry.
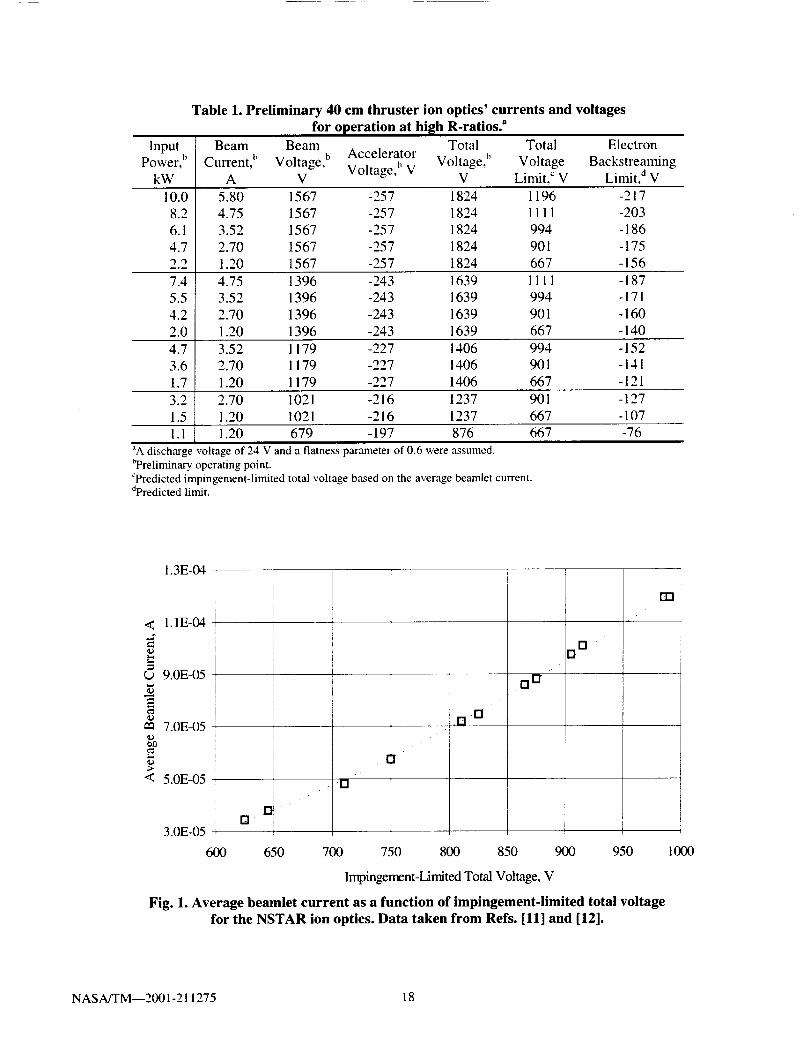
The ion extraction capability of the 40 cm ion opticswas analyzed first. Because the ion optics" aperture
geometry of the NSTAR thruster was utilized, 30 cmion optics data could be used to predict 40 cm ion
optics' performance. Average beam currents peraperture (or beamlet currents) as a function of the
impingement-limited total voltage for an NSTAR ionthruster are shown in Fig. 1. _'12 The impingement-
limited total voltages were defined as the voltagewhere the slope of the accelerator current as a function
of total voltage (i.e., the sum of the absolute values ofthe beam and accelerator power supply voltages) was-0.02 mA/V.
The ion extraction capability of a given aperturegeometry can be correlated to other operating
conditions by utilizing a normalized perveance perhole (or NPH):
NPH = Jb . 1_ (1)
vtLm_
where J'h is the beamlet current, Vt_ is the
impingement-limited total voltage, ds is the screen
NASA/TM--2001-2 t 1275 3
aperturediameter,and1_ is the effective accelerationlength. The effective acceleration length is defined as:
_(1 d_1. = g +L_)2 + "4 , (2)
where l,g is the grid gap and t_ is the screen grid
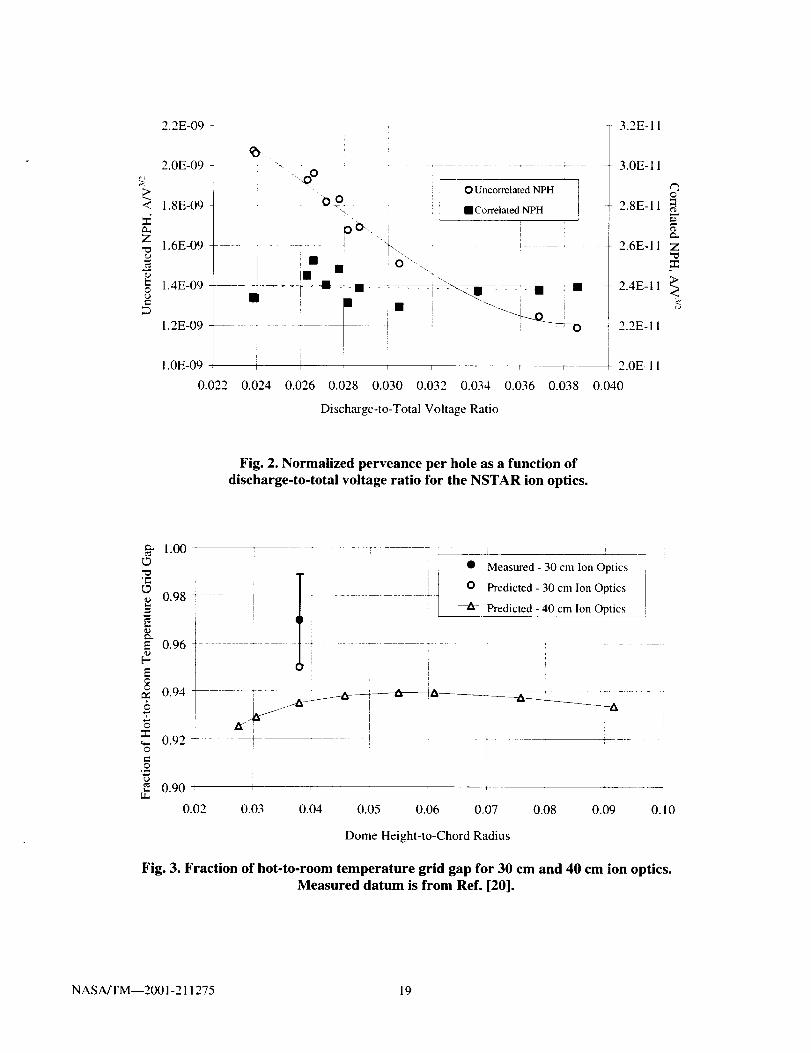
thickness. The impingement-limited normalizedperveance per hole for the NSTAR ion optics is plotted
in Fig. 2 as a function of discharge-to-total voltageratio. As the figure demonstrates, the normalized
perveance per hole is a function of the discharge-to-total voltage ratio. This effect has been noted in other
studies 16"_vand can be compensated by defining a
correlated normalized perveance per hole (or NPI-Icor_):
/Vd/qNPH_o _ = NPH t Vttim ) (3)
where Vd is the discharge voltage. ]6 In Ref. [16], q was
set to 0.2, however, a value of 1.2 was found to yieldconstant correlated value in this study. The correlated
normalized perveance per hole for the NSTAR ionoptics is also plotted in Fig. 2. As Fig. 2 shows, the
correlated normalized perveance per hole is
approximately 2.4×10 -H A/V 3/2 for the NSTAR ion
optics" aperture geometry.
Total voltages for the 40 cm thruster may bedetermined by using the correlated normalized
perveance per hole to determine the impingement-
limited total voltage for a given beam current, and thenadding voltage margin to the predicted limit. Oneselection criterion for the total voltage at a given beam
current was that the total voltages provide a minimum
perveance margin (i.e., the difference between the total
voltage during normal operation and the impingement-limited total voltage) of at least 200 V.
High specific impulses are typically best suited for the
deep space missions anticipated for the 40 cm ionthruster. This generally results in thruster operation at
high R-ratios (i.e., net-to-total accelerating voltages),and, therefore, high accelerator voltages. These high
accelerator voltages are beneficial because they reduceaccelerator grid erosion rates and, therefore, extend grid
service life. The upper limit of the accelerator voltage islimited, however, by the onset of electron
backstreaming. This electron backstreaming limit canbe estimated with a semi-empirical equation derived byKaufman for the maximum R-ratio as a function of the
ion optics' aperture geometry, z8 However, since the
40 cm ion optics' aperture geometry is the same as that
for the NSTAR ion optics, electron backstreaming limitdata from NSTAR ion optics" tests can be used._L_2
The electron backstreaming limit and, therefore, the
maximum R-ratio, are also functions of the peakbeamlet current. This peak beamlet current is directlyproportional to the peak beam current density just
downstream of the ion optics, and, therefore,
proportional to the beam curl'ent density divided by thebeam flatness parameter (i.e., average-to-peak beamcurrent density). _°'_] Data with the NSTAR 30 cm ion
optics from Ref. [11] shows that this relation is a
function of beam power supply voltage and may be
nonlinear. However, the electron backstreaming can be
conservatively estimated by assuming a -1 V per1 A/m 2 dependence on the peak beam current density.
The electron backstreaming limit (or Veb) for the40 cm ion thruster can, therefore, be estimated by:
.(l-R°, ) 4"JbV_b=V b _ R0m_ -t- rt'd;_ 'fn_ "kco_. (4)
Here, Jb is the beam current, db is the beam extraction
diameter, fn._tis the beam flatness parameter, kcor_is thecorrection for peak beam current density (i.e., -1 V per1 A/m2), and R°m_xis a maximum R-ratio extrapolatedto a zero beam current. The value for R°m_x for the
molybdenum 30 cm ion optics tested in Ref. [11] was
determined to be 0.918. Equation (4) predicts 30 cmion optics' electron backstreaming limits to within+15 V/-5 V.
For operation at high R-ratios, the selected accelerator
voltage was determined by adding voltage margin to
the predicted electron backstreaming limit.
A preliminary throttle table for the 40 cm ion thruster
was developed based, in part, on the predictedL_
performance of the ion optics" aperture geometry.Results relevant to the ion optics are shown in Table 1
for operation at high R-ratios. Assumptions for these
proposed throttling points include a 24 V dischargevoltage and a beam flatness parameter of 0.6. As the
table shows, the lowest perveance margin wasestimated to be 209 V. This value occurred at the
lowest thruster input power. The lowest electronbackstreaming margin (i.e., the difference between the
absolute values of the accelerator voltage and electronbackstreaming limit) occurred at the highest beam
voltage and current and was estimated to be 40 V.
NASA/TM--2001-211275 4
Grid Design ConsiderationsDome-shaped grids, similar to those used on the
NSTAR thruster, were chosen for the design of the
40 cm ion optics. This was because dome-shaped gridsare naturally suited for large-area ion optics. Reasonsfor this included: 1) the dome shape mitigates
thermally induced buckling during thruster operation,
and, therefore, provides a relatively stable grid gapthroughout the ion optics" area; and 2) the dome shape
provides stiffness under vibration loads during launch.
Furthermore, there is design heritage with this grid
design at NASA Glenn.
As discussed in previous sections, the NSTAR ionoptics" aperture geometry was utilized for the 40 cm
ion optics. As a result, the beam extraction diameter,grid thicknesses, and perforated geometries were fixed
for the 40 cm grids. The only remaining, adjustableparameter was the dome height. It will be shown in the
following paragraphs that selecting a dome height-to-
chord radius similar to that of the NSTAR gridsaddressed most key issues associated with grid
fabrication and thruster operation while having little
impact on other issues concerning thermal expansionand launch stresses.
Fabrication Issues
The grid dome shape is hydrostatically formed, aprocess developed by NASA Glenn in 1972, _9and the
apertures are photo-chemically etched. The primary
concern regarding grid fabrication was that over-forming the 40 cm grids could result in aperture
misalignment, significant residual stresses, andpossibly even fracture the grid material. Since a grid is
under a biaxiat state of stress during forming (gridthicknesses are small enough to assume a thin-walled
membrane), then the fractional change in area as aresult of the forming process is the relevant parameter
here. It can be shown that the area of the domed gridfor Aao,_) is given by:
where h is the dome height and rc is the radius at thedome base, or the chord radius. The fractional change
in area from forming (or Fdom_)is, therefore, given by:
' drome h- (6)g.r_-
As the equation shows, the fractional change inarea from forming is a function of the dome
height-to-chord radius. Maintaining the same ratio asfor the NSTAR 30 cm grids will, therefore, mitigate
over-forming the 40 cm grids.
Thruster Operation IssuesTwo thruster operation issues were identified for the
40 cm ion optics. These included thrust losses due tothe dome shape and thermally-induced changes in the
grid gap.
The thrust losses considered here are caused by the
shape of the dome, which directs beamlets off-axis.
The following analysis is similar to that done inRef. [19]. The apertures of the NSTAR and 40 cm
screen and accelerator grids are designed to be alignedthroughout the grids' radius, with no beamlet steeringto collimate the beam. As a result, beamlets are
directed normal to the surface of the grids. The thrust
(or T) produced by a domed grid can, therefore, be
expressed as:
T= 2"Vbm • j_ •oz. Fin •R_ome.cos 0. sin 0. d0.d_e
0 0
(7)
Here, Vb is the beam voltage, mi is the ion mass and e
is the electron charge. Within the double integral, 0m_xis the maximum angle from the centerline of the grids,
jbn is the beam current density normal to the gridsurface, Raom_is the radius of curvature of the dome,
ot is the double-to-single ion current correction factor,and Ftn is the beamlet divergence correction factor that
does not account for divergence from the grid dome
shape. The latter term is used to separate beamdivergence due to beamlet expansion from beamdivergence due to the dome shape. To simplify this
analysis, it will be assumed that the beam current
density normal to the grid surface and the ratio ofdouble-to-single ion current are constant throughout
the grid. The beam current density can, therefore, bereduced to the beam current divided by the area of the
dome. Equation (7) can be expressed as:
T =,[2" Vb •m i n J - • R_ome sin-"•o_.F, .______b n (8)V e A dome
It Can be shown that the last two terms in the equationabove reduce to rc 2. Using this and equation (5),
equation (8) reduces to:
[ ( )2] -1hT _]v2"Vb'mi += e •0_"Ftn" Jl_ • 1 7 . (9)
NASA/TM--2001-211275 5
As thisequationshows,thethrustis afunctionof thedomeheight-to-chordradius.Maintainingthe sameratio as that for the NSTAR 30 cm grids will,therefore,keepthesethrustlossesdueto the domeshapeof thegridsthesamefor the40cmgrids.
Grids thermallyexpandduring thrusteroperation,whichcanchangethegrid gap whenthe gridsareheatedto their final operatingtemperatures.Ananalysiswasconductedto compare30cmand40cmgridsunderthermalloads.Thefollowingsimplifyingassumptionsweremade(similartothosein Ref.[19]):1) eachgridandits mountingringwereatuniform,butdifferent,temperatures;2) thefinalshapeof theheatedgridsis spherical;3) bothgrid diametersinvestigatedhad the same temperaturesand temperaturedistributions;and4) thereareno thermally-inducedmeridionalstresses.Thechordradiusandarc lengthacrossthegrids(orS)duringoperationaregivenby:
hot " (1+ ¢x, AT_), and (1O)r c = r c • .
shot=s" ATe). (ll Here, c_ and Otgare the thermal expansion coefficients
for the stiffener and grid materials, respectively, while
AT_ and ATg are the change in temperatures for thestiffeners and grids, respectively. The "rt" and "hot"
superscripts denote parameter values at roomtemperature and temperatures during thruster
operation, respectively. With equations (10) and (11),it can be shown that:
arcsin( r¢" ('R,_+_ .ATe))] R h"_"_ = arcsinf _r"_---_-"( g_o,_ )1' R_'m_ "(1 +or-ATg )'
(12)
where the radius of curvature for the heated grid is
solved iteratively. Since it is known that:
h = R dome -- R dome-- r_-, (13)
the height of the heated grid can be solved withequations (12) and (13).
Temperatures for this analysis were taken from
Ref. [20] for a NASA J-Series 30 cm ion optics set
operated at a discharge power of 210 W, which issimilar to the NSTAR thruster at a 1.44 kW input
power of and a 1.1 A beam current. Radial gridtemperatures profiles were curve-fit with second order
polynomial equations and integrated to determineaverage grid temperature changes. The thermal
expansion of the grid-mounting hardware was also
included in the analysis. Note that the results for the
40 cm grids would not be applicable to the samedischarge power as for the 30 cm thruster, but would
correspond to a much higher discharge power (and,
therefore, beam current) since the 40 cm grids have alarger thermal mass. Furthermore, the temperature
distribution across the grids and mounting hardware
would not necessarily be the same because of thedifferent thermal environments of the two thruster
sizes. Regardless, the aforementioned assumptions are
only intended to provide a comparison for the two griddiameters.
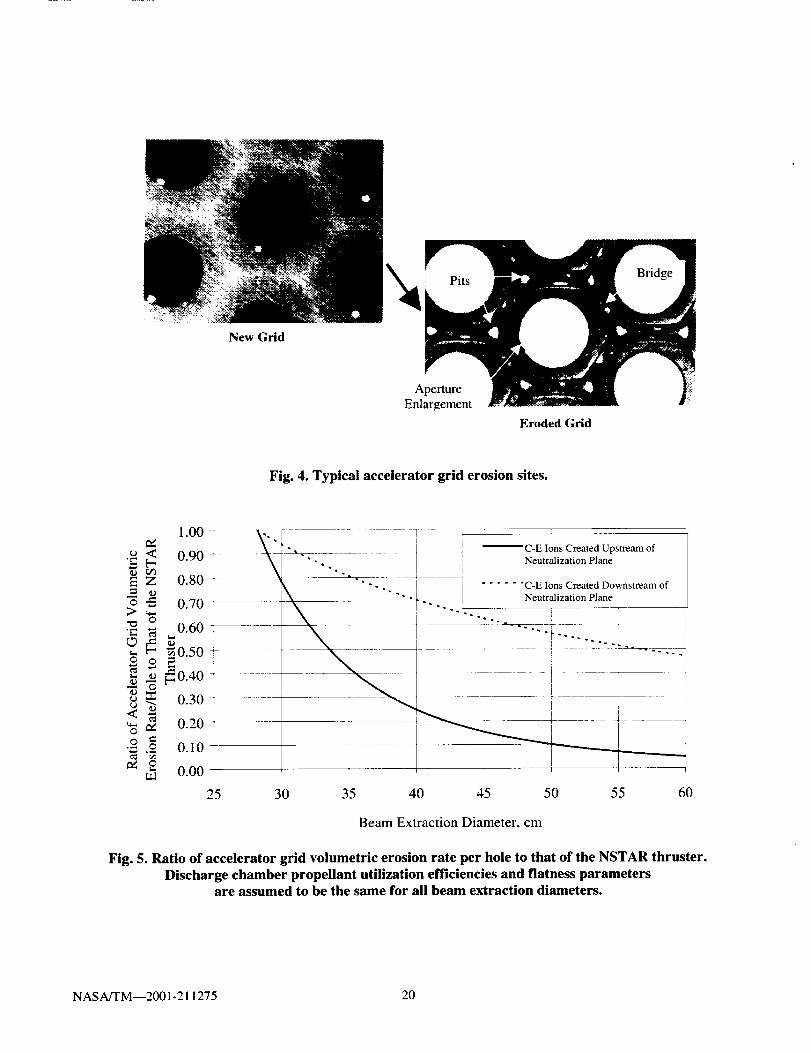
Analysis results are shown in Fig. 3, where the fraction
of the hot-to-room temperature grid gap is plotted as afunction of dome height-to-chord radius. The predicted
fraction for the 30 cm ion optics was at the loweruncertainty limit of the measured value, indicating that
the model reasonably predicts thermally-induced gridgap changes at this power level. As Fig. 3 further
demonstrates, the predicted results for the 40 cm ion
optics show that: 1) there is very little change in thefraction of the hot-to-room temperature grid gap over awide range of dome height-to-chord radius ratios; and
2) the overall hot grid gap is about 2% smaller than
that for the 30 cm ion optics at steady-state conditions.Because the dome height-to-chord radius ratio has
little effect on the grid gap during steady state thrusteroperation, it is reasonable to utilize the same ratio as
that for the NSTAR 30 cm grids so that fabricationissues and thrust losses are mitigated.
Launch Stress Issues
The two spacecraft launch issues examined included
vibration-induced stresses and grid movement. Inorder to simplify the analysis, it was assumed that final
shape of the grids under these stresses was spherical,which requires grid deflections to be small.
Furthermore, only grid vibrations in the axial direction
were examined. Since the apertures significantlyweaken the perforated grid regions, these regions wereanalyzed. The perforated regions were assumed to
have a tangential top edge support. For thin-walledspherical domes under axial loads from there own
mass, peak meridional and circumferential (i.e., hoop)
stresses (or Om_ndm_ and ($hoop max, respectively) aregiven by: 2_
n.g.peu "Rdom_, and (14)Om_m_id= 1 + COS(0m_ )
NASA/TM--2001-211275 6
n. g. Peff " Rdome (15)max
(_ hoop = 2
Here, n is the number of gravities (i.e., g-load), g is the
acceleration of gravity, and PaJ is the effective massdensity of the grid perforated region. Note that
l+coS(0m_x) -----2 for all cases examined here, so that itcan be assumed that the meridional and
circumferential stresses are approximately equal.
Solving equation (13) for Rdom_,it can be shown that:
l+(h)2m_ _ n.g. p_ff (16)
(Ymerid = O'hoop -- 4 "rc ' h
re
As the above equation shows, maintaining a constant
dome height-to-chord radius will still result in a stressincrease proportional to the chord radius. An
unchanged dome height-to-chord radius wouldincrease meridional and circumferential stresses by
about 40% for the 40 cm grids. However, increasing
dome height-to-chord radius to account for theincreased stresses in the 40 cm grids would worsen
thruster performance. To determine the significance ofthese increased stresses, maximum meridional and
circumferential stresses were calculated for these grids
as a function of g-loading. These values were thenused to determine the maximum webbing stresses 22
and compared to the yield strength of the grid materialto determine if the 40 cm grids were at risk of plasticdeformation under launch loads in the axial direction.
The resulting maximum stresses were found to be
significantly smaller than the material yield stress,even at high g-loads.
Note that this analysis omitted stresses resulting from
radial motion, which should be included in any
complete analysis. Unfortunately, this was beyond thescope of this initial effort.
Vibration-induced axial motion was also examined.
The same assumptions as the prior analysis weremade. For thin-walled spherical domes under axial
loads from their own weight, the change in domeheight (or Ah) is given by: 2j
Ah= n g Pen "R_'_ [sin2(0ma_)+(1+ v_et)"ln{Ee_ 1+cos(0,,_x2) )].
(17)
Here, ECn and vCtt are the elastic modulus and
Poisson's ratio, respectively, for the perforated regionof the grids. 2-_It can be shown that:
l(h)cos(o=.,)-- (., and (18)+ h -
():h
sin 2 (0r_,) = 1- (19)
Both equations are merely functions of the initialdome height-to-chord radius. Solving equation (13) for
Rdom_,equation (17) can be given:
1+ h
n-g-paf.k rg. (20)Ah- • "
Eeff 2' --h '
rc
where:
k=sin2(0m_')+(l+veff)'ln( 2 ))l+cos(0_ " (21)
As equations (18) to (21) show, maintaining a constantdome height-to-chord radius will still result in a
change in dome height proportional to the chord radiussquared. Maintaining a constant dome height-to-chord
radius would, therefore, approximately double gridmovement for the 40 cm grids. If this grid movement
is large enough, the grids could make contact undervibration loads. This occurrence, however, is not
necessarily detrimental to the grids. Both the NSTAR30 cm grids and 50 cm were found to make contactunder vibration loads without detrimental effects. 2324
As a result, this is not expected to be an issue for the40 cm grids.
Preliminary Service Life Assessment
A preliminary service life assessment was conductedto determine the lifetime gain by utilizing 40 cm ionoptics. Service life analyses included sputter erosion of
the downstream surface (i.e., pits and grooves) and
NASA/TM--2001-211275 7
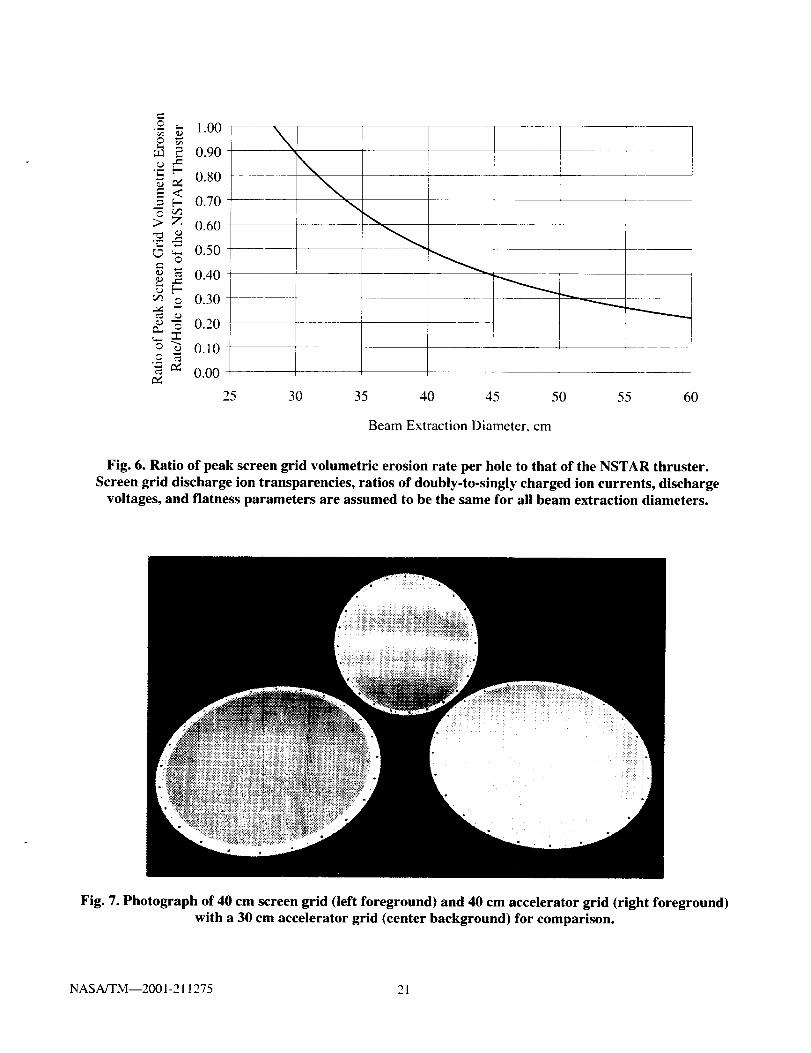
aperturewallsof theacceleratorgrid,shownin Fig.4,and sputtererosionof the upstreamsurfaceof thescreengrid.
Accelerator Grid
Accelerator grid erosion is caused by charge-exchangeions created both upstream and downstream of the
neutralization plane that bombard the accelerator grid.Accelerator grid erosion from direct impingement of
beam ions is assumed to be negligible here. Charge-exchange ions created upstream of the neutralization
plane sputter-erode both the aperture walls and the
downstream surface of the accelerator grid, whilethose created downstream of the neutralization plane
only sputter-erode the downstream surface (see Fig. 4).
This assertion has been demonstrated, in part, byseveral numerical modelsY -28 It was also verified via
testing where a two-grid system that was tested at highbackground pressures exhibited excessive pit and
groove erosion of the downstream accelerator grid butlittle accelerator aperture enlargement] 9'3°
The volumetric erosion rate in the region of a single• p
accelerator grid aperture (or V.... l) can be expressed
as:
• pup ) • rdwn• , = (,Q,up + Vp_g + Vp__ . (22)Vacccl \ w
• p
Here, 9_ and Vp_g are the volumetric erosion rates of
the aperture walls and pit and groove erosion,respectively, in the region of an aperture. The "up" and
"dwn" superscripts denote that charge-exchange ions
were created upstream and downstream of theneutralization plane, respectively. The variables in thisequation can be expressed as:
"v"_'P+ "Q'uP j_up m_mu . Y" fcho_rand (23)--p-g
e.p, N A
j,dwn a_Qpdwn -i mamu p-g--p-g = ' Y'fco,_. (24)
e.p_ N A
Here, J'i is the impingement current per aperture, m"_m,
is the atomic mass of the accelerator grid material, pais the mass density of the accelerator grid, e is the
electronic charge, NA is Avogadro's number, Y is the
grid sputter yield for an orthogonal angle of incidence,and fco,, is a sputter yield correction factor. This
correction factor accounts for non-orthogonal angle-of-incidence sputtering, variations in ion sputtering
energies, re-deposition of sputtered material, and any
other sputtering phenomena that can affect volumetricsputter erosion. Note that the prime superscripts
denote parameter values per aperture. The
aforementioned equations could be expressed withoutthe prime superscripts to define the volumetric erosion
rates for the entire accelerator grid.
All of the above variables are known except for the
impingement currents per aperture and the sputteryield correction factors. These impingement currents
are from charge-exchange ions created both upstreamand downstream of the neutralization plane. These
currents will be determined here as was done byMonheiser and Wilbur, 3j_2 but with some
modifications. The charge-exchange ion production
current per aperture is given by:
In
j,up , fi =Jb "lJc-e ' n n .dz, and (25)
lup
j,aw° , iF _i = Jb ' Oc--e " • n b - dz. (26)
In
Here, J'b is the beamlet current, ___ is the charge-
exchange cross-section, nn is the neutral densitydistribution upstream of the neutralization plane from
discharge chamber neutrals, nb is the vacuum facilitybackground neutral density, z is the axial dimension,
l_p is the upstream location of the potential well thattraps charge-exchange ions in this region, and In is the
neutralization length. Fg is the accelerator grid viewfactor for a charge-exchange ion created downstream
of the neutralization, and, therefore, represents theprobability that a charge-exchange created in this
region will impinge the accelerator grid. Theassumptions for equation (26) include, in part:
1) potential gradients in the downstream beam plasma
are too small to divert charge-exchange ions; and2) the facility background neutral density has isotropicvelocity distribution.
Equations (25) and (26) differ from those derived byMonheiser and Wilbur in the following ways. First, the
integral in equation (25) has luo as the upstream limitand not the accelerator grid downstream surface. This
is because this upstream axial location more accurately
defines those charge-exchange ions trapped in thisregion by the electrode potential gradients. Second, the
integral in equation (25) does not include thecontribution of the facility background neutral density.
NASA/TM--2001-211275 8
This simplifyingassumptionis valid if backgroundfacilitypressuresarekeptlow.Thisappearedtobethecase for the NSTAR thrusteroperatedat NASAGlenn'sVacuumFacility 5, wherecomparisonsofacceleratorcurrentsproducedin this facility to thoseproducedontheDeepSpace1spacecraftwerewithin0.4mA (e.g.,lessthan10%of thetotal impingementat 2 kW).2 Finally, the contributionof neutralsescapingthe dischargechamberdownstreamof theneutralizationplanewereomittedin equation(26).Thisis becausetheseneutralsdonothaveanisotropicvelocity distribution, but a velocity distributiondirected away from the acceleratorgrids, and,therefore,shouldbeomitted.
It will beassumedhere,aswasdonebyMonheiserandWilbur,_k32thattheneutraldensitydistributionalongthe axisof anaperturecanbeapproximatedby thedischargechamberneutraldensity,nd,multipliedbyadistributionfunction,N(z),sothat:
In 1,,
J'no I (z)-az,lup ]up
where N(z) is only a function of the ion optics'aperture geometry. Furthermore, the same one-
dimensional view factor utilized by Monheiser and
Wilbur will be used here. Equations (25) and (26) can,therefore, be re-written as:
In
j,up , f ()i =Jb'(_c-_'nd" N z .dz,and (28)
[up
•,dwn Jb'O_-_ .nb +1 -1. , (29)Ji - 2
where db is the beam extraction diameter. It can be
shown that 1, << db, SO that equation (29) can beexpressed as:
p
-iJ'dWn_ Jb "(Yc-e"nb ' db (30)4
Because equation (30) utilizes a one-dimensional view
factor approximation, it will only accurately predictimpingement current contributions for apertures at theaccelerator grid center, assuming small beamlet
divergence half-angles. Equation (30) over-predicts
impingement current contributions for aperturesradially away from the accelerator grid center.Equation (30) also over-predicts impingement currents
because potential gradients in the beam plasma were
assumed to be too small to divert charge-exchange
ions from the accelerator grid. Plasma potentialmeasurements in NSTAR thrusters have demonstrated
that there are radial and axial potential graalents.
Although these voltage gradients are only on the orderof a few volts, charge-exchange ions produced in this
region have significantly lower energies and can,
therefore, be directed away from the grids.
The discharge chamber neutral density is determined
by:L _ "_
.]r_. m, .k B .Y n(p.d_32
Here, rla_ is the discharge chamber propellant
utilization efficiency accounting for doubly charged
ions, m a is the discharge chamber flow rate, (p is the
ion optics' neutral transparency, nan is propellantatomic mass, kB is Boltzmann's constant, and T. is the
neutral propellant temperature.
Because charge-exchange production is a directfunction of beamlet current, the peak beamlet current
is necessary for determining the maximum localsputter erosion rate of the accelerator grid. This peak
beamlet current is given by:
j_pk =(d_ ]z. Jr, (32)
(db) fn_, "Fs_'
where da is the accelerator aperture diameter, Jb is thebeam current, and Foaa is the open area fraction of theaccelerator grid.
Equations (31) and (32) can be combined with
equation (28) to yield:
j iup_pk dj Jb (i- ,l;+ ).ill d I_- 0___ fN(z).dz"d4 fn"t'F°_ ]lt'm"'kB'T. 'or
(33)
This equation can be used with equation (23) to definethis peak volumetric sputter erosion rate per aperture.
This is because the ion flux from this equation willimpinge the aperture region within which it was
created. However, the impingement current inequation (30) can impinge on any pit-and-groove site
on the accelerator grid. It is, therefore, moreconvenient to utilize an average beamlet current for
NASA/TM--2001-211275 9
equation(30).Theresultingimpingementcurrentcanbeexpressedas:
j,dw....,g Jb " Gc-e 'nb "d_i = (34)4.d b .F_.
The effect of beam extraction diameter on accelerator
grid volumetric erosion rates can now be assessed.Comparisons are made at the same operating electrode
voltages, beam currents, and discharge chamber flowrates, so that the relative effects of beam extraction
diameter can be determined. Because the ion optics'
aperture geometry is unchanged, a peak volumetric
erosion rate per aperture ratio can be established forcharge-exchange ions produced upstream of the
neutralization plane, where:
•Q_up + gp_g",up _ { d NSTAR?
"t" " tup STAR
f NSTAR 0 __ ,lid + )flat
(35)
Here, the "NSTAR" superscripts denote parameters forthe NSTAR 30 cm ion thruster. Note that
equation (35) assumes that changes in 1,p and 1, do notaffect the neutral density distribution integral in
equation (28). It can be shown that this is likely thecase for In due to the long neutralization plane lengths
and the exponential decay of neutral densitydownstream of an accelerator aperture. Although
comparisons are made for the same ion optics"
geometries and electrode voltages, it is presentlyunclear what the exact effect the varying beamlet
current (and, therefore, varying space-charge) will
have on lup.
An average volumetric erosion rate per aperture ratiocan further be established for charge-exchange ions
produced downstream of the neutralization plane,where:
g pdwn rl NSTAR
p-g _ _b (36)• pdwn NSTAR d b
gp_g
It is assumed that background neutral densities are
independent of beam extraction diameter, which isreasonable because discharge chamber flow rates are
assumed unchanged.
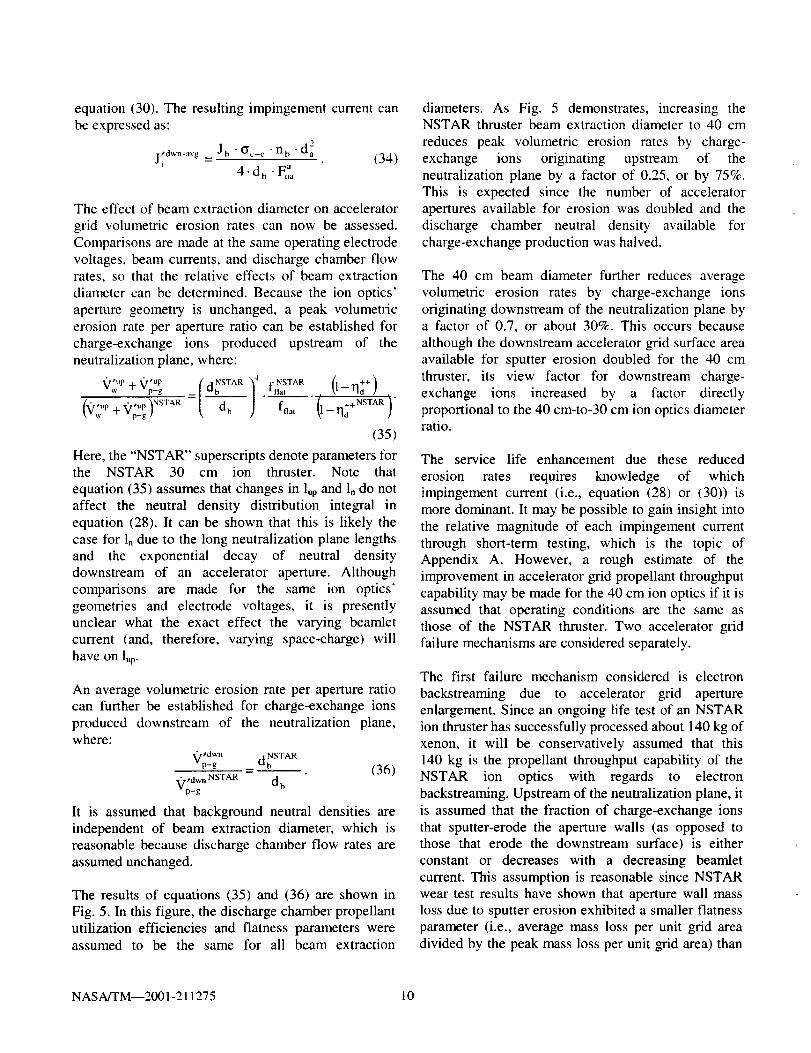
The results of equations (35) and (36) are shown in
Fig. 5. In this figure, the discharge chamber propellantutilization efficiencies and flatness parameters wereassumed to be the same for all beam extraction
diameters. As Fig. 5 demonstrates, increasing theNSTAR thruster beam extraction diameter to 40 cm
reduces peak volumetric erosion rates by charge-exchange ions originating upstream of the
neutralization plane by a factor of 0.25, or by 75%.This is expected since the number of accelerator
apertures available for erosion was doubled and the
discharge chamber neutral density available forcharge-exchange production was halved.
The 40 cm beam diameter further reduces average
volumetric erosion rates by charge-exchange ions
originating downstream of the neutralization plane bya factor of 0.7, or about 30%. This occurs because
although the downstream accelerator grid surface areaavailable for sputter erosion doubled for the 40 cm
thruster, its view factor for downstream charge-
exchange ions increased by a factor directlyproportional to the 40 cm-to-30 cm ion optics diameterratio.
The service life enhancement due these reduced
erosion rates requires knowledge of whichimpingement current (i.e., equation (28) or (30)) is
more dominant. It may be possible to gain insight into
the relative magnitude of each impingement current
through short-term testing, which is the topic ofAppendix A. However, a rough estimate of theimprovement in accelerator grid propellant throughput
capability may be made for the 40 cm ion optics if it isassumed that operating conditions are the same as
those of the NSTAR thruster. Two accelerator gridfailure mechanisms are considered separately.
The first failure mechanism considered is electron
backstreaming due to accelerator grid aperture
enlargement. Since an ongoing life test of an NSTAR
ion thruster has successfully processed about 140 kg ofxenon, it will be conservatively assumed that this
140 kg is the propellant throughput capability of theNSTAR ion optics with regards to electron
backstreaming. Upstream of the neutralization plane, itis assumed that the fraction of charge-exchange ions
that sputter-erode the aperture walls (as opposed tothose that erode the downstream surface) is either
constant or decreases with a decreasing beamlet
current. This assumption is reasonable since NSTARwear test results have shown that aperture wall massloss due to sputter erosion exhibited a smaller flatness
parameter (i.e., average mass loss per unit grid area
divided by the peak mass loss per unit grid area) than
NASA/TM--2001-211275 10
thebeamflatnessparameter.3'34Asaresult,theratioofacceleratoraperturewall volumetricerosionrateperhole of the 40 cm thrusterto that of the NSTARthrusteris equal to equation(35). Assumingthatdischargechamberpropellantutilizationefficienciesandbeamflatnessparametersarethesamefor boththrusters,the40 cm thrusteroffersa 4x increaseinpropellant throughput.The propellantthroughputcapabilityof the40cmthrusteris,therefore,estimatedto beabout560kg for this failuremechanism,whichexceedsthegoalof 550kg.
Thesecondfailuremechanismconsideredis structuralfailureof thegriddueto thepit andgrooveerosionofthedownstreamsurfaceof the acceleratorgrid. Thefailurecriterionhereis assumedto begrooveerosionthrough80%of thegrid thickness.Pit erosionis notconsideredbecauseerosionthroughthegridthicknessdoesnot compromisethe structuralintegrityof thegrid.PastanalysesbasedonNSTARthrusterweartestresultsestimateda propellantthroughputcapabilityoftheNSTARthrusterof about410kg for this failure
• 9
mechamsm. If it is conservatively assumed that
charge-exchange ions created downstream of theaccelerator grid dominate groove erosion, then the
40 cm offers a 1.4x increase in propellant throughput
capability. The propellant throughput capability of the40 cm thruster is, therefore, estimated to be about
570 kg for this failure mechanism, which exceeds thegoal of 550 kg.
The propellant throughput capability of the 40 cmthruster is estimated to be about 560 kg for electronbackstreaming and 570 kg for a structural failure. The
40 cm thruster is, therefore, anticipated to meet the
propellant throughput goal of 550 kg of xenon. (Notethat these preliminary results are rough estimates
subject to the assumptions made for the calculations.)A more accurate service life assessment requires that
detailed analyses be made at the anticipated operatingconditions for the 40 cm ion thruster.
Screen Grid
Screen grid erosion is caused by discharge chamber
ions that sputter erode the upstream surface of thescreen grid. This sputter erosion generally causes a
chamfering of the screen grid apertures. Failure occurswhen the screen grid erosion results in the removal of
the screen grid webbing, allowing beam ions todirectly impinge on the accelerator grid. NSTAR
thruster life testing indicated that screen grid erosionwas peaked at the center on the grid. 3 This is expected
since the center of the grid is where the radial beam
current density, and discharge ion current density just
upstream of the ion optics, is highest.
Discharge chamber particles that sputter-erode thescreen grid include both singly and doubly charged
ions. The screen grid is at discharge cathode potential
and the discharge chamber plasma is typicallyassumed to be at the discharge anode potential. As a
result, singly charged ions are assumed to haveenergies equivalent to the discharge voltage while
doubly charged ions have twice the discharge voltage.
The volumetric erosion rate in the region of a single
screen grid aperture (or _" ) can be defined as:
J'++ m_o y++ _++'Q" = J_+ mamu 'Y+ 'fc'o+-t _ " "fco. "e.p_ N A 2.e.p_ N a
(37)
Here, J'_ is the screen grid current per aperture, m_.
is the atomic mass of the screen grid material, p_ is themass density of the screen grid, and fco. is a sputter
yield correction factor, similar to that used in the
previous section. The "+" and "++" superscriptsdenote parameter values for the singly and doubly
charged discharge chamber ions, respectively.
Note that NASA xenon ion thrusters are typically
operated at discharge voltages of about 25 V, which isa part of the derated approach• As a result, singly
charged ions have energies on the order of the sputteryield threshold energies. 35 Furthermore, sputter yields
increase exponentially with ion energy at theselow discharge voltages. Because the ratio of doubly-
to-singly charged ion current ranges between 0.05 to0.25 for the NSTAR ring-cusp discharge chamber, 3 it
is reasonable to assume that doubly charged ionsdominate screen grid erosion for these thrusters.
Equation (37) can, therefore, be rewritten as:s
,Q, J_++ m_u y++ _++= (38)s 'fco,-,-•2.e.p_ N A
Because screen grid erosion is highest at the center of
the grid, a peak current is necessary for determining
the maximum local sputter erosion rate of the screengrid in equation (38). It can be shown that this peak,doubly charged screen grid current per aperture is
given by:
NASA/TM--2001-211275 11
j_++pk 1-qbi /d_ )2 Jb s Rj- • • (39)_-i _ fnal :Foa I+Rj
Here, _p_is the screen grid transparency to discharge
ions, ds is the screen grid aperture diameter, F_oais the
screen grid open area fraction, and Rj is the ratio ofdoubly-to-singly charged ion current. Note that
equation (39) assumes that Rj is constant throughoutthe beam. Equation (39) can be plugged into
equation (38) to determine a peak screen grid
volumetric erosion rate per aperture.
The effect of beam extraction diameter on the peak
screen grid volumetric erosion rate can now beassessed. Comparisons are made at the same operating
discharge voltages, total voltages, and beam currentsso that the relative effects of beam extraction diameter
can be determined. Because the ion optics aperture
geometry is unchanged, a peak screen grid volumetricerosion rate per aperture ratio can be established:
1--_b i Rj
_/'( _--_S (dNSTA R ]2 fNSTAR 1+ Rj_/'S TM l-- TAR (_j _ S _SrAR
0iNs'rA_ 1+ R NSrAR
(40)
The results of equation (40) are shown in Fig. 6. In this
figure, the screen grid discharge ion transparencies,ratio of doubly-to-singly charged ion currents, andflatness parameters were assumed to be constant for all
beam extraction diameters. The screen grid discharge
ion transparency assumption is conservative becausethis ion transparency is known to increase withdecreasing beam current densities, which can be
inferred from data in Refs. [11] and [12]. As Fig. 6
demonstrates, increasing the NSTAR thruster beamextraction diameter to 40 cm reduces peak screen grid
volumetric erosion rates by a factor of 0.5, or by 50%.This is expected since the amount of screen grid
webbing available for erosion was doubled.
The service life of the 40 cm thruster is assumed to be
double that of the NSTAR screen grid, given the
aforementioned assumptions. NSTAR wear test results
showed that screen grid erosion was minimal afterprocessing 88 kg of xenon. 3 From these results, the
NSTAR screen grid was estimated to have a 460 kgpropellant throughput capability utilizing a
conservative failure criterion of sputter erosionthrough half of the screen grid thickness. 9 The 40 cm
thruster is, therefore, anticipated to be capable ofprocessing about 920 kg of xenon, which exceeds the
goal of 550 kg.
Preliminary Results
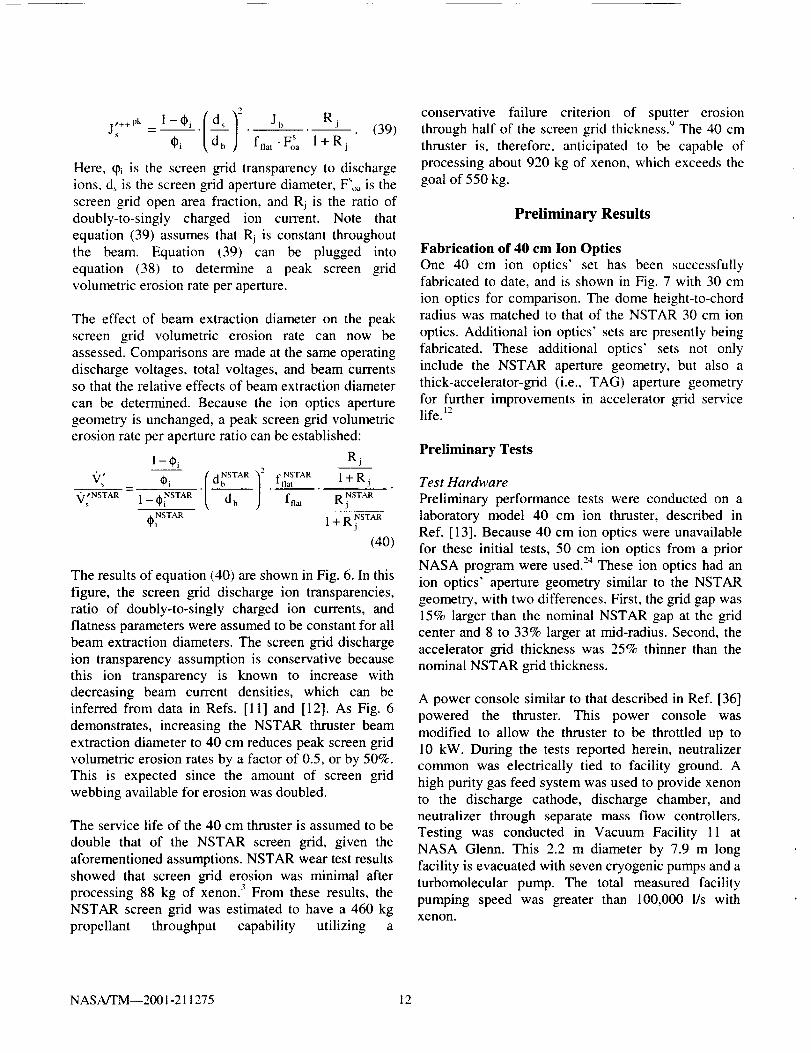
Fabrication of 40 cm Ion OpticsOne 40 cm ion optics' set has been successfully
fabricated to date, and is shown in Fig. 7 with 30 cmion optics for comparison. The dome height-to-chordradius was matched to that of the NSTAR 30 cm ion
optics. Additional ion optics" sets are presently beingfabricated. These additional optics' sets not only
include the NSTAR aperture geometry, but also a
thick-accelerator-grid (i.e., TAG) aperture geometryfor further improvements in accelerator grid servicelife. 12
Preliminary Tests
Test Hardware
Preliminary performance tests were conducted on a
laboratory model 40 cm ion thruster, described inRef. [13]. Because 40 cm ion optics were unavailable
for these initial tests, 50 cm ion optics from a priorNASA program were used. 24 These ion optics had an
ion optics' aperture geometry similar to the NSTAR
geometry, with two differences. First, the grid gap was15% larger than the nominal NSTAR gap at the grid
center and 8 to 33% larger at mid-radius. Second, theaccelerator grid thickness was 25% thinner than thenominal NSTAR grid thickness.
A power console similar to that described in Ref. [36]
powered the thruster. This power console was
modified to allow the thruster to be throttled up to
10 kW. During the tests reported herein, neutralizercommon was electrically tied to facility ground. A
high purity gas feed system was used to provide xenonto the discharge cathode, discharge chamber, and
neutralizer through separate mass flow controllers.Testing was conducted in Vacuum Facility 11 atNASA Glenn. This 2.2 m diameter by 7.9 m long
facility is evacuated with seven cryogenic pumps and a
turbomolecular pump. The total measured facilitypumping speed was greater than 100,000 l/s withxenon.
NASA/TM--2001-211275 12
Duringthrusteroperation,voltagesandcurrentsweremeasuredwith digitalmultimetersandxenonflowswith massflow meters.Beamcurrentdensityprofilesweremeasuredwith a planarprobemountedontoatwo-axisprobemotionsystem.Both the probeandtwo-axisprobemotionsystemaredescribedin detailin Refs.[11] and[12].Theplanarprobeof thisstudyhadanexposedsurfaceareaof 0.25cm-.
Test Results
The two measurements reported below include
impingement-limited total voltages and radial beam
current density profiles. Although accelerator currentsand electron backstreaming limits were measured, high
background pressures, the larger-than-nominal coldgrid gap, and the smaller-than-nominal accelerator grid
thickness made comparisons with NSTAR ion optics'data difficult. Impingement-limited total voltages were
determined from plots of accelerator current as a
function of total voltage where the slope was-0.02 mA/V. Uncertainties in impingement-limited
total voltage determinations (and, therefore, perveancemargins) were within _10 V. All radial beam current
density profiles were measured 49 mm downstream of
the geometric center of the accelerator grid.
Impingement-limited total voltages were measured atbeam currents of 1.20, 2.70, 3.52, and 4.75 A.
Although impingement-limited total voltages for thision optics' set were decreasing with accumulated
operation, there was no attempt to burn-in this optics"
set prior to collecting the data presented in thispaper, t_'_2As a result, perveance data are conservative
and, therefore, preliminary. The resulting averagebeamlet currents as a function of the impingement-limited total voltage are plotted in Fig. 8 with NSTAR
ion optics" data for comparison. As Fig. 8 shows,
impingement-limited total voltages for the 40 cmthruster were 150 to 210 V higher than those of the
NSTAR thruster ion optics. This is expected given thelarger cold grid gap of the ion optics used on the
40 cm thruster. Although the accelerator grid used onthe 40 cm thruster was thinner than that of the NSTAR
thruster, accelerator grid thickness has been shown tohave a negligible effect on perveance, t2"37"38
To permit comparisons between these 40 cm thruster
data and the NSTAR ion optics" data, the 40 cm
thruster impingement-limited total voltages werecorrected for an NSTAR grid gap. This was done byusing equation (1) to determine a normalized
perveance per hole at a given beam current, and thenusing this value to determine a new impingement-
limited total voltage for an effective accelerationlength equal to that of the NSTAR ion optics. These
corrected results are also plotted in Fig. 8. As the
figure shows, corrected impingement-limited totalvoltages for the 40 cm thruster were less than 50 V
higher than those of the NSTAR thruster ion optics.
The mean value of the correlated normalized
perveance per hole for the ion optics of the 40 cmthruster was 1.8x10 -It A/V 3/2, which is 25% lower
than the 2.4x10 -t_ A/V +v2measured for the 30 cm
NSTAR ion optics. The cause for this difference is
presently unknown. Regardless, the 40 cm thruster
with the 50 cm ion optics was able to successfullyoperate at the lowest total voltages in Table 1 for all
beam currents tested, albeit with a reduced perveancemargin.
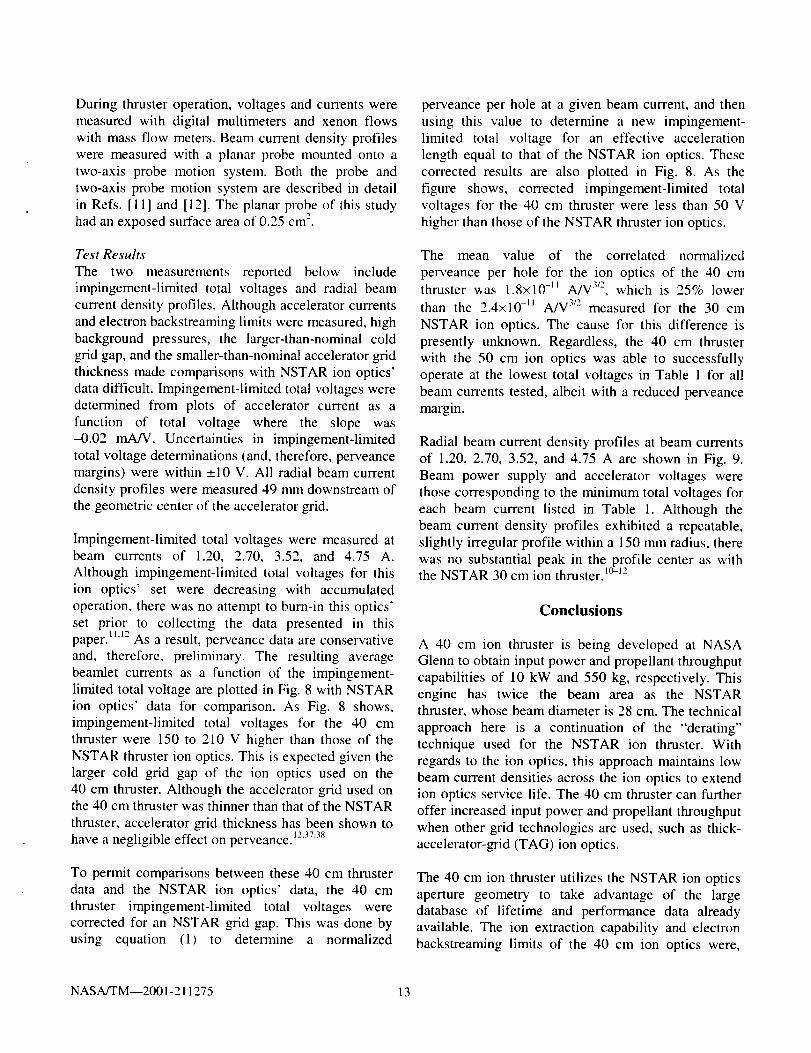
Radial beam current density profiles at beam currents
of 1.20, 2.70, 3.52, and 4.75 A are shown in Fig. 9.
Beam power supply and accelerator voltages werethose corresponding to the minimum total voltages for
each beam current listed in Table I. Although the
beam current density profiles exhibited a repeatable,slightly irregular profile within a 150 mm radius, there
was no substantial peak in the profile center as withthe NSTAR 30 cm ion thruster, t°-_-"
Conclusions
A 40 cm ion thruster is being developed at NASAGlenn to obtain input power and propellant throughput
capabilities of 10 kW and 550 kg, respectively. Thisengine has twice the beam area as the NSTARthruster, whose beam diameter is 28 cm. The technical
approach here is a continuation of the "derating"
technique used for the NSTAR ion thruster. Withregards to the ion optics, this approach maintains low
beam current densities across the ion optics to extendion optics service life. The 40 cm thruster can further
offer increased input power and propellant throughputwhen other grid technologies are used, such as thick-
accelerator-grid (TAG) ion optics.
The 40 cm ion thruster utilizes the NSTAR ion optics
aperture geometry to take advantage of the largedatabase of lifetime and performance data already
available. The ion extraction capability and electronbackstreaming limits of the 40 cm ion optics were,
NASA/TM--2001-211275 13
therefore,beestimatedbyutilizingNSTAR30cmionopticsdata.
A preliminarythrottletablefor the40cmion thrusterwas developedbased,in part, on the predictedperformanceof theionoptics"aperturegeometry.Thelowestperveancemarginwasestimatedto be209Vandoccurredat the lowestthrusterinputpower.Thelowestelectronbackstreamingmarginwasestimatedto be40V andoccurredat thehighestbeamvoltageandcurrent.
Dome-shapedgridswerechosenfor thedesignof the40cmion opticsbecausetheyarenaturallysuitedforlarge-areaion optics.A domeheight-to-chordradiusratiosimilarto that of theNSTARgridswasfurtherutilized becauseit addressedmost key issuesassociatedwithgridfabricationandthrusteroperationwhilehavinglittle impacton otherissuesconcerningthermalexpansionandlaunchstresses.
A preliminaryservicelife assessmentwasconductedto determinethelifetimegainby utilizinglargerareaion optics.Utilizing long durationtest resultswith
NSTARion optics,comparisonsindicatedthat thepropellantthroughputgoal of 550 kg of xenonispossiblewith40 cm ion opticsutilizingtheNSTARionopticsgeometry.
One40 cm ion optics' set hasbeensuccessfullyfabricatedto date.Additional ion optics' sets arepresentlybeingfabricated.
Preliminaryperformancetestswereconductedon alaboratorymodel40cm ion thruster.Because40 cmion opticswerenot availablefor theseinitial tests,50 cm ion opticswereused.Theseion opticshadacold gapthat was8 to 33% largerthanthat of theNSTAR ion opticsgeometry.Impingement-limitedtotalvoltagesweremeasuredatbeamcurrentsof 1.20,2.70,3.52,and4.75A. The40 cm thrusterwith the50cm ion opticswasableto successfullyoperateatthe lowest predictedtotal voltagesfor all beamcurrentstested.Impingement-limitedtotal voltagescorrectedfor theirlargercold gridgapfor the40cmthrusterwerelessthan50V higherthanthoseof theNSTARthrusterionoptics.
NASA/TM--2001-211275 14
Appendix A
Accurately assessing the accelerator grid service life
enhancement with 40 cm ion optics requires knowingwhether charge-exchange ions created upstream or
downstream (i.e., equation (28) or (30), respectively)
of the neutralization plane dominate the totalimpingement current. It may be possible to gain
insight into the relative magnitude of each
impingement current by comparing impingementcurrents of both 30 and 40 cm ion optics at similaroperating conditions. Total impingement currents can
be determined for equations (28) and (30) by replacing
the beamlet current with the beam current, to yield:
JUp--Jb,,,o (l-n;+)ma '"• _ fN(z).dz,d_'_'ff n'm''kB'T"32 luv
and (A1)
jdwn Jb " (Yc-e "nb 'dbi = (A2)4
Because the N(z) and lup are unknown, solving for the
value of each current is not possible. However,impingement current ratios can be used to determine
the relative magnitude of each term as a function of
beam extraction diameter. Using the same assumptionsas with equations (35) and (36), it can be shown that:
J?
j up NSTAR
d NSTAR _2 f NSTAR ++b "flat . (l--rid)
Jdb fflat l--rid
and (A3)
j dwn d b
] dwn NSTAR cl NSTAR "-i _b
(A4)
Equations (A3) and (A4) show that if 40 cm thruster
accelerator currents are greater than those for theNSTAR thruster at similar operating conditions
(assuming similar flatness parameters and dischargepropellant utilization efficiencies), then charge-
exchange ions originating downstream of theneutralization plane likely dominate the total
impingement current. However, if 40 cm thruster
accelerator currents are approximately half those forthe NSTAR thruster at similar operating conditions,
then charge-exchange ions originating upstream of the
neutralization plane dominate the total impingementcurrent.
NASAfI'M--2001-211275 15
References
[1] Rawlin, V.K., et at. "An Ion Propulsion Systemfor NASA's Deep Space Missions," AIAA Paper
99-4612, September 1999.[2] Polk, J.E., et al., "In-Flight Performance of the
NSTAR Ion Propulsion System on the Deep
Space One Mission," IEEE AerospaceConference Paper 8.0304, March 2000.
[3] Polk, J.E., et al., "An Overview of the Resultsfrom an 8200 Hour Wear Test of the NSTAR Ion
Thruster," AIAA Paper 99-2446, June 1999.[4] Anderson, J.R., et at., "Performance
Characteristics of the NSTAR Ion Thruster
During an On-going Long Duration GroundTest," IEEE Aerospace Conference Paper 8.0303,March 2000.
[5] Personal Communication, Anderson, J.R., Jet
Propulsion Laboratory, Pasadena, CA, May 2001.[6] Rawlin, V.K., "Erosion Characteristics of Two-
Grid Ion Accelerating Systems," IEPC Paper 93-
175, September 1993.[7] Brophy, J.R., Polk, J.E., and Rawlin, V.K., "Ion
Engine Service Life Validation by Analysis and
Testing," AIAA Paper 96-2715, July 1996.[8] Patterson, M.J., et al., "Ion Propulsion
Development Activities at NASA Glenn
Research Center," AIAA Paper 2000-3810, July2000.
[9] Soulas, G.C., "Grid Technology Analyses forCNSR," Presentation at NASA Glenn Research
Center, January 2000.
[10] Soulas, G.C., Foster, J.E., and Patterson, M.J."Performance of Titanium Optics on a NASA 30
cm Ion Thruster," AIAA Paper 00-3814, July2000.
[11] Soulas, G.C., "Performance Evaluation ofTitanium Ion Optics for the NASA 30 cm Ion
Thruster," IEPC Paper 01-092, October 2001.[12] Soulas, G.C., "Improving the Total Impulse
Capability of the NSTAR Ion Thruster with
Thick-Accelerator-Grid Ion Optics," IEPC Paper01-081, October 2001.
[13] Patterson, M.J., et al., "Development Status of a5/10-kW Class Ion Engine," AIAA Paper 2001-
3489, July 2001.[14] Christensen, J.A., et al., "Design and Fabrication
of a Flight Model 2.3 kW Ion Thruster for theDeep Space 1 Mission," AIAA Paper 98-3327,
July 1998.
[15] Sovey, J.S., et al., "Development of an IonThruster and Power Processor for New
Millennium's Deep Space 1 Mission," AIAA
Paper 97-2778, December 1997.[16] Aston, G., Kaufman, H.R., and Wilbur, P.J. "Ion
Beam Divergence Characteristics of Two-Grid
Accelerator Systems," AIAA Journal, vol. 16,no. 5, May 1978, pp. 516-524.
[17] Rawlin, V.K., "Characterization of Ion
Accelerating Systems on NASA LeRC's Ion
Thrusters," AIAA Paper 92-3827, July 1992.[18] Kaufman, H.R., "Technology of Electron
Bombardment Ion Thrusters," Advances in
Electronics and Electron Physics, vol. 36, Academic
Press, Inc., New York, 1974, pp. 265-373.
[19] Rawlin, V.K., Banks, B.A., and Byers, D.C.,"Design, Fabrication, and Operation of DishedAccelerator Grids on a 30-cm Ion Thruster,"
AIAA Paper 72-486, April 1972.
[20] MacRae, G.S., Zavesky, R.J., and Godder, S.T.,"Structural and Thermal Response of 30 cm
Diameter Ion Thruster Optics," AIAA Paper 89-2719, July 1989.
[21] Young, W.C., Roark's Formulas for Stress and_Strain, 6th Ed., McGraw Hill, New York, 1989,
p. 523.
[22] Horvay, G., "The Plane-Stress Problem ofPerforated Plates," Journal of Applied
Mechanics, September 1952, pp. 355-360.[23] Personal Communication, Rawlin, V.K., NASA
Glenn Research Center, Cleveland, OH, August2001.
[24] Rawlin, V.K. and Millis, M.G., "Ion Optics for
High Power 50-cm-diam Ion Thrusters," AIAAPaper 89-2717, July 1989.
[25] Whealton, J.H., Kirkman, D.A., and Raridon,
R.J., "Electrostatic Ion Thruster Optics
Calculations," AIAA Paper 92-3830, July 1992.[26] Peng, X., Ruyten, W.M., and Keefer, D., "Further
Study of the Effect of the Downstream PlasmaCondition on Accelerator Grid Erosion in an Ion
Thruster," AIAA Paper 92-3829, July 1992.
[27] Peng, X., Ruyten, W.M., and Keefer, D.,"Charge-Exchange Grid Erosion Study for
Ground-Based and Space-Based Operations ofIon Thrusters," IEPC Paper 93-173, September1993.
[28] Arakawa, Y. and Nakano, M., "An Efficient
Three-Dimensional Optics Code for Ion Thruster
Research," AIAA Paper 96-3198, July 1996.
NASA/TM--2001-211275 16
[29] Brophy,J.R.,Polk,J.E.,andPless,L.C.,"Test-to-Failure of a Two-Grid, 30-cm Dia. IonAcceleratorSystem," IEPC Paper 93-172,September1993.
[30]Polk,J.E.,Brophy,J.R.,andWang,J., "SpatialandTemporalDistributionof EngineAcceleratorGridErosion,"AIAA Paper 95-2924, July 1995.
[31] Monheiser, J.M., and Wilbur, P.J., "Effects of
Design and Operating Conditions on Accelerator
Grid Impingement Current," IEPC Paper 93-174,September 1993.
[32] Monheiser, J.M., and Wilbur, P.J., "Developmentand Verification of a Model to Predict
Impingement Currents for Ion Thrusters," NASA
Contractor Report CR-195322, April 1994.[33] Foster, J.E., Soulas, G.C., and Patterson, M.J.,
"Plume and Discharge Plasma Measurements of
an NSTAR-type Ion Thruster," AIAA 2000-3812, July 2000.
[34] Polk, J,E., et al., "The Effect of Carbon
Deposition on Accelerator Grid Wear Rates in
Ion Engine Ground Testing," AIAA Paper 2000-3662. July 2000.
[35] Stuart, R.V. and Wehner, G.K., "Sputter Yields at
Very Low Bombarding Ion Energies," Journal ofApplied Physics, vol. 33, no. 7, July 1962,
pp. 2345-2352.[36] Pinero, L.R., Patterson, M.J., and Satterwhite,
V.E., "Power Console Development for NASA's
Electric Propulsion Outreach Program," IEPCPaper 93-250, September 1993.
[37] Rawlin, V.K., "Performance of 30-cm IonThrusters with Dished Accelerator Grids," AIAA
Paper 73-1053, October-November 1973.
[38] Rovang, D.C. and Wilbur, P.J., "Ion ExtractionCapabilities of Two-Grid Accelerator Systems,"
IEPC Paper 84-86, July 1984.
NASA/TM--2001-211275 17
InputPower,b
kW10.08.26.14.72.2
Table I. Preliminary 40 cm thruster ion optics' currents and voltages
for operation at hi{_h R-ratios. aBeam Beam Total Total Electron
Accelerator Voltage b Voltage BackstreamingCurrent'b V°ltage'b Voltage, b V
A V V Limit, _ V Limit, d V
5.80 1567 -257 1824 1196 -217
4.75 1567 -257 1824 1111 -2033.52 1567 -257 1824 994 -186
2.70 1567 -257 1824 901 -175
1.20 1567 -257 1824 667 -156
7.4 4.75 1396 -243 1639 1111 -187
5.5 3.52 1396 -243 1639 994 -1714.2 2.70 1396 -243 1639 901 -160
2.0 1.20 1396 -243 1639 667 -140
4.7 3.52 1179 -227 1406 994 -1523.6 2.70 1179 -227 1406 901 -141
1.7 1.20 1179 -227 1406 667 -121
3.2 2.70 1021 -216 1237 901 -t27
1.5 1.20 1021 -216 1237 667 -1071.1 1.20 679 -197 876 667 -76
aA discharge voltage of 24 V and a flatness parameter of 0.6 were assumed.
bPreliminar3, operating point.
CPredicted impingement-limited total voltage based on the average beamlet current.
aPredicted limit.
<
<
1.3E-04
1.1E-04
9.0E-05
7.0E-05
5.0E-05
3.0E-05] .
r3
-_
I:i.IB
rl D
m
600 650 700 750 800 850 900 950
Impingement-Limited Total Voltage, V
Fig. 1. Average beamlet current as a function of impingement-limited total voltagefor the NSTAR ion optics. Data taken from Refs. [11] and [12].
1000
NASA/TM--2001-211275 18
>
±e_
Z
¢-
2.2E-09
2.0E-09
1.8E-09
! .6E-09
1.4E-09
1.2E-09
Oo
1.0E-09
0.022 0.024 0.026 0.028 0.030
OUnco atedNPHtii
4 .......
I •I I• "
i I
1
1
I J ] ¢ , , ,
0.032 0.034 0.036 0.038
3.2E-11
3.0E-I 1
2.8E-11
2.6E-11
2.4E-11
"_"_E-I 1
2.0E- 11
0.040
Discharge-to-Total Voltage Ratio
O
e_
7
Fig. 2. Normalized perveance per hole as a function ofdischarge-to-total voltage ratio for the NSTAR ion optics.
L9
-r-
_=
e_
E
[-.EOO
6'7'
O
.2
1.00
0.98
0.96
0.94
0.92
0.90
• Measured - 30 cm Ion Optics
0 Predicted - 30 cm Ion Optics
Predicted - 40 cm Ion Optics
0.02 0.03 0.04 0.05 0.06 0.07 0.08 0.09 0.10
Dome Height-to-Chord Radius
Fig. 3. Fraction of hot-to-room temperature grid gap for 30 cm and 40 cm ion optics.Measured datum is from Ref. [20].
NASA/TM--2001-211275 19
New Grid
ApertureEnlargement
Eroded Grid
Fig. 4. Typical accelerator grid erosion sites.
1.00
•= _ 0.90
0.80,-t
"6 _ 0.70>,,.
o 0.60
_ 0.40--_"6
_ _ 0.30<
_ 0.20O
.o _ 0.10
'-" 0.00
25
7
C-E Ions Created Upstream of
Neutralization Plane
...... C-E Ions Created Downstream of
Neutralization Plane
!
I
I
|
i
30 35 40 45 50 55 60
Beam Extraction Diameter, cm
Fig. 5. Ratio of accelerator grid volumetric erosion rate per hole to that of the NSTAR thruster.
Discharge chamber propellant utilization efficiencies and flatness parametersare assumed to be the same for all beam extraction diameters.
NASA/TM--2001-211275 20
.2 _ 1.00
aa ,= 0.90
•r- [-,.,, 0.80
E<=E- 0.70
> Z 0.60
_ 0.50O
e..,
fi= 0.40,b[--.o 0.30
"6 0.20 1
o "B 0.10
_ _ o.oon¢
\I
: !i
, it
25 30 35 40 45 50 55 60
Beam Extraction Diameter, cm
Fig. 6. Ratio of peak screen grid volumetric erosion rate per hole to that of the NSTAR thruster.
Screen grid discharge ion transparencies, ratios of doubly-to-singly charged ion currents, dischargevoltages, and flatness parameters are assumed to be the same for all beam extraction diameters.
Fig. 7. Photograph of 40 cm screen grid (left foreground) and 40 cm accelerator grid (right foreground)
with a 30 cm accelerator grid (center background) for comparison.
NASA/TM--2001-211275 21
<
E
rr_
¢,)
<
1.7E-04
1.5E-04
1.3E-04
1.1E-04
9.0E-05
7.0E-05 !
|
5.0E-05 j •
3.0E-05 O0 A ,
ii - ,, ! oi i I ; //
1140 cm Ion Thruster
A40 cm Ion Thruster-Corrected
.... i
i 13 A 13"i -
.... _ . _ -- _ - _ ......
I /j
oO" i
OiII
,0 : "
!
I
: i
i
600 700 800 900 1000 i 100 1200 1300 1400
Impingement-Limited Total Voltage, V
Fig. 8. Average beamlet current as a function of impingement-limited total voltagefor the 40 cm and NSTAR ion thrusters. Data for the 40 cm thruster include
measured data and data corrected for an NSTAR effective acceleration length.
e_
8
7
6
5
4
3
2
1
0
-300
_4.75 A Beam Current
3.52 A Beam Current
.---_-.- 2.70 A Beam Current
.................1.20 A Beam Current
-2_ -1_ 0 1_ 2_ 3_
Radius, mm
Fig. 9. Radial beam current density profiles for the 40 cm ion thruster at 49 mm downstream
of the ion optics' center for beam currents of 1.20 A, 2.70 A, 3.52 A, and 4.75 A.
NASA/TM--2001-211275 22
REPORT DOCUMENTATION PAGE Forn_ApprovedOMB No. 0704-0188
Public reporting burden for this collection of information is estimated to average 1 hour per response, including the time for reviewing instructions, searching existing data sources,
gathering and maintaining the data needed, and completing and reviewing the collection of information. Send comments regarding this burden estimate or any other aspect of this
collection of information, including suggestions for reducing this burden, to Washington Headquarters Services, Directorate for Information Operations and Reports, 1215 Jefferson
Davis Highway, Suite 1204, Arlington, VA 22202-4302. and to the Office of Management and Budget, Paperwork Reduction Project (0704-0188), Washington, DC 20503.
1. AGENCY USE ONLY (Leave blank) 2. REPORT DATE
December 2001
4. TITLE AND SUBTITLE
Design and Performance of 40 cm Ion Optics
6. AUTHOR(S)
George C. Soulas
7. PERFORMING ORGANIZATION NAME(S) AND ADDRESS(ES)
National Aeronautics and Space Administration
John H. Glenn Research Center at Lewis Field
Cleveland, Ohio 44135- 3191
9. SPONSORING/MONITORING AGENCY NAME(S) AND ADDRESS(ES)
National Aeronautics and Space Administration
Washington, DC 20546-0001
3. REPORT TYPE AND DATES COVERED
Technical Memorandum
5. FUNDING NUMBERS
WU-713-81-66--00
8. PERFORMING ORGANIZATIONREPORT NUMBER
E-13074
10. SPONSORING/MONITORINGAGENCY REPORT NUMBER
NASA TM--2001-211275
IEPC-OI-090
11. SUPPLEMENTARY NOTES
Prepared for the 27th International Electric Propulsion Conference cosponsored by the AFRL, CNES, ERPS, GRC,
JRL, MSFC, and NASA, Pasadena, California, October 14-19, 2001. Responsible person, George C. Soulas,
organization code 5430, 216-977-7419.
12a. DISTRIBUTION/AVAILABILITY STATEMENT
Unclassified - Unlimited
Subject Category: 20 Distribution: Nonstandard
Available electronically at htto://o_ltrs.m'c.na_a._ov/GLTRS
This publication is available from the NASA Center for AeroSpace Information, 301-621_)390.
12b. DISTRIBUTION CODE
13. ABSTRACT (Maximum 200 words)
A 40 cm ion thruster is being developed at the NASA Glenn Research Center to obtain input power and propellant
throughput capabilities of 10 kW and 550 kg, respectively. The technical approach here is a continuation of the
"derating" technique used for the NSTAR ion thruster. The 40 cm ion thruster presently utilizes the NSTAR ion optics
aperture geometry to take advantage of the large database of lifetime and performance data already available. Dome-
shaped grids were chosen for the design of the 40 cm ion optics because this design is naturally suited for large-area
ion optics. Ion extraction capabilities and electron backstreaming limits for the 40 cm ion optics were estimated by
utilizing NSTAR 30 cm ion optics data. A preliminary service life assessment showed that the propelhmt throughput
goal of 550 kg of xenon may be possible with molybdenum 40 cm ion optics. One 40 cm ion optics' set has been
successfully fabricated to date. Additional ion optics' sets are presently being fabricated. Preliminary performance
tests were conducted on a laboratory model 40 cm ion thruster.
14. SUBJECT TERMS
Ion thruster: Ion optics: Grids
17. SECURITY CLASSIFICATIONOF REPORT
Unclassified
NSN 7540-01-280-5500
15. NUMBER OF PAGES
28
16. PRICE CODE
18. SECURITY CLASSIFICATION 19. SECURITY CLASSIFICATION 20. LIMITATION OF ABSTRACTOF THIS PAGE OF ABSTRACT
Unclassified Unclassified
Standard Form 298 (Rev. 2-89)
Prescribed by ANSI Std. Z39-18298-102