design and testing of the kistler landing system parachutes … · design and testing of the...
TRANSCRIPT
AIAA-99-1707
*Manager, Technical Development Lead Engineer àSenior Project Engineer
DESIGN AND TESTING OF THE KISTLER LANDING SYSTEM PARACHUTES
Anthony P. Taylor*, Robert J. Sinclair , Richard D. Allamby, M.B.E.à Irvin Aerospace Inc., Santa Ana, California 92704
The Kistler Landing system consists of parachutes and airbags to land both stages of the Kistler Aerospace, K-1 Reusable Launch Vehicle. The K-1 Reusable Launch Vehicle is a commercial venture to develop the worlds first fully re-usable launch vehicle. The unmanned launcher consists of two stages, the first or Launch Assist Platform (LAP), and the second stage, or Orbital Vehicle (OV). This paper presents an update on the status of parachute testing for the Kistler program.
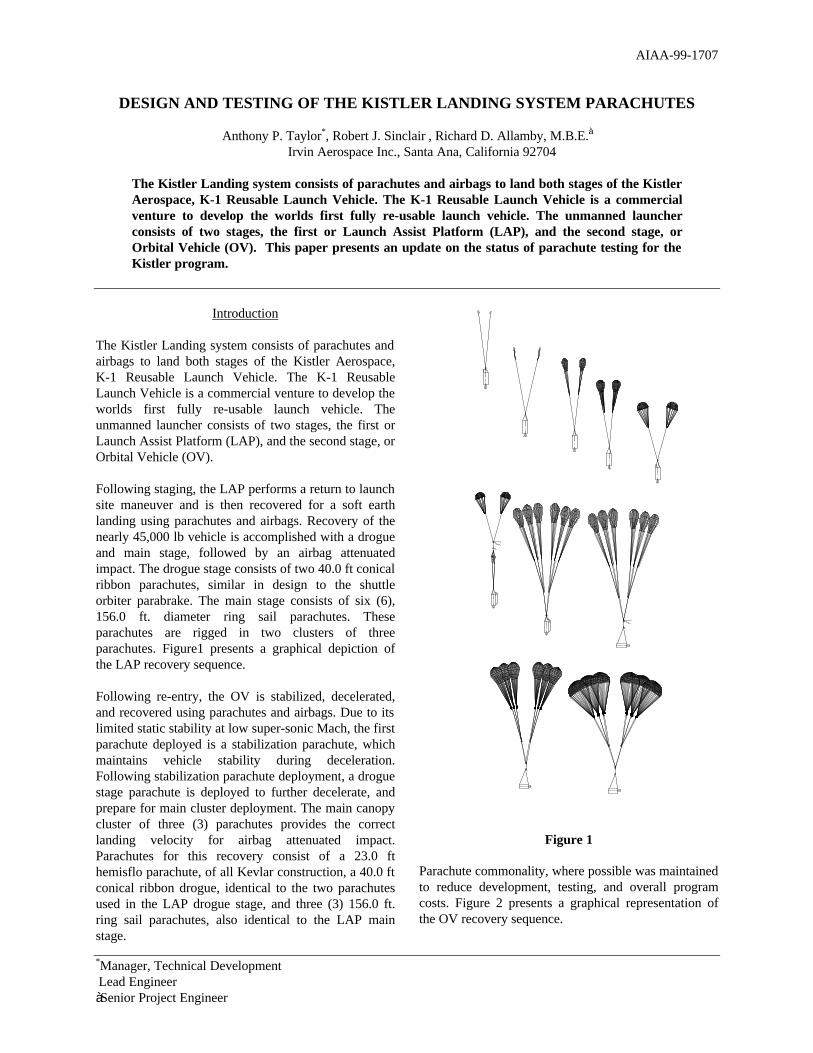
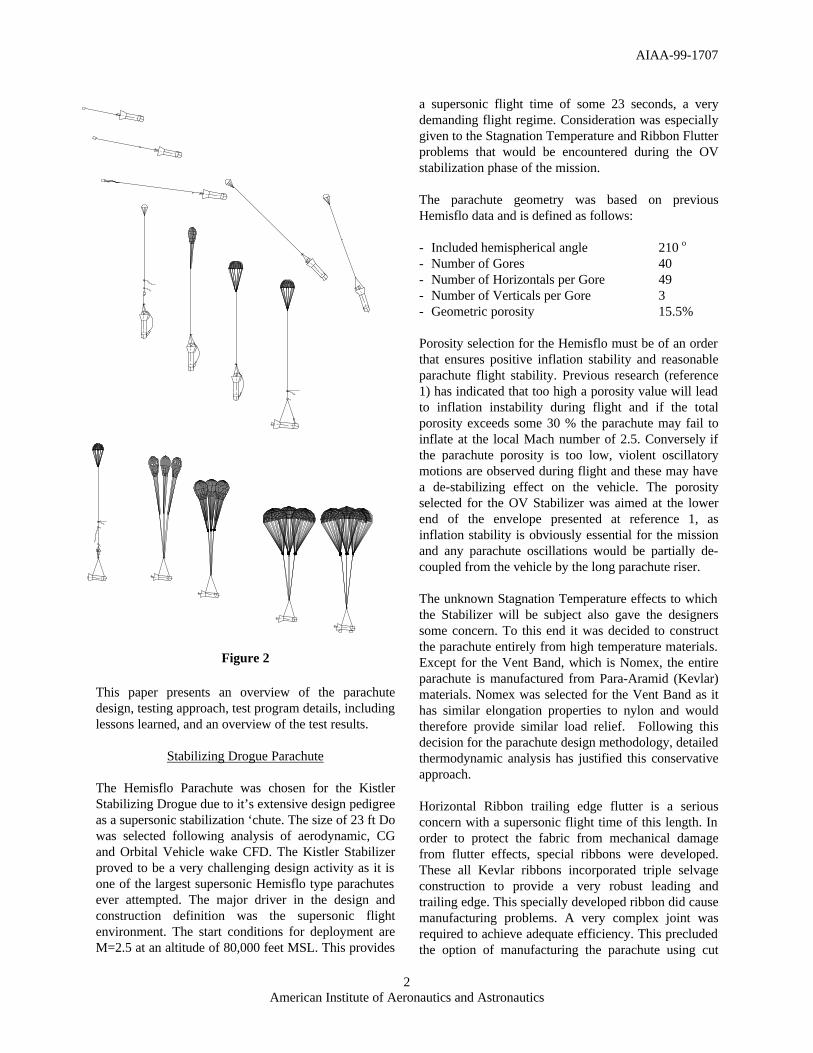
Introduction The Kistler Landing system consists of parachutes and airbags to land both stages of the Kistler Aerospace, K-1 Reusable Launch Vehicle. The K-1 Reusable Launch Vehicle is a commercial venture to develop the worlds first fully re-usable launch vehicle. The unmanned launcher consists of two stages, the first or Launch Assist Platform (LAP), and the second stage, or Orbital Vehicle (OV). Following staging, the LAP performs a return to launch site maneuver and is then recovered for a soft earth landing using parachutes and airbags. Recovery of the nearly 45,000 lb vehicle is accomplished with a drogue and main stage, followed by an airbag attenuated impact. The drogue stage consists of two 40.0 ft conical ribbon parachutes, similar in design to the shuttle orbiter parabrake. The main stage consists of six (6), 156.0 ft. diameter ring sail parachutes. These parachutes are rigged in two clusters of three parachutes. Figure1 presents a graphical depiction of the LAP recovery sequence. Following re-entry, the OV is stabilized, decelerated, and recovered using parachutes and airbags. Due to its limited static stability at low super-sonic Mach, the first parachute deployed is a stabilization parachute, which maintains vehicle stability during deceleration. Following stabilization parachute deployment, a drogue stage parachute is deployed to further decelerate, and prepare for main cluster deployment. The main canopy cluster of three (3) parachutes provides the correct landing velocity for airbag attenuated impact. Parachutes for this recovery consist of a 23.0 ft hemisflo parachute, of all Kevlar construction, a 40.0 ft conical ribbon drogue, identical to the two parachutes used in the LAP drogue stage, and three (3) 156.0 ft. ring sail parachutes, also identical to the LAP main stage.
Figure 1 Parachute commonality, where possible was maintained to reduce development, testing, and overall program costs. Figure 2 presents a graphical representation of the OV recovery sequence.
AIAA-99-1707
2 American Institute of Aeronautics and Astronautics
Figure 2 This paper presents an overview of the parachute design, testing approach, test program details, including lessons learned, and an overview of the test results.
Stabilizing Drogue Parachute The Hemisflo Parachute was chosen for the Kistler Stabilizing Drogue due to it’s extensive design pedigree as a supersonic stabilization ‘chute. The size of 23 ft Do was selected following analysis of aerodynamic, CG and Orbital Vehicle wake CFD. The Kistler Stabilizer proved to be a very challenging design activity as it is one of the largest supersonic Hemisflo type parachutes ever attempted. The major driver in the design and construction definition was the supersonic flight environment. The start conditions for deployment are M=2.5 at an altitude of 80,000 feet MSL. This provides
a supersonic flight time of some 23 seconds, a very demanding flight regime. Consideration was especially given to the Stagnation Temperature and Ribbon Flutter problems that would be encountered during the OV stabilization phase of the mission. The parachute geometry was based on previous Hemisflo data and is defined as follows: - Included hemispherical angle 210 o - Number of Gores 40 - Number of Horizontals per Gore 49 - Number of Verticals per Gore 3 - Geometric porosity 15.5% Porosity selection for the Hemisflo must be of an order that ensures positive inflation stability and reasonable parachute flight stability. Previous research (reference 1) has indicated that too high a porosity value will lead to inflation instability during flight and if the total porosity exceeds some 30 % the parachute may fail to inflate at the local Mach number of 2.5. Conversely if the parachute porosity is too low, violent oscillatory motions are observed during flight and these may have a de-stabilizing effect on the vehicle. The porosity selected for the OV Stabilizer was aimed at the lower end of the envelope presented at reference 1, as inflation stability is obviously essential for the mission and any parachute oscillations would be partially de-coupled from the vehicle by the long parachute riser. The unknown Stagnation Temperature effects to which the Stabilizer will be subject also gave the designers some concern. To this end it was decided to construct the parachute entirely from high temperature materials. Except for the Vent Band, which is Nomex, the entire parachute is manufactured from Para-Aramid (Kevlar) materials. Nomex was selected for the Vent Band as it has similar elongation properties to nylon and would therefore provide similar load relief. Following this decision for the parachute design methodology, detailed thermodynamic analysis has justified this conservative approach. Horizontal Ribbon trailing edge flutter is a serious concern with a supersonic flight time of this length. In order to protect the fabric from mechanical damage from flutter effects, special ribbons were developed. These all Kevlar ribbons incorporated triple selvage construction to provide a very robust leading and trailing edge. This specially developed ribbon did cause manufacturing problems. A very complex joint was required to achieve adequate efficiency. This precluded the option of manufacturing the parachute using cut
AIAA-99-1707
3 American Institute of Aeronautics and Astronautics
gore techniques. The parachute was therefore designed as a continuous ribbon. The parachute is Skirt Rigged and employs circular braided cord as a suspension line material. Circular cord is used to minimize suspension line wake effects and they are connected to the parachute riser directly thus obviating the requirement for a mechanical interconnector with it’s associated weight penalty.
Drogue Parachute The Variable Porosity Conical Ribbon (VPCR) was selected for the LAP and OV Drogue Parachutes. The size of the Drogues was established to provide commonality between the two vehicles and to provide the required deployment conditions for the Main Parachutes. The parachute geometry was based on the Shuttle Parabrake and is defined as follows: - Reference Diameter Do 40.3 ft - Number of Gores 40 - Number of Horizontals per gore 92 - Number of Verticals per Gore 7 - Geometric Porosity 16.1% Porosity selection for the parachute was derived from wind tunnel data collected by Sandia during the Orbiter Drag Chute Stability Tests in the NASA/Ames 80 x 120 Foot Wind Tunnel (reference 2). During this test campaign the original planform of the parachute was modified by the removal of ribbons from the shoulder and crown regions of the canopy. The resulting planform and geometric porosity of 16.1% proved extremely stable and was therefore selected for the Kistler drogue 'chutes. Both the OV and LAP flight profiles require reefing stages. To ensure reliable reefed inflation, the design departed from the common 1% So vent area and reduced the size to a figure of 0.29% So. This ensures that the parachute achieves repeatable and reliable crown pressurization. The design of the reefing assets include specially designed dual reefing rings. These have been sized to give optimum reefing line control and minimize skirt bulk. The parachute has 1.2 Do suspension lines that are fully rigged onto the canopy and form the radial tapes and vent lines. Inner radials wrap around the suspension lines at the skirt plane to eliminate peeling. The lines are terminated at an Aluminum ring in the vent. This ring ensures no mechanical interaction occurs between
the vent lines which is known to cause abrasion damage in Kevlar materials, especially in re-useable systems. The parachute is designed as a cut gore ribbon to ease manufacture. This also minimizes trailing edge fullness, and therefore flutter, in the horizontals.
Main Parachute The Kistler Main Parachute is made up of 5 rings and 10 sails and has a reference diameter (Do) of 156 ft. The canopy consists of 19113 square feet of drag producing surface. The parachute incorporates a Kevlar structural grid and a nylon drag-producing surface. The Irvin ¼ spherical Ringsail planform was selected due to it’s excellent stability characteristics, reefed performance and high drag coefficient. The parachute derives it’s exceptional performance from the true ¼ spherical geometry, fullness distribution and porosity distribution. Drag is further enhanced by the use of 1.15 Do suspension lines. The canopy is made up of 112 gores and each panel is sized to employ full width fabric. The suspension lines are Larkshead attached to the radials at the skirt plane and terminated on steel 6K links at the riser. This allows rapid change out of damaged lines, a feature essential to the re-usability of the system. The most significant feature that has been developed during the Kistler main parachute design phase is the deployment control. Very large descent class parachutes of this type are generally problematical in clusters apropos load sharing. The design goal during development was to eliminate, as far as possible, lead/lag within the cluster and to reduce 1st stage inflation damage caused by the formation of false apexes in the individual canopies. Three very important features were built into the design of the deployment system and performed exceptionally well during test. Deployment Bag Design The deployment bags for the 3 ‘chute OV cluster and the 6 ‘chute LAP cluster incorporate a lacing system that allows the bags to be tied together and deployed as one. This feature ensures that the canopy skirts all break out of the bags together. This ensures that canopy filling begins simultaneously. The deployment bags also incorporate multiple stowage flaps to control the egress of the risers and suspension lines at the 250 fps deployment velocity.
AIAA-99-1707
4 American Institute of Aeronautics and Astronautics
Vent Leash Design It is common practice to attach the vent of a parachute to the deployment bag by some means of break tie. These ties usually serve the purpose of tensioning the structural grid during the initial filling of the canopy. With a canopy the size of the Kistler main ‘chute this method of vent control is inadequate. The Kistler main parachute incorporates an incremental bridle that has an average tear force of 400 lbs and a stroke of 140 feet. This bridle applies sufficient tension to the structural grid of the canopy to keep it taut during the entire pre-inflation phase and through to crown pressurization. The vent leash ensures that the “ball of air” entering the canopy impacts centrally at the vent area. It also ensures inflation uniformity within the cluster, which greatly reduces any lead/lag factors. Sacrifice Panel Design The Kistler main parachute incorporates a sacrifice panel that engulfs the entire length of canopy. After the canopy has been long folded, the sacrifice panel is wrapped around it and whipped stitched closed. The sacrifice panel serves two very important functions during the pre-inflation phase of deployment. Firstly it serves as a protective sleeve as the canopy is being stripped from the deployment bag at high speed. Secondly, the resistance of the sacrifice panel unfurling as the air moves towards the vent of the canopy effectively gives the canopy a “moving vent”. The effect of this phenomenon is to maintain an even skirt plane during the entire pre-inflation phase, this drastically improves inlet formation and first stage inflation. The parachutes have demonstrated exceptional performance during the test program and the measures taken to improve the cluster performance have proved to be essential deployment aids in canopies of this magnitude.
Development Testing The challenge of developing a launch system under commercial funding leads to compromises in the number and type of tests that can be performed. Also commercial factors such as time scales and the funds available for development must be taken into account from the outset. Development testing of not less than 5 unique parachute configurations is planned, as well as single parachute tests to establish a performance baseline.
The two main parachute clusters, and several single parachute tests have been completed to date. At the time of writing, the stabilization and drogue parachutes have not been tested, but significant engineering and development has lead to parachute test configuration definition. Additionally, the sheer size of the vehicle stages reduces what is feasible in a reasonable parachute drop test environment. As a result, unique control and rigging techniques were developed to adapt existing equipment to meet the challenges presented. These included: • Stabilization techniques to control Type V
platform/load tub combinations during load extraction, accelerations and test parachute deployment.
• Timed release of extraction parachutes to ensure
realistic mains deployment conditions.
• Mounting of 6 large parachutes for delayed deployment from a platform/load tub combination.
• Unique rigging to allow simulation of vehicle
attitude re-orientation. • Modification of a large CTV to allow recovery
of the test vehicle following drogue parachute testing.
Test Rationale
Due to funding and time scale restrictions it became clear from the outset that testing all corners of each system envelope would not be possible. To this end a program rationale was agreed that would attempt to test each system at a baseline condition, an optimized baseline condition and then at a proof load condition. If optimization or modification were felt to be unnecessary after the baseline drop then the optimized drop would not be conducted. This rationale has proved a feasible way forward to date. During the program it was decided to add an additional test in an effort to review a major area of concern. This test was designed to simulate vehicle attitude re-orientation and required the application of test specific, unique load rigging techniques.
AIAA-99-1707
5 American Institute of Aeronautics and Astronautics
Test Time Scales and Funding As stated above, due to the commercial nature of this program the development testing had to be carefully planned to make best use of the time and funds available. It became clear from the start of discussions with Yuma Proving Ground (YPG) personnel and after looking at commercial aircraft options that the best, fastest and most cost effective option was to use military aircraft. Once this option was agreed upon it became clear that to make best use of military assets the test loads would need to be loaded and extracted from the aircraft using standard military parachutes and procedures. Therefore every test conducted used standard Type V Platforms, standard load extraction techniques and most importantly the correct type of extractor parachute for the load mass being tested. This approach at times meant minor modifications to test procedures but this by far outweighed the advantages afforded by employing standard techniques. This approach had the following advantages: • Lengthy proposed test plan (PTP) clearance was
not required. • Additional testing to ensure the safety of test
specific load extraction techniques was not required.
• Any airdrop compatible aircraft could be used to drop the test loads.
• Any airdrop trained military aircrew could fly the test mission.
This approach enabled 10 tests to be conducted in 9 months.
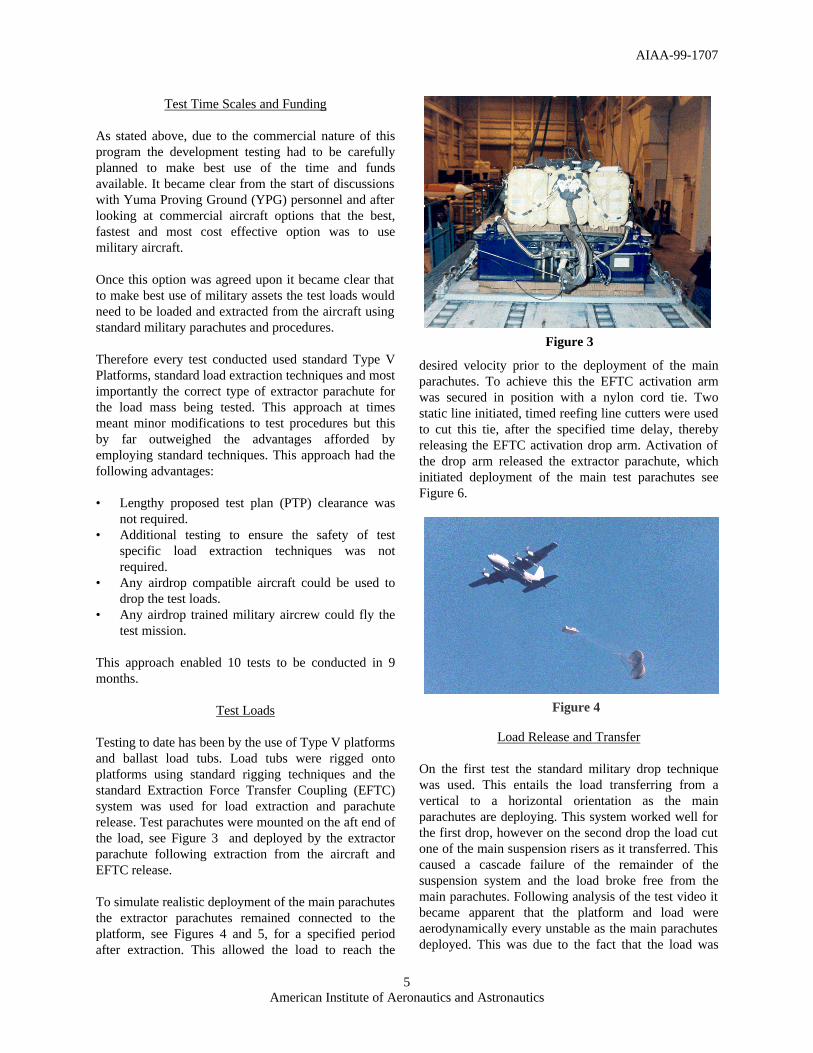
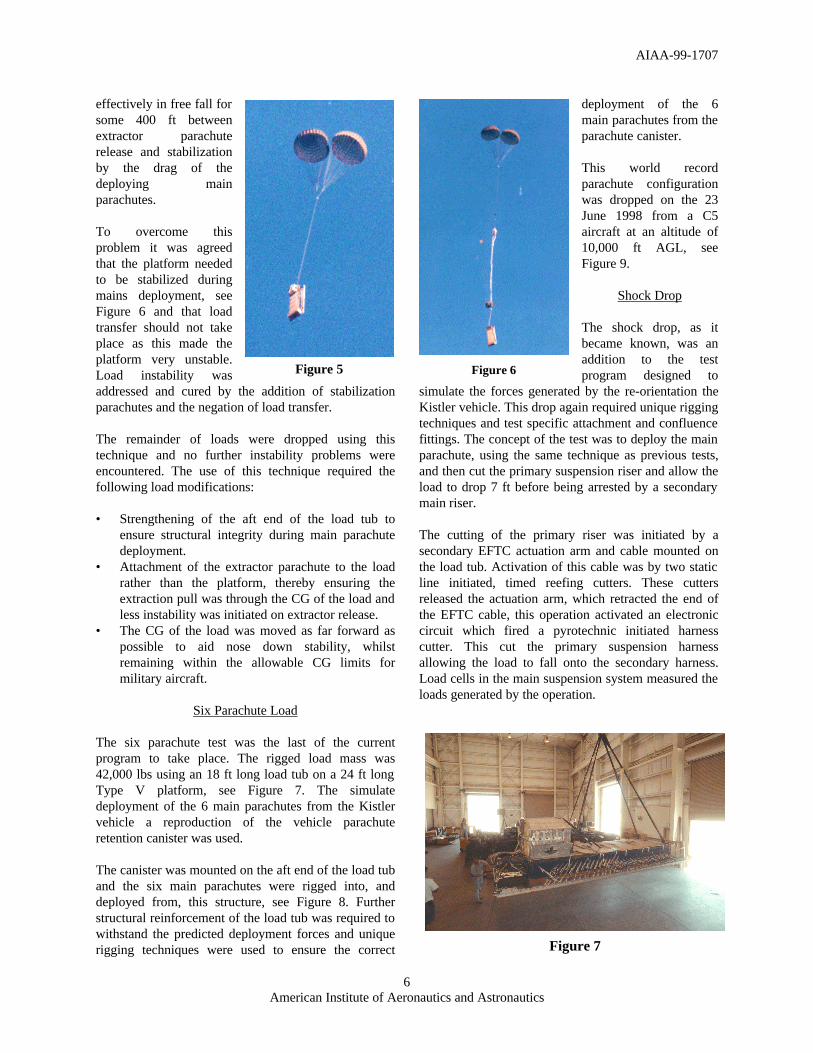
Test Loads Testing to date has been by the use of Type V platforms and ballast load tubs. Load tubs were rigged onto platforms using standard rigging techniques and the standard Extraction Force Transfer Coupling (EFTC) system was used for load extraction and parachute release. Test parachutes were mounted on the aft end of the load, see Figure 3 and deployed by the extractor parachute following extraction from the aircraft and EFTC release. To simulate realistic deployment of the main parachutes the extractor parachutes remained connected to the platform, see Figures 4 and 5, for a specified period after extraction. This allowed the load to reach the
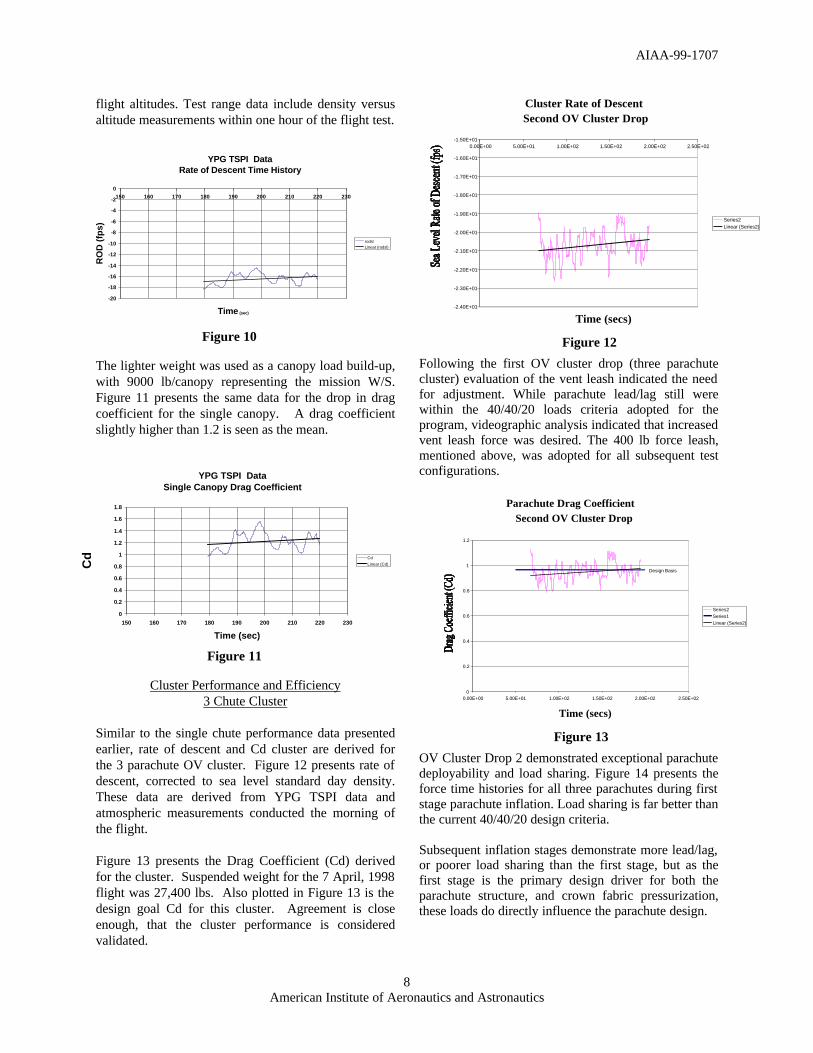
desired velocity prior to the deployment of the main parachutes. To achieve this the EFTC activation arm was secured in position with a nylon cord tie. Two static line initiated, timed reefing line cutters were used to cut this tie, after the specified time delay, thereby releasing the EFTC activation drop arm. Activation of the drop arm released the extractor parachute, which initiated deployment of the main test parachutes see Figure 6.
Load Release and Transfer On the first test the standard military drop technique was used. This entails the load transferring from a vertical to a horizontal orientation as the main parachutes are deploying. This system worked well for the first drop, however on the second drop the load cut one of the main suspension risers as it transferred. This caused a cascade failure of the remainder of the suspension system and the load broke free from the main parachutes. Following analysis of the test video it became apparent that the platform and load were aerodynamically every unstable as the main parachutes deployed. This was due to the fact that the load was
Figure 3
Figure 4
AIAA-99-1707
6 American Institute of Aeronautics and Astronautics
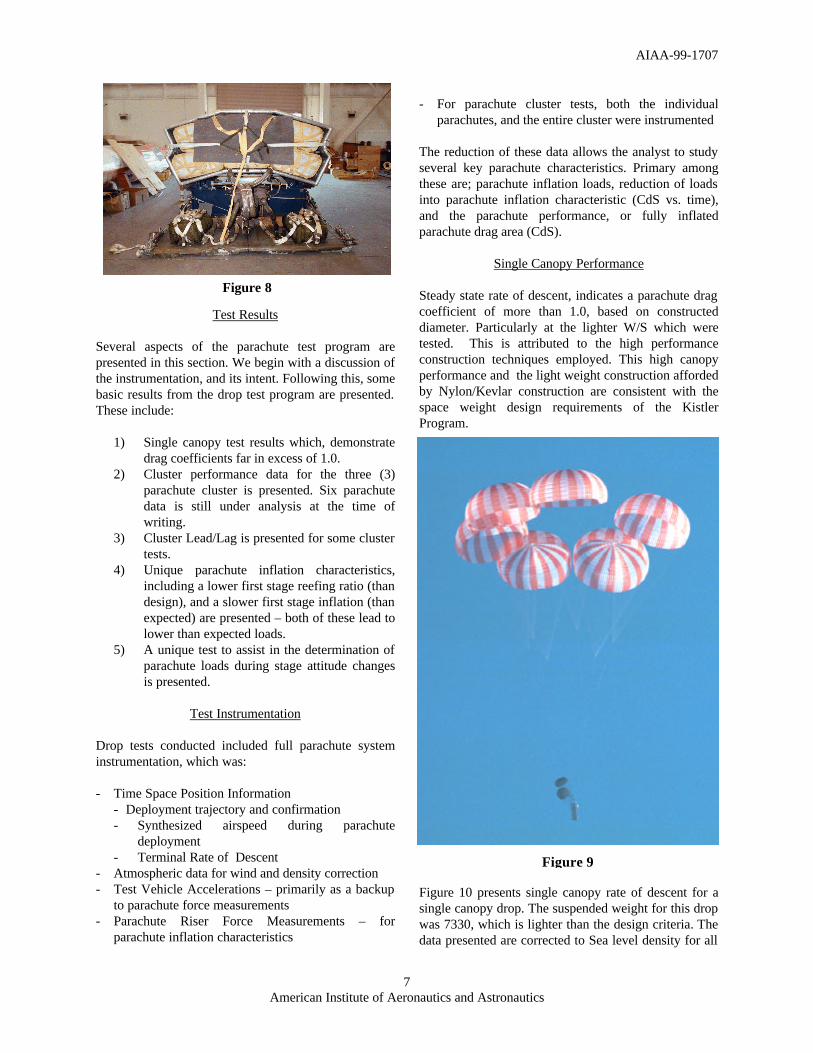
effectively in free fall for some 400 ft between extractor parachute release and stabilization by the drag of the deploying main parachutes. To overcome this problem it was agreed that the platform needed to be stabilized during mains deployment, see Figure 6 and that load transfer should not take place as this made the platform very unstable. Load instability was addressed and cured by the addition of stabilization parachutes and the negation of load transfer. The remainder of loads were dropped using this technique and no further instability problems were encountered. The use of this technique required the following load modifications: • Strengthening of the aft end of the load tub to
ensure structural integrity during main parachute deployment.
• Attachment of the extractor parachute to the load rather than the platform, thereby ensuring the extraction pull was through the CG of the load and less instability was initiated on extractor release.
• The CG of the load was moved as far forward as possible to aid nose down stability, whilst remaining within the allowable CG limits for military aircraft.
Six Parachute Load
The six parachute test was the last of the current program to take place. The rigged load mass was 42,000 lbs using an 18 ft long load tub on a 24 ft long Type V platform, see Figure 7. The simulate deployment of the 6 main parachutes from the Kistler vehicle a reproduction of the vehicle parachute retention canister was used. The canister was mounted on the aft end of the load tub and the six main parachutes were rigged into, and deployed from, this structure, see Figure 8. Further structural reinforcement of the load tub was required to withstand the predicted deployment forces and unique rigging techniques were used to ensure the correct
deployment of the 6 main parachutes from the parachute canister. This world record parachute configuration was dropped on the 23 June 1998 from a C5 aircraft at an altitude of 10,000 ft AGL, see Figure 9.
Shock Drop The shock drop, as it became known, was an addition to the test program designed to
simulate the forces generated by the re-orientation the Kistler vehicle. This drop again required unique rigging techniques and test specific attachment and confluence fittings. The concept of the test was to deploy the main parachute, using the same technique as previous tests, and then cut the primary suspension riser and allow the load to drop 7 ft before being arrested by a secondary main riser. The cutting of the primary riser was initiated by a secondary EFTC actuation arm and cable mounted on the load tub. Activation of this cable was by two static line initiated, timed reefing cutters. These cutters released the actuation arm, which retracted the end of the EFTC cable, this operation activated an electronic circuit which fired a pyrotechnic initiated harness cutter. This cut the primary suspension harness allowing the load to fall onto the secondary harness. Load cells in the main suspension system measured the loads generated by the operation.
Figure 5 Figure 6
Figure 7
AIAA-99-1707
7 American Institute of Aeronautics and Astronautics
Test Results Several aspects of the parachute test program are presented in this section. We begin with a discussion of the instrumentation, and its intent. Following this, some basic results from the drop test program are presented. These include:
1) Single canopy test results which, demonstrate drag coefficients far in excess of 1.0.
2) Cluster performance data for the three (3) parachute cluster is presented. Six parachute data is still under analysis at the time of writing.
3) Cluster Lead/Lag is presented for some cluster tests.
4) Unique parachute inflation characteristics, including a lower first stage reefing ratio (than design), and a slower first stage inflation (than expected) are presented – both of these lead to lower than expected loads.
5) A unique test to assist in the determination of parachute loads during stage attitude changes is presented.
Test Instrumentation
Drop tests conducted included full parachute system instrumentation, which was: - Time Space Position Information
- Deployment trajectory and confirmation - Synthesized airspeed during parachute
deployment - Terminal Rate of Descent
- Atmospheric data for wind and density correction - Test Vehicle Accelerations – primarily as a backup
to parachute force measurements - Parachute Riser Force Measurements – for
parachute inflation characteristics
- For parachute cluster tests, both the individual parachutes, and the entire cluster were instrumented
The reduction of these data allows the analyst to study several key parachute characteristics. Primary among these are; parachute inflation loads, reduction of loads into parachute inflation characteristic (CdS vs. time), and the parachute performance, or fully inflated parachute drag area (CdS).
Single Canopy Performance Steady state rate of descent, indicates a parachute drag coefficient of more than 1.0, based on constructed diameter. Particularly at the lighter W/S which were tested. This is attributed to the high performance construction techniques employed. This high canopy performance and the light weight construction afforded by Nylon/Kevlar construction are consistent with the space weight design requirements of the Kistler Program.
Figure 10 presents single canopy rate of descent for a single canopy drop. The suspended weight for this drop was 7330, which is lighter than the design criteria. The data presented are corrected to Sea level density for all
Figure 8
Figure 9
AIAA-99-1707
8 American Institute of Aeronautics and Astronautics
flight altitudes. Test range data include density versus altitude measurements within one hour of the flight test.
The lighter weight was used as a canopy load build-up, with 9000 lb/canopy representing the mission W/S. Figure 11 presents the same data for the drop in drag coefficient for the single canopy. A drag coefficient slightly higher than 1.2 is seen as the mean.
Cluster Performance and Efficiency 3 Chute Cluster
Similar to the single chute performance data presented earlier, rate of descent and Cd cluster are derived for the 3 parachute OV cluster. Figure 12 presents rate of descent, corrected to sea level standard day density. These data are derived from YPG TSPI data and atmospheric measurements conducted the morning of the flight. Figure 13 presents the Drag Coefficient (Cd) derived for the cluster. Suspended weight for the 7 April, 1998 flight was 27,400 lbs. Also plotted in Figure 13 is the design goal Cd for this cluster. Agreement is close enough, that the cluster performance is considered validated.
Following the first OV cluster drop (three parachute cluster) evaluation of the vent leash indicated the need for adjustment. While parachute lead/lag still were within the 40/40/20 loads criteria adopted for the program, videographic analysis indicated that increased vent leash force was desired. The 400 lb force leash, mentioned above, was adopted for all subsequent test configurations.
OV Cluster Drop 2 demonstrated exceptional parachute deployability and load sharing. Figure 14 presents the force time histories for all three parachutes during first stage parachute inflation. Load sharing is far better than the current 40/40/20 design criteria. Subsequent inflation stages demonstrate more lead/lag, or poorer load sharing than the first stage, but as the first stage is the primary design driver for both the parachute structure, and crown fabric pressurization, these loads do directly influence the parachute design.
YPG TSPI DataRate of Descent Time History
-20
-18
-16
-14
-12
-10
-8
-6
-4
-2
0150 160 170 180 190 200 210 220 230
Time (sec)
RO
D (
fps)
rodslLinear (rodsl)
Figure 10
YPG TSPI DataSingle Canopy Drag Coefficient
0
0.2
0.4
0.6
0.8
1
1.2
1.4
1.6
1.8
150 160 170 180 190 200 210 220 230
Time (sec)
Cd Cd
Linear (Cd)
Figure 11
Cluster Rate of DescentSecond OV Cluster Drop
-2.40E+01
-2.30E+01
-2.20E+01
-2.10E+01
-2.00E+01
-1.90E+01
-1.80E+01
-1.70E+01
-1.60E+01
-1.50E+010.00E+00 5.00E+01 1.00E+02 1.50E+02 2.00E+02 2.50E+02
Time (secs)
Series2Linear (Series2)
Figure 12
Parachute Drag CoefficientSecond OV Cluster Drop
0
0.2
0.4
0.6
0.8
1
1.2
0.00E+00 5.00E+01 1.00E+02 1.50E+02 2.00E+02 2.50E+02
Time (secs)
Series2Series1Linear (Series2)
Design Basis
Figure 13
AIAA-99-1707
9 American Institute of Aeronautics and Astronautics
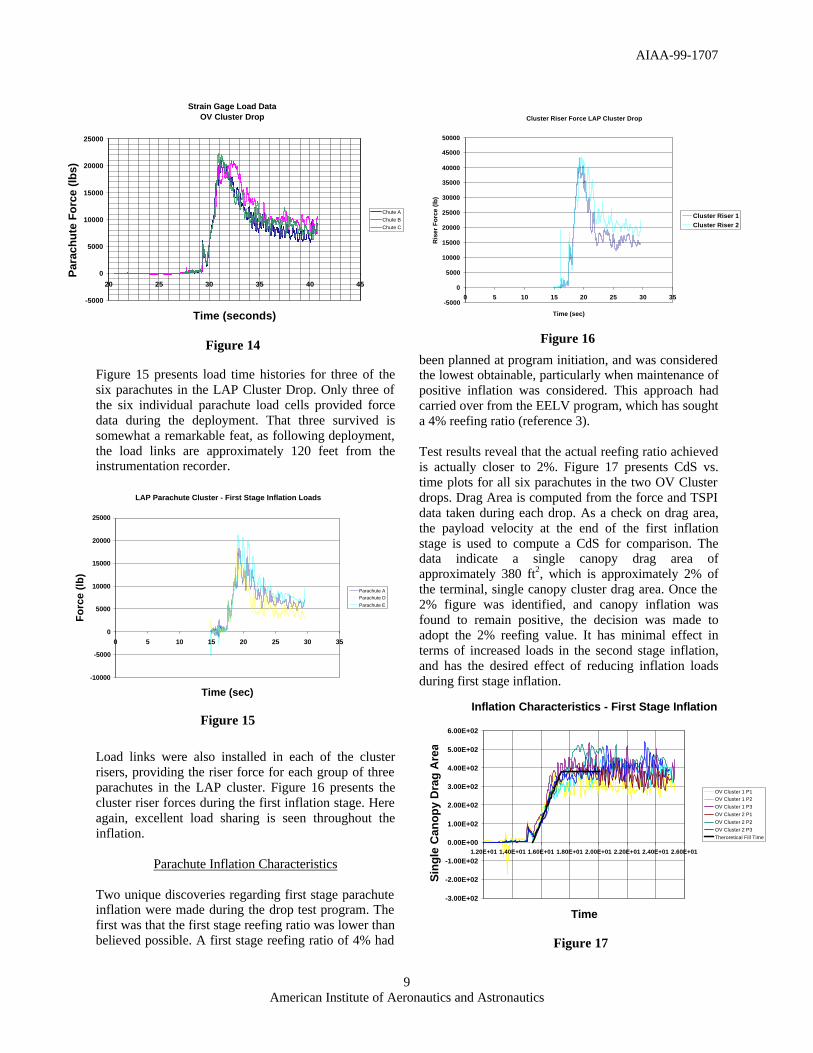
Figure 15 presents load time histories for three of the six parachutes in the LAP Cluster Drop. Only three of the six individual parachute load cells provided force data during the deployment. That three survived is somewhat a remarkable feat, as following deployment, the load links are approximately 120 feet from the instrumentation recorder.
Load links were also installed in each of the cluster risers, providing the riser force for each group of three parachutes in the LAP cluster. Figure 16 presents the cluster riser forces during the first inflation stage. Here again, excellent load sharing is seen throughout the inflation.
Parachute Inflation Characteristics Two unique discoveries regarding first stage parachute inflation were made during the drop test program. The first was that the first stage reefing ratio was lower than believed possible. A first stage reefing ratio of 4% had
been planned at program initiation, and was considered the lowest obtainable, particularly when maintenance of positive inflation was considered. This approach had carried over from the EELV program, which has sought a 4% reefing ratio (reference 3). Test results reveal that the actual reefing ratio achieved is actually closer to 2%. Figure 17 presents CdS vs. time plots for all six parachutes in the two OV Cluster drops. Drag Area is computed from the force and TSPI data taken during each drop. As a check on drag area, the payload velocity at the end of the first inflation stage is used to compute a CdS for comparison. The data indicate a single canopy drag area of approximately 380 ft2, which is approximately 2% of the terminal, single canopy cluster drag area. Once the 2% figure was identified, and canopy inflation was found to remain positive, the decision was made to adopt the 2% reefing value. It has minimal effect in terms of increased loads in the second stage inflation, and has the desired effect of reducing inflation loads during first stage inflation.
Strain Gage Load DataOV Cluster Drop
-5000
0
5000
10000
15000
20000
25000
20 25 30 35 40 45
Time (seconds)
Par
ach
ute
Fo
rce
(lb
s)
Chute A
Chute B
Chute C
Figure 14
LAP Parachute Cluster - First Stage Inflation Loads
-10000
-5000
0
5000
10000
15000
20000
25000
0 5 10 15 20 25 30 35
Time (sec)
Fo
rce
(lb
)
Parachute A
Parachute D
Parachute E
Figure 15
Cluster Riser Force LAP Cluster Drop
-5000
0
5000
10000
15000
20000
25000
30000
35000
40000
45000
50000
0 5 10 15 20 25 30 35
Time (sec)
Ris
er F
orc
e (l
b)
Cluster Riser 1Cluster Riser 2
Figure 16
Figure 17
Inflation Characteristics - First Stage Inflation
-3.00E+02
-2.00E+02
-1.00E+02
0.00E+00
1.00E+02
2.00E+02
3.00E+02
4.00E+02
5.00E+02
6.00E+02
1.20E+01 1.40E+01 1.60E+01 1.80E+01 2.00E+01 2.20E+01 2.40E+01 2.60E+01
Time
Sin
gle
Can
op
y D
rag
Are
a
OV Cluster 1 P1OV Cluster 1 P2
OV Cluster 1 P3
OV Cluster 2 P1
OV Cluster 2 P2
OV Cluster 2 P3
Theroretical Fill Time
AIAA-99-1707
10 American Institute of Aeronautics and Astronautics
The second interesting discovery was that canopy fill time during first stage inflation is slower than expected. Figure 17 presents a first stage fill time on the order of 2.0 seconds. Prior to drop tests, this inflation time had been estimated at approximately 1.0 seconds, based on historical data. This feature also, serves to lower first stage inflation loads slightly, a feature which is welcomed by the attachment structure designer.
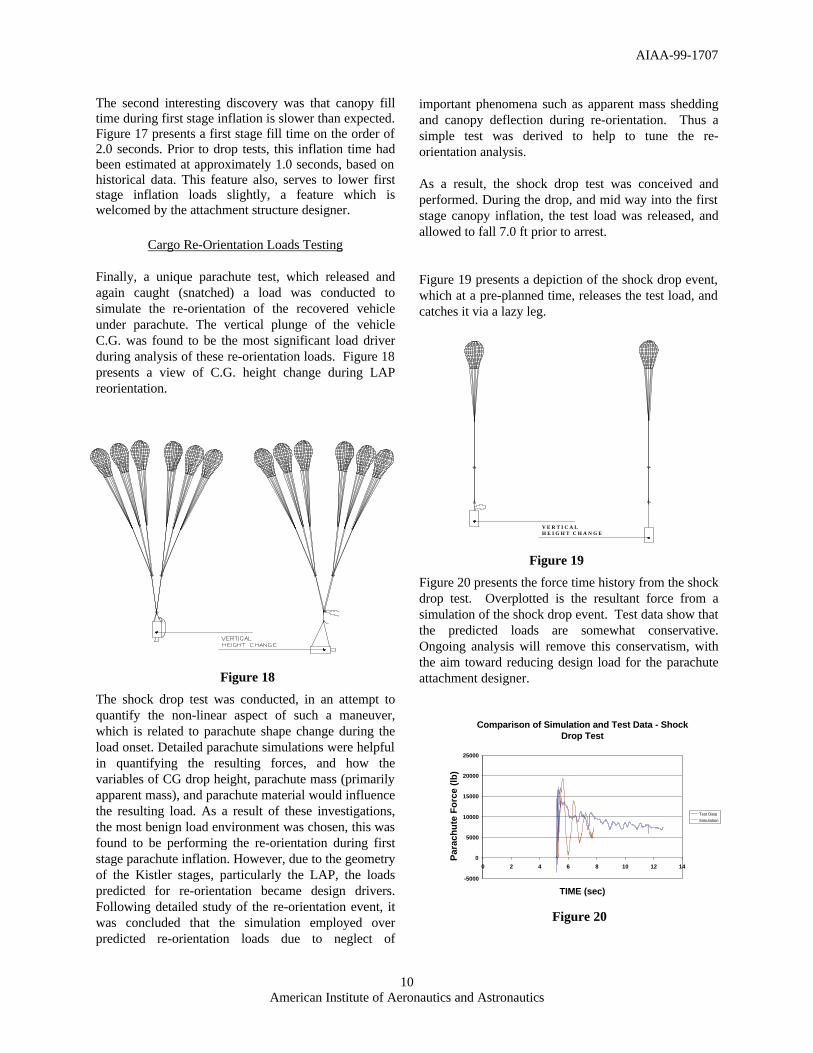
Cargo Re-Orientation Loads Testing Finally, a unique parachute test, which released and again caught (snatched) a load was conducted to simulate the re-orientation of the recovered vehicle under parachute. The vertical plunge of the vehicle C.G. was found to be the most significant load driver during analysis of these re-orientation loads. Figure 18 presents a view of C.G. height change during LAP reorientation.
The shock drop test was conducted, in an attempt to quantify the non-linear aspect of such a maneuver, which is related to parachute shape change during the load onset. Detailed parachute simulations were helpful in quantifying the resulting forces, and how the variables of CG drop height, parachute mass (primarily apparent mass), and parachute material would influence the resulting load. As a result of these investigations, the most benign load environment was chosen, this was found to be performing the re-orientation during first stage parachute inflation. However, due to the geometry of the Kistler stages, particularly the LAP, the loads predicted for re-orientation became design drivers. Following detailed study of the re-orientation event, it was concluded that the simulation employed over predicted re-orientation loads due to neglect of
important phenomena such as apparent mass shedding and canopy deflection during re-orientation. Thus a simple test was derived to help to tune the re-orientation analysis. As a result, the shock drop test was conceived and performed. During the drop, and mid way into the first stage canopy inflation, the test load was released, and allowed to fall 7.0 ft prior to arrest. Figure 19 presents a depiction of the shock drop event, which at a pre-planned time, releases the test load, and catches it via a lazy leg.
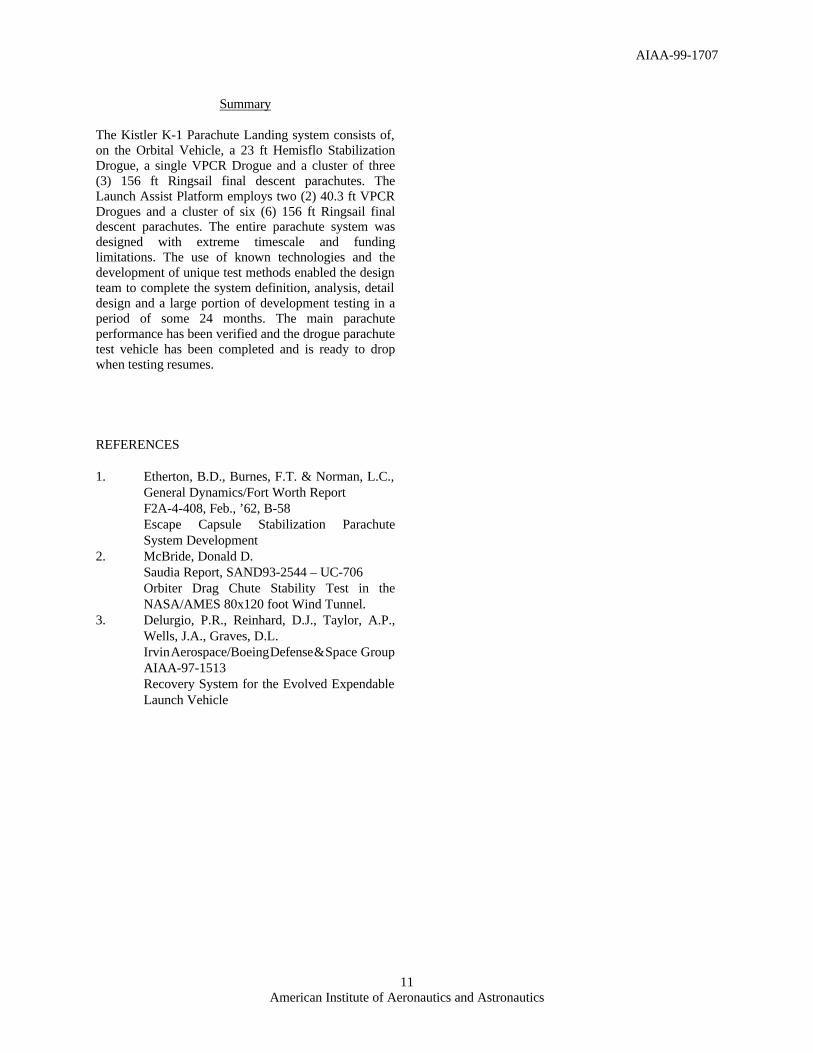
Figure 20 presents the force time history from the shock drop test. Overplotted is the resultant force from a simulation of the shock drop event. Test data show that the predicted loads are somewhat conservative. Ongoing analysis will remove this conservatism, with the aim toward reducing design load for the parachute attachment designer.
Figure 18
V E R T I C A LH E I G H T C H A N G E
Figure 19
Comparison of Simulation and Test Data - Shock Drop Test
-5000
0
5000
10000
15000
20000
25000
0 2 4 6 8 10 12 14
TIME (sec)
Par
ach
ute
Fo
rce
(lb
)
Test Data
Simulation
Figure 20
AIAA-99-1707
11 American Institute of Aeronautics and Astronautics
Summary The Kistler K-1 Parachute Landing system consists of, on the Orbital Vehicle, a 23 ft Hemisflo Stabilization Drogue, a single VPCR Drogue and a cluster of three (3) 156 ft Ringsail final descent parachutes. The Launch Assist Platform employs two (2) 40.3 ft VPCR Drogues and a cluster of six (6) 156 ft Ringsail final descent parachutes. The entire parachute system was designed with extreme timescale and funding limitations. The use of known technologies and the development of unique test methods enabled the design team to complete the system definition, analysis, detail design and a large portion of development testing in a period of some 24 months. The main parachute performance has been verified and the drogue parachute test vehicle has been completed and is ready to drop when testing resumes. REFERENCES 1. Etherton, B.D., Burnes, F.T. & Norman, L.C.,
General Dynamics/Fort Worth Report F2A-4-408, Feb., ’62, B-58 Escape Capsule Stabilization Parachute System Development
2. McBride, Donald D. Saudia Report, SAND93-2544 – UC-706 Orbiter Drag Chute Stability Test in the NASA/AMES 80x120 foot Wind Tunnel.
3. Delurgio, P.R., Reinhard, D.J., Taylor, A.P., Wells, J.A., Graves, D.L. Irvin Aerospace/Boeing Defense & Space Group AIAA-97-1513 Recovery System for the Evolved Expendable Launch Vehicle