design challenges for reciprocating ... - beta machinery
TRANSCRIPT

Editor’s Note: This article was adapted from a paper giv-en by the authors at the 2010 Gas Machinery Conference, Phoenix, Arizona, U.S.A., October 4-6. For further information or answers to questions, contact the authors at their e-mail address-es: [email protected] and mcyca@betamachinery. com. The authors acknowledge that the contributions from Brian Howes, chief engineer, and Hemanth Satish, project analyst, of Beta Machinery Analysis, were significant to the development and implementation of these concepts into Betas’ design and field services.
IntroductionComputer models are used to simulate many different as-
pects of the operation of reciprocating compressors. Typical applications of these models include simulating the com-pressor performance, torsional and lateral responses, deflec-tion and stress in the skid beams caused by lifting, dynamic response of the compressor cylinders, bottles and piping, and thermal expansion of the piping. Modeling of the com-pressor systems requires representing the physical proper-ties of the compressor, vessels, piping and gas. The physical properties of the compressor, vessels and piping are well defined. The physical properties of the gas are determined by testing and thermodynamic theory. Many different math-ematical models exist for calculating gas properties. Each of these models has various strengths and weaknesses in terms of the accuracy with which they represent the gas’ physical properties. Mathematical models have been developed that are well known and have been proven to accurately simulate common gases such as natural gas in pipeline applications.
june 2011 CompressorTechTwo
DESIGN CHALLENGES FOR RECIPROCATING COMPRESSORS IN SPECIALTY GAS SERVICES
Root Causes and Consequences of Inaccurate Performance and Pulsation Predictions
By Kelly Eberle, PE, and Michael Cyca, PECompressors operating in a refinery or manufacturing
facility are often used in applications where the gases are unique and simulation of the physical properties is not well understood. These specialty gases require proper selection of the model techniques to ensure that the results from the simulations result in a safe and reliable design.
Case studies presented here show the impact of incorrect modeling of gas properties. In the first case study, compres-sor performance simulation of an ethane service by many programs produce erroneous results. The second case study shows how inaccurate simulation of pressure pulsations leads to excessive vibrations on the compressor. Before discussing these case studies in detail, some background on compressor performance modeling, calculating gas properties and pres-sure pulsation analysis in these applications is necessary.
BackgroundCompressor Performance Simulation and Equa-
tions of State - Simulating or modeling the performance of a reciprocating compressor involves calculating the ex-pected flow, power consumption, discharge temperature, etc., based on the compressor geometry and operating information. The operating information typically includes inlet pressure, discharge pressure, inlet temperature and gas composition. The gas composition and operating data is used to calculate thermodynamic properties of the gas; these properties are then used in the performance calcula-tion. For example, the adiabatic discharge temperature for the gas that is being compressed, TD, can be calculated from the following equation.
Where: TS = suction temperature (absolute); R = compression ratio (absolute discharge pressure divided by absolute suc-tion pressure); k = ratio of specific heats.
The ratio of specific heats is a physical, or thermodynamic, characteristic of the gas. There is no theoretical means of cal-culating characteristics such as the ratio of specific heats for gases. Typically, experimentation is done to determine these properties at a few temperatures and pressures, and then models or equations of state (EoS) are derived.
These equations of state can then be used to calculate the thermodynamic properties of gases for a range of pressures and temperatures. Many EoS have been developed, such as Van der Waals, Redlich-Kwong, Peng Robinson, Berthelot and Dieterici to name a few. All EoS have pressure and tem-perature ranges and gas mixtures at which they are more ac-curate than others, so care must be taken to properly select the appropriate equation for the particular application.
Another factor that is important in the calculation of the gas properties is determining where the particular operating point is relative to the “critical point.” The critical point, also
Michael Cyca, PE, graduated from the University of Calgary in 2007 with an MS degree in Mechanical Engineering. Cyca’s interests are in design and modeling of mechanical systems, field validation and their failure modes. He has previous experience in computer simula-tions, experimental validation of computer models, data acquisi-tion. He has also worked as a teaching assistant at the University of Calgary, Department of Mechanical Engineering. Prior to his current position Cyca worked with Alstom Power in Switzerland on the de-velopment of gas turbines within the cooling and heat transfer group. Cyca joined Beta Machinery Analysis as a project analyst in March 2007, and has recently been running the torsional design group. He is currently branching out into acoustical and mechanical aspects of the design group as well as the field group.Kelly Eberle, PE, graduated from the University of Saskatchewan in 1986 with a BS degree in Mechanical Engineering. Since joining Beta Machinery Analysis in 1988, Eberle has accumulated a wide range of design and field experience, particularly in the area of pressure pulsation analysis, dynamic skid/foundation studies and mechanical analysis of reciprocating compressor and pump instal-lations. He also has troubleshooting experience, including large pipeline field installations and injection facilities. In his current role as principal engineer, Eberle is responsible for acoustical and mechanical standards. He also coordinates software R&D activities with Beta’s proprietary software programs. Eberle has co-authored numerous papers and presentations.
http://www.BetaMachinery.com

tuating pressure and temperature in reciprocating compres-sors means the gas properties will also be time dependent. Typically, these gas property dependencies on temperature are small but can be significant in some cases.
Pulsation Model - The mathematical model of the flow dynamics is as important as the calculation of the gas prop-erties. Different computer programs are available for simu-lating pressure pulsations in reciprocating compressor in-stallations. The programs fall into two basic groups. The first group is the first generation of programs that are based upon acoustic plane wave theory. These programs were developed in the 1970s and ’80s to replace analog comput-ers. These programs include many simplifying assumptions that enable the acoustic equations to be solved in the fre-quency domain. Thus, they are called Frequency Domain, or FD, programs.
The second generation of pressure pulsation simulation pro-grams started to be developed during the ’90s. These programs used a more sophisticated model of the fluid dynamics and were able to consider nonlinearities and time-varying bound-ary conditions at the compressor cylinder valves. These pro-grams simulate the fluid dynamics in the time domain and are commonly referred to as TD programs.
TD pulsation analysis programs are much more sophisticat-ed than the older FD-based programs and yield more accurate results. Also, the TD programs are able to calculate character-istics like dynamic pressure drop, which cannot be accurately determined by FD-based programs. The main drawback to TD programs is the longer solution times. They require faster computer hardware and more advanced solvers.
The methodology used by the pulsation analysis program to analyze the reciprocating compressor system is also key to a successful design. Shaking forces are generated by pressure pulsations coupled with the piping geometry. These forces must be minimized to ensure vibrations are acceptable. API 618, 5th Edition includes guidelines for shaking forces from pressure pulsations on piping and pulsation bottles [1]. How-ever, other pulsation shaking forces must be evaluated that are not yet included in API 618.
One such force that Beta Machinery Analysis (Beta) has identified during many years of design and field experi-ence is the shaking force acting between the pulsation bot-tle and the compressor cylinder, referred to as the cylinder shaking force. Figure 2 is a general arrangement drawing for a typical horizontal reciprocating compressor package showing this force. This shaking force is the result of the different pressure pulsation amplitudes and phases in the gas passage and pulsation bottle, and has been shown to cause excessive vertical vibration in horizontal compres-sors and, in some extreme cases, has caused failure of head end cylinder supports [2]. This shaking force can also result in high vibration in vertical compressors, as shown in Case Study 2.
Figure 2. Some shaking forces in a reciprocating compressor package.
june 2011 CompressorTechTwo
called a critical state, specifies the conditions (temperature and pressure) at which a phase boundary ceases to exist. It is extremely difficult to obtain the fluid properties at, or around, the critical point experimentally, or from EoS mod-els. The other region where an EoS is inaccurate is at very high pressure, both above and below critical temperature, unless careful modifications to the EoS are made, as will be demonstrated later in a case study.
The image shown in Figure 1 is a representative pressure-temperature phase diagram for water. The calculation of the gas properties is relatively simple for a gas when the proc-ess remains within the gaseous phase and below the critical temperature and pressure. In some cases the gas process transitions from one area of the phase diagram to another, requiring a more robust model of the gas properties.
Figure 1. Typical phase diagram.
The discharge temperature was cited earlier as one output from the compressor performance simulation that is dependent on accurate calculation of the gas properties. Other compressor performance results, such as volumetric efficiency, flow and power are dependent upon gas properties, such as the com-pressibility, ratio of specific heats, polytropic exponent, viscosity and specific gravity. Accurate calculation of these gas properties is key to accurate calculation of the compressor performance.
Pressure Pulsation Simulation
Gas Properties - The previous section described the im-portance of accurately simulating the gas properties when calculating compressor performance. Similarly, simulating pressure pulsations generated by reciprocating compressors involves many of the same aspects of simulating gas proper-ties. One key parameter in the understanding of pressure pulsations in a reciprocating compressor system is the acous-tic velocity, or speed of sound in the gas. The acoustic veloc-ity, c, can be calculated using the following equation.
Where: k = ratio of specific heats; T = absolute temperature (°K or °R); z = compressibility and SG = specific gravity.
The acoustic velocity in the gas is one of the most funda-mental and critical characteristics calculated for a pulsation analysis. Other acoustical characteristics are also dependent on the gas properties. Accurate calculation of gas properties is key to an accurate pulsation analysis.
Note that the equations referenced above are simplified assuming the gas properties are constant with time. The fluc-
http://www.BetaMachinery.com

june 2011 CompressorTechTwo
The following case studies show the effect of gas proper-ties on the simulation of compressor performance and pulsa-tion analysis.
Case Study 1Background - This case study includes a six-throw, two-
stage horizontal compressor in ethane service. A plan and elevation view of the compressor package is shown in Fig-ure 3. The compressor is driven by a 5200 hp (3900 kW) induction motor with a fixed full load speed of 885 rpm. Nominal suction and discharge pressures are 413 to 1215 psig (21.5 barg to 84 barg). The compressor package is rela-tively simple, with scrubbers on the first- and second-stage suction. An interstage cooler is not required on this package as is typical for compressors in this type of application. The discharge temperatures are well within the allowable range of safe operation without inter-cooling.
The gas in this service is 96% ethane, with the remainder of the gas being methane, propane and iso-butane, resulting in a specific gravity of 1.04.
Figure 3. Compressor plan and elevation views.
Once the unit was in operation, the owner had noted that the compressor was not performing as expected. There was a noticeable difference in the flow and power requirement.
Investigation - The review of the performance calcula-tions showed a significant difference between the calculat-ed and measured temperature of the first-stage discharge. A cursory review of the original performance calculations showed the expected first- and second-stage discharge temperatures were 79°F (26°C) and 129°F (54°C) compared to the observed temperatures of 124°F (51°C) and 191°F (88°C), a difference in the absolute temperature of 10%. The temperatures are measured at the cylinder nozzles and, hence, include the valve heating effects. A difference of 10% between a compressor performance model and ob-servation is generally acceptable. However, in this case the error continues to be compounded as temperature is used in other calculations of compressor performance and gas properties and because no cooler was used. Further investi-gation showed other performance factors, such as flow and power, were significantly different — much higher than 10% — when the original performance calculations were compared to the observations.
Before the pulsation model could be investigated, the in-accuracies in the compressor performance model needed to be resolved. Additional performance calculations were done using a variety of OEM programs, commercial programs and Beta’s own compressor performance program. The different
performance programs showed a wide variation in results. None of the OEM or commercial programs tested were able to accurately calculate the compressor performance. Several of the programs were not able to calculate the compressor performance for the two-stage operation, as the proper gas properties could not be calculated and the program was not able to achieve a mass balance for the first and second stage (the programs crashed or aborted because of errors). Beta’s compressor performance program calculated the first- and second-stage discharge temperatures to be 121°F (49°C) and 188°F (86°C), less than 1% difference between the calculated and measured absolute temperatures.
Figure 4 shows the difference between the discharge temperatures that were calculated by the various perfor-mance programs as compared to the observed discharge temperature. The discharge temperature is one of the fun-damental characteristics of the compressor performance, which must be calculated accurately as it is used in many other calculations. Errors in the discharge temperature cal-culation will be compounded in later calculations, resulting in greater errors.
Figure 4. Percent deviation in calculated absolute discharge tempera-ture from measured.
The main reason for the variation in the discharge temper-ature calculated in this case is that the first-stage discharge conditions were significantly above the critical pressure and temperature of the ethane phase diagram. Figure 5 shows a Mollier diagram for ethane with the first- and second-stage operating points shown. Additional corrections are required for ethane in this region to accurately calculate the gas prop-erties used in the compressor performance.
Compressor valve loss calculations would also be inaccu-rate because of errors in thermodynamic property variations. This error would lead to inaccurate overall performance pre-dictions for the compressor system. Careful consideration of the EoS and how it predicts pressure-volume-temperature relationships needs to be considered. As previously stated, inaccurate prediction of these relations would be carried over to all thermodynamic properties.
Figure 5. Mollier chart [3] showing two-stage compression.
http://www.BetaMachinery.com
june 2011 CompressorTechTwo
Problem Resolution — Case Study 2Background - This case study has a four-throw, single-
stage vertical compressor in ethylene service, as shown in Figure 6. The compressor is driven by a 1650 hp (1250 kW) motor at 420 rpm. The nominal suction and discharge pres-sures are 330 psig (23 barg) and 915 psig (63 barg).
Figure 6. Isometric view of the compressor installation.
At commissioning, the compressor had several vibration problems on the piping and vessels. Many support modifica-tions were implemented, which helped reduce vibrations. The compressor cylinder vibrations remained high and were increasing over time, such that the compressor was becom-ing unsafe to operate. Beta was contacted to determine causes and solutions.
Investigation - The evaluation began first with a review of the measurements and work previously conducted. A pul-sation and mechanical analysis of the compressor installation had been conducted by another consultant prior to construc-tion. Beta conducted site testing on the compressor to mea-sure pressure pulsations, vibrations and mechanical natural frequency measurements. Figure 7 shows an isometric of the piping system with test-point locations.
Figure 7. Test-point locations.
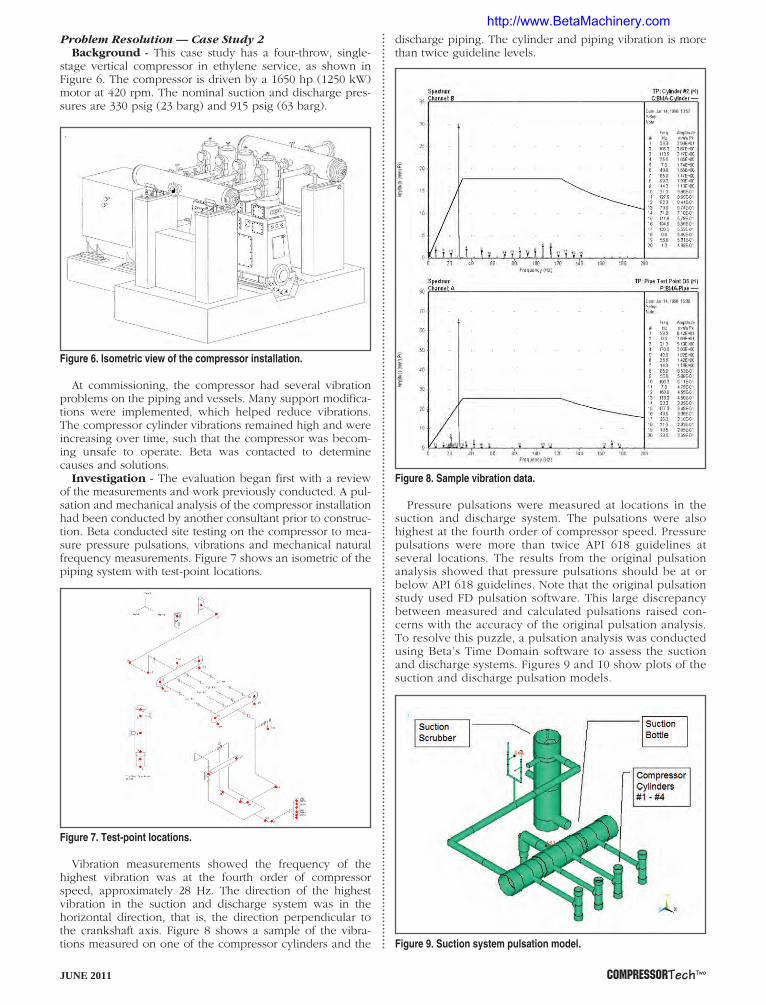
Vibration measurements showed the frequency of the highest vibration was at the fourth order of compressor speed, approximately 28 Hz. The direction of the highest vibration in the suction and discharge system was in the horizontal direction, that is, the direction perpendicular to the crankshaft axis. Figure 8 shows a sample of the vibra-tions measured on one of the compressor cylinders and the
discharge piping. The cylinder and piping vibration is more than twice guideline levels.
Figure 8. Sample vibration data.
Pressure pulsations were measured at locations in the suction and discharge system. The pulsations were also highest at the fourth order of compressor speed. Pressure pulsations were more than twice API 618 guidelines at several locations. The results from the original pulsation analysis showed that pressure pulsations should be at or below API 618 guidelines. Note that the original pulsation study used FD pulsation software. This large discrepancy between measured and calculated pulsations raised con-cerns with the accuracy of the original pulsation analysis. To resolve this puzzle, a pulsation analysis was conducted using Beta’s Time Domain software to assess the suction and discharge systems. Figures 9 and 10 show plots of the suction and discharge pulsation models.
Figure 9. Suction system pulsation model.
http://www.BetaMachinery.com

june 2011 CompressorTechTwo
Figure 10. Discharge system pulsation model.
Pressure pulsations calculated by the TD simulation were compared to measured pulsations as well as the pul-sations calculated in the original pulsation model. These pulsation results are shown in Figure 11. The pressure pulsations from the TD simulation agree with the measure-ments of the actual system. Note that the pressure pulsa-tions from the TD model are calculated for a speed range of ±10% of the compressor speed range. The actual com-pressor speed is fixed at 420 rpm, so only one pulsation value is measured at each order of compressor run speed in the field data.
Figure 11. Calculated and measured pressure pulsations.
The pressure pulsations calculated by the original pul-sation model are shown to be significantly less than the measured pulsations. The difference in the pulsation lev-els is, in part, because the original study used an FD pul-sation model. Beta also has an FD pulsation model and the simulation was rerun with it. The comparison between Beta’s FD and TD models showed only a small difference in pulsation results. The remainder of error in the original pulsation study model is from the calculation of the gas properties. As shown later, the calculation of the acousti-cal velocity is key to accurately calculating pulsation in this case.
The suction and discharge pulsation models were then evaluated in more detail, since the measurements showed the TD model more accurately represented the gas prop-erties and pulsation characteristics generated by the com-pressor. The shaking forces from pressure pulsations were generally found to be at low levels for the suction system
in the piping upstream of the suction pulsation damp-ener (bottle) and downstream of the discharge pulsation dampener. A high shaking force was calculated between the compressor cylinders and the discharge bottle at the fourth order of compressor run speed. This force is the result of an acoustical resonance between the bottle and cylinder, as shown in Figure 12. A one-quarter wave acoustical resonance sets up between the cylinder and bottle with high pulsations at the compressor cylinders and low pulsations at the bottle. The relatively long spool piece between the cylinder and bottle, and the properties of the gas at the discharge operating conditions, result in this resonance and a high horizontal force acting on the compressor cylinders and bottle, as illustrated in Figure 13. Note that this shaking force was not calculated as part of the original pulsation study.
Figure 12. Pulsation operating deflected shape plot showing resonance between cylinder and bottle.
Figure 13. Discharge system forces at fourth order of compressor speed.
Figure 14 shows spectrum plots of the discharge system cylinder horizontal forces. The forces acting on cylinders #2 and #3 are slightly lower than #1 and #4 because of the con-figuration of the internals in the pulsation bottle. In the 1990s, Beta developed a field-tested and proven cylinder nozzle force guideline. The amplitude of the cylinder forces at the fourth order of compressor speed are approximately twice Beta’s cyl-inder nozzle force guideline. Note that API 618 does not rec-ognize or include a guideline for this force.
http://www.BetaMachinery.com

june 2011 CompressorTechTwo
Figure 14. Discharge cylinder forces.
The cylinder forces are high when each force is considered individually. Since the cylinders are connected to a common bottle and support structure, the vector sum of all the forces needs to be considered. This compressor is a four-throw unit with 90° phasing between the throws. This crank phasing re-sults in the cylinder forces being perfectly in phase at the fourth order of compressor speed. The vector sum of the cylinder forces is shown in Figure 15, a force magnitude of more than 6750 lbf p-p (30 kN peak-peak). This combined cylinder force is clearly the cause of the compressor cylinder vibration.
Figure 15. Combined discharge cylinder force.
The suction system cylinder force was also evaluated to determine its effect on the cylinder vibration. The suction cylinder force was found to be much lower than the dis-charge cylinder force. The different gas properties in the suc-tion system as well as the different pulsation energy do not result in high suction cylinder forces.
The discharge pulsation model showed that a one-quarter wave acoustical resonance between the compressor cylinder and pulsation bottle is the source of the high shaking forces. The calculation of the acoustical resonant frequencies is de-pendent upon an understanding of the acoustic velocity. As noted in section 2.2.1, the acoustic velocity is dependent upon accurate calculation of the gas properties.
The pulsation modeling done in this case study showed that the gas properties were accurately simulated as the measured pulsations agreed with the simulations. The original pulsation model did not accurately calculate the gas properties and the pulsations resulting from the one-quarter wave resonance.
Problem Resolution - The cause of the compressor cyl-inder vibration is obviously the cylinder shaking force from
pressure pulsations. Modifications were evaluated with the pulsation model to determine a solution to minimize the cyl-inder force generated by pressure pulsations. The primary cause of the cylinder force is an acoustical resonance be-tween the compressor cylinder and bottle. One method of changing this acoustical resonance is to install a Helmholtz resonator in the pipe spool.
The Helmholtz resonator, named after Hermann von Helm-holtz, was first described in the 1850s. A Helmholtz resonator is a device with an acoustical resonance that can be tuned to a specific frequency. The resonance frequency can be tuned by changing the volume and/or restriction of the resonator. An example of how a Helmholtz resonator works is an uncorked wine bottle. When air is blown across the opening, a sound is heard at one frequency. The frequency of the sound can be al-tered by varying the amount of liquid in the bottle. Helmholtz resonators have been used by pulsation designers for many decades to control pressure pulsations in compressor systems. The main benefit of a Helmholtz resonator is that it introduces no (or very small) pressure drop. The downside of resonators is that they are effective over a narrow frequency range and they introduce additional resonances (pass bands) into the system. This compressor installation is an ideal application for a Helmholtz resonator since only one acoustic resonance is to be eliminated and the compressor has a fixed speed.
Figure 16 is a drawing of the proposed resonator design. The resonator includes a 26 in. (660 mm) section of 6 in. (152 mm) pipe with a 2 in. (51 mm) choke tube that is 14 in. (356 mm) long to achieve the necessary Helmholtz frequency.
Figure 17 shows the combined suction and discharge cyl-inder force for all cylinders for the original system design as well as with the Helmholtz resonator installed. The resonator is calculated to reduce the compressor cylinder force to 20 to 40% of the current levels. A similar reduction in vibrations is expected. New spool pieces were fabricated to connect the cylinders with the bottle, which now include the Helmholtz resonators. The spools were installed during an unscheduled shutdown due to work in another part of the facility.
Figure 16. Discharge system elevation and resonator section views.
Figure 17. Combined cylinder force for original and modified design.
http://www.BetaMachinery.com

Figure 18 shows the overall cylinder vibrations record-ed by the vibration transmitters permanently installed on the compressor cylinders before and after the reso-nators were installed. The resonators were very effective in reducing the cylinder vibrations to acceptable levels from approximately 0.71 ips (18 mm/s) RMS to 0.28 ips (7 mm/s) RMS.
Figure 18. Overall compressor cylinder horizontal vibration.
ConclusionsThis article demonstrates that a thorough understand-
ing of specialty gas properties is key to accurately simulat-
ing the performance of reciprocating compressors. OEM and commercial performance programs may have diffi-culty accurately simulating the compressor performance in some applications.
The case studies illustrate the strength of pulsation anal-ysis software that includes consideration of specialty gas properties and a nonlinear, Time Domain model of the fluid dynamics. Accurately calculating gas properties is crucial to determining the acoustic velocity and acoustical resonances in the piping and vessels. Frequency Domain pulsation soft-ware has severe limitations producing less accurate model results, which may compromise the safety of the reciprocat-ing compressor installation.
The design criteria specified in API 618 are the minimum standard for pulsation studies. Other criteria, such as the pulsation-generated shaking force between the compressor cylinder and pulsation bottle, must also be considered.
Conducting compressor performance simulations and pulsation studies for specialty gases requires sophisticated, field-proven engineering software. A
References[ 1] American Petroleum Institute, Reciprocating Compres-sors for Petroleum, Chemical, and Gas Industry Services, API Standard 618, 5th Edition, December 2007. [2] B. Howes, “Vertical Forces Cause Vibration in a Recip-rocating Compressor, Pipeline and Compressor Research Council,” Gas Machinery Conference, 1997. [3] Gas Processor Suppliers Association, Engineering Data Book Volume II, Gas Processor Association, 1987.
REPRINTED FROM JUNE 2011 CompressorTechTwo Copyright Diesel & Gas Turbine Publications
Printed in U.S.A.
http://www.BetaMachinery.com