design considerations and analysis planning of a phase 2a
TRANSCRIPT

RESEARCH ARTICLE Open Access
Design considerations and analysisplanning of a phase 2a proof of conceptstudy in rheumatoid arthritis in thepresence of possible non-monotonicityFeng Liu1,2* , Stephen J. Walters2 and Steven A. Julious2
Abstract
Background: It is important to quantify the dose response for a drug in phase 2a clinical trials so the optimal dosescan then be selected for subsequent late phase trials. In a phase 2a clinical trial of new lead drug being developedfor the treatment of rheumatoid arthritis (RA), a U-shaped dose response curve was observed. In the light of this resultfurther research was undertaken to design an efficient phase 2a proof of concept (PoC) trial for a follow-on compoundusing the lessons learnt from the lead compound.
Methods: The planned analysis for the Phase 2a trial for GSK123456 was a Bayesian Emax model which assumes thedose-response relationship follows a monotonic sigmoid “S” shaped curve. This model was found to be suboptimal tomodel the U-shaped dose response observed in the data from this trial and alternatives approaches were needed to beconsidered for the next compound for which a Normal dynamic linear model (NDLM) is proposed. This paper comparesthe statistical properties of the Bayesian Emax model and NDLM model and both models are evaluated using simulationin the context of adaptive Phase 2a PoC design under a variety of assumed dose response curves: linear, Emax model,U-shaped model, and flat response.
Results: It is shown that the NDLM method is flexible and can handle a wide variety of dose-responses, includingmonotonic and non-monotonic relationships. In comparison to the NDLM model the Emax model excelled withhigher probability of selecting ED90 and smaller average sample size, when the true dose response followed Emax likecurve. In addition, the type I error, probability of incorrectly concluding a drug may work when it does not, is inflatedwith the Bayesian NDLM model in all scenarios which would represent a development risk to pharmaceuticalcompany.The bias, which is the difference between the estimated effect from the Emax and NDLM models and the simulatedvalue, is comparable if the true dose response follows a placebo like curve, an Emax like curve, or log linear shapecurve under fixed dose allocation, no adaptive allocation, half adaptive and adaptive scenarios. The bias though issignificantly increased for the Emax model if the true dose response follows a U-shaped curve.
Conclusions: In most cases the Bayesian Emax model works effectively and efficiently, with low bias and goodprobability of success in case of monotonic dose response. However, if there is a belief that the dose responsecould be non-monotonic then the NDLM is the superior model to assess the dose response.
Keywords: Emax, NDLM, Dose response, Bayesian, Rheumatoid arthritis
* Correspondence: [email protected], Inc, 1250 South Collegeville Road, PO Box 5089,Collegeville, PA 19426-0989, USA2Medical Statistics Group, University of Sheffield, Sheffield, UK
© The Author(s). 2017 Open Access This article is distributed under the terms of the Creative Commons Attribution 4.0International License (http://creativecommons.org/licenses/by/4.0/), which permits unrestricted use, distribution, andreproduction in any medium, provided you give appropriate credit to the original author(s) and the source, provide a link tothe Creative Commons license, and indicate if changes were made. The Creative Commons Public Domain Dedication waiver(http://creativecommons.org/publicdomain/zero/1.0/) applies to the data made available in this article, unless otherwise stated.
Liu et al. BMC Medical Research Methodology (2017) 17:149 DOI 10.1186/s12874-017-0416-3
BackgroundAn ongoing and serious challenge facing the pharma-ceutical industry is the high failure rate in the late phaseof drug development [1]. It has been reported that ap-proximately 50% of Phase 3 clinical trials fail and themain explanations are the wrong dose being selected orpoor understanding of the dose response in Phase 2 tri-als [1, 2]. Therefore, it is critical to identify the correctdose in Phase 2 clinical trials to improve the Phase 3success rate and thus increase research and developmentproductivity [3, 4].An assessment of dose response normally starts with a
linear or nonlinear regression of a drug response for givendoses [5]. Many biological activities follow a 4-parameterlogistic model, and the Emax model is a special case ofthe 4-parameter logistic model [3]. Among the possibledose response models, Emax model is one of the mostwidely applied models relating drug concentrations toeffects [3]. In practice, the Emax model assumes the drugeffect is proportional to the dose, i.e. the bigger the dose,the bigger the effect. Thomas et al. [6] showed thatmajority of dose response models in the dose response ofsmall molecule compounds were Emax models based ondose response curves from a single company and therewere two cases reported a likely U-shaped dose responsethat Emax model failed to fit [6].As the name implies a U-shaped dose response is a
dose response where there is a down-turn of the clinicaldose-response relationship at higher doses. In thecontext of the problem being investigated, we had aprior belief from a lead compound, where a U-shapeddose response was observed, that the dose response forthe follow-on compound in the same drug class mayalso be U-shaped. For this reason, a U-shaped dose-response is considered to be pharmacologically plausiblefor the follow-on compound as well as for the reasonthat a U-shaped dose response had been seen in otherbiological treatments for RA [7–10].There are a number of dose response models available
to handle the non-monotonic U-shaped dose responserelationships [4]. One alternative is the Normal DynamicLinear Model (NDLM) which originated in time seriesmodelling and is a method for model smoothing usinginformation borrowed from neighbouring doses [11].Berry [12] then proposed the NDLM model for theadaptive designs and in the post-herpetic neuralgia trial,Smith et al. [13] applied a Bayesian NDLM model to apharmaceutical drug trial where patients were rando-mised to a dose based on the dose response model esti-mated from a posterior distribution. A Bayesian NDLMmodel was also used in an Acute Stroke Therapy by In-hibition of Neutrophils (ASTIN) trial [14]. In the ASTINtrial patients were allocated 1 of 15 doses, or a placebo,adaptively based on the response and the study allowed
for early termination for efficacy or futility based on pos-terior probability using a Bayesian NDLM model. In theASTIN trial, a Markov chain Monte Carlo approach wasused to derive a posterior distribution for the model pa-rameters which informed the estimation of the ED95. Inaddition, there have been other applications of NDLMmodel such as in in phase 2/3 study for dose selection ofdiabetes drug development [15].For the study being planned there was an interest in the
comparisons of both Emax model and NDLM models forthe dose response assessment in a Phase 2a trial in patientswith rheumatoid arthritis (RA). The Phase 2a trial was ini-tially designed to investigate the treatment effect of differ-ent dose levels of GSK123456, using Bayesian Emax modelwhich was used to guide the Bayesian analysis in searchingfor the dose levels targeting at ED90 for future cohorts.The compound later failed since a U-shaped like curve wasobserved in the dose response. The Emax model makes anassumption of a monotonic dose response relationshipwhich was seemed to be violated in this trial.A follow-on compound GSK654321, which is in the
same drug class of GSK123456, is in development. Thechance for GSK654321 having a U-shaped curve cannotbe ruled out, therefore the emphasis of this manuscriptis to find a suitable dose response model and design forfuture Phase 2a design of GSK654321, which would pro-vide reasonable design operating characteristics underboth monotonic dose response and non-monotonic doseresponse. In the following section, two main statisticalmodels (Emax and NDLM) for estimating a dose responserelationship are described and compared in a Phase 2atrial in patients with rheumatoid arthritis (RA). Also touse extensive simulations to show how the two modelsperform under a fixed and adaptive designs under avariety of assumed dose-response profiles with a focus onU-shaped response curve, a pharmacologically plausibledose response curve in GSK654321.
MethodsBackground of clinical trials in RA patientsA primary endpoint of a typical Phase 2 clinical trial is thechange from baseline in DAS28 score. DAS28 is a measureof disease activity score and the number 28 refers to the28 joints that are examined in this assessment.To calculate the DAS28 [16], a clinician will:
1. count the number of swollen joints (out of the 28);2. count the number of tender joints (out of the 28);3. take blood to measure the erythrocyte sedimentation
rate (ESR) or C reactive protein (CRP);4. ask the patient to make a ‘global assessment of health’
(indicated by marking a 10 cm line between very goodand very bad).
Liu et al. BMC Medical Research Methodology (2017) 17:149 Page 2 of 14

The results from these four domains are then combinedto produce an overall disease activity score ranging from 2to 10, with a higher score indicating more disease activity.A DAS28 of greater than 5.1 implies active disease,less than 3.2 low disease activities, and less than 2.6as remission.
Bayesian Emax modelThe Emax model is a widely applied model relating drugconcentrations to effects [3] and was planned for theanalysis of dose response in the Phase 2a trial.The Emax model is written as
ΔDAS28 ¼ E0þ Emax�DoseED50þ Dose
þ ε; ε∼Nð0; σ2Þ ð1Þ
where ΔDAS28 is the change in DAS28 score from base-line at day 56 post-randomisation, E0 is the basal effectcorresponding to the response when the drug dose isequal to 0, Emax is the maximum achievable increase ordecrease over placebo response, ED50 is the dose whichproduces 50% of the effect. All the doses were half-logspaced at design stage with exception of 20 mg/kg. Themaximum dose level across the study cohorts is 30 mg/kg. The 30 mg/kg dose is the maximum tolerated dosefor the study based on prior studies. If the posteriormean of ED90 exceeded 30 mg/kg, the maximumplanned dose of 30 mg/kg is used. The priors of modelparameters E0 and Emax follow a Normal distributionwith large variance i.e. N(0,1E4) and the prior distribu-tion of ED50 are N(3,1E2). The prior on σ2 is an inversegamma distribution (IG(0.5,0.7). Markov Chain MonteCarlo (MCMC) were used to simulate the posteriors dis-tribution: 2500 samples were used to estimate the modelparameter after burn-in of 500. A larger burn-in was runand didn’t significantly improve the model fitting andestimation parameters.The parameters of interest for the Emax model can be
estimated by maximum likelihood estimation (MLE) andBayesian methods – we chose this approach as Bayesianstatistics [17] integrates information into the computa-tion of the posterior probability of parameters, using theaccumulated data observed so far for later doses andprior information for the early doses. In addition, theparameters from Bayesian method are displayed asdistributional profile - which can be useful to illustrateuncertainty - and offer a robust estimation of parametersin complicated model [17].
Bayesian normal dynamic linear model (NDLM)A NDLM can be used to fit to estimate the dose-response relationship. The description of the NDLMused in the analysis is shown below,
ΔDAS28jk∼N θj; σ2
� �; ð2Þ
θj ¼ θj−1 þ δj−1 þ ωj;where j ¼ 2;ωj ∼ Nð0; σθ2Þ;: δj ¼ δj−1 þ vj;where vj ∼ Nð0; σδ2Þ
where ΔDAS28 is the observed individual change inDAS28 score from baseline at day 56 post-randomisationat Dosej. The likelihood of DAS28 at day 56 change frombaseline follows a Normal distribution with mean (θj) foreach Dosej and with variance of σ2, the Dosej is assumedto be spaced equally. θj is the estimated treatment effect atDosej. Furthermore, θj has a linear relationship withneighboring θj−1 with intercept θj−1 and slope of δj−1. θ1 isthe untreated or placebo response when the drug dose isequal to 0 and both θ1 and δ1 follow Normal distributions.Similar to Emax model, the coefficients for the NDLMmodel can be estimated from maximum likelihoodmethods [18] and Bayesian methods – we used theBayesian NDLM method because Bayesian methods offerrobust estimation of parameters with complicated modelsand provides better model fitting in both monotonic andnon-monotonic dose response [17].The prior distribution on θ has a vague Normal distri-
bution with a large variance estimated from inverse-gamma distribution (IG(0.5, 72). The prior distributionson σ2 and the evoluation variance σθ
2 and σδ2 are inverse-
gamma distribution (IG(0.5, 72).
Motivating studyAn initial Phase 2a Proof-of-concept (PoC) study wasundertaken to demonstrate whether a new drug,GSK123456, achieves a certain level of pre-designatedefficacy at a planned dose in RA [19]. The first part (PartA) of this PoC study was a learning phase with singledose escalation using a cohort randomised trial [19].Patients were randomised within each cohort to eitherplacebo or an active dose of GSK123456. Only the start-ing dose in cohort 1 was pre-defined and subsequentdoses for other cohorts were selected using a Bayesiandose response Emax model [19]. A U-shaped doseresponse curve for DAS28 change from baseline wasobserved with the highest response at 3 mg/kg (Fig. 1).A consequence of this was the estimation of ED90 wassuboptimal with higher variability.A dose response in a new class of compound or
target is generally unknown due to the biology and isnot well understood, especially the drug is never beingtested in healthy volunteers or patients. Further phar-macokinetic and pharmacodynamics data suggests theU-shaped curve may be due to moderate bindingaffinity and rapid off-rate of GSK123456 as comparedto the higher affinity OSM receptor causing a proteincarrier effect [19].
Liu et al. BMC Medical Research Methodology (2017) 17:149 Page 3 of 14

The follow-on compound GSK654321 is in the samedrug class. It binds to the same binding site asGSK123456 and it is believed to have therapeutic proper-ties but with higher potency. Therefore, the chance of U-shaped dose response cannot be ruled out. It is importantto highlight however that Emax was the pre-specified ana-lysis. Given the U-shaped curves being pharmacologicallyplausible in the follow-on compound GSK654321, there isa strong desire to compare and adopt a more flexiblemodel, such as NDLM model, to handle both monotonicand non-monotonic dose response in the design andanalysis consideration.We have observed how Emax model was suboptimal in
modelling the dose response. We then applied a model –NDLM – retrospectively, we know should work for theobserved data and then demonstrated it was superior. ForNDLM to be prospectively planned for GSK654321 thereis need first to do further evaluations of its properties inthe context of a RA PoC study design in the possiblepresence of non-monotonicity.In next sections, we will explore the NDLM model, to
compare the performance of the Emax model and theNDLM under various assumptions about the shape ofthe dose response curves - flat curve, Emax like curve,Log-linear curve and U-shaped curve.
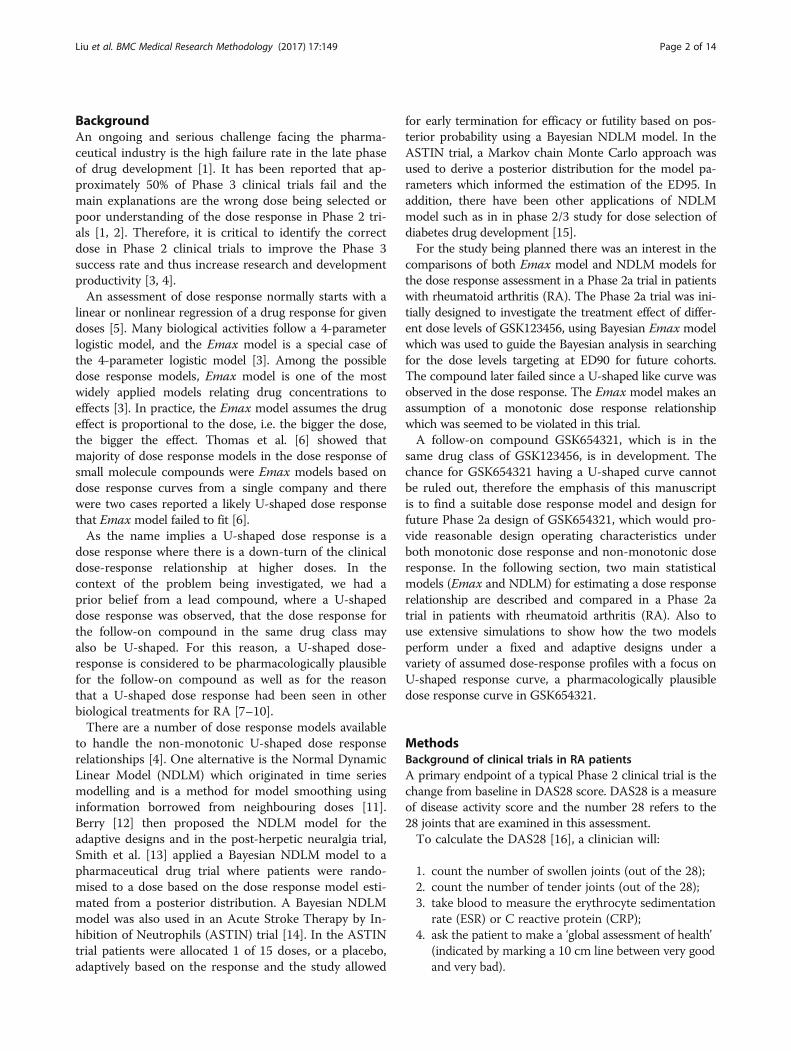
SimulationDose response models in the evaluationFor the simulations four true dose response profiles (Fig. 2)are used for the primary endpoint, change in DAS28 scorefrom baseline to day 56, to mimic the wide range of doseresponse scenarios likely to be observed and be analysed as
dose response methods in clinical practice. In all models,the placebo effect (on the background of MTX) was set tobe −0.5. That is a change in DAS28 score from baseline today 56 post-randomisation of −0.5 points i.e. a smalldecline/improvement is disease activity. The error term εwas assumed to be independently Normally distributedwith a mean of 0 and a variance of 1.44 for Emax, Loglinear and U-shaped curve, which was the estimated vari-ance from PoC study of GSK123456 (Fig. 2), the error termhas variance 0.25 for placebo like response.
Profile 1 Flat curve: ΔDAS28 = −0.5 + ε
Profile 2 Emax curve:y ΔDAS28 = −0.5–1.7*Dose/(2.5 + Dose) + ε, ED50is 2.5.
Profile 3 Log linear curve: ΔDAS28 = −0.5 -log(Dose + 1) + ε
Profile 4 U-shaped curve: ΔDAS28 follows a predefined U shaped curvewith: ΔDAS28 = (−0.5,-0.7,-1.6,-1.8,-1.2,-1, −0.6) fordose 0, 0.03, 0.3, 3, 10, 20, and 30 mg/kg respectively.
These four profiles were chosen as plausible doseresponses for the new compound in developmentGSK654321 ranging from a null effect (Profile 1) to whatwas previously observed with GSK123456 (Profile 4).The scenarios of fixed design simulation and adaptive
design simulation are discussed in the next section. Thetwo basic designs set up are a fixed design and an adaptivedesign. The fixed design assumes that all six doses andplacebo are allocated to a fixed number of patients. Noadaptations are adopted in this design. In the adaptivedesign, the subjects are allocated according to the doseresponses of all the subjects enrolled in the study.
Fig. 1 Mean and estimated dose response of mean change in DAS28 scores from baseline using Bayesian Emax and NDLM models. The meanchanges in DAS28 score between the doses were connected with a straight line in solid blue lines; the data are for illustration purpose so theerror bars are not presented. Emax model is displayed as red dash/dotted line and NDLM model as green dotted line
Liu et al. BMC Medical Research Methodology (2017) 17:149 Page 4 of 14
Design of the Simulation StudyThe range of doses is between 0.03 mg/kg to 30 mg/kg.The design is a parallel design and the total targetsample size is 64. The goal of the trial is to characterisethe dose-response curve at various doses. The fixeddesign assumes that all 6 doses are allocated to a fixednumber of patients with no interim analysis or adapta-tion of the dose. In the adaptive simulation, the subjectsare allocated due to the subjects’ response in the studyat the end of each cohort.Decisions regarding success and futility of the trial at
completion are made based on the probability of DAS28relative to control greater than clinically significantdifference (a decrease of 0.95 as measured by DAS28change from baseline between placebo and treatment).The positive difference of placebo and treatment is usedto facilitate the positive effect and probability calculation.All the designs except fixed scenarios include 8 cohorts,with 8 patients in each cohort (2 on placebo and 6 onactive treatment).An adaptive design was used in the PoC design of
GSK123456 and is considered as a better option thanfixed design since it increases the chance of stopping afailed compound and expediting a good one as well aspotentially maximizing the information on the doseswhich are most interest to carry forward for laterdevelopment. For GSK654321 the study design has notbeen finalised. The wish therefore was to evaluatemodelling the dose response using NDLM or Emax fordifferent options for the study design which we havedetailed. The follow-on compound GSK654321 is in the
same drug class as GSK123456 which demonstratedgood safety and tolerability in the PoC study [19], sothere is no single dose escalation planned for the PoCstudy in GSK654321.ED90 is defined as the dose to achieve 90% of
maximum DAS28 response with the lower dose chosenif there are multiple values. In this calculation themaximum response is estimated from the maximalDAS28 effect at all doses. The 90% (ED90) of maximumresponse is then calculated as the lowest nominal dosein which is closest to the estimated dose that achieves90% of maximal efficacy. The following fixed design aswell as adaptive design scenarios are considered in thedesign options and evaluations.
Scenario 1 Fixed design; the design is non-adaptive, the study allo-cates 8 patients to receive doses of GAK654321 (0.03, 0.3, 3,10, 20 and 30 mg/kg) and 16 patients to receive placebo.There is no interim stopping and adaptation in the fixeddesign. The evaluation of final success will occur at the endof the study.
Scenario 2 No adaptive allocation; the ratio of patients (100% of theplanned sample size) randomized into each study dose(placebo, 0.03, 0.3, 3, 10, 20 and 30 mg/kg) are 2:1:1:1:1:1:1.The placebo is given to a fixed proportion of the samplesize allocation to ensure there is enough power fortreatment comparisons vs. placebo. There are a total of 8cohorts (6 treated +2 placebo) and the interim analysis willoccur between cohorts, for example, at 8 patients, 16patients, 24 patients, 32 patients (50%), 40 patients (62.5%)and 48 patients (75%) enrolled and complete the primaryendpoint assessment (day 56 post-randomisation DAS28score). The study is evaluated with the interim study successand interim study futility.
Fig. 2 The four true Dose-response profiles used in the simulations. The model profiles include a placebo like flat curve which is denoted in blueand is fixed at −0.5 for all dose levels, a dose proportional Emax model in red, a log-linear model in green, and a U-Shaped model in purple. Thelabel for the vertical axis is the change in DAS28 score from predose at day 56 post-randomisation
Liu et al. BMC Medical Research Methodology (2017) 17:149 Page 5 of 14

(Continued)
Scenario 3 Half adaptive, the first 50% of subjects are fixed allocatedusing pre-defined allocation ratio of treatments and placebofollowed by adaptive allocation for the rest of the subjectsbased on the posterior distribution of dose around ED90;the placebo is given to a fixed proportion of the sample sizeallocation to ensure we have enough power for treatmentcomparisons vs. placebo. The fixed proportion is 25% of thetotal sample size. For each study dose (0.03, 0.3, 3, 10, 20 and30 mg/kg), the 4 patients (50% of the planned sample size)will be randomized first, prior to any interim analysis. The doseresponse curve will then be fitted using the dose responsemodel and ED90 is estimated. For each subject randomisedinto the study afterwards, the dose level will be randomizedto the dose close to the ED90 dose response. The interim ana-lysis will occur at 32 patients (50%), 40 patients (62.5%) and 48patients (75%) that complete the primary endpoint assess-ment. The study is evaluated for interim study success and in-terim study futility.
Scenario 4 Adaptive allocation after the first cohort. In the fully adaptivesimulation, the placebo is given a fixed proportion of thesample size allocation to ensure there is enough power fortreatment comparisons vs. placebo. The fixed proportion is25% of the total sample size. The dose response curve will befitted using the dose response model and ED90 is estimated.For each subject randomised into the study afterwards, thedose level will be randomized to the dose close to ED90 doseresponse. The interim analysis will occur between cohorts, forexample, at 8 patients, 16 patients, 24 patients, 32 patients(50%), 40 patients (62.5%) and 48 patients (75%) enrolled andcomplete the primary endpoint assessment. The study isevaluated for interim study success and interim study futility.
The simulation and analysis are performed using a datasimulation and analysis software - FACTs (Fixed andAdaptive Clinical Trial Simulator) version 2.1 and 4.05developed by Tessella and Berry Consultant. Simulateddata are fitted using similar Emax model and NDLMmodels as described in Eqs. 1 and 2. It is possible that thechoice of informative prior impacts the simulation results[20], for consistency and comparison purpose, a vagueprior is chosen in the calculation and simulation. Thepriors for the Emax model parameters Eo and Emax arevague and follow a Normal distribution with large variance.Thus, the prior of model parameter E0 is N(0,1E4) and theprior distribution of ED50 is N(3,1E2). The vague priordistribution of evolution variance for NDLM model isinverse-gamma distribution (IG(0.5, 72). Additionally, se-lected informative priors are explored in the simulations.The simulation starts with fixed seed and all results arebased on 5000 simulations. The number of simulations andnumber of MCMC simulations as 2500 with burn-in of 500are chosen based on the estimated minimum precision.
Decision criteria in adaptive design simulationDecision criteria for interim success, interim futility,final success and final futility in the adaptive designsimulation are displayed in Table 1. For the fixed design,the final success is based on at least 95% posteriorprobability that the dED90 dose achieves a drug effect
greater than the control or placebo, otherwise it is finalfutility. For all other adaptive design (scenario 2, 3, and4), the decision criteria of the interim success, interimfutility, final success and futility are presented in Table 1.When there is truly is no effect or a placebo like
effect, the Type I error rate is calculated based on thechance of rejecting the null hypothesis (when it is true).In the context of this simulation it would also be thechance of incorrectly accepting that the drug has a doseresponse, the false positive rate, and the statistical bias.
ResultsDesign comparisons using simulationThe results from the simulations giving the probabilityof interim and final success and failure in fixed design(S1), no adaptive allocation (S2), half-adaptive (S3) andfully adaptive (S4) using Bayesian Emax model andNDLM model are displayed in Table 2.For Emax like true dose response, the total probability
of success is 98% and 98% in fixed design; 93% vs. 91%in No-Adaptive Allocation design, 99% vs. 97% underHalf Adaptive scenario and 95% vs. 96% under AdaptiveAllocation scenario for Emax and NDLM models re-spectively. The average sample sizes in the trials are lessin the No-Adaptive Allocation design, half adaptive andadaptive design than fixed design. Similar results andtrends are also shown for log linear dose response curve.The Type I error is inflated in Bayesian NDLM model in
all scenarios under the current prior. The higher Type Ierror could potentially lead to a false investment decisionand further work when a compound does not truly havean effect. Though the inflation of type I error rate is not aregulatory risk for a Phase 2a study it is a potential risk tothe sponsor. The Phase 2a study is still an investigativestudy so the consequences risks are less and once the finalstudy design is established the simulations will need to bereinvestigated with the decision criteria (as described inTable 1) set so the Type I error is controlled.Table 3 displays the additional operating characteristics
of the model fitting to the data that were analysed usingthe Emax model and NDLM model for Half Adaptive (S3)design. The proportion of times the dose being selected asED90 are displayed with each of the four curves. TheED90 of the true Emax curve is likely to be between 20and 30 mg/kg. Similar results for No adaptive (S2)and fully adaptive (S4) are presented in Additional file 1:Table S1 and Table S2 respectively.Results from the simulations show that the Bayesian
Emax model is able to find the correct dose for ED90almost 100% of time (proportion of ED90 as 20 and30 mg/kg) when the true response is either an Emaxcurve or log linear curve, comparing to approximately61%–83% using Bayesian NDLM model. If the true doseresponse relationship is assumed to follow a U-shaped
Liu et al. BMC Medical Research Methodology (2017) 17:149 Page 6 of 14

Table 1 Decision criteria at the interim analysis and final analysis in the proposed design scenarios
Decision Criteria Interim Success Interim Futility Final Success Final Futility
Pr(|RED90 –Ctrl| > 0) >95% <20%
Pr(|RED90 –Ctrl| > 0.95) >70%
Pr(|Rdmax –Ctrl| > 0) > 0.95 and Pr(|RED90 –Ctrl| > 0) >95% Yes No
Pr(|RED90 –Ctrl| > 0): The probability of dose response near ED90 dose level achieves a drug effect greater than the control or placeboPr(|RED90 –Ctrl| > 0.95): The probability of dose response near ED90 dose level achieves a drug effect greater than the control or placebo and 0.95 is the clinicalsignificant differencePr(|Rdmax –Ctrl| > 0): The probability of any dose with maximal effect achieves a drug effect greater than the control or placeboOnly final success and futility are accessed in fixed design
Table 2 Probability of success and failures at interim and final analysis at fixed and adaptive design scenarios
True Dose Response Design Scenarios Models Comparisons Earlysuccess
Earlyfailure
Finalsuccess
Finalfailure
TotalSuccess
Meansubjects
Placebo like flat curve Fixed Design (S1) Bayesian Emax – – 0.06 0.94 0.06 64
Bayesian NDLM – – 0.17 0.83 0.17 64
No Adaptive design (S2) Bayesian Emax 0.00 0.39 0.04 0.57 0.04 51
Bayesian NDLM 0.03 0.03 0.16 0.78 0.18 58
Half Adaptive design (S3) Bayesian Emax 0.00 0.23 0.04 0.73 0.04 61
Bayesian NDLM 0.00 0.00 0.12 0.88 0.12 64
Adaptive (S4) Bayesian Emax 0.03 0.39 0.04 0.54 0.07 55
Bayesian NDLM 0.01 0.01 0.12 0.86 0.13 64
Emax curve Fixed Design (S1) Bayesian Emax – – 0.98 0.02 0.98 64
Bayesian NDLM – – 0.98 0.02 0.98 64
No Adaptive design (S2) Bayesian Emax 0.74 0.03 0.19 0.04 0.93 38
Bayesian NDLM 0.82 0.01 0.09 0.08 0.91 37
Half Adaptive design (S3) Bayesian Emax 0.74 0.00 0.26 0.01 0.99 55
Bayesian NDLM 0.53 0.00 0.44 0.03 0.97 57
Adaptive (S4) Bayesian Emax 0.80 0.03 0.15 0.02 0.95 42
Bayesian NDLM 0.55 0.00 0.41 0.04 0.96 56
Log Linear Curve Fixed Design (S1) Bayesian Emax – – 0.96 0.04 0.96 64
Bayesian NDLM – – 0.95 0.05 0.95 64
No Adaptive design (S2) Bayesian Emax 0.64 0.05 0.24 0.08 0.88 40
Bayesian NDLM 0.74 0.00 0.15 0.11 0.89 40
Half Adaptive design (S3) Bayesian Emax 0.58 0.00 0.40 0.02 0.98 57
Bayesian NDLM 0.45 0.00 0.47 0.08 0.92 58
Adaptive (S4) Bayesian Emax 0.70 0.03 0.24 0.03 0.94 45
Bayesian NDLM 0.51 0.00 0.43 0.06 0.94 56
U-Shaped curve Fixed Design (S1) Bayesian Emax – – 0.26 0.74 0.26 64
Bayesian NDLM – – 0.92 0.08 0.92 64
No Adaptive design (S2) Bayesian Emax 0.10 0.26 0.14 0.50 0.24 47
Bayesian NDLM 0.63 0.01 0.17 0.18 0.80 43
Half Adaptive design (S3) Bayesian Emax 0.06 0.09 0.10 0.75 0.16 62
Bayesian NDLM 0.41 0.00 0.47 0.12 0.88 59
Adaptive (S4) Bayesian Emax 0.14 0.24 0.10 0.52 0.24 54
Bayesian NDLM 0.42 0.00 0.44 0.14 0.86 58
Liu et al. BMC Medical Research Methodology (2017) 17:149 Page 7 of 14
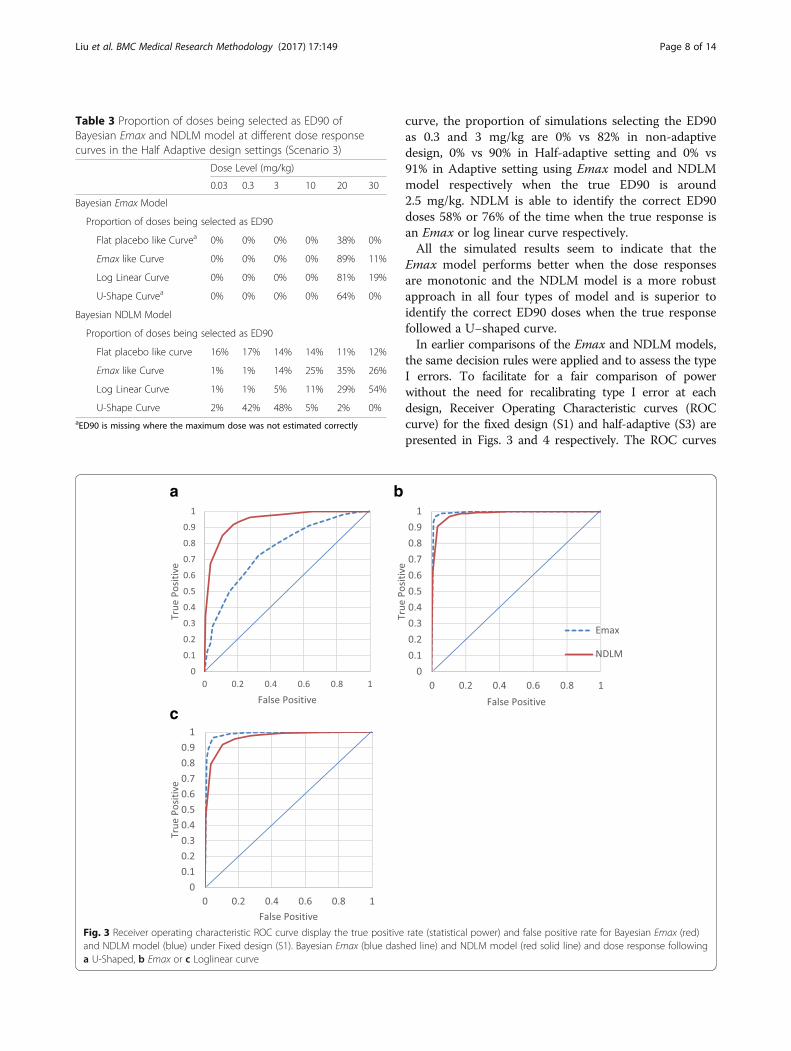
curve, the proportion of simulations selecting the ED90as 0.3 and 3 mg/kg are 0% vs 82% in non-adaptivedesign, 0% vs 90% in Half-adaptive setting and 0% vs91% in Adaptive setting using Emax model and NDLMmodel respectively when the true ED90 is around2.5 mg/kg. NDLM is able to identify the correct ED90doses 58% or 76% of the time when the true response isan Emax or log linear curve respectively.All the simulated results seem to indicate that the
Emax model performs better when the dose responsesare monotonic and the NDLM model is a more robustapproach in all four types of model and is superior toidentify the correct ED90 doses when the true responsefollowed a U−shaped curve.In earlier comparisons of the Emax and NDLM models,
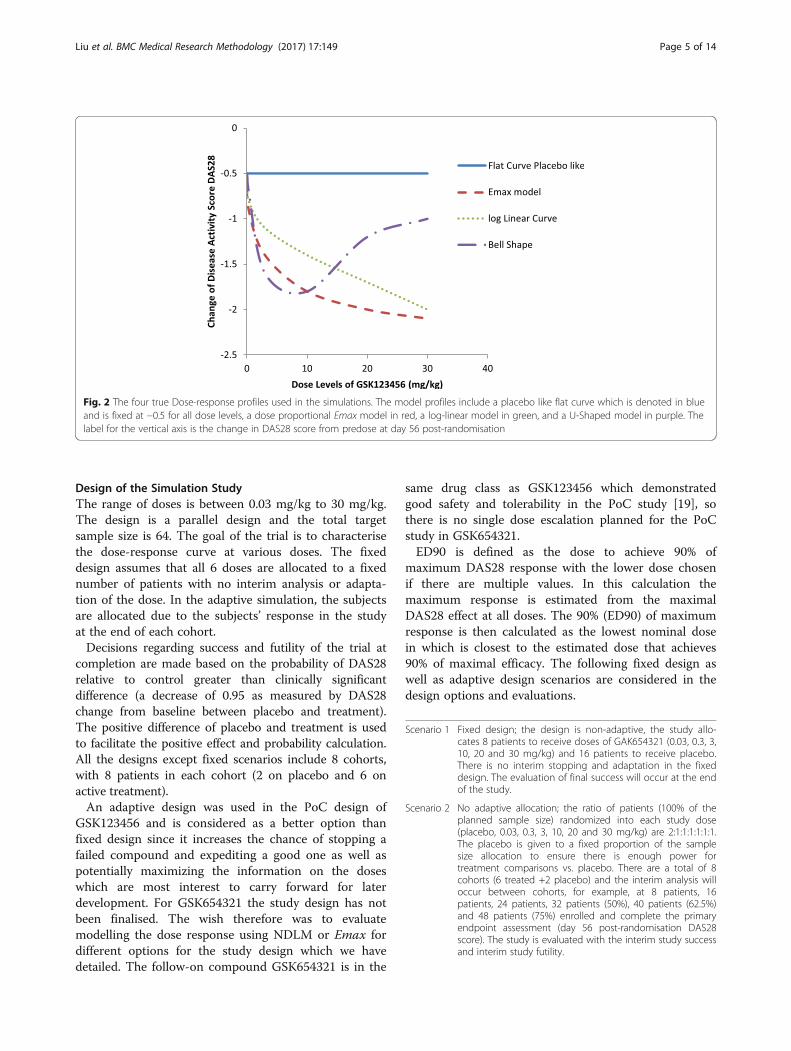
the same decision rules were applied and to assess the typeI errors. To facilitate for a fair comparison of powerwithout the need for recalibrating type I error at eachdesign, Receiver Operating Characteristic curves (ROCcurve) for the fixed design (S1) and half-adaptive (S3) arepresented in Figs. 3 and 4 respectively. The ROC curves
Table 3 Proportion of doses being selected as ED90 ofBayesian Emax and NDLM model at different dose responsecurves in the Half Adaptive design settings (Scenario 3)
Dose Level (mg/kg)
0.03 0.3 3 10 20 30
Bayesian Emax Model
Proportion of doses being selected as ED90
Flat placebo like Curvea 0% 0% 0% 0% 38% 0%
Emax like Curve 0% 0% 0% 0% 89% 11%
Log Linear Curve 0% 0% 0% 0% 81% 19%
U-Shape Curvea 0% 0% 0% 0% 64% 0%
Bayesian NDLM Model
Proportion of doses being selected as ED90
Flat placebo like curve 16% 17% 14% 14% 11% 12%
Emax like Curve 1% 1% 14% 25% 35% 26%
Log Linear Curve 1% 1% 5% 11% 29% 54%
U-Shape Curve 2% 42% 48% 5% 2% 0%aED90 is missing where the maximum dose was not estimated correctly
a
c
b
Fig. 3 Receiver operating characteristic ROC curve display the true positive rate (statistical power) and false positive rate for Bayesian Emax (red)and NDLM model (blue) under Fixed design (S1). Bayesian Emax (blue dashed line) and NDLM model (red solid line) and dose response followinga U-Shaped, b Emax or c Loglinear curve
Liu et al. BMC Medical Research Methodology (2017) 17:149 Page 8 of 14

draw a plot of the true positive rate against the false posi-tive rate for the different possible decision criteria. Sinceany increase in sensitivity is accompanied by a decrease inspecificity, the ROC shows the tradeoff between sensitivityand specificity. For each design, the true positive rates fromBayesian Emax and NDLM model at assumed U-shaped,Emax or Loglinear curves are plotted against the corre-sponding false positive rates from flat curve. The closer thecurve follows the left border and the top border of theROC space, it shows the better sensitivity given specificity.Similar ROC curves for non-adaptive (S2) and adaptive(S4) design are presented in supplemental material.Under half adaptive design, the ROC curve of Bayesian
Emax model is closer to the left and top borders thanNDLM model when the assumed curves follow Emax orloglinear curves, so Emax model performs better. Whenthe type I error rate is at 5%, the true positive rate of toBayesain Emax model is approximately at 97% for bothEmax curve and loglinear curve and the true positive rateis 90% and 85% for both Emax curve and loglinear curveusing NDLM model. For U-shaped curve, the BayesianNDLM model performed better than Emax model. The
results are in line with earlier conclusion that Emax modeloutperforms if dose response is monotonical and NDLMmodel is better when the dose response is U-shaped.
Assessment of biasThe assessment of statistical bias through simulation ateach dose level (placebo, 0.03, 0.3, 3, 10, 20, and 30 mg/kg)is calculated as the difference in the estimated meanresponse using Emax or NDLM models against theassumed true response profile (at each dose level). Thedifference from the true dose response profile is estimatedfor each simulation. The mean difference - and bias - istaken as the mean difference for the dose response fromthe truth across all 5000 simulations.The Bayesian Emax model is compared to the NDLM
model under four profiles of true dose response beingEmax curve (Fig. 3a), flat curve (Fig. 3b), log linearcurve (Fig. 3c), and U-shaped curve (Fig. 3d) for each ofthe four design scenarios: fixed design, no adaptive (S2),half adaptive (S3) and fully adaptive (S4).Under the fixed design and no adaptive allocation and
assumption of true dose response as Emax like curve
Fig. 4 Receiver operating characteristic ROC curves display the true positive rate (statistical power) and false positive rate for Bayesian Emax (red)and NDLM model (blue) under Half adaptive design (S3). Bayesian Emax (blue dashed line) and NDLM model (red solid line) and dose responsefollowing a U-Shaped, b Emax or c Loglinear curve
Liu et al. BMC Medical Research Methodology (2017) 17:149 Page 9 of 14

(Fig. 5a) or log linear (Fig. 5c) shape curve, there isless bias (absolute bias) of mean response at lowerdose levels using the NDLM model in comparison to theBayesian Emax model. The bias using Emax model is less ifthe true dose response data follow a placebo like response(Fig. 5b) than NDLM model and the absolute values of allbias are less than 0.02. If the true dose response curve is aU Shaped non-monotonic curve (Fig. 5d), the bias is muchbigger at 0.3 mg/kg and 3 mg/kg if analysing using theEmax model (0.6510 in Emax model vs. -0.0062 at0.3 mg/kg in the NDLM model; 0.7523 in Emax model vs.0.0155 at 3 mg/kg in the NDLM model), since the Emaxmodel makes the assumption of monotonic changes andstill fits the line between the lowest dose and highest dose,ignoring the U-shaped response.Under the half adaptive allocation design and the
assumption of true dose response as an Emax like curveor log linear shape curve, similar to fixed design, there
are less bias (absolute bias) of mean response at lowerdose levels but more bias at 20 mg/kg using the NDLMmodel in comparison to the Bayesian Emax model. Theindividual bias from each dose level shows that Emaxmodel tends to underestimate the dose response effectwhile NDLM tends to overestimate the effect in the meanresponse. The bias using Emax model is less if the truedose response data follow a placebo like response thanNDLM model and the absolute values of all bias are lessthan 0.06. If the true dose response curve is a U-Shapednon-monotonic curve, the bias is much bigger at0.3 mg/kg and 3 mg/kg if analysing using the Emaxmodel (0.7182 in Emax model vs. 0.0656 at 0.3 mg/kgin the NDLM model; 0.8835 in Emax model vs. 0.0992 at3 mg/kg in the NDLM model) for the same reason de-scribed earlier.Under the fully adaptive allocation design and the
assumption of the true dose response as an Emax like
b d
a c
Fig. 5 The statistical bias based on the fixed Design and design with adaptations. The statistical bias is based on each planned dose group(placebo, 0.03, 3, 10, 20, and 30 mg/kg) under four scenarios of design setting as fixed design, no adaptive (Scenario 2), half adaptive (Scenario 3)and fully adaptive (Scenario 4). The true dose responses follow dose profiles of a: Emax curve; b: flat curve; c: log linear curve and d: U-shaped curve
Liu et al. BMC Medical Research Methodology (2017) 17:149 Page 10 of 14

curve, the bias of the Bayesian Emax model and NDLMmodel is similar. The individual bias from each dose levelshows that Emax model tends to underestimate the meanresponse effect at 0.03, 0.3 and 30 mg/kg while NDLMtends to overestimate the effect at 3 and 20 mg/kg in themean response. The biases are also similar if the true doseresponse data follow a log linear curve and Emax modeltends to underestimate the mean response while NDLMtends to overestimate the mean response. NDLM modelalso overestimate the mean response if the true responseis placebo like curve. If the true dose response curve is aU-Shaped non-monotonic curve, the bias is much biggerat 0.3 mg/kg and 3 mg/kg if analysing using the Emaxmodel (0.8013 in Emax model vs. 0.1170 at 0.3 mg/kg inthe NDLM model; 0.9678 in Emax model vs. 0.1553 at3 mg/kg in the NDLM model).Amongst all the designs, a hybrid approach of half
adaptive design with fixed allocation at 50% subjectsbefore any adaptive allocation seems to have the mostreasonable operating characteristics and will beconsidered to carry forward for GSK654321. To furtherexplore the impact of the analysis methods additionalsimulations were undertaken to examine the impact ofchoice of informative priors but anchored in the singlehalf adaptive design (S3). The results for the Emaxmodel are given below in Table 4.The probability of success, as measure of posteriors
probability of treatment effect (difference betweentreatment and placebo) greater than zero, increased inall dose response curves with 100%, 99, 59% success ifthe dose response follows a Emax model, Loglinearmodel and U-shaped curve. The type I error rate isinflated to 8% in Emax model with the informative prior.This inflated type I error rate would need to be commu-nicated to the study team who may consider this to betoo high a development risk.Additional simulations for the NDLM model were
performed to examine the impact of informative prioron the half adaptive design (S3) and are displayed belowwith two prior choices a) the evolution variance hasprior of Inverse Gamma (IG) distribution (IG(0.5,0.5))and b) IG(2,4).
The additional simulations seem to show that theNDLM model fitting is sensitive to the choice of evolutionvariance and the probably of success and type I error areimpacted by the choice of priors such that with aninformative prior, type I error was reduced to as low as 7%with little impact of the probability of success in otherdose response curve. These considerations need to beweighed up by the study team. If the Type I error isimportant then the priors may be further investigated toreduce these to an acceptable level.To compare the goodness of model fitting, deviance
information criteria (DIC) results were calculated forboth Emax and NDLM model based on dataset fromsingle simulation in Half adaptive design. DIC waspenalized for overfitting with additional parameters inthe model. The DIC for NDLM model was 181.1 incomparison to 187.0 for Emax model, which furthershowed that there was no overfitting in NDLM model.
Summary of model comparison: Emax model versusNDLM modelIf dose response follows a monotonic response i.e. Emaxor log linear curve, both Bayesian Emax and NDLMmodels have good operating characteristic in theprobability of success at interim and final analysis.However, a Bayesian Emax model performs better withhigher probability of success than NDLM model in allthe scenarios.If the dose effects change non-monotonically in a
U-shaped dose response curve, the power measuredas the probability of success of the Bayesian Emaxmodel is 26% vs 92% using the NDLM model in fixeddesign, 24% vs 80% in No-adaptive design, 16% vs88% in Half-Adaptive design and 24% vs 86% inAdaptive design. The NDLM model significantly improvesthe probability of success compared to the Emax model inall four design simulations.Under the same decision criteria, the Type I error
rates are elevated to 12% for half-adaptive or fully adap-tive scenario and to 18% for a non-adaptive scenariowhen analysing using the NDLM model, while the type Ierror is generally under control below 5% using Emax
Table 4 Probability of success and failures at interim and final analysis with Bayesian Emax model with informative prior(β1 ~ N(−0.5, 1.2*1.2), β2 ~ N(−2.9, 1.2*1.2) and β3 ~ N(3, 2*2), β1, β2, and β3 are parameter estimates of E0, Emax and ED50respectively) in the half adaptive design (Scenario 3)
True Dose Response Bayesian Emax model
Early success Early failure Final success Final failure Total Success Mean subjects
Placebo like flat Curve 0.00 0.13 0.08 0.79 8% 63
Emax Curve 0.87 0.00 0.13 0.00 100% 51
Log Linear Curve 0.71 0.00 0.28 0.01 99% 54
U-Shaped Curve 0.18 0.00 0.41 0.40 59% 61
Liu et al. BMC Medical Research Methodology (2017) 17:149 Page 11 of 14

model. An inflated Type I error rate signals that theNDLM model is over-sensitive and is thus inflating thenumber of false positive trials. When controlling Type Ierror, it was shown from ROC curves that the statisticalpower is 8–10% lowers in NDLM model if the doseresponse follows Emax or Loglinear curves but muchbetter in case of U-shaped curve. Analysis of the NDLMmodel led to a significant increase in the statisticalpower of detecting the treatment difference, when thetrue dose response is non-monotonic, compared to theBayesian Emax Model. The probability of success usingNDLM model was similar regardless of which under-lying true dose-response profile was assumed, but lesssensitivity in the analysis of selecting the dose responseof ED90 and an increase in the statistical bias, comparedto the Bayesian Emax model. The Bayesian Emax modelexcelled with a higher probability of selecting ED90 and asmaller average sample size, when the true dose responsefollowed Emax like curve, compared to NDLM model.Though there were some variations, the bias is
comparable if the true dose response follows a placebolike curve, Emax like curve, or log linear shape curveunder the no adaptive allocation, half adaptive andadaptive scenarios. The bias for Emax is significantlyincreased if the true dose response is assumed to followa U-shaped non-monotonic curve.
DiscussionDue to the fact that the results for a PoC RA study of adrug in the same class followed a U-shaped dose responsethere was a wish to investigate if the analysis could beimproved for a new compound in development. Ofparticular interest, in context with the development forGSK654321, the NDLM model was able to maintain theprobability of success even in the case of a non-monotonic dose response.
We were conscious that the design of GSK654321 wasdriven by a single study for a lead compound, GSK123456,the analysis of which seemed to show a U-shaped doseresponse and the U-shaped dose response was deemedpharmacologically plausible [19]. Given the limitationsof the NDLM model when the response is not U-shapedwe decided to undertake further investigations of theU-shaped dose response in a literature review to assess thelikelihood - based on the literature - of seeing this doseresponse relationship. It is shown that it is plausible toobserve a U-shaped curve in the study with RA patients[21, 22]. Thomas et al. [6] showed that in the majority ofcases the observed means could be well described using aBayesian Emax model and Emax is one of the best modelsto estimate the dose response if data follows Emax curve,however, while biological exposure response relationshipsare often monotonic, down-turns of the clinical dose-response relationship at higher doses have been observed,one example in biologics development is the immunogen-icity observed at high dose in the patients treating with bio-logicals. Therefore, we recommend to routinely consider aU-shaped dose-response model unless U-shaped profilescan be excluded with certainty at the trial design stage.The work in this manuscript was inspired by the PoC
design of the follow-on compound after the U-shapedcurve was found in earlier clinical trial, which BayesianEmax model was used. We aim to compare it with amore flexible NDLM model in the PoC design of thefollow-on compound. Systematic literature search wasconducted in the databases Google scholar, PubMEDand web of science (WoS) and there was limited existingLiterature in the comparison of Emax and NDLM model.Work by Jane Temple [23, 24] was deemed relevant but,within the parameters of the simulation undertaken by theauthors although the research of Temple was of interestthe work could not be generalised to the study being
Table 5 Probability of success and failures at interim and final analysis with Bayesian NDLM model with informative prior in the halfadaptive design (Scenario 3)
True Dose Response Bayesian NDLM model
Early success Early failure Final success Final failure Total Success Mean subjects
a) evolution variance ~IG(0.5,0.5), initial dose ~N(−0.5, 1.2*1.2)
Placebo like flat Curve 0.00 0.01 0.07 0.92 0.07 64
Emax Curve 0.71 0.00 0.28 0.11 0.99 58
Log Linear Curve 0.69 0.00 0.28 0.03 0.97 57
U-Shaped Curve 0.34 0.00 0.51 0.15 0.85 62
b) evolution variance ~IG (2,4), initial dose ~N(−0.5, 1.2*1.2)
Placebo like flat curve 0.00 0.00 0.10 0.90 0.10 64
Emax Curve 0.74 0.00 0.24 0.02 0.98 58
Log Linear Curve 0.70 0.00 0.26 0.03 0.96 57
U-Shaped curve 0.49 0.00 0.40 0.10 0.89 60
Liu et al. BMC Medical Research Methodology (2017) 17:149 Page 12 of 14

planned and described in this paper. This work demon-strated that both Bayesian NDLM model and Emax modeldetect a dose response well but Bayesian NDLMtends to have the highest power in the probability ofdetecting a clinical response than Emax model in thenon-monotonical dose response.It was also shown in the research of Temple that
Bayesian NDLM tended to underestimate the responseat lower doses, therefore resulting in higher doses beingselected, however, our simulation showed a similar orbetter model fitting in Bayesian NDLM model thanEmax model within the context of Phase 2a design. Inaddition, we found out that the adaptive design beingproposed seemed to perform better with smaller averagesample size but there was little difference in differentallocation methods using NDLM model. These resultsagree with the finding in Temple [23, 24].It has been reported that a Bayesian logistic model,
especially with hierarchical longitudinal modelling withunbounded priors, often does not converge well [25, 26],posing a significant risk to dose escalation analysis.However, the NDLM model is a good alternative to theEmax model at the expense of pharmacological meaningin model parameters like maximal response Emax andED50. This is to use an alternative, less complicated,modelling such as the linear model, power model etc. ora non-parametric model, such as the spline model orNDLM model. This will reduce the risk of non-convergence. A more Informative distribution on priorsthat constrain the parameter space to reasonable valueswould help the convergence for both models [27].The main cause for concern with NDLM was the
inflation of the Type I error. To minimise this problem,the decision criteria or informative prior may need to beadjusted to control the Type I error if the same decisionrules are used in the comparison. After controlling forthe type I error rate at 5%, the statistical powers ofEmax model are ~8% higher than that of NDLM modelsin Emax and Log-linear dose responses, which wasfurther supported by ROC results. The NDLM modelworks better when dose response follows U-shapedcurve. Further work would be required therefore for anyindividual study to optimise the design characteristics. Itis also acknowledged that NDLM model did not havehigh specificity in finding ED90 compared with theEmax model when the data follow Emax model.It should be noted that the methods described in this
paper were anchored in a single RA example with thesimulations and results presented only applicable to thiscase study which motivated our work. This is ofparticular importance if different dose responses areanticipated or are of importance for an evaluation. Evenfor this case study there would be a need for furtherwork once the study design has been finalised. In cases
where a U-shaped curve is expected or there is potentialphysiological/pharmacological rationale of down-turnresponse, Bayesian NDLM model is generally recom-mended and this conclusion can be generalized toother case studies. In addition, our methods of evalu-ation in finding the best design could be generalisedto other clinical trials to offer a solution to expeditedrug development.
ConclusionAn adaptive design, especially a half-adaptive design, ismore a efficient design than a fixed design due to anincreased chance of a dose being selected being the ED90dose and due to the reduced s average sample size beinguse in the clinical trial. In most cases the Bayesian Emaxmodel works effectively and efficiently, with low bias andgood probability of success when there is a monotonicdose response. However, if there is a belief that the doseresponse could be non-monotonic based on prior know-ledge as in our case study - where a compound in thesame class seemed to have non-monotonic dose responses- then the NDLM is the superior model to assess the doseresponse. Within the parameters of the simulation theNDLM model was shown to be flexible with the ability tohandle a wide variety of dose-responses, including mono-tonic and non-monotonic relationships.
Additional file
Additional file 1: Supplemental materials provide additional results tosupplement the main manuscript, including the two tables and twofigures to discuss the proportional of doses being selected as ED90 andROC curves in non-adaptive and fully adaptive scenarios. (DOCX 47 kb)
AbbreviationsASTIN: Acute stroke therapy by inhibition of neutrophils; CRP: C reactiveprotein; DAS28: Disease activity score based on 28 joints; ESR: Erythrocytesedimentation rate; FACTs: Fixed and adaptive clinical trial simulator;MCMC: Markov chain Monte Carlo; NDLM: Normal dynamic linear model;PoC: Proof-of-concept; R&D: Research and development; RA: RheumatoidArthritis; WoS: Web of Science
AcknowledgementsThe authors would like to thank all members of GSK123456 PoC study team,specifically Dr. Daren Austin who led the design of the PoC study ofGSK123456. The authors also would like to thank the reviewers for theirhelpful and constructive comments that improved this manuscript.
FundingNot Applicable.
Availability of data and materialsThe PoC data will not be shared as they are proprietary information.
Authors’ contributionsFL executed and performed the statistical analysis of PoC study of GSK123456.FL, SAJ, and SJW participated in the method comparison and assisted in thedrafting of the manuscript. All authors read and approved the final manuscript.
Ethics approval and consent to participateNot Applicable.
Liu et al. BMC Medical Research Methodology (2017) 17:149 Page 13 of 14

Consent for publicationNot Applicable.
Competing interestsFLis employee and shareholder of GlaxoSmithKline. SAJ and SJW have nodeclarations.
Publisher’s NoteSpringer Nature remains neutral with regard to jurisdictional claims inpublished maps and institutional affiliations.
Received: 6 March 2017 Accepted: 31 August 2017
References1. Hay M, Thomas DW, Craighead JL, Economides C, Rosenthal J. Clinical
development success rates for investigational drugs. Nat Biotechnol. 2014;32(1):40–51.
2. Arrowsmith J, Miller P. Trial watch: phase II and phase III attrition rates 2011-2012. Nat Rev Drug Discov. 2013;12(8):569.
3. Pinheiro JC, Bretz F, Branson M. Analysis of Dose–ResponseStudies—Modeling Approaches in Dose Finding in Drug Development2006. New York: Springer; p.146–171.
4. FDA Draft Guidance. Dose response information to support drugregistration. 1994.
5. Ting N. Dose Finding in Drug Development. New York: Springer-Verlag;2006.
6. Thomas N, Sweeney K, Somayaji V. Meta-analysis of clinical dose–response in alarge drug development portfolio. Stat Biopharmaceutical Res. 2014;6:302–17.
7. Calabrese EJ, Baldwin LA. U-shaped dose-response in biology, toxicologyand public health. Annu Rev Public Health. 2001;22:15–33.
8. Reynolds AR. Potential Relevance of Bell-Shaped and U-Shaped Dose-Responses for the Therapeutic Targeting of Angiogenesis in Cancer. Dose-Response. 2010;8(3):253–284.
9. Owen SC, Doak AK, Ganesh AN, Nedyalkova L, McLaughlin CK, Shoichet BK,Shoichet MS. Colloidal drug formulations can explain “bell-shaped”concentration–response curves. ACS Chem Biol. 2014;9(3):777–84.
10. Almstrup K, Fernández MF, Petersen JH, Olea N, Skakkebaek NE, Leffers H.Dual effects of phytoestrogens result in u-shaped dose-response curves.Environ Health Perspect. 2002;110(8):743–8.
11. West M, Harrison PJ. Bayesian forecasting and dynamic models. New York:Springer-Verlag; 1997.
12. Berry DA, Mueller P, Grieve AP, Smith MK, Parke T, Krams M. Bayesiandesigns for dose-ranging drug trials. Case studies in Bayesian statistics. 2002;v5. Springer-Verlag, New York, 99-181.
13. Grieve, AP, and Krams, M, 2005. ASTIN: a Bayesian adaptive dose-response trialin acute stroke. Clinical trials (London, England), 2(4), pp.340–351-358, 364–378.
14. Smith MK, Jones I, Morris MF, Grieve AP, Tan K. Implementation of a Bayesianadaptive design in a proof of concept study. Pharm Stat. 2006;5(1):39–50.
15. Skrivanek Z, Berry S, Berry D, Chien J, Geiger MJ, et al. Application ofadaptive design methodology in development of a long-acting glucagon-likePeptide-1 analog (Dulaglutide): statistical design and simulations. J Diabetes SciTechnol. 2012;6(6):1305–18.
16. Fransen J, Stucki G, et al. Rheumatoid arthritis measures. Disease activityscore (DAS), disease activity Score-28 (DAS28), rapid assessment of diseaseactivity in rheumatology (RADAR), and rheumatoid arthritis disease activityindex (RADAI). Arthritis & Rheumatism. 2003;49:S214–24.
17. Carlin BP, Louis, TA. Bayesian Methods for Data Analysis (Third Edition). BocaRaton, Florida: Chapman and Hall/CRC; 2008.
18. Newman KB. Modelling Population Dynamics: Model Formulation, Fitting andAssessment Using State-space Methods. New York: Springer-Verlag; 2014.
19. Choy EH, Bendit M, McAleer D, Liu F, Feeney M, Brett S, Zamuner S,Campanile A, Toso J. Safety, tolerability, pharmacokinetics andpharmacodynamics of an anti- oncostatin M monoclonal antibody inrheumatoid arthritis: results from phase 2 randomized, placebo-controlledtrials. Arthritis Res Ther. 2013;15(5):R132.
20. Spiegelhalter DJ, Abrams KR and Myles JP, Bayesian Approaches to Clinical Trialsand Health-Care Evaluation. Hoboken, New Jersey: John Wiley & Sons; 2004.
21. Stohl W, Merrill JT, et al. Efficacy and safety of Belimumab in patients withrheumatoid arthritis: a phase II, randomized, double-blind, placebo-controlled,dose-ranging study. J Rheumatol. 2013;40(5):579–89.
22. Behrens F, Tak PP, Østergaard M, Stoilov R, Wiland P, Huizinga TW, Burkhardt H.MOR103, A human monoclonal antibody to granulocyte–macrophage colony-stimulating factor, in the treatment of patients with moderate rheumatoidarthritis: results of a phase Ib/IIa randomised, double-blind, placebo-controlled,dose-escalation trial. Ann Rheum Dis. 2015;74(6):1058–64.
23. Temple J. and Jennison C. Bayesian Adaptive Design, Design and Analysis ofExperiment Workshop 2011. Newton, UK.
24. Temple J. Adaptive Designs for Dose-Finding Trials. Bath UK: University ofBath; 2012.
25. Raftery AE, Lewis SM. The number of iterations, convergence diagnosticsand generic metropolis algorithms. In Practical Markov chain Monte Carlo(Gilks W. R., Spiegelhalter D. J., and Richardson S), pp. 115–130. 1995London: Chapman and Hall.
26. Heydari J, Lawless C, Lydall DA, Wilkinson DJ. Bayesian hierarchicalmodelling for inferring genetic interactions in yeast. J R Stat Soc Ser C ApplStat. 2016;65(3):367–93.
27. Brain P, Kirby S, Larionovc R. Fitting Emax models to clinical trial dose–response data when the high dose asymptote is ill defined. PharmaceutStatist. 2014;13:364–70.
• We accept pre-submission inquiries
• Our selector tool helps you to find the most relevant journal
• We provide round the clock customer support
• Convenient online submission
• Thorough peer review
• Inclusion in PubMed and all major indexing services
• Maximum visibility for your research
Submit your manuscript atwww.biomedcentral.com/submit
Submit your next manuscript to BioMed Central and we will help you at every step:
Liu et al. BMC Medical Research Methodology (2017) 17:149 Page 14 of 14