design considerations for a large-scale wireless sensor
TRANSCRIPT

See discussions, stats, and author profiles for this publication at: https://www.researchgate.net/publication/221080883
Design considerations for a large-scale wireless sensor network for substation
monitoring
Conference Paper · October 2010
DOI: 10.1109/LCN.2010.5735825 · Source: DBLP
CITATIONS
46READS
433
6 authors, including:
Some of the authors of this publication are also working on these related projects:
Embedded Systems: An Introduction Using the Renesas RX62N Microcontroller View project
Prospect for Success in Engineering: Assessing Freshmen Curriculum Engagement View project
Asis Nasipuri
University of North Carolina at Charlotte
71 PUBLICATIONS 4,110 CITATIONS
SEE PROFILE
Robert B. Cox
NASA
12 PUBLICATIONS 138 CITATIONS
SEE PROFILE
James Conrad
University of North Carolina at Charlotte
155 PUBLICATIONS 1,674 CITATIONS
SEE PROFILE
Bienvenido Rodriguez-Medina
University of North Carolina at Charlotte
15 PUBLICATIONS 107 CITATIONS
SEE PROFILE
All content following this page was uploaded by Asis Nasipuri on 04 June 2014.
The user has requested enhancement of the downloaded file.

Design Considerations for a Large-Scale WirelessSensor Network for Substation Monitoring
Asis Nasipuri,Robert Cox, and James ConradElectrical & Computer Engineering
University of NC at Charlotte
9201 University City Blvd.
Charlotte, NC 28223
Luke Van der Zeland Bienvenido Rodriguez
Substations Group
EPRI-Transmissions & Substations
9625 Research Drive
Charlotte, NC 28262
Ralph McKoskyTechnology Innovation,
Environment & Technology
Tennessee Valley Authority
1101 Market Street, SP-5D-C
Chattanooga, TN 37402
Abstract—This paper describes the design and deployment ofa large scale wireless sensor network (WSN) for monitoring thehealth of power equipment in a substation. The sensor networkconsists of 122 low power nodes that that are spread overan area approximately 1000 × 400 feet in size and performmonitoring of equipment such as transformers, circuit break-ers, and compressors. All nodes communicate over a multihopwireless mesh network that uses a dynamic link-quality basedrouting protocol. A primary objective of this project is to developeffective monitoring applications for the substation using low-costwireless sensor nodes that can sustain long periods of batterylife. We study the battery consumption in the network andpresent a transmission scheme that conserves communication costby enabling the sensor nodes to transmit observation samplesonly when their values are significantly different from thosetransmitted previously. Experimental results that demonstratethe performance of the sensor network for several monitoringapplications are presented.
I. INTRODUCTION
Power transmission and distribution substations have a
number of critical components such as circuit breakers and
transformers that must be continuously monitored to reduce
the possibility of expensive and disruptive power outages.
This is becoming an increasing concern for today’s substation
managers and engineers due to the aging nature of substation
equipment and infrastructure. Currently, such health monitor-
ing is primarily performed using a combination of periodic
physical inspections and real-time measurements taken by
expensive wired sensors. Because of the growing popularity
of low-power wireless sensor networks, utility companies have
also begun to investigate the potential benefits of using large-
scale wireless sensor networks for these applications. Wireless
sensor networks are minimally invasive, easy to deploy, and
can provide a cost-effective solution for the early detection of
failure conditions.
This paper presents the results of an EPRI funded project on
an experimental wireless sensor network for substation moni-
toring. The University of North Carolina (UNC) at Charlotte
was a contractor for the EPRI project. There were multiple
utility members in the EPRI project. This paper focusses on
results gathered at one of those members, Tennessee Valley
Authority (TVA), which involves the development of a wire-
less sensor network (WSN) at a substation located in Paradise,
Kentucky. The experimental WSN, called ParadiseNet, was
deployed over various phases, and currently consists of 122
wireless sensor nodes that are programmed to measure key
physical quantities from several different subsystems in the
substation. Data from these nodes is collected by a base station
and transmitted via the Internet to a database at Charlotte,
North Carolina. The primary objectives of this project are to
experimentally verify the viability of using wireless sensors
in a substation environment, to implement key applications
required for substation monitoring using the low-power wire-
less sensor nodes, and to determine the design challenges for
scaling up the network to cover the entire substation.
Early design issues for this network were presented in [1]
and the design of some key components of the network
were presented in [2], [3]. This paper focuses on design
considerations for scaling up the network to 122 nodes with
an ultimate goal of reaching 150 nodes. Emphasis is placed
on energy and battery lifetime issues, as well as on new
considerations that have been discovered using field data. In
particular, we present a novel adaptive sampling scheme for
increasing node lifetime. This approach, which is known as
level crossing sampling, only transmits sensor data when the
sensor values change by a predetermined amount. We present a
summary of lessons learned from our field observations, with
particular emphasis on energy consumption, routing perfor-
mance, and the benefits of level crossing sampling. Results
indicate that overhearing has a significant impact on energy
performance, perhaps even more significant than the effect of
data forwarding. Additionally, the results indicate that level
crossing sampling is beneficial.
II. RELATED WORK
Practical implementations of wireless sensor networks have
attracted significant interest in recent years. Various applica-
tions have been addressed and reported in the literature, in-
cluding industrial process monitoring [1], [4], natural-disaster
forecasting [5], [6], habitat monitoring [7], [8], [9], structural
monitoring [10], [11], and climate and soil monitoring for use
in agriculture [12]. These examples demonstrate the viability
and cost-effectiveness of wireless sensors networks in com-
parison to their wired counterparts.
5th IEEE International Workshop on Practical Issues in Building Sensor Network Applications SenseApp 2010, Denver, Colorado
978-1-4244-8389-1/10/$26.00 ©2010 IEEE 866

Fig. 1. View of the Paradise substation, showing the trailer that houses the current base station located at one end of the substation.
Several researchers have described practical experiments in
which they considered issues relevant to the deployment of
large-scale networks. Such issues include network architec-
ture, coverage, and energy consumption. Reference [13], for
instance, describes a network consisting of 557 solar-powered
nodes covering some 50,000 square meters. This network
featured seven gateways and one server. The primary purpose
of this four-month experiment was to evaluate the use of multi-
target tracking algorithms in wireless sensor networks. Other
documented examples of large networks include the 50-node
mobile sensor network ZebraNet [9], and the 150-node habitat-
monitoring network described in [7].
In addition to network scalability, researchers have exam-
ined several other design challenges. Reference [4], for in-
stance, describes the development of a general architecture for
use in industrial applications, and it reports on the implemen-
tation of this architecture in two different target applications.
The first was an oil platform in the North Sea; the other was
a semiconductor manufacturing plant. In another industrial
deployment, a wireless sensor network was used to monitor
the condition of several motors located at a Boeing Company
plant [14]. In addition to health monitoring, this work was
also intended to estimate energy costs. Design objectives and
initial results of our work on substation monitoring at Paradise
when the WSN comprised of 45 sensor nodes was presented
in [1]. Here, we present the design and performance of the
WSN when scaled to 122 nodes.
III. PROJECT OVERVIEW
The ParadiseNet project began in September 2006 and has
been expanded in several phases over the past several years.
This section describes the primary technical objectives of
the project, as well as the key monitoring applications and
the custom hardware platforms developed for each of these
applications.
A. Project Objectives
The key technical objectives of ParadiseNet were developed
by EPRI in collaboration with the utility members and the
contractor (UNCC), and are as follows:
• RF environment/connectivity: A substation is comprised
of many metallic structures scattered over a wide open
area (see Fig. 1). The monitoring area extends to ap-
proximately 1000×400 feet with the base station located
at one end. In such an environment, propagation of low-
power RF signals, such as those transmitted from our
wireless sensor nodes, is often unpredictable. Hence, one
of the primary challenges of this project is to enable
connectivity with all of the wireless nodes in the WSN
deployed throughout the substation.
• Application development: Existing substation monitoring
techniques use many sensors and sensing schemes that
are not designed for wireless sensor networks. Examples
include SF6 (sulphur hexafluoride) gas density sensors,
load monitoring systems, transformer bushing-monitoring
systems, etc. Our research has shown that even in cases
where the limited computational power of a wireless node
would seem at first to be prohibitive, it often is not.
Hence, a primary goal of this project is to determine a set
of diagnostic and prognostic applications that are partic-
ularly beneficial when monitoring substation equipment.
• Battery life: While quick deployment and adaptive re-
configurable network formation are the key advantages
of WSNs, the main challenge is to design the network
to operate for a sufficiently long time without having
to replace the batteries. This requirement is particularly
important in substation monitoring applications due to the
relative inaccessibility of the region due to safety and reg-
ulatory reasons. In this project we have explored energy-
conservation issues as well as solar-energy harvesting for
the wireless nodes deployed in the substation.
B. Monitoring Applications Developed
Since the initiation of the project in September 2006, the
following monitoring applications have been developed and
tested in ParadiseNet:1) Circuit breaker monitoring: Substations and distribution
867

(a) (b)
(c) (d)
Fig. 2. Illustrations of wireless sensor nodes deployed in the Paradise substation: (a) surface temperature sensors for oil-filled circuit breakers, (b) temperature,vibration, and sound intensity sensing from oil-cooled transformers, (c) ambient temperature sensors, and (d) a solar-powered SF6 gas density sensor node.
centers use circuit breakers to switch electric circuits
or equipment either into or out of the broader system.
These devices are typically filled with either oil or
SF6 gas. In oil-filled circuit breakers (see Fig. 2(a)),
the oil provides cooling and prevents arcing when the
switch is activated. A typical monitoring task would be
to detect an impending fault before it can disable the
breaker. We have developed a prognostic method that
detects such failures by searching for relative changes
in oil temperature. Our method compares the surface
temperatures of the oil tanks to look for unexpected
differences.
2) Transformer monitoring: Transformers in a transmission
substation step-up the generator voltage to a much higher
level (up to 765 KV) before transmission to utility
customers. Such transformers may be dry, oil or fluid-
filled. The transformers targeted for this project are of
the oil-filled variety (see Fig. 2(b)). In these devices,
the core and coil assembly are placed in a tank that
is filled with a high-dielectric cooling oil. Although
there are no moving parts, oil-filled transformers may
fail as the result of the mechanical and thermal stresses
induced by the high voltages involved. High-voltage
experts believe that heating is a good early indicator
of several potential transformer failures; hence, oil-tank
temperature is one of the many physical quantities that
we measure. In addition, our network also features nodes
that monitor vibration and acoustic signals in order to
track the health of fans, pumps, and other mechanical
components associated with individual transformers1.
3) Ambient temperature: As noted previously, many im-
portant substation diagnostic routines are temperature-
based. For this reason, it is important to measure the
ambient temperature at various relevant locations, as
solar intensity and shading greatly affect surface tem-
peratures. In addition, the temperature at the substation
location is often below freezing in the winter and above
40◦ C during the summer. To account for this variation,
many of the intermediate nodes in the WSN perform the
additional task of monitoring ambient temperature.
4) SF6 gas density monitoring: Modern High Voltage
circuit breakers are filled with SF6 gas, which must be
checked for leakage. This is traditionally performed by
physically sending personnel to the site who perform
leakage tests at periodic intervals. A potential approach
to automating this is to monitor and trend the gas density
and look for small changes. The key challenge the team
met in this task was to develop a solar-harvesting node to
monitor and transmit the SF6 density signal at periodic
intervals. This is a significant achievement as the density
sensors draw significant current compared to what can
be harvested with a small solar cell - so challenging
solutions had to be engineered.
1Large transmission transformers often feature a number of ancillarycomponents such as fans for cooling and other purposes.
868

C. System Description
ParadiseNet was designed using Crossbow’s MICAz wire-
less sensor nodes (motes), which are equipped with the Atmel
ATmega128L processor running at 8MHz, 2.4 GHz Chipcon
CC2420 radio, 128KB program memory, 512KB measurement
flash, and 4KB EEPROM [15]. This selection was motivated
by a flexible open-source application development platform
(TinyOS), availability of a range of supporting hardware such
as sensor and data acquisition boards, and software support.
To explore solar power harvesting, we considered two
types of solar energy harvesting modules: (a) in some of the
surface temperature sensing nodes, we used the Heliomotesolar harvesting units manufactured by Atla Labs [16], which
are weather-resistant cases equipped with a 2.5′′ × 4′′ solar
panel and a battery charger; (b) in addition, we developed
a more powerful solar power harvesting unit that uses three
2.5′′×4′′ monocrystalline solar cells to power one of the three
SF6 gas density nodes.
Rather than invent a new routing protocol, we decided
to apply Crossbow’s XMesh mesh routing protocol [17] to
evaluate its performance in such a large-scale deployment and
to derive additional design considerations from the results.
XMesh is a link quality based dynamic routing protocol that
uses periodic route update messages (RU) from each node
for link quality estimation. Each node promiscuously listens
to the radio traffic in the neighborhood and selects the parent
that would be the least costly in terms of energy to reach
the base. A parent must already be a part of the mesh and
must have been a descendant node for the last three Route
Update Intervals (RUI). Link quality estimation is performed
by monitoring the multi-hop headers of received packets and
running an exponentially weighted moving average (EWMA)
algorithm to smooth out the estimate. Consequently, XMeshenables a set of interconnected wireless sensor nodes to form a
mesh network rooted at the base, which is dynamically adapted
based on link quality measurements.
Unlike the sensor nodes, the base is equipped with a 9.9dBi
omnidirectional antenna (mounted on the side of the trailer) to
enable better connectivity with the sensor nodes. The laptop
computer running the base server is connected to the Internet
via the cellular network and uses secure ftp to automatically
transfer the data from the WSN to a database located at a
laboratory in Charlotte. For all applications, we set the RUI
as well as the data transmit interval to 15 minutes. In the
following, we provide a detailed description of the different
types of sensor nodes that were developed for ParadiseNet.1) Surface Temperature Sensing Nodes: The wireless sen-
sor nodes for detecting surface temperatures of circuit breakers
and transformer oil tanks were developed using 1000 Ohm
platinum resistor temperature detectors (RTDs) and a MDA320or MDA300 data acquisition board. The MDA generates a 2.5V
excitation voltage and the corresponding voltage drop across
the RTD is sensed and converted to a temperature value by
the MDA/MICAz assembly. This system provides temperature
sensing accuracy of ±1◦ in the laboratory; however ineffective
Fig. 3. RTDs attached to magnets at the base of the node enclosure (left)and an external magnetic RTD probe (right).
physical contacts between the magnets and the surface of the
tank is often a cause of error. Hence, we used three RTDs per
temperature probe, whose measurements are averaged at the
mote to reduce the scope of error. The RTDs are embedded
into magnets that are either attached to the base of the node
enclosure or attached to it by a cable (Fig. 3). In either case,
magnets are used to attach the node enclosure to the surface
of the circuit breakers and transformers.
2) Vibration and Sound Sensing Node: For vibration and
sound sensing, we use the 2-axis accelerometer and the micro-
phone on the MTS310 integrated sensor board. The intensity
of vibrations is obtained by measuring the standard deviation
of 20 samples from the x-axis accelerometer taken at intervals
of 20 ms. This operation is performed at 15-minute intervals,
i.e. the data transmission interval of the nodes. Similarly, the
sound intensity is obtained by the standard deviation of 20
samples of the microphone signal taken at intervals of 10
ms. For the case of the sound signals, the first 5 seconds of
data samples had to be discarded to allow for stabilization
of the microphone signal. The mote with the MTS310 is
mounted inside the enclosure with the magnetic base using
metallic contacts to convey vibrations and sound effectively.
Construction details and performance evaluations of this node
can be found in [2].
3) Ambient Temperature Sensing Nodes: Ambient temper-
ature sensing is performed by using the onboard temperature
sensor (a surface mount thermistor) of the MTS300 integrated
sensor board. These sensor nodes require minimal engineering
due to the manufacturer-provided 51-pin connection interface
between the MTS300 and the MICAz mote. The sensor node
unit is attached to metallic structures using the same approach
as used for the vibration sensing nodes.
4) SF6 Gas Density Sensing Nodes: Gas density sensors
such as the Trafag 8774 [18] apply quartz crystal oscillation
measurements to generate highly accurate gas density esti-
mates (within ±1.8% accuracy). The Trafag sensor requires a
10 − 30 VDC power supply and produces an output current
that is proportional to the measured gas density. We developed
a MICAz-based wireless sensor node that obtains gas density
measurements from one of these sensors. The solution, which
is depicted in Fig. 4, includes step-up circuitry needed to meet
the voltage requirements, a trans-impedance amplifier needed
to convert the output current into a voltage, and actuation and
sensing code needed to obtain measurements and account for
sensor settling time. To conserve energy, the external electronic
869

3V Battery
Mote with Data Acquisition
Board
Boost Converter
Negative Voltage
ConverterExcitationBoard Converter
Circuit�Board
Excitation�Signal
4-20mA Current to Voltage
Converter
SF6Sensor
Sensed�Signal
Converter
Fig. 4. SF6 gas density sensor node using MICAz.
(a) (b)
Fig. 5. Observed current consumption from from (a) the surface temperaturemonitoring node, (b) the SF6 gas density sensing node.
circuits and the sensor are energized for only 0.5s every hour,
when samples are obtained.
IV. ENERGY CONSUMPTION AND LIFETIME ISSUES
Energy consumption is perhaps the most crucial aspect for
designing a successful practical wireless sensor network. Each
sensor node has finite electrical energy, which is determined by
the capacity of the onboard battery. Solar energy harvesting
modules also have limitations in the continuous power they
can deliver, due to size and cost constraints, variations of
solar irradiance, and constraints imposed by the rechargeable
battery. Consequently, all design aspects of wireless sensor
nodes must include considerations for energy conservation.
In this project, we take advantage of the low power (LP)
operation mode of the XMesh routing protocol, in which nodes
sleep most of the time, waking up eight times a second for
short durations to detect activity. If a signal is detected, it keeps
its radio on to receive the signal. Since radio transmission
and reception are the major energy consuming activities, the
average energy consumption mostly depends on the number of
packets transmitted and received by the node. An additional
cause of energy usage is the sensing and actuation current,
which are significant for applications such as vibration sensing
and gas density sensing.
A. Energy Model
Due to the large number of parameters that affect the
power consumption in the wireless sensor nodes in rather
unpredictable ways, we used laboratory experiments to de-
velop models for the average current consumption for all
TABLE IMEASUREMENTS OF CURRENT DRAWN BY A MICAz MOTE UNDER
VARIOUS EVENTS
Event Current Duration(mA) (ms)
RU transmit/receive (Rt/Rr) 20 140Data transmit/receive (Dt/Dr) 20 140Processing (P ) 8 3Sensing (S):−Amb. temp. 7.5 112−Vibration/sound 9.5 7000−Surface temp (MDA300) 16 25−Surface temp (MDA320) 16 25−SF6 density (MDA3200 150 400
TABLE IIEXPERIMENTAL VALIDATION OF CURRENT DRAWN AND LIFETIME
ESTIMATES FOR VARIOUS APPLICATIONS FOR N = 2.
Application TRUI TD Calculated Observed Expectedcurrent current lifetime
(s) (s) (mA) (mA) (months)Ambient 60 60 0.486 0.495 14.2temp 7200 900 0.203 0.211 34.1Vibration/ 60 60 1.58 1.59 4.39sound 7200 900 0.276 0.288 25.2Surface temp 60 60 0.478 0.481 14.5(MDA300) 7200 900 0.205 0.219 34.21Surface temp 60 60 0.97 1.079 7.09(MDA320) 7200 900 0.70 0.821 9.87SF6 60 60 2.107 2.17 3.29density 7200 900 0.854 0.87 8.13
applications. Specifically, experiments were conducted for
estimating the current consumption for various events occuring
at the motes. Illustrations of the current consumption in a
mote during various events of the circuit-breaker monitoring
application (using the MDA300) and the SF6 gas density
monitoring application (using MDA320) are depicted in Fig. 5.
For illustration purposes, these plots were obtained using
specifically low data and route update intervals. A complete
list of events performed by the motes for the different appli-
cations developed in this project is shown in Table I.
Using the above data, we can represent the average current
consumption in a mote as
I = IRtTRt
/TRUI + IDtTDt
/TD +N(IRrTRr
/TRUI
+IDrTDr
/TD) + ISTS/TDt+ 8IPTP (1)
where Ix and Tx represent the current drawn and the duration,
respectively, of the event x; N is the number of neighbors
of the mote; and TRUI and TD represent the RUI and data
intervals, respectively. We validated this model by comparing
the predicted values from Equation 1 with experimental results
obtained in a 2-node network in the laboratory. These results
are shown in Table II. The experimental results match our
predictions closely. Also shown in Table II (last column) are
the expected lifetimes of the nodes using a 5000 mAH battery,
which is the battery used in the nodes in ParadiseNet.Although the results in Table II are encouraging, it must be
noted that the current consumption in a node increases with
N , the number of neighbors. This is due to the overhearing
problem, by which nodes waste energy in receiving all packets
870
(a) (b)
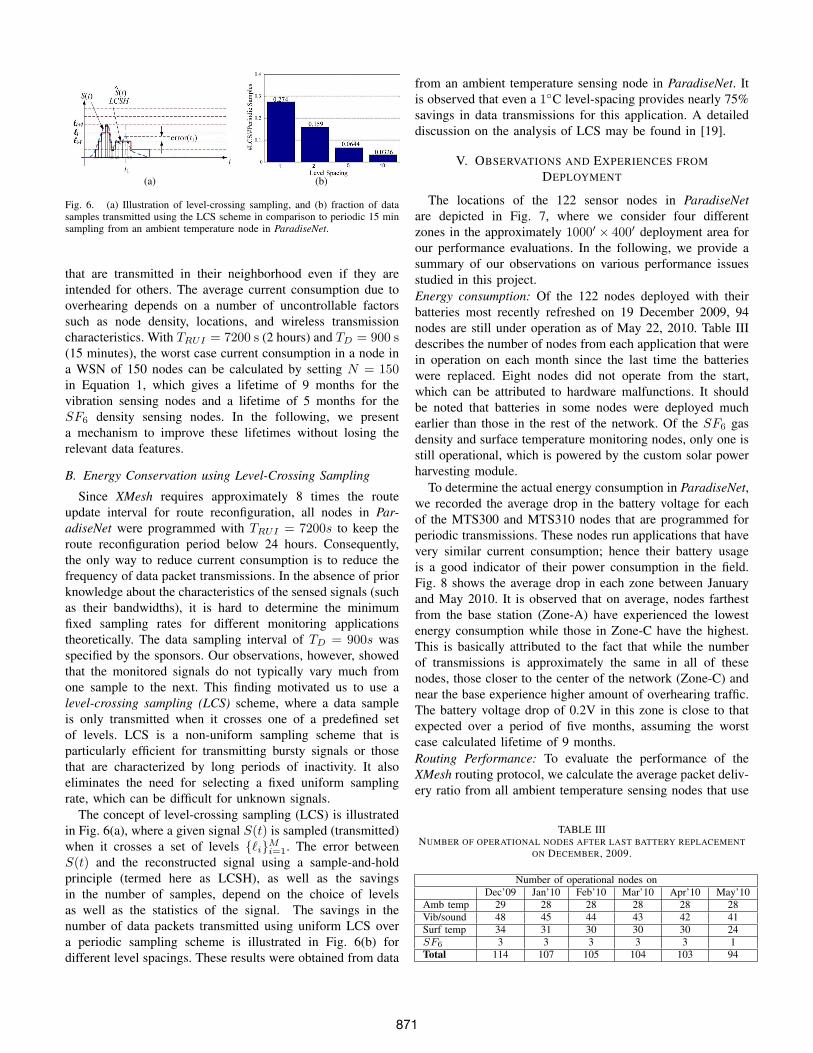
Fig. 6. (a) Illustration of level-crossing sampling, and (b) fraction of datasamples transmitted using the LCS scheme in comparison to periodic 15 minsampling from an ambient temperature node in ParadiseNet.
that are transmitted in their neighborhood even if they are
intended for others. The average current consumption due to
overhearing depends on a number of uncontrollable factors
such as node density, locations, and wireless transmission
characteristics. With TRUI = 7200 s (2 hours) and TD = 900 s(15 minutes), the worst case current consumption in a node in
a WSN of 150 nodes can be calculated by setting N = 150in Equation 1, which gives a lifetime of 9 months for the
vibration sensing nodes and a lifetime of 5 months for the
SF6 density sensing nodes. In the following, we present
a mechanism to improve these lifetimes without losing the
relevant data features.
B. Energy Conservation using Level-Crossing Sampling
Since XMesh requires approximately 8 times the route
update interval for route reconfiguration, all nodes in Par-adiseNet were programmed with TRUI = 7200s to keep the
route reconfiguration period below 24 hours. Consequently,
the only way to reduce current consumption is to reduce the
frequency of data packet transmissions. In the absence of prior
knowledge about the characteristics of the sensed signals (such
as their bandwidths), it is hard to determine the minimum
fixed sampling rates for different monitoring applications
theoretically. The data sampling interval of TD = 900s was
specified by the sponsors. Our observations, however, showed
that the monitored signals do not typically vary much from
one sample to the next. This finding motivated us to use a
level-crossing sampling (LCS) scheme, where a data sample
is only transmitted when it crosses one of a predefined set
of levels. LCS is a non-uniform sampling scheme that is
particularly efficient for transmitting bursty signals or those
that are characterized by long periods of inactivity. It also
eliminates the need for selecting a fixed uniform sampling
rate, which can be difficult for unknown signals.
The concept of level-crossing sampling (LCS) is illustrated
in Fig. 6(a), where a given signal S(t) is sampled (transmitted)
when it crosses a set of levels {�i}Mi=1. The error between
S(t) and the reconstructed signal using a sample-and-hold
principle (termed here as LCSH), as well as the savings
in the number of samples, depend on the choice of levels
as well as the statistics of the signal. The savings in the
number of data packets transmitted using uniform LCS over
a periodic sampling scheme is illustrated in Fig. 6(b) for
different level spacings. These results were obtained from data
from an ambient temperature sensing node in ParadiseNet. It
is observed that even a 1◦C level-spacing provides nearly 75%
savings in data transmissions for this application. A detailed
discussion on the analysis of LCS may be found in [19].
V. OBSERVATIONS AND EXPERIENCES FROM
DEPLOYMENT
The locations of the 122 sensor nodes in ParadiseNetare depicted in Fig. 7, where we consider four different
zones in the approximately 1000′ × 400′ deployment area for
our performance evaluations. In the following, we provide a
summary of our observations on various performance issues
studied in this project.
Energy consumption: Of the 122 nodes deployed with their
batteries most recently refreshed on 19 December 2009, 94
nodes are still under operation as of May 22, 2010. Table III
describes the number of nodes from each application that were
in operation on each month since the last time the batteries
were replaced. Eight nodes did not operate from the start,
which can be attributed to hardware malfunctions. It should
be noted that batteries in some nodes were deployed much
earlier than those in the rest of the network. Of the SF6 gas
density and surface temperature monitoring nodes, only one is
still operational, which is powered by the custom solar power
harvesting module.
To determine the actual energy consumption in ParadiseNet,we recorded the average drop in the battery voltage for each
of the MTS300 and MTS310 nodes that are programmed for
periodic transmissions. These nodes run applications that have
very similar current consumption; hence their battery usage
is a good indicator of their power consumption in the field.
Fig. 8 shows the average drop in each zone between January
and May 2010. It is observed that on average, nodes farthest
from the base station (Zone-A) have experienced the lowest
energy consumption while those in Zone-C have the highest.
This is basically attributed to the fact that while the number
of transmissions is approximately the same in all of these
nodes, those closer to the center of the network (Zone-C) and
near the base experience higher amount of overhearing traffic.
The battery voltage drop of 0.2V in this zone is close to that
expected over a period of five months, assuming the worst
case calculated lifetime of 9 months.
Routing Performance: To evaluate the performance of the
XMesh routing protocol, we calculate the average packet deliv-
ery ratio from all ambient temperature sensing nodes that use
TABLE IIINUMBER OF OPERATIONAL NODES AFTER LAST BATTERY REPLACEMENT
ON DECEMBER, 2009.
Number of operational nodes onDec’09 Jan’10 Feb’10 Mar’10 Apr’10 May’10
Amb temp 29 28 28 28 28 28Vib/sound 48 45 44 43 42 41Surf temp 34 31 30 30 30 24SF6 3 3 3 3 3 1Total 114 107 105 104 103 94
871

Fig. 7. Locations of nodes deployed in Paradise substation, the blue ovals represent banks of circuit breakers, and the light blue rectangle on the right is thetrailer where the base station is located. The red vertical lines are used to depict four different zones in the network.
Fig. 8. Average drops of battery voltages across zones over January – May2010.
periodic transmissions. These results, shown in Fig. 9, depict
that although the delivery ratio dropped slightly over time,
on an average about 75% of the transmissions are successful
in the network. As expected, the packet delivery ratio drops
with distance from the base station. However, even nodes from
the farthest end of the network (Zone-A) that require 4 or
more hops to transmit data packets to the base, successfully
delivered over 60% of their transmitted packets.
However, it was noted that XMesh created a high degree of
load imbalance. Specifically, two nodes (15 and 32) carried a
majority of the forwarded traffic, being included in the routes
of > 20 nodes; six nodes were involved in forwarding the
traffic of 10 − 20 nodes; and a large majority of the nodes
were included in the routes of only 0− 5 nodes. These nodes
are marked in red, orange, and green, respectively, in Fig. 7.
An interesting observation was that the load imbalance did not
create a noticeable impact on energy drainage. For instance,
the voltage drops in nodes 15 and 32 were not higher than in its
neighbors. This is possibly due to the fact that the dominating
cause for energy usage is overhearing and not data forwarding.
Hence, in dense networks such as ParadiseNet, load imbalance
is not a serious problem. In many cases, however, it may cause
early death for the nodes that carry heavy forwarding traffic,
leading to network partitioning and other undesired effects.
LCS performance: A fraction of the nodes for each appli-
cation were programmed with the proposed LCS scheme. A
comparison of sensor samples obtained from an LCS node
(node 27) and a node with periodic sampling from the same
Fig. 9. Packet delivery ratio of periodic ambient temperature sensing nodes.
(a)
(b)
Fig. 10. (a) Ambient temperatures obtained from a periodic and an LCSnode, and (b) the variation of the their battery voltage over time.
location is depicted in Fig. 10(a). Both nodes sense ambient
temperature, a quantity with temporal variations that tend
to be gradual. The LCS samples show the effectiveness of
capturing the temperature variations using the proposed non-
872

Fig. 11. Surface temperatures obtained from three oil-filled circuit breakers.
uniform strategy. The corresponding battery voltages shown in
Fig. 10(b) demonstrate that that the LCS node uses less energy
than a comparable periodic node performing the same task
over the same period of operation. Furthermore, the average
drop of the battery voltages of 30 LCS nodes performing
ambient temperature sensing was found to be 31 mV over
the past five months, compared to 117 mV for those nodes
using periodic sampling. This proves the effectiveness of the
proposed LCS scheme.
Monitoring performance: All applications worked as expected
and no specific monitoring alarms were obtained during
the operation period of ParadiseNet. An example of circuit
breaker monitoring is depicted in Fig. 11, which shows the
oil temperatures sensed from the surfaces of three oil-filled
circuit breaker in Paradise. The figure indicates that one of
the temperatures is higher than the other two and increasing
over time. This is an indication of a possible problem, which
raised an alarm. However, upon inspection the alarm was ruled
out and attributed to a sensor malfunction.
VI. CONCLUSIONS AND FUTURE WORK
Practical implementation reveals many realistic performance
issues that are often not possible to realize from laboratory
and theoretical analysis. This experimental study of a large-
scale WSN provided important leads towards achieving energy
efficiency in such networks. Several steps can be taken to
further improve the battery life of the sensor nodes in such
a large-scale deployment. Firstly, the energy consumed in
overhearing must be reduced. Although much work has been
done on this, practical implementations of mechanisms to
reduce overhearing would be worthwhile. A power control
mechanism can be largely useful. Other schemes such as
automatic formation of subgroups with multiple orthogonal
channels can also be used. Secondly, periodic route updates
are wasteful in a static large-scale WSN. A mechanism that
adaptively turns off route updates when transmissions are
successful could be beneficial.
ACKNOWLEDGMENT
The following graduate students from UNC Charlotte
worked on this project: Siddharth Kamath, Jason Anderson,
Priya Puthran, Priyanka Lingayat, Rohit Kale, and Hadi Alasti.
The authors like to thank Mark Goff from TVA Transmission
Operation and Maintenance for substation field support. This
work was sponsored by the Electric Power Research Institute
(EPRI).
REFERENCES
[1] A. Nasipuri, R. Cox, H. Alasti, L. Van der Zel, B. Rodriguez, R. McK-osky, and J. A. Graziano, “Wireless sensor network for substationmonitoring: Design and deployment,” in SenSys’08: 6th Intl. Conf. onEmbedded Networked Sensor Systems, Nov. 2008, pp. 365–366.
[2] A. Nasipuri, H. Alasti, P. Puthran, R. Cox, J. Conrad, L. V. derZel, B. Rodriguez, R. McKosky, and J. Graziano, “Vibration sensingfor equipments health monitoring in power substations using wirelesssensors,” in Proc. IEEE Southeast Conference (SoutheastCon), March2010, pp. 268–271.
[3] R. Kale, N. Singh, H. Alasti, A. Nasipuri, R. Cox, J. Conrad, L. V.der Zel, B. Rodriguez, R. McKosky, and J. Graziano, “Design andimplementation of a wireless node for advanced sensor processing andnetwork integration,” in Proc. IEEE Southeast Conference (Southeast-Con), March 2010, pp. 393–392.
[4] L. Krishnamurthy, R. Adler, P. Buonadonna, J. Chhabra, M. Flanigan,N. Kushalnagar, L. Nachman, and M. Yarvis, “Design and deploymentof industrial sensor networks: experiences from a semiconductor plantand the north sea,” in SenSys’05: Proc. 3nd Intl. Conf. on EmbeddedNetworked Sensor Systems, Nov. 2005, pp. 64–75.
[5] G. Werner-Allen, P. Swieskowski, and M. Welsh, “Real-time volcanicearthquake localization,” in SenSys ’06: Proc. 4nd Intl. Conf. on Em-bedded Networked Sensor Systems, Oct. 2006, pp. 357–358.
[6] G. Werner-Allen, K. Lorincz, J. Johnson, J. Lees, and M. Welsh, “Fi-delity and yield in a volcano monitoring sensor network,” in OSDI ’06:Proc. 7th symposium on Operating systems design and implementation,Nov. 2006, pp. 381–396.
[7] A. Cerpa, J. Elson, M. Hamilton, J. Zhao, D. Estrin, and L. Girod,“Habitat monitoring: Application driver for wireless communicationstechnology,” in ACM SIGCOMM’01 workshop on data communicationin Latin America and the Caribbean, Sept. 2001, pp. 20–41.
[8] R. Szewczyk, A. Mainwaring, J. Polastre, J. Anderson, and D. Culler,“An analysis of a large scale habitat monitoring application,” in Sen-Sys’04: Proc. 2nd Intl. Conf. on Embedded Networked Sensor Systems,December 2004, pp. 214–226.
[9] P. Zhang, C. M. Sadler, S. A. Lyon, and M. Martonosi, “Hardwaredesign experiences in ZebraNet,” in SenSys’04: Proc. 2nd Intl. Conf. onEmbedded Networked Sensor Systems, Dec. 2004, pp. 227–238.
[10] K. Chintalapudi, J. Paek, O. Gnawali, T. S. Fu, K. Dantu, J. Caffrey,R. Govindan, E. Johnson, and S. Masri, “Structural damage detectionand localization using netshm,” in IPSN ’06: Proc. 5th Intl. Conf. onInformation processing in sensor networks, April 2006, pp. 475–482.
[11] S. Kim, S. Pakzad, D. Culler, J. Demmel, G. Fenves, S. Glaser, andM. Turon, “Wireless sensor networks for structural health monitoring,”in SenSys ’06: Proc. 4th Intl. Conf. on Embedded networked sensorsystems, Oct. 2006, pp. 427–428.
[12] P. Sikka, P. Corke, P. Valencia, C. Crossman, D. Swain, and G. Bishop-Hurley, “Wireless adhoc sensor and actuator networks on the farm,” inIPSN ’06: Proc. 5th Intl. Conf. on Information processing in sensornetworks, April 2006, pp. 492–499.
[13] P. Dutta, J. Hui, J. Jeong, S. Kim, C. Sharp, J. Taneja, G. Tolle,K. Whitehouse, and D. Culler, “Trio: enabling sustainable and scalableoutdoor wireless sensor network deployments,” in IPSN ’06: Proc. Intl.Conf. on Information processing in sensor networks, April 2006, pp.407–415.
[14] J. W. Fonda, M. J. Zawodniok, S. Jagannathan, A. Salour, and D. M. Jr.,“Missouri S&T mote-based demonstration of energy monitoring solutionfor network enabled manufacturing using wireless sensor networks,”in IPSN ’08: Proc.7th Intl. Conf. on Information processing in sensornetworks, April 2008, pp. 559–560.
[15] http://www.xbow.com.[16] A. I. website, http://www.atlalabs.com/.[17] C. Technology, “Xmesh user’s manual,”
http://www.xbow.com/Support/wUserManuals.aspx,2007.
[18] http://www.granzow.com/gasdensitycontrols/8774/.[19] H. Alasti, “Applications of level crossing techniques for energy conser-
vation in large scale wireless sensor networks,” Ph.D. dissertation, ECE,The University of North Carolina at Charlotte, 2009.
873View publication statsView publication stats