design, development and evaluation of nanosuspensions for enhancement … · 2018-05-03 · design,...
TRANSCRIPT

DESIGN, DEVELOPMENT AND EVALUATION OF
NANOSUSPENSIONS FOR ENHANCEMENT OF
ORAL BIOAVAILABILITY OF POORLY
SOLUBLE DRUGS
A Thesis submitted to Gujarat Technological University
for the Award of
Doctor of Philosophy
in
Pharmacy
By
Ms. Jalpa Shantilal Paun
[Enrollment No. 119997290038]
Under supervision of
Dr. Hemraj M. Tank
GUJARAT TECHNOLOGICAL UNIVERSITY
AHMEDABAD
March – 2018

© Jalpa Shantilal Paun

iii
DECLARATION
I declare the thesis entitled, “Design, Development and Evaluation of
Nanosuspensions for Enhancement of Oral Bioavailability of Poorly Soluble Drugs”
submitted by me for the degree of Doctor of Philosophy is the record of research work
carried out by me during the period from September 2011 to April 2017 under the
supervision of Dr. Hemraj M. Tank and this has not formed the basis for the award of
any degree, diploma, associateship, fellowship, titles in this or any other University or
other institution of higher learning.
I further declare that the material obtained from other sources has been duly
acknowledged in the thesis. I shall be solely responsible for any plagiarism or other
irregularities if noticed in the thesis.
Signature of the Research Scholar: …………………………Date: ….………………
Name of Research Scholar: Ms. Jalpa Shantilal Paun
Place: Ahmedabad

iv
CERTIFICATE
I certify that the work incorporated in the thesis, “Design, Development and
Evaluation of Nanosuspensions for Enhancement of Oral Bioavailability of Poorly
Soluble Drugs” submitted by Kum. Jalpa Shantilal Paun was carried out by the
candidate under my supervision/guidance. To the best of my knowledge: (i) the
candidate has not submitted the same research work to any other institution for any
Degree/Diploma, Associateship, Fellowship or other similar titles (ii) the thesis
submitted is a record of original research work done by the Research Scholar during the
period of study under my supervision, and (iii) the thesis represents independent
research work on the part of the Research Scholar.
Signature of Supervisor: ……………………………… Date: ………………
Name of Supervisor: Dr. Hemraj M. Tank
Place: Ahmedabad

v
Originality Report Certificate
It is certified that Ph.D. Thesis titled, “Design, Development and Evaluation of
Nanosuspensions for Enhancement of Oral Bioavailability of Poorly Soluble Drugs”
by Ms. Jalpa Shantilal Paun has been examined by us. We undertake the following:
a. The thesis has significant new work/knowledge as compared already published or
are under consideration to be published elsewhere. No sentence, equation, diagram,
table, paragraph or section has been copied verbatim from previous work unless it
is placed under quotation marks and duly referenced.
b. The work presented is original and own work of the author (i.e. there is no
plagiarism). No ideas, processes, results or words of others have been presented as
Author own work.
c. There is no fabrication of data or results which have been compiled/ analyzed.
d. There is no falsification by manipulating research materials, equipment or
processes, or changing or omitting data or results such that the research is not
accurately represented in the research record.
e. The thesis has been checked using < Turnitin > (copy of originality report
attached) and found within limits as per GTU Plagiarism Policy and instructions
issued from time to time (i.e. permitted similarity index <=25%).
Signature of the Research Scholar: …………………………… Date: ….………
Name of Research Scholar: Ms. Jalpa Shantilal Paun
Place: Ahmedabad Signature of Supervisor: ……………………………… Date: ………………
Name of Supervisor: Dr. H.M. Tank
Place: Ahmedabad

vi
REPORT OF SIMILARITY DOWNLOADED
FROM “TURNITIN” DATABASE
[Ms. Jalpa S. Paun] [Dr. H.M. Tank]
vii
[Ms. Jalpa S. Paun] [Dr. H.M. Tank]

viii
[Ms. Jalpa S. Paun] [Dr. H. M. Tank]

ix
Ph.D. Thesis Non-Exclusive License to
GUJARAT TECHNOLOGICAL UNIVERSITY
In consideration of being a Ph.D. Research Scholar at GTU and in the interests of the
facilitation of research at GTU and elsewhere, I, Ms. Jalpa Shantilal Paun having
Enrollment No. 119997290038 hereby grant a non-exclusive, royalty-free and perpetual
license to GTU on the following terms:
a) GTU is permitted to archive, reproduce and distribute my thesis, in whole or in part,
and/or my abstract, in whole or in part (referred to collectively as the “Work”)
anywhere in the world, for non-commercial purposes, in all forms of media;
b) GTU is permitted to authorize, sub-lease, sub-contract or procure any of the acts
mentioned in paragraph (a);
c) GTU is authorized to submit the Work at any National / International Library, under
the authority of their “Thesis Non-Exclusive License”;
d) The Universal Copyright Notice (©) shall appear on all copies made under the
authority of this license;
e) I undertake to submit my thesis, through my University, to any Library and Archives.
Any abstract submitted with the thesis will be considered to form part of the thesis.
f) I represent that my thesis is my original work, does not infringe any rights of others,
including privacy rights, and that I have the right to make the grant conferred by this
non-exclusive license.

x
g) If third party copyrighted material was included in my thesis for which, under the terms
of the Copyright Act, written permission from the copyright owners is required, I have
obtained such permission from the copyright owners to do the acts mentioned in
paragraph (a) above for the full term of copyright protection.
h) I retain copyright ownership and moral rights in my thesis and may deal with the
copyright in my thesis, in any way consistent with rights granted by me to my
University in this non-exclusive license.
i) I further promise to inform any person to whom I may hereafter assign or license my
copyright in my thesis of the rights granted by me to my University in this non-
exclusive license.
j) I am aware of and agree to accept the conditions and regulations of Ph.D. including all
policy matters related to authorship and plagiarism.
Signature of the Research Scholar: ____________________________________
Name of Research Scholar: Ms. Jalpa Shantilal Paun
Date: ______________ Place: Ahmedabad Signature of Supervisor: _____________________________________________
Name of Supervisor: Dr. H.M. Tank
Date: _______________ Place: Ahmedabad
Seal:

xi
Thesis Approval Form The viva-voice of the PhD Thesis submitted by Kum. Jalpa
Shantilal Paun (Enrollment No. 119997290038) entitled, “Design, Development and
Evaluation of Nanosuspensions for Enhancement of Oral Bioavailability of Poorly
Soluble Drugs” was conducted on …………………….………… (day and date) at
Gujarat Technological University.
(Please tick any one of the following options)
The performance of the candidate was satisfactory. We recommend that he/she be
awarded the Ph.D. degree.
Any further modifications in research work recommended by the panel after 3
months from the date of first viva-voice upon request of the Supervisor or request
of Independent Research Scholar after which viva-voice can be re-conducted by the
same panel again.
The performance of the candidate was unsatisfactory. We recommend that he/she
should not be awarded the Ph.D. degree.
----------------------------------------------------- ----------------------------------------------------- Name and Signature of Supervisor with Seal 1) (External Examiner 1) Name and Signature
------------------------------------------------------- ------------------------------------------------------- 2) (External Examiner 2) Name and Signature 3) (External Examiner 3) Name and Signature

xii
DESIGN, DEVELOPMENT AND EVALUATION OF
NANOSUSPENSIONS FOR ENHANCEMENT OF ORAL
BIOAVAILABILITY OF POORLY SOLUBLE DRUGS
Submitted by
Ms. Jalpa Shantilal Paun
[Enrollment No. 119997290038]
Under supervision of
Dr. Hemraj M. Tank
ABSTRACT
A drug which belongs to BCS class-II has poor oral bioavailability due to its limited
aqueous solubility. Antihypertensive agents (candesartan cilexetil and telmisartan), as well
as atypical antipsychotic agent (ziprasidone hydrochloride monohydrate) which belongs to
BCS class-II and has poor water solubility, dissolution, and poor bioavailability, were
selected as drug candidates for the research work. In this study, an attempt was made to
develop stable nanosuspensions to enhance oral bioavailability of selected drugs.
Analytical methods were developed for selected drugs for the estimation of the drug in
formulations and plasma too. Gratis samples of selected drugs and stabilizers were
received and subjected to identification and compatibility study by FTIR and DSC. Based
on solubility from different solvents and their combinations, methanol was identified as
solvent and water as an antisolvent. Nanosuspensions were prepared using a precipitation-
ultrasonication method using suitable stabilizers. Developed products were lyophilized
using mannitol as a cryo-protectant. Various formulation parameters like amount of drug,
amount of stabilizers, the solvent to antisolvent volume ratio as well as process parameters
like the effect of stirring speed, sonication time etc. were screened by Plackett-Burman
design to identify key factors producing maximum effect on quality of nanosuspension.
Maximum impact producing two factors were considered for further study to optimize the
formulation by 32 factorial design. The optimized formulations of selected drugs were
xiii
evaluated by various parameters like particle size and size distribution, polydispersity
index, zeta potential, solubility and in-vitro dissolution study. The residual solvent analysis
was done using gas chromatography. Scanning electron microscopy was performed to
study the surface topology of selected drugs and optimized formulations. Optimized
formulations were subjected to accelerated stability study according to ICH guidelines. A
bioavailability study was also carried out to compare optimized nanosuspensions with
available marketed preparations. The developed products were stable for six months
storage at 25°C ± 2°C and 60% ± 5% RH condition. The developed products exhibited
improved bio-availability as compared to marketed formulations.

xiv
DEDICATED
IN THE LOTUS FEET OF
MAA SARASWATI
xv
Acknowledgment
“Gratitude makes sense of our past, brings peace for today and creates a
vision for tomorrow”
I take this privilege and pleasure to acknowledge the contributions of
many individuals who have been inspirational and supportive throughout
my work undertaken and endowed me with the most precious knowledge
to see success in my endeavor.
At this amenity of successful completion of this research work, I have
deeply obliged to ‘MAA SARASWATI’, for having bestowed on me the
ability to discharge my duties thoroughly in her endeavour and with
whose showers of blessings, this task was ventured without any
hindrances.
I avail this opportunity to express my deepest sense of gratitude with
profound respect towards my beloved and revered preceptor and Guide
Dr. H. M. Tank, Principal, Atmiya Institute of Pharmacy, Rajkot, whose
masterly suggestions and ablest guidance at every stage inspired me and
gave me considerable impetus not only to accomplish this milestone but in
all aspects. His untiring energy propelled the research work to completion.
I am thankful to him for being my persistent source of inspiration
throughout my career.
I sincerely convey my obligations to both DPC members of my research
work, Dr. R. K. Parikh, Ex. HOD, Department of Pharmaceutics, L. M.
College of Pharmacy, Ahmedabad and Dr. M. M. Patel,
Principal, Shree Swaminarayan Sanskar Pharmacy College, Zundal, who
helped me throughout my research work. Their positive flow of knowledge
made the research journey very smooth. With a deep sense of pleasure, I
am thankful to them for continuous advice and their precious remarks.

xvi
A special mention has to be given to Dr. J. R. Chavda, Principal, B. K.
Mody Government Pharmacy College, Rajkot for all the facilities provided
to carry out the work.
I owe a special thanks to Dr. M. M. Soniwala, Associate Professor,
Department of Pharmaceutics, B. K. Mody Govt. Pharmacy College, Rajkot
for his endless support as well as timely and accurate suggestions. I am
also grateful for his motivation, encouragement to carry out the work
enthusiastically at college.
I am sincerely thankful to my colleagues Dr. Sandeep Nathwani,
Dr. Suuny Shah, Dr. Ramesh Parmar, Dr. Dipen Bhimani,
Dr. Chetan Borkhataria, Mr. Kalpesh Patel, Ms. Neelam Rathod,
Dr. Ravi Manek, Dr. Devang Sheth, Dr. Nilesh Patel and all other
faculty members of B. K. Mody Govt. Pharmacy College, Rajkot for sharing
their knowledge and advice regarding my research work.
I would like to thank the librarian Mr. N. P. Joshi for his co-operation. I
would also thank all the lab assistants and nonteaching staff of B. K.
Mody Govt. Pharmacy College, Rajkot for extending their assistance.
Also special thanks to my friends Jagruti Vaghela, Arti Bagda, Rachana
Rajani, Resa Parmar, Khyati Shah, Daya Chothani, Mayuri Thumar, Urvi
Chotaliya and Khyati Parekh for their unique way of friendship and
affection. Their everlasting friendship is a boon for my life.
I convey my gratitude to Dr. Mihir Raval (HOD) and his team of
Department of Pharmaceutical Sciences, Saurashtra University, Rajkot,
for their valuable support to carry out my analytical study at their
organization.
I extend my thanks to Mr. Pinakin, NFDD, Saurashtra University, Rajkot
and Mr. Rohit, Junagadh Agricultural University, Junagadh for their
support in sample analysis of my research work.

xvii
I am very much thankful to Alembic Pharmaceuticals Ltd., Vadodara,
Amneal Pharmaceuticals, Ahmedabad and Astron Research Centre,
Ahmedabad for providing gift samples for the research work.
I am thankful to Gujarat Council on Science and Technology
(GUJCOST), Department of Science and Technology, Government of
Gujarat for funding the research work under Minor Research Project—
2014-15.
The belief of my parents, Mrs. Veenaben S. Paun and Mr. Shantilal R.
Paun, in me always inspired and persuaded me in all my endeavours
throughout. It is because of their pain taking efforts, I have reached up to
this position. I pay due regards to them for their hard work, sacrifice,
devotion, and blessings led me on this path. I am very thankful to my little
brother Vrushank and sister Charmi for their support, boundless
sacrifice, and love.
I owe my gratitude to all those well-wishers who directly or indirectly or in
one or the other way have inspired, encouraged and helped me to pursue
the path of success along with my life.
Thanks to one and all….
Jalpa S. Paun

TABLE OF CONTENT
xviii
TABLE OF CONTENTS
SR.
NO.
TITLE PAGE.
NO.
CHAPTER - 1 – INTRODUCTION
1.1 Introduction to bioavailability 2
1.2 History of bioavailability 3
1.3 Factors affecting bioavailability 4
1.4 Approaches for improvement of bioavailability 5
1.5 Nanosuspension 6
1.6 Profiles of selected drugs 28
1.7 Profile of excipients 39
1.8 Aim and objectives 43
1.9 References 45
CHAPTER - 2 - REVIEW OF LITERATURE
2.1 Review of literature on bioavailability enhancement by
nanosuspension
56
2.2 Review of literature on the preparation of nanosuspension by
precipitation method
62
2.3 Review of literature on bioavailability enhancement of
candesartan cilexetil
68
2.4 Review of literature on bioavailability enhancement of
telmisartan
70
2.5 Review of literature on bioavailability enhancement of
ziprasidone hydrochloride
73
2.6 Review of patents related to selected project work 75
2.7 References 76
CHAPTER - 3 – EXPERIMENTAL
3.1 List of materials used for the study 83
3.2 List of equipments used for the study 84
3.3 Sc Scanning and calibration curve preparation of selected drugs 84
3.4 Selection of solvent and antisolvent 88
3.5 Preparation of nanosuspension by the antisolvent precipitation-
ultrasonication method
88
TABLE OF CONTENT
xix
3.6 Lyophilization of nanosuspension 88
3.7 Selection of stabilizer 89
3.8 Drug-excipient compatibility study 89
3.9 Plackett-Burman design 90
3.10 Optimization of other preliminary parameters 90
3.11 Factorial design for optimization of key parameters 91
3.12 Checkpoint analysis 92
3.13 Evaluation of nanosuspensions 92
3.14 Bioavailability study 96
3.15 References 104
CHAPTER - 4 – RESULT AND DISCUSSION
4A Results and discussion of candesartan cilexetil
nanosuspension
108
4A.1 Scanning and calibration curve preparation 108
4A.2 Selection of solvent and antisolvent 112
4A.3 Selection of stabilizer 112
4A.4 Drug-excipient compatibility study 114
4A.5 Plackett - Burman design 116
4A.6 Optimization of other preliminary parameters 118
4A.7 32 factorial design 120
4A.8 Statistical analysis 121
4A.9 Contour plots 123
4A.10 Surface plots 124
4A.11 Optimization of candesartan cilexetil nanosuspension by
desirability function of Minitab17.0
125
4A.12 Checkpoint cum optimized batch analysis 126
4A.13 Checkpoint batch cum optimized batch validation 126
4A.14 Evaluation of optimized batch of candesartan cilexetil
nanosuspension
127
4A.15 Bioavailability Study 131
4A.16 Conclusion 135

TABLE OF CONTENT
xx
4B Results and discussion of telmisartan nanosuspension 137
4B.1 Scanning and calibration curve preparation 137
4B.2 Selection of solvent and antisolvent 141
4B.3 Selection of stabilizer 141
4B.4 Drug-excipient compatibility study 142
4B.5 Plackett - Burman design 145
4B.6 Optimization of other preliminary parameters 147
4B.7 32 factorial design 149
4B.8 Statistical analysis 150
4B.9 Contour plots 152
4B.10 Surface plots 153
4B.11 Optimization of telmisartan nanosuspension by
desirability function of minitab17.0
154
4B.12 Checkpoint cum optimized batch analysis 155
4B.13 Checkpoint batch cum optimized batch validation 155
4B.14 Evaluation of optimized batch of telmisartan nanosuspension 156
4B.15 Bioavailability study 160
4B.16 Conclusion 164
4C Results and discussion of ziprasidone hydrochloride
nanosuspension
165
4C.1 Scanning and calibration curve preparation 165
4C.2 Selection of solvent and antisolvent 169
4C.3 Selection of stabilizer 169
4C.4 Drug-excipient compatibility study 171
4C.5 Plackett - Burman design 173
4C.6 Optimization of other preliminary parameters 176
4C.7 32 factorial design 177
4C.8 Statistical analysis 179
4C.9 Contour plots 182
4C.10 Surface plots 183
4C.11 Optimization of ziprasidone hydrochloride nanosuspension by
desirability function of Minitab17.0
184
4C.12 Checkpoint cum optimized batch analysis 185

TABLE OF CONTENT
xxi
4C.13 Checkpoint batch cum optimized batch validation 186
4C.14 Evaluation of optimized batch of ziprasidone hydrochloride
nanosuspension
186
4C.15 Bioavailability study 190
4C.16 Conclusion 194
4C.17 References 195
CHAPTER – 5 SUMMARY AND CONCLUSION
Summary and conclusion 199
Bibliography 203
APPENDICES
Appendix A - IAEC Approval letter 207
Appendix B - GUJCOST Minor Research Project Sanction
Letter
208
Appendix C - List of Publications 209
Appendix D - Poster Presentation of Research Work in National
Level Seminar
213

LIST OF ABBREVIATIONS
xxii
LIST OF ABBREVIATIONS
Abbreviation Full form
Abs Absorbance
ANDA Abbreviated new drug application
ANOVA Analysis of variance
API Active pharmaceutical ingredient
AR Analytical reagent
AUC Area under curve
BCS Biopharmaceutical classification system
BP British Pharmacopoeia
CC Candesartan cilexetil
CCNS Candesartan cilexetil nanosuspension
cm- Centimeter inverse
Conc. Concentration
CPR Cumulative percentage release
DF Degree of freedom
DMF Dimethylformamide
DSC Differential scanning calorimetry
Ed. Edition
EPN Evaporative precipitation of nanosuspension
Eq. Equation
FbD Formulation by design
FDA Food and drug administration
FDAMA Food and drug administration modernization act
Fm Full model
FTIR Fourier transform infrared spectroscopy
GC-HS Gas chromatography headspace sampler
GIT Gastrointestinal tract
gm Gram
GRAS Generally regard as safe
HPH High-pressure homogenization
HPLC High-performance liquid chromatography
HPMC Hydroxylpropyl methylcellulose
HPMCAS Hydroxypropyl methylcellulose acetate succinate
HP-β-CD Hydroxypropyl- β-cyclodextrin

LIST OF ABBREVIATIONS
xxiii
h Hour
ICH International conference on harmonization
IIG Inactive ingredient guide
IP Indian pharmacopoeia
ISTD Internal standard
IUPAC International Union of pure and applied chemistry
JP Japanese pharmacopoeia
LCMS Liquid chromatography-mass spectroscopy
LD Laser diffractometry
M Molarity
MA Melt agglomeration
MEKC Micellar electrokinetic chromatography
mg Milligram
min Minute
ml Millilitre
MM Media Milling
MPS Mean particle size
MS Mean square
mV Millivolt
NaCMC Sodium carboxymethyl cellulose
NDA New drug application
NF National formulary
nm Nanometre
No. Number
NS Nanosuspension
PCA Precipitation with the compressed antisolvent process
PCS Photon correlation spectroscopy
PDI Polydispersity index
PEG Polyethylene glycol
ppm Parts per million
PTFE Polytetrafluoroethylene
PVA Polyvinyl alcohol
PVP K-30 Polyvinylpyrrolidone K-30
PXRD Powder x-ray diffraction
R2 Regression coefficient
RESS Rapid expansion of supercritical solution

LIST OF ABBREVIATIONS
xxiv
RH Relative humidity
RPM Rotation per minute
SCF Supercritical fluid
SD Solid dispersion
SD Standard deviation
SDD Spray-dried dispersion
SDS Sodium dodecyl sulfate
SE Solvent evaporation
SEDDS Self-emulsifying drug delivery system
SEM Scanning electron microscopy
SGF Simulated gastric fluid
SNCD Solid nanocrystalline dispersion
SNEDDS Self-nano emulsifying drug delivery system
SPIP in-situ single pass perfusion
SS Saturation solubility
SS Sum of square
TGA Thermal gravimetric analysis
TM Telmisartan
TMNS Telmisartan nanosuspension
UK United Kingdom
USA United States of America
USP Unites States Pharmacopoeia
UV Ultraviolet
ZH Ziprasidone hydrochloride
ZHNS Ziprasidone hydrochloride nanosuspension
ZP Zeta potential
LIST OF SYMBOLS
xxv
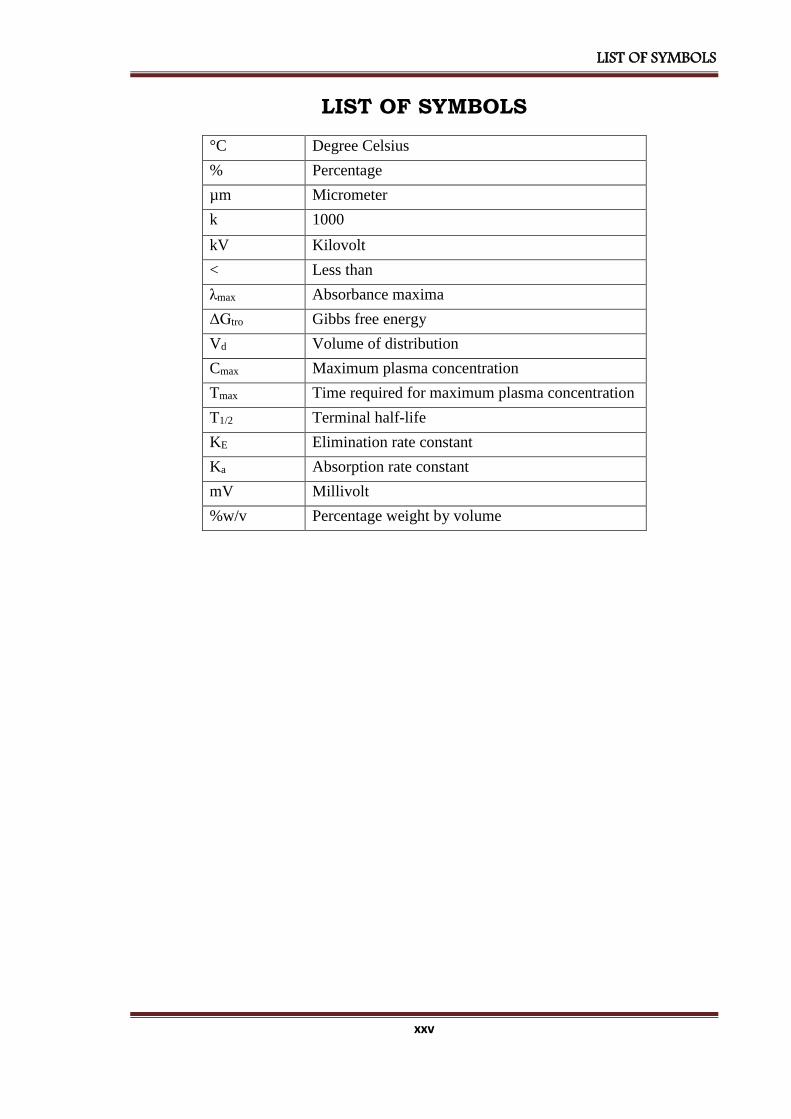
LIST OF SYMBOLS
°C Degree Celsius
% Percentage
µm Micrometer
k 1000
kV Kilovolt
< Less than
λmax Absorbance maxima
ΔGtro Gibbs free energy
Vd Volume of distribution
Cmax Maximum plasma concentration
Tmax Time required for maximum plasma concentration
T1/2 Terminal half-life
KE Elimination rate constant
Ka Absorption rate constant
mV Millivolt
%w/v Percentage weight by volume
LIST OF TABLES
xxvi
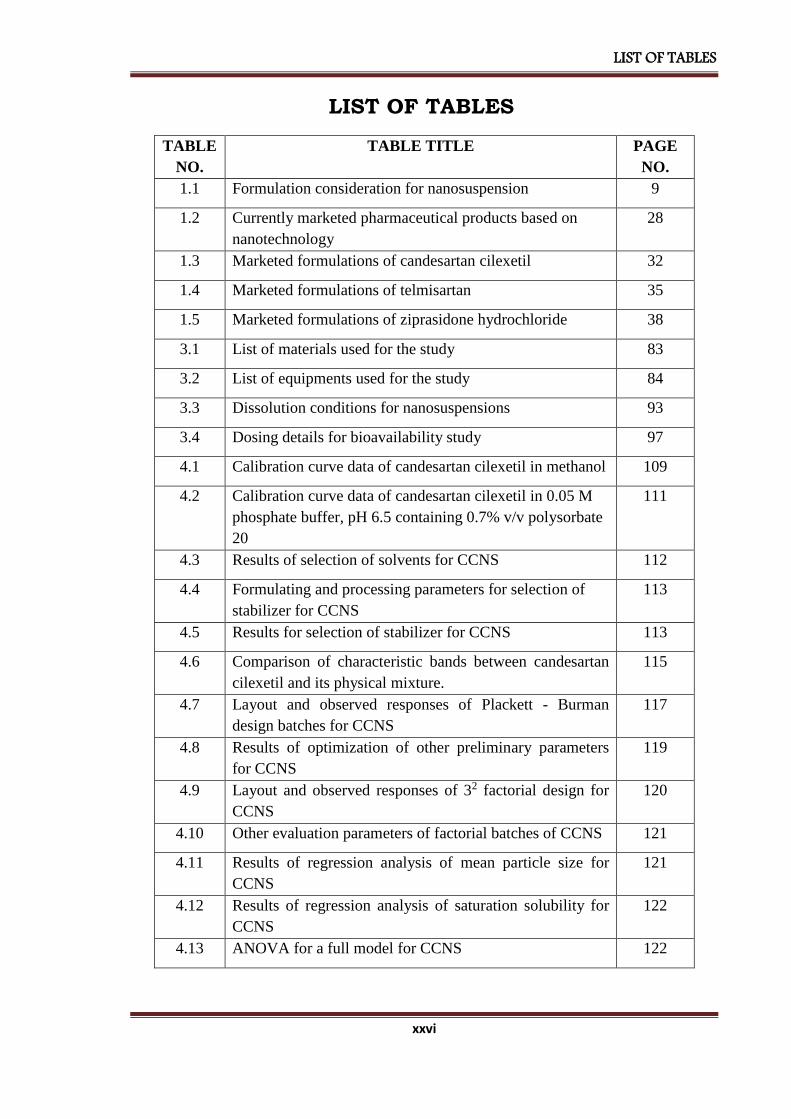
LIST OF TABLES
TABLE
NO.
TABLE TITLE PAGE
NO.
1.1 Formulation consideration for nanosuspension 9
1.2 Currently marketed pharmaceutical products based on
nanotechnology
28
1.3 Marketed formulations of candesartan cilexetil 32
1.4 Marketed formulations of telmisartan 35
1.5 Marketed formulations of ziprasidone hydrochloride 38
3.1 List of materials used for the study 83
3.2 List of equipments used for the study 84
3.3 Dissolution conditions for nanosuspensions 93
3.4 Dosing details for bioavailability study 97
4.1 Calibration curve data of candesartan cilexetil in methanol 109
4.2 Calibration curve data of candesartan cilexetil in 0.05 M
phosphate buffer, pH 6.5 containing 0.7% v/v polysorbate
20
111
4.3 Results of selection of solvents for CCNS 112
4.4 Formulating and processing parameters for selection of
stabilizer for CCNS
113
4.5 Results for selection of stabilizer for CCNS 113
4.6 Comparison of characteristic bands between candesartan
cilexetil and its physical mixture.
115
4.7 Layout and observed responses of Plackett - Burman
design batches for CCNS
117
4.8 Results of optimization of other preliminary parameters
for CCNS
119
4.9 Layout and observed responses of 32 factorial design for
CCNS
120
4.10 Other evaluation parameters of factorial batches of CCNS 121
4.11 Results of regression analysis of mean particle size for
CCNS
121
4.12 Results of regression analysis of saturation solubility for
CCNS
122
4.13 ANOVA for a full model for CCNS 122

LIST OF TABLES
xxvii
4.14 Formulation and process parameters for an optimized
batch of CCNS
126
4.15 The composition of checkpoint batch cum optimized batch
of CCNS
127
4.16 Comparison of calculated data with experimental data of
CCNS
127
4.17 Evaluation parameters of an optimized batch of CCNS 129
4.18 Results of accelerated stability study of CCNS 131
4.19 Results of bioavailability study of candesartan cilexetil
nanosuspension and marketed formulation
132
4.20 Results of pharmacokinetic parameters of candesartan
cilexetil nanosuspension and marketed formulation
133
4.21 Calibration curve data of telmisartan in methanol 138
4.22 Calibration curve data of telmisartan in phosphate buffer,
pH 7.5
140
4.23 Results of selection of solvents for TMNS 141
4.24 Formulating and processing parameters for selection of
stabilizer for TMNS
141
4.25 Results for selection of stabilizer for TMNS 142
4.26 Comparison of characteristic bands between telmisartan
and its physical mixture
144
4.27 Layout and observed responses of Plackett - Burman
design batches for TMNS
146
4.28 Results of optimization of other preliminary parameters
for TMNS
148
4.29 Layout and observed responses of 32 factorial design for
TMNS
149
4.30 Other evaluation parameters of factorial batches of TMNS 150
4.31 Results of regression analysis of mean particle size for
TMNS
150
4.32 Results of regression analysis of saturation solubility for
TMNS
151
4.33 ANOVA for full model for TMNS 151
4.34 Formulation and process parameters for an optimized
batch of TMNS
155
4.35 The composition of checkpoint batch cum optimized batch
of TMNS
155
4.36 Comparison of calculated data with experimental data of 155
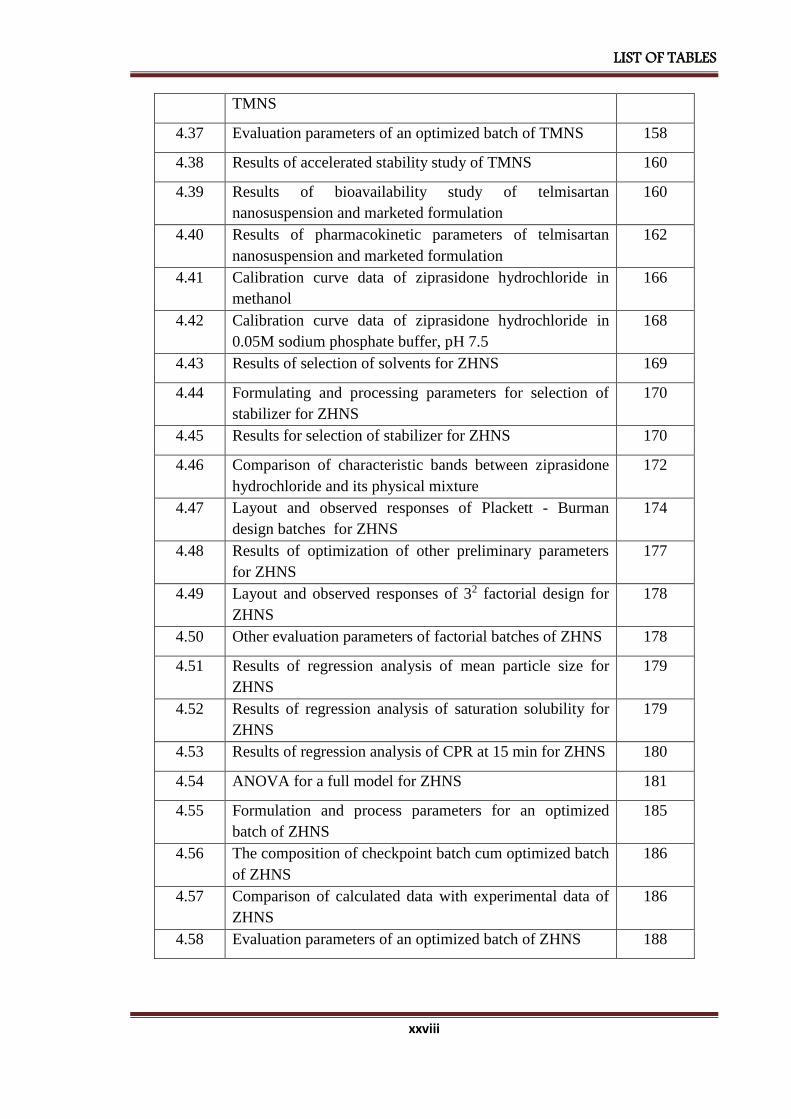
LIST OF TABLES
xxviii
TMNS
4.37 Evaluation parameters of an optimized batch of TMNS 158
4.38 Results of accelerated stability study of TMNS 160
4.39 Results of bioavailability study of telmisartan
nanosuspension and marketed formulation
160
4.40 Results of pharmacokinetic parameters of telmisartan
nanosuspension and marketed formulation
162
4.41 Calibration curve data of ziprasidone hydrochloride in
methanol
166
4.42 Calibration curve data of ziprasidone hydrochloride in
0.05M sodium phosphate buffer, pH 7.5
168
4.43 Results of selection of solvents for ZHNS 169
4.44 Formulating and processing parameters for selection of
stabilizer for ZHNS
170
4.45 Results for selection of stabilizer for ZHNS 170
4.46 Comparison of characteristic bands between ziprasidone
hydrochloride and its physical mixture
172
4.47 Layout and observed responses of Plackett - Burman
design batches for ZHNS
174
4.48 Results of optimization of other preliminary parameters
for ZHNS
177
4.49 Layout and observed responses of 32 factorial design for
ZHNS
178
4.50 Other evaluation parameters of factorial batches of ZHNS 178
4.51 Results of regression analysis of mean particle size for
ZHNS
179
4.52 Results of regression analysis of saturation solubility for
ZHNS
179
4.53 Results of regression analysis of CPR at 15 min for ZHNS 180
4.54 ANOVA for a full model for ZHNS 181
4.55 Formulation and process parameters for an optimized
batch of ZHNS
185
4.56 The composition of checkpoint batch cum optimized batch
of ZHNS
186
4.57 Comparison of calculated data with experimental data of
ZHNS
186
4.58 Evaluation parameters of an optimized batch of ZHNS 188

LIST OF TABLES
xxix
4.59 Results of accelerated stability study of ZHNS 190
4.60 Results of bioavailability study of ziprasidone
hydrochloride nanosuspension and marketed formulation
191
4.61 Results of pharmacokinetic parameters of ziprasidone
hydrochloride nanosuspension and marketed formulation
192

LIST OF FIGURES
xxx
LIST OF FIGURES FIGURE
NO.
FIGURE TITLE PAGE
NO.
1.1 Approaches for improvement of bioavailability 6
1.2 Chemical structure candesartan cilexetil 29
1.3 Chemical structure telmisartan 32
1.4 Chemical structure of ziprasidone hydrochloride 35
1.5 Structural formula of polyvinyl alcohol 39
1.6 Structural formula of PVP K-30 40
1.7 Structural formula of sodium lauryl sulfate 41
1.8 Structural formula of poloxamer 42
4.1 Scanning of candesartan cilexetil in methanol 109
4.2 Calibration curve of candesartan cilexetil in methanol 110
4.3 Scanning of candesartan cilexetil in 0.05 M phosphate buffer,
pH 6.5 containing 0.7% v/v polysorbate 20
110
4.4 Calibration curve of candesartan cilexetil in 0.05 M phosphate
buffer, pH 6.5 containing 0.7% v/v polysorbate 20
111
4.5 FT-IR spectra of [A] Candesartan cilexetil, [B] PVP K-30 and
[C] Physical mixture of candesartan cilexetil and PVP K-30
114
4.6 DSC thermograms of [A] Candesartan cilexetil [B] PVP K-30
[C] Physical mixture of candesartan cilexetil and PVP K-30
[D] Lyophilized nanosuspension of candesartan cilexetil
116
4.7 Pareto chart of the effect of independent variables on saturation
solubility of CCNS
118
4.8 Pareto chart of the effect of independent variables on the mean
particle size of CCNS
118
4.9 Contour plot of CCNS for effect on [A] Mean particle size and
[B] Saturation solubility
124
4.10 Response surface plot of CCNS for effect on [A] Mean particle
size and [B] Saturation solubility
125
4.11 Optimized plot of factorial design form Minitab 17 for CCNS 126
4.12 Particle size graph for CCNS 128
4.13 Comparison of in-vitro dissolution of candesartan cilexetil
nanosuspension with marketed formulation
129
4.14 Scanning electron microscopy of [A] Candesartan cilexetil 130

LIST OF FIGURES
xxxi
[B] CCNS
4.15 Gas chromatograph of methanol in lyophilized candesartan
cilexetil nanosuspension
131
4.16 Plasma concentration vs. time profile of candesartan cilexetil
nanosuspension and marketed formulation
133
4.17 Scanning of telmisartan in methanol 137
4.18 Calibration curve of telmisartan in methanol 138
4.19 Scanning of telmisartan in phosphate buffer, pH 7.5 139
4.20 Calibration curve of telmisartan in phosphate buffer, pH 7.5 140
4.21 FT-IR spectra of [A] Telmisartan, [B] Poloxamer 407 and
[C] Physical mixture of telmisartan and poloxamer 407
143
4.22 DSC thermograms of [A] Telmisartan [B] Poloxamer 407
[C] Physical mixture of telmisartan and poloxamer 407
[D] Lyophilized nanosuspension of telmisartan
145
4.23 Pareto chart of the effect of independent variables on saturation
solubility of TMNS
147
4.24 Pareto chart of the effect of independent variables on the mean
particle size of TMNS
147
4.25 Contour plot of TMNS for effect on [A] Mean particle size and
[B] Saturation solubility
153
4.26 Response surface plot of TMNS for effect on [A] Mean particle
size and [B] Saturation solubility
154
4.27 Optimized plot of factorial design form Minitab 17 for TMNS 154
4.28 Particle size graph for TMNS 156
4.29 Comparison of in-vitro dissolution of telmisartan
nanosuspension with marketed formulation
157
4.30 Scanning electron microscopy of [A] Telmisartan [B] TMNS 158
4.31 Gas chromatograph of methanol in lyophilized telmisartan
nanosuspension
159
4.32 Plasma concentration vs. time profile of telmisartan
nanosuspension and marketed formulation
161
4.33 Scanning of ziprasidone hydrochloride in methanol 165
4.34 Calibration curve of ziprasidone hydrochloride in methanol 166
4.35 Scanning of ziprasidone hydrochloride in 0.05 M sodium
phosphate buffer, pH 7.5 containing 2% SDS
167
4.36 Calibration curve of ziprasidone hydrochloride in 0.05M
sodium phosphate buffer, pH 7.5 containing 2% SDS
168

LIST OF FIGURES
xxxii
4.37 FT-IR spectra of [A] Ziprasidone hydrochloride,
[B] Poloxamer 407 and [C] Physical mixture of ziprasidone
hydrochloride and poloxamer 407
171
4.38 DSC thermograms of [A] Ziprasidone hydrochloride
[B] Poloxamer 407 [C] Physical mixture of ziprasidone
hydrochloride and poloxamer 407 [D] Lyophilized
nanosuspension of ziprasidone hydrochloride
173
4.39 Pareto chart of the effect of independent variables on saturation
solubility of ZHNS
175
4.40 Pareto chart of the effect of independent variables on the mean
particle size of ZHNS
175
4.41 Contour plot of ZHNS for effect on [A] Mean particle size, [B]
Saturation solubility and [C] CPR at 15 mins
183
4.42 Response surface plot of ZHNS for effect on [A] Mean particle
size, [B] Saturation solubility and [C] CPR at 15 mins.
184
4.43 The optimized plot of factorial design form Minitab 17 for
ZHNS
185
4.44 Particle size graph for ZHNS 187
4.45 Comparison of in-vitro dissolution of ziprasidone
hydrochloride nanosuspension with marketed formulation
188
4.46 Scanning electron microscopy of [A] Ziprasidone
hydrochloride and [B] ZHNS
189
4.47 Gas chromatograph of methanol in lyophilized ziprasidone
hydrochloride nanosuspension
190
4.48 Serum concentration vs. time profile of ziprasidone
hydrochloride nanosuspension and marketed formulation
192

LIST OF APPENDICES
xxxiii
LIST OF APPENDICES
Appendix A IAEC Approval letter
Appendix B GUJCOST Minor Research Project Sanction Letter
Appendix C List of Publications
Appendix D Poster Presentation of Research work in National Level Seminar

INTRODUCTION

CHAPTER 1 INTRODUCTION
2
CHAPTER – 1
Introduction
1. 1 Introduction to Bioavailability
Bioavailability is defined as the rate and extent to which the active ingredient is absorbed
from a drug product and becomes available at the site of action [1]. From a
pharmacokinetic perspective, bioavailability data for a given formulation provide an
estimate of the relative fraction of the orally administered dose that is absorbed into the
systemic circulation when compared to the bioavailability data for a solution, suspension
or intravenous dosage form. In addition, bioavailability studies provide other useful
pharmacokinetic information related to distribution, elimination, effects of nutrients on the
absorption of the drug, dose proportionality, and linearity in the pharmacokinetics of the
active and inactive moieties.
Bioavailability data can also provide information indirectly about the properties of a drug
substance before entry into the systemic circulation, such as permeability and the influence
of pre-systemic enzymes and/or transporters. Bioavailability of a drug is largely
determined by the properties of the dosage form, rather than by the drug's physicochemical
properties, which determines absorption potential. Differences in bioavailability among
formulations of a given drug can have clinical significance; thus, knowing whether drug
formulations are equivalent is essential.
Poorly water-soluble drugs are increasingly becoming a problem in terms of obtaining
satisfactory dissolution within the gastrointestinal tract that is necessary for good oral
bioavailability. It is not only existing drugs that cause problems but it is the challenge to

CHAPTER 1 INTRODUCTION
3
ensure that new drugs are not only active pharmacologically but have enough solubility to
ensure fast enough dissolution at the site of administration, often the gastrointestinal tract
[2].
1.2 History of bioavailability[3]
The study of absorption of an exogenously administered compound (sodium iodide) can be
traced back to 1912. The concept of bioavailability, however, was not introduced until
1945. Oser et al. studied the relative absorption of vitamins from pharmaceutical products
and referred to such relative absorption as physiological bioavailability. In recent years,
generic drug products, which are those manufactured by generic drug companies or the
innovator companies themselves, have become very popular. Bioavailability/
bioequivalence studies are of particular interest to the innovator and the generic drug
companies in the following ways.
First, for the approval of a generic drug product, the FDA usually does not require a
regular new drug application (NDA) submission, which demonstrates the efficacy, safety
and benefit-risk of the drug product, if the generic drug companies can provide the
evidence of bioequivalence between the generic drug products and the innovator drug
product through bioavailability and bioequivalence studies in a so-called abbreviated new
drug application (ANDA).
Second, when a new formulation of a drug product is developed, the FDA requires that a
bioavailability study is conducted to assess its bioequivalence to the standard (or reference)
marketed formulation of the drug product. Thus, bioavailability studies are important
because an NDA submission includes the results from phases 1-3 clinical trials, which are
very time to consume and costly to obtain. Finally, under the Food and Drug
Administration Modernization Act (FDAMA) passed by the U.S. Congress in 1997, after
the approval, depending on the magnitudes of changes in components and composition or
method of manufacture, the FDA may require the evidence of bioequivalence between the
pre- and post-change products under NDA or post-change generic product with the
reference list product under ANDA.
The concept of bioavailability and bioequivalence became a public issue in the late 1960s
because of the concern that a generic drug product might not be as bioavailable as that
manufactured by the innovator. These concerns arose from clinical observations in humans

CHAPTER 1 INTRODUCTION
4
together with the ability to quantify minute quantities of the drug in biological fluids. This
initiated not only a period of four decades of extremely active scientific research and
development in bioavailability and bioequivalence but also started the process and
formulation of the current regulatory requirements for approval of generic drug products.
Spanning from the early 1970s to date, the research and development of bioavailability and
bioequivalence can be roughly divided into four phases.
The first phase is from the early 1970s to 1984 when the U.S. Congress passed the
Drug Price Competition and Patent Term Restoration Act that authorized to
approve generic drug products through bioavailability and bioequivalence studies.
The second phase begins from 1984 to 1992 after the issue of the U.S. FDA
guidance entitled Statistical Procedures for Bioequivalence Studies Using a
Standard Two-Treatment Crossover Design in 1992, which provides the sponsors a
guidance as to how the data should be analyzed and presented in an ANDA
submission for bioequivalence review.
The concept of population and individual bioequivalence for addressing drug
interchangeability in terms of drug prescribability and drug switchability and their
corresponding statistical methods has been discussed in the third phase since 1992.
The fourth phase starts at the dawn of the twenty-first century when based on the
fruit of research conducted in the last 30 years of the twentieth century, the FDA
issued and implemented the new guidance on general considerations and statistical
approaches to bioavailability and bioequivalence studies.
1.3 Factors affecting bioavailability
Low bioavailability is most common with oral dosage forms of poorly water-soluble,
slowly absorbed drugs. Solid drugs need to dissolve before they are exposed to be
absorbed. If the drug does not dissolve readily or cannot penetrate the epithelial membrane
(e.g. if it is highly ionized and polar), time at the absorption site may be insufficient. In
such cases, bioavailability tends to be highly variable as well as low [4]. Age, sex, physical
activity, genetic phenotype, stress, disorders (e.g. achlorhydria, malabsorption syndromes),
or previous GI surgery (e.g. bariatric surgery) can also affect drug bioavailability.

CHAPTER 1 INTRODUCTION
5
1.4 Approaches for improvement of bioavailability
Improvement of bioavailability of poorly water-soluble drug remains one of the most
challenging aspects of drug development. By many estimates up to 40% of new chemical
entities discovered by the pharmaceutical industry today are poorly water compounds [5].
Together with the permeability, the solubility behavior of a drug is a key determinant of its
bioavailability. There have always been certain drugs for which solubility has presented a
challenge to the development of a suitable formulation for oral administration. Examples
are griseofulvin, digoxin, phenytoin, sulphathiazole etc. With the recent arrival of high
throughput screening of potential therapeutic agents, the number of poorly soluble drug
candidates has risen sharply and the formulation of poorly soluble compounds for delivery
now presents one of the most frequent and greatest challenges to formulation scientists in
the pharmaceutical industry.
Consideration of the modified Noyes-Whitney equation provides some hints as to how the
dissolution rate of even very poorly soluble compounds might be improved to minimize
the limitations on oral availability [6]. The main possibilities for improving dissolution
according to this analysis are:
• To increase the surface area available for dissolution by decreasing the particle size
of the solid compound,
• By optimizing the wetting characteristics of the compound surface,
• To decrease the diffusion layer thickness,
• To ensure sink conditions for dissolution and,
• To improve the apparent solubility of the drug under physiologically relevant
conditions. [7]
A fundamental step in the solubilization of drug compound is the selection of an
appropriate salt form, or for liquid drugs, adjustment of pH of the solution. Traditional
approaches to drug solubilization include either chemical or mechanical modification of
the drug molecule, or physically altering the macromolecular characteristics of aggregated
drug particles.
Improvement of bioavailability can be obtained by following measures:

CHAPTER 1 INTRODUCTION
6
FIGURE 1.1: Approaches for improvement of bioavailability [8]
1.5 Nanosuspension
Nevertheless, pharmacokinetic studies of BCS class – II drugs showed that they have a low
oral bioavailability, which may be due to the poor water solubility of the drug. There are
many classical pharmaceutical ways to improve drug dissolution rates such as dissolution
in aqueous mixtures with an organic solvent [9], the formation of ß-cyclodextrin
complexes [10], solid dispersions [11] and drug salt form [12].
During last 20 years a new technology, reducing drug particle size, has been developed to
increase drug dissolution rate. According to Noyes–Whitney equation, drugs with smaller
particle size have enlarged surface areas which lead to increase dissolution velocity.
Higher the dissolution rate together with the resulting higher concentration gradient
between the gastrointestinal lumen and systemic circulation could further increase oral
bioavailability of drugs [13]. Nanosuspension is a submicron colloidal dispersion of drug
particles which are stabilized by surfactants. A pharmaceutical nanosuspension is defined
as very finely dispersed solid drug particles in an aqueous vehicle for oral, topical,
parenteral or pulmonary administration. The particle size distribution of the solid particles
in nanosuspensions is usually less than one micron with an average particle size ranging
between 200 and 600 nm [14]. In nanosuspension technology, the drug is maintained in the
required crystalline state with reduced particle size, leading to an increased dissolution rate

CHAPTER 1 INTRODUCTION
7
and therefore improved bioavailability. An increase in the dissolution rate of micronized
particles (particle size < 10 μm) is related to an increase in the surface area and
consequently the dissolution velocity. Nanosized particles can increase solution velocity
and saturation solubility because of the vapor pressure effect. In addition; the diffusional
distance on the surface of drug nanoparticles is decreased, thus leading to an increased
concentration gradient. Increase in surface area, as well as concentration gradient, leading
to a much more pronounced increase in the dissolution velocity as compared to a
micronized product. Another possible explanation for the increased saturation solubility is
the creation of high energy surfaces when disrupting the more or less ideal drug
microcrystals to nanoparticles. Dissolution experiments can be performed to quantify the
increase in the saturation solubility of a drug when formulated into a nanosuspension [15].
The stability of the particles obtained in the nanosuspension is attributed to their uniform
particle size which is created by various manufacturing processes. The absence of particles
with large differences in their size in nanosuspensions prevents the existence of different
saturation solubilities and concentration gradients; consequently preventing the Oswald
ripening effect. Ostwald ripening is responsible for crystal growth and subsequently
formation of micro-particles. It is caused by a difference in dissolution pressure/saturation
solubility between small and large particles. Molecules diffuse from the higher
concentration area around small particles which have higher saturation solubility to an area
around larger particles possessing a lower drug concentration. This leads to the formation
of a supersaturated solution around the large particles and consequently to drug
crystallization and growth of the large particles.
1.5.1 Advantages of nanosuspensions
The major advantages of nanosuspension technology are: [16]
• Provides ease of manufacture and scale-up for large-scale production,
• Long-term physical stability due to the presence of stabilizers,
• Oral administration of nanosuspensions provide rapid onset, reduced fed/fasted
ratio and improved bioavailability,
• Rapid dissolution and tissue targeting can be achieved by IV route of
administration,
• Reduction in tissue irritation in case of subcutaneous/intramuscular administration,
CHAPTER 1 INTRODUCTION
8
• Higher bioavailability in case of ocular administration and inhalation delivery,
• Drugs with high log P value can be formulated as nanosuspensions to increase the
bioavailability of such drugs,
• Improvement in biological performance due to high dissolution rate and saturation
solubility of the drug,
• Nanosuspensions can be incorporated in tablets, pellets, hydrogels, and
suppositories are suitable for various routes of administration,
• The flexibility offered in the modification of surface properties and particle size,
and ease of postproduction processing of nanosuspensions enables them to be
incorporated in various dosage forms for various routes of administration, thus
proving their versatility.
1.5.2 Interesting special features of nanosuspensions [17]
• Increase in saturation solubility and consequently an increase in the dissolution rate
of the drug.
• Increase in adhesive nature, thus resulting in enhanced bioavailability.
• Increasing the amorphous fraction in the particles, leading to a potential change in
the crystalline structure and higher solubility.
• The absence of Ostwald ripening, producing physical long-term stability as an
aqueous suspension.
• The possibility of surface-modification of nanosuspensions for site-specific
delivery.
1.5.3 Criteria for selection of a drug for nanosuspensions
Nanosuspension can be prepared for the API that is having either of the following
characteristics: [18]
• Water-insoluble but which are soluble in oil (high log P) OR API are insoluble in
both water and oils
• Drugs with a reduced tendency of the crystal to dissolve, regardless of the solvent
• API with a very large dose

CHAPTER 1 INTRODUCTION
9
1.5.4 Formulation of nanosuspension [19]
TABLE 1.1: Formulation consideration for nanosuspension
Excipients Function Examples
Stabilizers Wet the drug particles thoroughly, prevent
Ostwald’s ripening and agglomeration of
nanosuspensions, providing a steric or
ionic barrier
Soya Lecithins,
Poloxamers188/407,
Polysorbate 80,
HPMC E-15/E-50,
PVP K-25/K-30
Co-surfactants Influence phase behavior when
microemulsions are used to formulate
nanosuspensions
Bile salts,
Dipotassium Glycyrrhizinate,
Transcutol,
Ethanol,
Isopropanol
Organic solvent Pharmaceutically acceptable less
hazardous solvent for preparation of
formulation.
Methanol, Ethanol,
Chloroform, Isopropanol,
Ethyl acetate, Ethyl formate,
Butyl lactate, Triacetin,
Propylene carbonate,
Benzyl alcohol.
Other additives According to the requirement of the route
of administration or the properties of the
drug moiety
Buffers, Salts,
Polyols, Osmogens,
Cryoprotectant etc.
1.5.5 Methods of preparation for nanosuspensions
(A) Milling techniques (Nanocrystals or Nanosystems)
i) Media milling:
Media milling is a technique used to prepare nanosuspensions [13,14][19,20]. Nanocrystal
is a patent protected technology in which, the drug nanoparticles are obtained by subjecting
the drug to media milling. High energy and shear forces generated as a result of impaction
of the milling media with the drug provide the necessary energy input to disintegrate the
micro-particulate drug into nanosized particles. In the media milling process, the milling
chamber is charged with the milling media, water or a suitable buffer, drug and stabilizer.
Then the milling media or pearls are rotated at a very high shear rate. The major concern
with this method is the residues of milling media remaining in the finished product could
be problematic for administration [19].
Nanosuspensions are produced by using high-shear media mills or pearl mills. The mill
consists of a milling chamber, milling shaft, and a recirculation chamber. An aqueous
suspension of the drug is then fed into the mill containing small grinding balls/pearls. As

CHAPTER 1 INTRODUCTION
10
these balls rotate at a very high shear rate under controlled temperature, they fly through
the grinding jar interior and impact against the sample on the opposite grinding jar wall.
The combined forces of friction and impact produce a high degree of particle size
reduction. The milling media or balls are made of a ceramic-sintered aluminum oxide or
zirconium oxide or highly cross-linked polystyrene resin with high abrasion resistance.
Planetary ball mill is one example of the equipment that can be used to achieve a grind size
below 0.1 μm.
ii) Dry co-grinding:
Nanosuspensions prepared by high-pressure homogenization and media milling using
pearl-ball mill are wet–grinding processes. Recently, nanosuspensions can be obtained by
dry milling techniques. Successful work in preparing stable nanosuspensions using dry-
grinding of poorly soluble drugs with soluble polymers and copolymers after dispersing in
a liquid media has been reported [21–23].
The colloidal particles formation of many poorly water-soluble drugs; griseofulvin,
glibenclamide, and nifedipine were obtained by grinding with polyvinylpyrrolidone (PVP)
and sodium dodecyl sulfate (SDS). Many soluble polymers and copolymers such as PVP,
polyethylene glycol (PEG), hydroxypropyl methylcellulose (HPMC) and cyclodextrin
derivatives have been used [24–26]. Physicochemical properties and dissolution of poorly
water-soluble drugs were improved by co-grinding because of an improvement in the
surface polarity and transformation from a crystalline to an amorphous drug [27,28]. Dry
co-grinding can be carried out easily and economically and can be conducted without
organic solvents. The co-grinding technique can reduce particles to the submicron level
and a stable amorphous solid can be obtained.
Advantages
• Media milling is applicable to the drugs that are poorly soluble in both aqueous and
organic media.
• Very dilute as well as highly concentrated nanosuspensions can be prepared by
handling 1 mg/ml to 400 mg/ml drug quantity.
• Nanosize distribution of final nanosized products.

CHAPTER 1 INTRODUCTION
11
Disadvantages
• Nanosuspensions contaminated with materials eroded from balls may be
problematic when it is used for long therapy. (Wet milling technique)
• The media milling technique is time-consuming.
• Some fractions of particles are in the micrometer range.
• Scale up is not easy due to mill size and weight.
(B) High-Pressure Homogenization
i) Homogenization in Aqueous media (Dissocubes)
Homogenization involves the forcing of the suspension under pressure through a valve
having a narrow aperture. Dissocube technology was developed by Muller et al. in which,
the suspension of the drug is made to pass through a small orifice that results in a reduction
of the static pressure below the boiling pressure of water, which leads to boiling of water
and formation of gas bubbles. When the suspension leaves the gap and normal air pressure
is reached again, the bubbles shrink and the surrounding part containing the drug particles
rushes to the center and in the process colloids, causing a reduction in the particle size.
Most of the cases require multiple passes or cycles through the homogenizer, which
depends on the hardness of drug, the desired mean particle size, and the required
homogeneity.
Atovaquone nanosuspensions was prepared using Dissocubes technique [29]. To produce a
nanosuspension with a higher concentration of solids, it is preferred to start
homogenization with very fine drug particles, which can be accomplished by pre-milling.
ii) Homogenization in Non-Aqueous Media (Nanopure)
Nanopure is the technology in which suspension is homogenized in water-free media or
water mixtures [30]. In the Dissocubes technology, the cavitation is the determining factor
of the process. But, in contrast to water, oils and oily fatty acids have very low vapor
pressure and a high boiling point. Hence, the drop of static pressure will not be sufficient
enough to initiate cavitation. Patents covering disintegration of polymeric material by
high-pressure homogenization mention that higher temperatures of about 80°C promoted
disintegration, which cannot be used for thermolabile compounds. In nanopure technology,
the drug suspensions in the non-aqueous media were homogenized at 0°C or even below

CHAPTER 1 INTRODUCTION
12
the freezing point and hence are called "deep-freeze" homogenization. The results obtained
were comparable to Dissocubes and hence can be used effectively for thermolabile
substances at milder conditions.
Advantages
• Drugs that are poorly soluble in both aqueous and organic media can be easily
formulated into nanosuspensions.
• Ease of scale-up and little batch-to-batch variation [31]
• Narrow size distribution of the nanoparticulate drug present in the final product
[32]
• Allows aseptic production of nanosuspensions for parenteral administration.
• Flexibility in handling the drug quantity, ranging from 1 to 400 mg.ml-1, thus
enabling formulation of very dilute as well as highly concentrated nanosuspensions
Disadvantages
• Prerequisite of micronized drug particles.
• Prerequisite of suspension formation using high-speed mixers before subjecting it
to homogenization.
(C) Precipitation Method
Using a precipitation technique, the drug is dissolved in an organic solvent and this
solution is mixed with a miscible antisolvent. In water-solvent mixture the solubility is low
and the drug precipitates. Mixing processes vary considerably. Precipitation has also been
coupled with high shear processing. The nanoedge process (is a registered trademark of
Baxter International Inc. and its subsidiaries) relies on the precipitation of friable materials
for subsequent fragmentation under conditions of high shear and/or thermal energy [33].
Nanoedge
The basic principles of Nanoedge are the same as that of precipitation and homogenization.
A combination of these techniques results in smaller particle size and better stability in a
shorter time. The major drawback of the precipitation technique, such as crystal growth
and long-term stability, can be resolved using the Nanoedge technology. Rapid addition of
a drug solution to an antisolvent leads to sudden super-saturation of the mixed solution and

CHAPTER 1 INTRODUCTION
13
generation of fine crystalline or amorphous solids. Precipitation of an amorphous material
may be favored at high super-saturation when the solubility of the amorphous state is
exceeded. The success of drug nanosuspensions prepared by precipitation techniques has
been reported [33–36].
In this technique, the precipitated suspension is further homogenized, leading to a
reduction in particle size and avoiding crystal growth. Precipitation is performed in water
using water-miscible solvents such as methanol, ethanol, and isopropanol. It is desirable to
remove those solvents completely, although they can be tolerated to a certain extent in the
formulation. For an effective production of nanosuspensions using the Nanoedge
technology, an evaporation step can be included to provide a solvent-free modified starting
material followed by high-pressure homogenization.
(D) Nanojet Technology
This technique, called opposite stream or nanojet technology, uses a chamber where a
stream of suspension is divided into two or more parts, which colloid with each other at
high pressure. The high shear force produced during the process results in particle size
reduction. Equipment using this principle includes the M110L and M110S micro-fluidizers
(Microfluidics).
The major disadvantage of this technique is the high number of passes through the micro-
fluidizer and the product obtained contains a relatively larger fraction of micro-particles.
(E) Emulsions as Templates
Apart from the use of emulsions as a drug delivery vehicle, they can also be used as
templates to produce nanosuspensions. The use of emulsions as templates is applicable for
those drugs that are soluble in either volatile organic solvent or partially water-miscible
solvent. Such solvents can be used as the dispersed phase of the emulsion. There are two
ways of fabricating drug nanosuspensions by the emulsification method. In the first
method, an organic solvent or mixture of solvents loaded with the drug is dispersed in the
aqueous phase containing suitable surfactants to form an emulsion. The organic phase is
then evaporated under reduced pressure so that the drug particles precipitate
instantaneously to form a nanosuspension stabilized by surfactants. Since one particle is
formed in each emulsion droplet, it is possible to control the particle size of the

CHAPTER 1 INTRODUCTION
14
nanosuspension by controlling the size of the emulsion. Optimizing the surfactant
composition increases the intake of the organic phase and ultimately the drug loading in
the emulsion. Originally, organic solvents such as methylene chloride and chloroform were
used [37].
However, environmental hazards and human safety concerns about residual solvents have
limited their use in routine manufacturing processes. Relatively safer solvents such as ethyl
acetate and ethyl formate can still be considered for use [38,39].
The emulsion is formed by the conventional method and the drug nanosuspension is
obtained by just diluting the emulsion. Dilution of the emulsion with water causes
complete diffusion of the internal phase into the external phase, leading to the
instantaneous formation of a nanosuspension. The nanosuspension thus formed has to be
made free of the internal phase and surfactants by means of di-ultrafiltration in order to
make it suitable for administration. However, if all the ingredients that are used for the
production of the nanosuspension are present in a concentration acceptable for the desired
route of administration, then simple centrifugation or ultracentrifugation is sufficient to
separate the nanosuspension.
Advantages
• Use of specialized equipment is not necessary.
• Particle size can easily be controlled by controlling the size of the emulsion droplet.
• Ease of scale-up if the formulation is optimized properly.
Disadvantages
• Drugs that are poorly soluble in both aqueous and organic media cannot be
formulated by this technique.
• Safety concerns because of the use of hazardous solvents in the process.
• Need for di-ultrafiltration for purification of the drug nanosuspension, which may
render the process costly.
• The high amount of surfactant/stabilizer is required as compared to the production
techniques described earlier.
The production of drug nanosuspensions from emulsion templates has been successfully
applied to the poorly water soluble and poorly bioavailable anti-cancer drug mitotane,

CHAPTER 1 INTRODUCTION
15
where a significant improvement in the dissolution rate of the drug (a five-fold increase) as
compared to the commercial product was observed [40].
(F) Microemulsions as Templates
Microemulsions are thermodynamically stable and iso-tropically clear dispersions of two
immiscible liquids, such as oil and water, stabilized by an interfacial film of surfactant and
co-surfactant [41].
Their advantages, such as high drug solubilization, long shelf life and ease of manufacture,
making them an ideal drug delivery vehicle. Recently, the use of microemulsions as
templates for the production of solid lipid nanoparticles [42] and polymeric nanoparticles
[43] has been described. Taking advantage of the microemulsion structure, one can use
microemulsions even for the production of nanosuspensions [44]. The drug can be either
loaded in the internal phase or preformed microemulsions can be saturated with the drug
by intimate mixing. The suitable dilution of the microemulsion yields the drug
nanosuspension by the mechanism described earlier. The influence of the amount and ratio
of surfactant to co-surfactant on the uptake of internal phase and on the globule size of the
microemulsion should be investigated and optimized in order to achieve the desired drug
loading. The nanosuspension thus formed has to be made free of the internal phase and
surfactants by means of di-ultrafiltration in order to make it suitable for administration.
However, if all the ingredients that are used for the production of the nanosuspension are
present in a concentration acceptable for the desired route of administration, then simple
centrifugation or ultracentrifugation is sufficient to separate the nanosuspension. The
advantages and disadvantages are the same as for emulsion templates. The only added
advantage is the need for less energy input for the production of nanosuspensions by virtue
of microemulsions.
(G) Supercritical Fluid Method
Supercritical fluid technology can be used to produce nanoparticles from drug solutions.
The various methods attempted are a rapid expansion of supercritical solution process
(RESS), supercritical antisolvent process and precipitation with the compressed antisolvent
process (PCA). The RESS involves expansion of the drug solution in supercritical fluid
through a nozzle, which leads to loss of solvent power of the supercritical fluid resulting in
precipitation of the drug as fine particles. In the PCA method, the drug solution is atomized

CHAPTER 1 INTRODUCTION
16
into a chamber containing compressed CO2. As the solvent is removed, the solution gets
supersaturated and thus precipitates as fine crystals. The supercritical antisolvent process
uses a supercritical fluid in which a drug is poorly soluble and a solvent for the drug that is
also miscible with the supercritical fluid. The drug solution is injected into the supercritical
fluid and the solvent gets extracted by the supercritical fluid and the drug solution gets
supersaturated. The drug is then precipitated as fine crystals. The disadvantages of the
above methods are use of hazardous solvents and use of high proportions of surfactants
and stabilizers as compared with other techniques, particle nucleation overgrowth due to
transient high super-saturation, which may also result in the development of an amorphous
form or another undesired polymorph [45].
1.5.6 Post-production processing
Post-production processing of nanosuspensions becomes essential when the drug candidate
is highly susceptible to hydrolytic cleavage or chemical degradation. Processing may also
be required when the best possible stabilizer is not able to stabilize the nanosuspension for
a longer period of time or there are acceptability restrictions with respect to the desired
route. Considering these aspects, techniques such as lyophilization or spray drying may be
employed to produce a dry powder of nano-sized drug particles. The rational selection has
to be made in these unit operations considering the drug properties and economic aspects
[19].
1.5.7 Characterization of nanosuspension
(A) Mean particle size and particle size distribution
The mean particle size and particle size distribution are important characterization
parameters as they influence the saturation solubility, dissolution velocity, physical
stability as well as biological performance of nanosuspensions. It has been indicated that
saturation solubility and dissolution velocity show considerable variation with the
changing particle size of the drug [15]. Photon correlation spectroscopy (PCS) can be used
for rapid and accurate determination of the mean particle diameter of nanosuspensions.
Moreover, PCS can even be used for determining the width of the particle size distribution
(polydispersity index, PDI). The PDI is an important parameter that governs the physical
stability of nanosuspensions and should be as low as possible for the long-term stability of
nanosuspensions. A PDI value of 0.1– 0.25 indicates a fairly narrow size distribution

CHAPTER 1 INTRODUCTION
17
whereas a PDI value greater than 0.5 indicates a very broad distribution. No logarithmic
normal distribution can definitely be attributed to such a high PDI value. Although PCS is
a versatile technique, because of its low measuring range (3 nm to 3 μm) it becomes
difficult to determine the possibility of contamination of the nanosuspension by
microparticulate drugs (having a particle size greater than 3 μm). Hence, in addition to
PCS analysis, laser diffractometry (LD) analysis of nanosuspensions should be carried out
in order to detect as well as quantify the drug micro-particles that might have been
generated during the production process.
Various methods are available for particle size measurement [46]. Laser diffractometry
yields a volume size distribution and can be used to measure particles ranging from 0.05–
80 μm and in certain instruments particle sizes up to 2000 μm can be measured. The
typical LD characterization includes determination of diameter 50% LD50 and diameter
99% LD99 values, which indicate that either 50 or 99% of the particles are below the
indicated size. The LD analysis becomes critical for nanosuspensions that are meant for
parenteral and pulmonary delivery. Even if the nanosuspension contains a small number of
particles greater than 5–6 μm, there could be a possibility of capillary blockade or emboli
formation, as the size of the smallest blood capillary is 5–6 μm. It should be noted that the
particle size data of a nanosuspension obtained by LD and PCS analysis are not identical as
LD data are volume based and the PCS mean diameter is the light intensity weighted size.
The PCS mean diameter and the 50 or 99% diameter from the LD analysis are likely to
differ, with LD data generally exhibiting higher values. The nanosuspensions can be
suitably diluted with deionized water before carrying out PCS or LD analysis.
(B) Crystalline state and particle morphology
The assessment of the crystalline state and particle morphology together helps in
understanding the polymorphic or morphological changes that a drug might undergo when
subjected to nano-sizing. Additionally, when nanosuspensions are prepared drug particles
in an amorphous state are likely to be generated. Hence, it is essential to investigate the
extent of amorphous drug nanoparticles generated during the production of
nanosuspensions. The changes in the physical state of the drug particles as well as the
extent of the amorphous fraction can be determined by X-ray diffraction analysis [31,32]
and can be supplemented by differential scanning calorimetry [47]. In order to get an
actual idea of particle morphology, scanning electron microscopy is preferred [32].

CHAPTER 1 INTRODUCTION
18
(C) Particle charge (zeta potential)
The particle charge is of importance in the study of the stability of the suspensions.
Usually, the zeta potential of more than ±40mV will be considered to be required for the
stabilization of the dispersions. For electrostatically stabilized nanosuspension a minimum
zeta potential of ±30mV is required and in case of combined steric and electrostatic
stabilization it should be a minimum of ± 20mV of zeta potential is required. Surface
charges can arise from (i) ionization of the particle surface or (ii) adsorption of ions (such
as surfactants) onto the surface. Typically, the surface charge is assessed through
measurements of the zeta potential. Zeta potential is the potential at the hydrodynamic
shear plane and can be determined from the particle mobility under an applied electric field
[48]. The mobility will depend on the effective charge on the surface. Zeta potential is also
a function of electrolyte concentration.
(D) Solubility study
The solubility can also define as the ability of one substance to form a solution with
another substance. The substance to be dissolved is called as solute and the dissolving fluid
in which the solute dissolve is called as a solvent, which together forms a solution. The
main advantage associated with the nanosuspensions is improved saturation solubility.
This is studied in different physiological solutions at different pH. Kelvin equation and the
Ostwald-Freundlich equations can explain the increase in saturation solubility.
Determination of this parameter is used to assess in vivo performance of the formulation
also [49].
The Kelvin equation (Eq. 1.1) is originally used to describe the vapor pressure over a
curved surface of a liquid droplet in gas; it is also applicable to explain the relationship
between the dissolution pressure and the curvature of the solid particles in liquid:
Eq… (1.1)
Where, Pr = Dissolution pressure of a particle with the radius r,
P∞ = Dissolution pressure of an infinitely large particle,
γ = Surface tension,
R = Gas constant,
T = Absolute temperature,
CHAPTER 1 INTRODUCTION
19
r = Radius of the particle,
Mr = Molecular weight,
ρ = Density of the particle.
According to the Kevin equation, the dissolution pressure increases with increasing
curvature, which means decreasing particle size. The curvature is enormous when the
particle size is in the nanometer range; then a large dissolution pressure can be achieved
leading to a shift of the equilibrium toward dissolution.
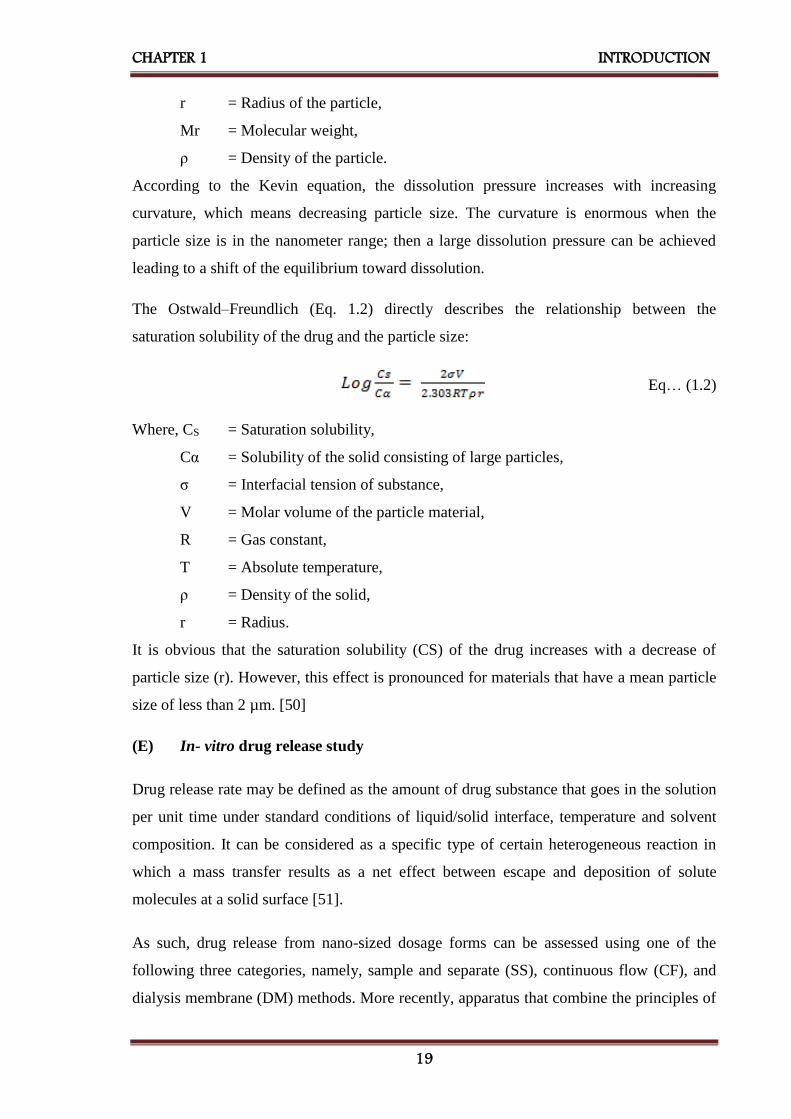
The Ostwald–Freundlich (Eq. 1.2) directly describes the relationship between the
saturation solubility of the drug and the particle size:
Eq… (1.2)
Where, CS = Saturation solubility,
Cα = Solubility of the solid consisting of large particles,
σ = Interfacial tension of substance,
V = Molar volume of the particle material,
R = Gas constant,
T = Absolute temperature,
ρ = Density of the solid,
r = Radius.
It is obvious that the saturation solubility (CS) of the drug increases with a decrease of
particle size (r). However, this effect is pronounced for materials that have a mean particle
size of less than 2 µm. [50]
(E) In- vitro drug release study
Drug release rate may be defined as the amount of drug substance that goes in the solution
per unit time under standard conditions of liquid/solid interface, temperature and solvent
composition. It can be considered as a specific type of certain heterogeneous reaction in
which a mass transfer results as a net effect between escape and deposition of solute
molecules at a solid surface [51].
As such, drug release from nano-sized dosage forms can be assessed using one of the
following three categories, namely, sample and separate (SS), continuous flow (CF), and
dialysis membrane (DM) methods. More recently, apparatus that combine the principles of

CHAPTER 1 INTRODUCTION
20
either the SS and DM or CF and DM have also been reported. A few novel methods that
use voltammetry, turbidimetry and so forth are discussed. For each of these methods, a
brief description is provided along with adaptations, additional considerations, advantages,
and disadvantages.
Sample and Separate: In the SS method, the nanoparticulate dosage form is
introduced into the release media that is maintained at a constant temperature, after
which drug release is assessed by a sampling of the release media (filtrate or
supernatant) or the nanoparticles. From literature, there are several adaptations to the
SS method, with differences noted in set-up, container size, mode of agitation, and
sampling techniques. Commonly reported set-ups include USP I (basket), USP II
(paddle), or vials and generally depend on the volume of release media used in the in-
vitro release study. For instance, vials were used when the volume of release media
was small (1–15 mL) and in-vitro release vessels were employed with larger volumes
(600–900 mL).
Continuous Flow: In the CF method, drug release from the nanoparticulate dosage
form is monitored using the USP IV apparatus (flow-through cell) or a modification
thereof. Drug release occurs as a result of buffer or media constantly circulating
through a column containing the immobilized dosage form and is monitored by
collecting the eluent at periodic intervals.
Dialysis Method: Of all the methods used to assess drug release from nano-sized
dosage forms, the dialysis method (DM) is the most versatile and popular. In this
method, physical separation of the dosage forms is achieved by usage of a dialysis
membrane which allows for ease of sampling at periodic intervals. As with the other
methods, several adaptations of the DM have been reported in the literature with key
differences in set-up, container size and molecular weight cut-off (MWCO). Of the
variety of DM set-ups used, the most commonly cited is the dialysis bag (regular
dialysis), other adaptations being the reverse dialysis and side-by-side dialysis set-up.
Combination Methods: A few publications have modified the set-ups used in the SS,
CF and DM methods to evaluate drug release from nano-sized dosage forms. In most
of these reports, the set-up of the SS method is combined with a dialyzer to allow ease
CHAPTER 1 INTRODUCTION
21
of sampling. In other publications, the DM and the CF set-up is used to assess in vitro
release from nanoparticles [52].
(F) Stability of Nanosuspensions
Stability of the suspensions is dependent on particle size. As the particle size reduces to the
nanosize the surface energy of the particles will be increased and they tend to agglomerate.
So stabilizers are used which decreases the chances of Ostwald ripening effect and
improving the stability of the suspension by providing a steric or ionic barrier. Typical
examples of stabilizers used in nanosuspensions are cellulosic, poloxamer, polysorbates,
lecithin, polyoleate and povidones etc [53].
(G) Bioavailability study
Direct and indirect methods are used to assess the drug bioavailability. The design of the
bioavailability study depends on the objectives of the study, the ability to analyze the drug
(and metabolites) in biological fluids, the pharmacodynamics of the drug substance, and
the route of drug administration and the nature of the drug product. Pharmacokinetic or
pharmacodynamic parameters, as well as clinical observations and in-vivo studies, may be
used to determine drug bioavailability from a drug or drug product. The various
approaches to bioavailability studies are summarized as follows: [54]
Plasma drug concentration studies
Measurement of drug concentrations in blood, plasma, or serum after drug administration
is the most direct and objective method to determine systemic drug availability. By
appropriate blood sampling, an accurate description of the plasma drug concentrations vs.
time profile of the therapeutically active drug substance(s) can be obtained using a
validated drug assay. In plasma drug concentrations studies, the following three important
parameters are measured:
Peak plasma concentration (Cmax): The peak plasma concentration (Cmax) is the
maximum plasma drug concentration obtained after oral administration of the drug.
The size of the dose administered influences the blood level concentration and Cmax.
For many drugs, a relationship is found between the pharmacodynamic drug effect and
the plasma drug concentration. Cmax provides indications that the drug is sufficiently
systemically absorbed to provide a therapeutic response. In addition, Cmax also provides

CHAPTER 1 INTRODUCTION
22
warning of possible toxic levels of the drug. Cmax is usually expressed in terms of
concentration in relation to a specific volume of blood, serum, or plasma (e.g. μg/ml or
ng/ml, etc.). [55]
Time of peak plasma concentration (Tmax): The time of peak plasma concentration
(Tmax) corresponds to the time required to reach maximum drug concentration after
drug administration. This parameter reflects the rate of drug absorption from a
formulation. At Tmax, peak drug absorption occurs and the rate of absorption exactly
equals the rate of drug elimination. Drug absorption still occurs after Tmax is reached,
but at a slower rate. When comparing drug products, Tmax can be used as an
approximate indication of the rate of drug absorption. [56]
Area under the plasma drug concentration vs. time curve (AUC): The area under
curve (AUC) is the total area under the biological fluid (serum, plasma, blood, etc.)
concentration of the drug vs. time curve between time T = 0 and time T = t, preferably
T = ∞, which is determined by a numerical integration procedure, such as ‘trapezoidal
rule’. According to the trapezoidal rule, the area between drug concentration-time
curves can be estimated through the assumption that the AUC can be represented as a
series of trapezoids. The total AUC would be the sum of the areas of the individual
trapezoids.
Area of each trapezoid = 1/2 (Cn − 1 + Cn) (tn – tn − 1) Eq...(1.3)
Where, Cn is the drug concentration in blood, plasma, or serum at time tn. The AUC is
dependent on the total quantity of the available drug, FD0, divided by the elimination rate
constant, k, and the apparent volume of distribution, VD.
Eq...(1.4)
Where, F is the fraction of dose absorbed, D0 is the dose, k is the elimination rate constant,
VD is the apparent volume of distribution, Cp is the plasma concentration and the units for
AUC are µg.hr/ml. [57]

CHAPTER 1 INTRODUCTION
23
Urinary drug excretion method:
Urinary drug excretion data is an indirect method for estimating bioavailability. The drug
must be excreted in significant quantities as unchanged drug in the urine, timely urine
samples must be collected, and the total amount of urinary drug excreted must be
determined. In urinary drug excretion data, the cumulative amount of drug excreted in the
urine (DU ∞) is measured for further in-vivo studies.
1.5.8 Applications of nanosuspensions in drug delivery
(A) Parenteral administration
From the formulation perspective, nanosuspensions meet almost all the requirements of an
ideal drug delivery system for the parenteral route. Since the drug particles are directly
nanosized, it becomes easy to process almost all drugs for parenteral administration.
Hence, nanosuspensions enable significant improvement in the parenterally tolerable dose
of the drug, leading to a reduction in the cost of the therapy and also improved therapeutic
performance. The maximum tolerable dose of paclitaxel nanosuspension was found to be
three times higher than the currently marketed Taxol, which uses Cremophore EL and
ethanol to solubilize the drug [58].
Nanosuspensions can be administered via different parenteral administration routes
ranging from intra-articular via intra-peritoneal to intravenous injection. For administration
by the parenteral route, the drug either has to be solubilized or has particle/globule size
below 5 μm to avoid capillary blockage. In this regard, liposomes are much more tolerable
and versatile in terms of parenteral delivery. However, they often suffer from problems
such as physical instability, high manufacturing cost and difficulties in scale-up.
Nanosuspensions would be able to solve the problems mentioned above. In addition,
nanosuspensions have been found to increase the efficacy of parenterally administered
drugs [30].
(B) Oral administration
The oral route is the preferred route for drug delivery because of its numerous well-known
advantages. The efficacy or performance of the orally administered drug generally depends
on its solubility and absorption through the gastrointestinal tract. Hence, a drug candidate
that exhibits poor aqueous solubility and/or dissolution rate limited absorption is believed

CHAPTER 1 INTRODUCTION
24
to possess slow and/or highly variable oral bioavailability. Danazol is poorly bioavailable
gonadotropin inhibitor, showed a drastic improvement in bioavailability when
administered as a nanosuspension as compared to the commercial danazol
macrosuspension Danocrine. Danazol nanosuspension led to an absolute bioavailability of
82.3%, whereas the marketed danazol suspension Danocrine was 5.2% bioavailable [13].
Nanosizing of drugs can lead to a dramatic increase in their oral absorption and subsequent
bioavailability. Improved bioavailability can be explained by the adhesiveness of drug
nanoparticles to the mucosa, the increased saturation solubility leading to an increased
concentration gradient between gastrointestinal tract lumen and blood as well as the
increased dissolution velocity of the drug. Aqueous nanosuspension can be used directly in
a liquid dosage form and a dry dosage form such as a tablet or hard gelatin capsule with
pellets. The aqueous nanosuspension can be used directly in the granulation process or as a
wetting agent for preparing the extrusion mass pellets. A similar process has been reported
for incorporating solid lipid nanoparticles into pellets. Granulates can also be produced by
spray drying of nanosuspensions [30].
(C) Ophthalmic drug delivery
Nanosuspensions could prove to be vital for drugs that exhibit poor solubility in lachrymal
fluids. Suspensions offer advantages such as prolonged residence time in a cul-de-sac,
which is desirable for most ocular diseases for effective treatment and avoidance of high
tonicity created by water-soluble drugs. Their actual performance depends on the intrinsic
solubility of the drug in lachrymal fluids. Thus the intrinsic dissolution rate of the drug in
lachrymal fluids controls its release and ocular bioavailability. However, the intrinsic
dissolution rate of the drug will vary because of the constant inflow and outflow of
lachrymal fluids. One example of a nanosuspension intended for ophthalmic controlled
delivery was developed as a polymeric nanosuspension of Acyclovir [59]. This
nanosuspension is successfully prepared using Eudragit RS100 by a quasi-emulsion and
solvent diffusion method. Nanosuspensions of glucocorticoid drugs; hydrocortisone,
prednisolone, and dexamethasone enhance rate, drug absorption and increase the duration
of drug action [60]. To achieve sustained release of the drug for a stipulated time period,
nanosuspensions can be incorporated in a suitable hydro-gel base or mucoadhesive base or
even in ocular inserts. The bio-erodible, as well as water-soluble/permeable polymers
possessing ocular tolerability[61], could be used to sustain the release of the medication.

CHAPTER 1 INTRODUCTION
25
The polymeric nanosuspension of flurbiprofen has been successfully formulated using
acrylate polymers such as Eudragit RS 100 and Eudragit RL 100[62][63][64]. The
polymeric nanosuspensions have been characterized for drug loading, particle size, zeta
potential, in-vitro drug release, ocular tolerability and in-vivo biological performance. The
designed polymeric nanosuspensions indicated superior in-vivo performance over the
existing marketed formulations and could sustain drug release for 24 h. The scope of this
strategy could be extended by using various polymers with ocular tolerability.
(D) Pulmonary drug delivery
Nanosuspensions may prove to be an ideal approach for delivering drugs that exhibit poor
solubility in pulmonary secretions. Currently, such drugs are delivered as suspension
aerosols or as dry powders by means of dry powder inhalers. The drugs used in suspension
aerosols and dry powder inhalers are often jet milled and have particle sizes of microns.
Because of the micro-particulate nature and wide particle size distribution of the drug
moiety present in suspension aerosols and dry powder inhalers, some disadvantages are
encountered: like limited diffusion and dissolution of the drug at the site of action, rapid
clearance of the drug from the lungs, less residence time for the drugs, unwanted
deposition of the drug particles in pharynx and mouth [65,66].
The ability of nanosuspensions to offer quick onset of action initially and then controlled
the release of the active moiety is highly beneficial and is required for most pulmonary
diseases. Moreover, as nanosuspensions generally contain a very low fraction of micro-
particulate drug, they prevent unwanted deposition of particles in the mouth and pharynx,
leading to decreased local and systemic side-effects of the drug. Additionally, because of
the nano-particulate nature and uniform size distribution of nanosuspensions, it is very
likely that in each aerosol droplet at least one drug nanoparticle is contained, leading to
even distribution of the drug in the lungs as compared to the micro-particulate form of the
drug. In conventional suspension aerosols, many droplets are drug-free and others are
highly loaded with the drug, leading to uneven delivery and distribution of the drug in the
lungs. Nanosuspensions could be used in all available types of the nebulizer. However, the
extent of influence exerted by the nebulizer type as well as the nebulization process on the
particle size of nanosuspensions should be ascertained.

CHAPTER 1 INTRODUCTION
26
(E) Bioavailability enhancement
A drug with poor solubility or permeability in gastrointestinal tract leads to poor oral
bioavailability. Nanosuspension resolves the problem of poor bioavailability by solving the
problem of poor solubility and poor permeability across the membranes. Dissolution rate
was increased in diclofenac when formulated in nanosuspension form from 25% to 50% in
SGF and H2O while in case of SIF it was increased from 10% to 35% as compared to
coarse suspension [67]. Bioavailability of poorly soluble, a COX-2 inhibitor, celecoxib
was improved using a nanosuspension formulation. The crystalline nanosized celecoxib
alone or in tablet showed a dramatic increase of dissolution rate and extent compared to a
micronized tablet. Spironolactone and budesonide are poorly soluble drugs. The higher
flux contributes to the higher bioavailability of nanosuspension formulation. The
bioavailability of poorly soluble fenofibrate following oral administration was increased
compared to the suspensions of micronized fenofibrate [68].
A significant difference (p< 0.05) was observed between the fluxes from saturated solution
vs. nanosuspension at all concentrations of surfactant. Oral administration of micronized
Amphotericin B does not show any significant effect. However, administration in
nanosuspension form showed a significant reduction (P < 0.5%) of the liver parasite load
by 28.6%, it indicates that the nanosuspension of Amphotericin B has a high systemic
effect and superior oral uptake in nanosuspension form [69].
The poor oral bioavailability of the drug may be due to poor solubility, poor permeability
or poor stability in the gastrointestinal tract (GIT). Nanosuspensions resolve the problem of
poor bioavailability by solving the twin problems of poor solubility and poor permeability
across the membrane. Bioavailability of poorly soluble oleanolic acid, a hepatoprotective
agent, was improved using a nanosuspension formulation. The therapeutic effect was
significantly enhanced, which indicated higher bioavailability. This was due to the faster
dissolution (90% in 20 min) of the lyophilized nanosuspension powder when compared
with the dissolution from a coarse powder (15% in 20 min) [30].
(F) Target drug delivery
Nanosuspensions can also be used for targeted delivery as their surface properties and in-
vivo behavior can easily be altered by changing either the stabilizer or the milieu. Their
versatility, ease of scale-up and commercial product enable the development of

CHAPTER 1 INTRODUCTION
27
commercially viable nanosuspensions for targeted delivery. The engineering of stealth
nanosuspensions by using various surface coatings for active or passive targeting of the
desired site is the future of targeted drug delivery systems. Targeting of Cryptosporidium
parvum, the organism responsible for cryptosporidiosis was achieved by using surface
modified mucoadhesive nanosuspensions of buparvaquone [70,71].
Similarly, conditions such as pulmonary aspergillosis can easily be targeted by using
suitable drug candidates, such as Amphotericin B, in the form of pulmonary
nanosuspensions instead of using stealth liposomes [72].
Nanosuspensions can also be used for targeting their surface properties and changing of the
stabilizer can easily alter the in vivo behavior. The drug will be uptaken by the
mononuclear phagocytic system to allow regional-specific delivery. This can be used for
targeting anti-mycobacterial, fungal or leishmanial drugs to the macrophages if the
infectious pathogen is persisting intra-cellularly [73].
(G) Topical formulations
Drug nanoparticles can be incorporated into creams and water-free ointments. The
nanocrystalline form leads to an increased saturation solubility of the drug in the topical
dosage form, thus enhancing the diffusion of the drug into the skin [74–78].
(H) Mucoadhesion of the nanoparticles
Nanosuspension containing drug nanoparticles orally diffuse into the liquid media and
rapidly encounter the mucosal surface. The particles are immobilized at the intestinal
surface by an adhesion mechanism referred to as "bioadhesion." From this moment on, the
concentrated suspension acts as a reservoir of particles and an adsorption process takes
place very rapidly. The direct contact of the particles with the intestinal cells through a
bioadhesive phase is the first step before particle absorption [66]. The adhesiveness of the
nanosuspensions not only helps to improve bioavailability but also improves targeting of
the parasites persisting in the GIT.
1.5.9 Marketed formulations based on nanosuspension
All the products based on nanosuspension have been approved by the FDA from the year
2000 on. A remarkable point is that all commercial products are intended for oral delivery.

CHAPTER 1 INTRODUCTION
28
This is an illustration of the general preference of the oral route since it avoids the pain and
discomfort associated with injections and is more attractive from a marketing and patient
compliance perspective. Finally, the major advantage of nanocrystals for oral delivery is
generally regarded as being on the increased specific surface area of the particles.
However, EMEND® and TriglideTM are formulated as nanosuspension to reduce fed/fasted
variability [79].
TABLE 1.2: Currently marketed pharmaceutical products based on
nanotechnology[80]
Product Drug Compound Company Manufacturing
Technique
Technology
RAPAMUNE® Sirolimus Wyeth MM* Elan Nanocrystals®
EMEND® Aprepitant Merck MM* Elan Nanocrystals®
TriCor® Fenofibrate Abbott MM* Elan Nanocrystals®
MEGACE®ES Megestrol Acetate PAR Pharmaceuticals MM* Elan Nanocrystals®
Avinza® Morphine
Sulphate
King Pharmaceutical MM* Elan Nanocrystals®
Focalin®XR Dexmethyl-
phenidate
Hydrochloride
Novartis MM* Elan Nanocrystals®
Ritalin®LA Methylphenidate
Hydrochloride
Novartis MM* Elan Nanocrystals®
Zanaflex
CapsulesTM
Tizanidine
Hydrochloride
Acorda MM* Elan Nanocrystals®
TriglideTM Fenofibrate First Horizon
Pharmaceutical
HPH# SkyePharmaIDD®
- P Technology
*MM - Media Milling, # HPH - High-Pressure Homogenisation
1.5.10 Conclusion
Nanotechnology is an incredible field of the medicine. Since solubility is a crucial factor
for drug effectiveness, it is a challenging task to formulate any poorly soluble drug in the
industry in conventional dosage forms. Nano-technique is simple; fewer requirements of
excipients are there for the formulation of dosage form design. Attractive features, such as
reduction of particles size up to submicron level lead to a significant increase in dissolution
velocity as well as saturation solubility. Improved bio-adhesiveness, versatility in surface
modification and ease of post-production processing has widened the applications of
nanosuspensions for various routes. Nanosuspension technology can be combined with
traditional dosage forms: tablets, capsules, pellets and also can be used for parenteral

CHAPTER 1 INTRODUCTION
29
products. Production techniques such as media milling and high-pressure homogenization
have been successfully employed for the large-scale production of nanosuspensions. The
advances in production methodologies using emulsions or microemulsions as templates
and precipitation method have provided still simpler approaches for production but with
limitations. Further investigation in this regard is still essential. Some of the patented
commercially productive technologies have been reviewed and if the patent period ends for
such techniques there would be a revolutionary advancement in the formulation of poorly
water-soluble drugs.
1.6 Profiles of selected drugs
1.6A Candesartan Cilexetil BP/USP
1.6A.1 Molecular formula [81]: C33H34N6O6
1.6A.2 Molecular weight [81]: 610.66g/mol
1.6A.3 Chemical name [82]
It is ester prodrug hydrolyzed in-vivo to the active carboxylic acid. Cyclohexyl carbonate
ester of (±)-1-hydroxyethyl 2-ethoxy-1-[p-(o-1H-tetrazole-5-yl-phenyl) benzyl]-7-
benzimidazole carboxylate.
1.6A.4 Chemical structure [83]
FIGURE 1.2: Chemical structure of candesartan cilexetil
1.6A.5 Description [81]
It is colorless crystal obtained from ethanol-water with melting point 163°C. It is white to
off-white powder.

CHAPTER 1 INTRODUCTION
30
1.6A.6 Solubility [81]
It is practically insoluble in water, sparingly soluble in methanol
1.6A.7 Category [81]
Angiotensin-II receptor antagonists
1.6A.8 Indication [81]
It is indicated for hypertension; heart failure with impaired left the ventricular systolic
function in conjunction with an ACE inhibitor, or when ACE inhibitors are not tolerated.
1.6A.9 Dose [83]
Hypertension, initially 8 mg (hepatic impairment 2 mg, renal impairment or intravascular
volume depletion 4 mg) once daily, increased if necessary at intervals of 4 weeks to
maximum up to 32 mg once daily; usual maintenance dose 8 mg once daily.
Heart failure, initially 4 mg once daily, increased at intervals of at least 2 weeks to
‘target’ dose of 32 mg once daily or to the maximum tolerated dose.
1.6A.10 Pharmacokinetics [84]
Absorption: Candesartan cilexetil is an ester prodrug that is hydrolyzed during
absorption from the gastrointestinal tract to the active form candesartan.
Bioavailability: The absolute bioavailability for candesartan is about 40% when
candesartan cilexetil is given as a solution and about 14% when given as tablets.
Tmax: Peak plasma concentrations of candesartan occur about 3 to 4 hours after oral
doses as tablets.
Plasma protein binding: Candesartan is more than 99% bound to plasma proteins.
Excretion: It is excreted in urine and bile mainly as unchanged drug and a few
inactive metabolites.
Terminal elimination half-life: about 9 hours.
Candesartan is not removed by hemodialysis.

CHAPTER 1 INTRODUCTION
31
1.6A.11 Adverse effects
Vertigo, headache; very rarely nausea, hepatitis, blood disorders, hyponatremia, back pain,
arthralgia, myalgia, rash, urticaria, pruritus. Adverse effects of candesartan have been
reported to be usually mild and transient, and include dizziness, headache, and dose-related
orthostatic hypotension. Impaired renal function and rarely, rash, urticaria, pruritus,
angioedema and raised liver enzyme values may occur. Candesartan appears less likely
than ACE inhibitors to cause a cough. Other adverse effects that have been reported with
angiotensin-II receptor antagonists include respiratory-tract disorders, back pain,
gastrointestinal disturbances, fatigue, and neutropenia. Rhabdomyolysis has been reported
rarely.
1.6A.12 Uses and administration [85–92]
Candesartan is an angiotensin-II receptor antagonist with anti-hypertensive activity mainly
due to selective blockade of AT1 receptors and the consequently reduced pressure effect of
angiotensin-II. It is used in the management of hypertension, particularly in patients who
develop a cough with ACE inhibitors and to reduce the risk of stroke in patients with left
ventricular hypertrophy and in the treatment of diabetic nephropathy. It has also been tried
in heart failure and in myocardial infarction. The maximum hypotensive effect is achieved
in about 3 to 6 weeks after starting treatment.
Candesartan is given orally as the ester prodrug candesartan cilexetil. The onset of anti-
hypertensive action occurs about 2 hours after a dose and the maximum effect is achieved
within about 4 weeks of starting therapy. In the management of hypertension, the usual
initial dose of candesartan cilexetil is 8 mg once daily in the UK or 16 mg once daily in the
USA. The dose should be adjusted according to response; the usual maintenance dose is 8
mg once daily, but doses up to 32 mg daily, as a single dose or in 2 divided doses, may be
used. Lower initial doses should be considered in patients with intravascular volume
depletion; in the UK an initial dose of 4 mg once daily is suggested. Patients with a renal
or hepatic impairment may also require lower initial doses. In heart failure, candesartan
cilexetil is given in an initial dose of 4 mg once daily; the dose should be doubled at
intervals of not less than two weeks up to 32 mg once daily if tolerated.

CHAPTER 1 INTRODUCTION
32
1.6A.13 Marketed formulations
Table 1.3: Marketed formulations of candesartan cilexetil
Drug
Name
Brand
Name
Dosage
Form
Company Name Dose of Drug
Candesartan
Cilexetil
Creanz 16 Tablet Sava Medica Pvt. Ltd. 16 mg
Atacand Tablet AstraZeneca
Pharmaceuticals
4 mg / 8 mg / 16 mg
Candelong Tablet Micro Cardicare 4 mg / 8 mg / 16 mg
Candesar Tablet Ranbaxy 4 mg / 8 mg
Candestan Tablet Medley 4 mg / 8 mg
Cantar Tablet Dr. Reddy’s 4 mg / 8 mg
Ipsita Tablet Bal Pharma 4 mg / 8 mg / 16 mg
1.6B Telmisartan BP/USP
1.6B.1 Molecular formula [93]: C33H30N4O2
1.6B.2 Molecular weight [93]: 514.62 gm/mol
1.6B.3 Chemical name [94]
Chemically Telmisartan is 4’-[(1,4’-Dimethyl-2’-propyl[2,6’-bi-1H-benzimidazol]-
1’yl)methyl][1,1’-biphenyl]-2-carboxylic acid; 4’-[[4-methyl-6-(1-methyl-2-
benzimidazoyl)-2-propyl-1-benzimidazoyl] methyl]-2- biphenyl carboxylic acid.
1.6B.4 Chemical structure [95]
FIGRUE 1.3: Chemical structure of telmisartan

CHAPTER 1 INTRODUCTION
33
1.6B.5 Description [93]
It is a white or slightly yellowish, crystalline powder. It exhibits polymorphism. It has a
melting range of 261-263°C.
1.6B.6 Solubility [93]
It is practically insoluble in water (pH 3-9), sparingly soluble in strong acid (except
insoluble hydrochloric acid), soluble in strong base. It shows slight solubility in methyl
alcohol and it is sparingly soluble in dichloromethane.
1.6B.7 Category [93]
Angiotensin- II receptor antagonists
1.6B.8 Indication [95]
It is indicated for hypertension.
1.6B.9 Dose [95]
40 mg once daily (but 20 mg may be sufficient), increased if necessary after at least 4
weeks, to maximum 80 mg once daily.
1.6B.10 Pharmacokinetics [96]
Absorption: Telmisartan is rapidly absorbed from the gastrointestinal tract;
Bioavailability: The absolute oral bioavailability is dose-dependent and is about
42% after a 40-mg dose and 58% after a 160-mg dose.
Tmax: Peak plasma concentration of telmisartan is reached about 0.5 to 1 hour after
an oral dose.
Plasma protein binding: Telmisartan is over 99% bound to plasma proteins.
Excretion: It is excreted almost entirely in the feces via bile, mainly as unchanged
drug.
Terminal elimination half-life: about 24 hours for telmisartan.

CHAPTER 1 INTRODUCTION
34
1.6B.11 Adverse effects and precautions [97][98]
Gastro-intestinal disturbances; chest pain; influenza-like symptoms including pharyngitis
and sinusitis; urinary tract infection; arthralgia, myalgia, back pain, leg cramps; eczema;
less commonly dry mouth, flatulence, anxiety, vertigo, tendinitis-like symptoms, abnormal
vision, increased sweating; rarely bradycardia, tachycardia, dyspnoea, insomnia,
depression, blood disorders, increase in uric acid, eosinophilia, rash and pruritus; syncope
and asthenia also reported.
Adverse effects of telmisartan have been reported to be usually mild and transient, and
include dizziness, headache, and dose-related orthostatic hypotension. Hypotension may
occur particularly in patients with volume depletion (for example those who have received
high dose diuretics). Impaired renal function and rarely, rash, urticaria, pruritus,
angioedema and raised liver enzyme values may occur. Hyperkalaemia, myalgia, and
arthralgia have been reported. Telmisartan appears less likely than ACE inhibitors to cause
a cough. Other adverse effects that have been reported with angiotensin-II receptor
antagonists include respiratory-tract disorders, back pain, gastrointestinal disturbances,
fatigue, and neutropenia. Rhabdomyolysis has been reported rarely. Telmisartan should be
used with caution in patients with hepatic impairment or biliary obstruction.
1.6B.12 Uses and administration [99–104]
Telmisartan is an angiotensin-II receptor antagonist with anti-hypertensive activity mainly
due to selective blockade of AT1 receptors and the consequently reduced pressure effect of
angiotensin-II. It is used in the management of hypertension, particularly in patients who
develop a cough with ACE inhibitors and to reduce the risk of stroke in patients with left
ventricular hypertrophy and in the treatment of diabetic nephropathy. It has also been tried
in heart failure and in myocardial infarction. The maximum hypotensive effect is achieved
in about 3 to 6 weeks after starting treatment.
Telmisartan is given orally. After a dose, the hypotensive effect peaks within 3 hours and
persists for at least 24 hours. The maximum hypotensive effect occurs within about 4 to 8
weeks after starting therapy. In hypertension, telmisartan is given in an initial dose of 40
mg once daily. This may be increased, if necessary, to a maximum dose of 80 mg once
daily. Lower doses should be considered in patients with hepatic or renal impairment.

CHAPTER 1 INTRODUCTION
35
1.6B.13 Marketed formulations
TABLE 1.4: Marketed formulations of telmisartan
Drug Name Brand Name Dosage Form Company Name Dose of Drug
Telmisartan Inditel Tablet Zydus Cadila 40 mg / 80 mg
A2B Tablet Fidelity 40 mg
Adcom Tablet Intel Pharma 40 mg
Angitel Tablet Molekule 40 mg / 80 mg
Anzitel Tablet Essweil 40 mg
Arbitel Tablet Micro Cardicare 20 mg / 40 mg
Astel Tablet AS Pharma 20 mg / 40 mg
1.6C Ziprasidone Hydrochloride Monohydrate BP/USP
1.6C.1 Molecular formula [105]: C21H22Cl2N4OS. H2O
1.6C.2 Molecular weight [105]: 467.4 gm/mol
1.6C.3 Chemical name [105]:
Ziprasidone hydrochloride monohydrate is chemically 5-[2-[4-(1, 2-Benzisothiazol-3-yl)
piperazin-1-yl] ethyl]-6-chloro-1, 3-dihydro-2H-indol-2-one hydrochloride monohydrate.
1.6C.4 Chemical structure [106]:
FIGURE 1.4: Chemical structure of ziprasidone hydrochloride monohydrate
1.6C.5 Description [105]
It is a white or slightly pink powder. It shows polymorphism.

CHAPTER 1 INTRODUCTION
36
1.6C.6 Solubility [105]
It is practically insoluble in water, slightly soluble in methanol and in methylene chloride
1.6C.7 Category [105]
It is an atypical antipsychotic drug.
1.6C.8 Indication [106]
It is indicated for the treatment of schizophrenia, as monotherapy for the acute treatment of
bipolar manic or mixed episodes and as an adjunct to lithium or valproate for the
maintenance treatment of bipolar disorder.
1.6C.9 Dose [107]
It is administered at an initial daily dose of 20 mg twice daily with food. In some patients,
daily dosage may subsequently be adjusted on the basis of individual clinical status up to
80 mg twice daily.
1.6C.10 Pharmacokinetics [107–109]
Absorption: Ziprasidone is well absorbed from the gastrointestinal tract with peak
plasma concentrations being reached 6 to 8 hours after oral doses. The presence of
food may double the absorption. Following intramuscular injection, peak plasma
concentrations are reached within 1 hour.
Plasma protein binding: It is about 99%.
Metabolism: Ziprasidone is extensively metabolized by aldehyde oxidase (about
66% of a dose) and by the cytochrome P450 isoenzyme CYP3A4.
Terminal elimination half-life: It has been reported to be about 7 hours after oral
dosage and about 2 to 5 hours after intramuscular dosage.
Excretion: Ziprasidone is excreted mainly as metabolites in the feces (about 66%)
and urine (about 20%); less than 5% of a dose appears as unchanged drug.
1.6C.11 Adverse effects and precautions
Frequent adverse effects of ziprasidone include somnolence, rash or urticaria,
gastrointestinal disturbances, dizziness, flu-like symptoms, hypertension, headache,

CHAPTER 1 INTRODUCTION
37
agitation, confusion, and dyspnoea. Orthostatic hypotension may be a problem, particularly
when starting treatment.
Ziprasidone may increase prolactin levels and weight gain has also been noted. Sexual
dysfunction has been reported infrequently. Extrapyramidal symptoms may occur and
tardive dyskinesia may develop with prolonged use. There have also been infrequent or
rare cases of cholestatic jaundice, hepatitis, seizures and blood dyscrasias including
leucopenia and thrombocytopenia, and hyperlipidemia. Hyperglycemia occurs
uncommonly with ziprasidone. Clinical monitoring for hyperglycemia has been
recommended, especially in patients with, or at risk of, developing diabetes.
Ziprasidone has been associated with dose-related prolongation of the QT interval.
Because of this and the consequent danger of life-threatening arrhythmias such as torsade
de pointes and sudden death, its use is contraindicated in patients with a history of QT
prolongation or cardiac arrhythmias, with recent acute myocardial infarction, or with
decompensated heart failure. Baseline serum potassium and magnesium screening should
be performed in patients who are at risk of significant electrolyte disturbances and
hypokalemia or hypomagnesemia should be corrected before starting ziprasidone therapy.
Serum electrolytes should be monitored in patients who start diuretic therapy during
ziprasidone treatment.
Ziprasidone should be used with caution in patients with a history of seizures or in
conditions that lower the seizure threshold, cardiovascular or cerebrovascular disease, or
conditions which predispose to hypotension. Since intramuscular injections are formulated
with cyclodextrin, which is cleared by renal filtration, the manufacturer recommends
caution in patients with renal impairment. Ziprasidone may affect the performance of
skilled tasks including driving.
3.12 Uses and administration
Ziprasidone is an atypical antipsychotic reported to have an affinity for adrenergic (α1),
histamine (H1) and serotonin (5-HT2) receptors as well as dopamine (D2) receptors. It is
used for the treatment of schizophrenia and in acute manic or mixed episodes associated
with bipolar disorder. Ziprasidone is given by mouth usually as the hydrochloride; it is also
given parenterally as the mesilate. Doses are expressed in terms of the base; ziprasidone

CHAPTER 1 INTRODUCTION
38
hydrochloride 11.3 mg or ziprasidone mesylate 13.6 mg are each equivalents to about 10
mg of ziprasidone.
For the treatment of schizophrenia, ziprasidone hydrochloride is given in an initial oral
dose of 20 mg twice daily with food. Doses may be increased if necessary at intervals of
not less than 2 days up to 80 mg twice daily. For maintenance, doses as low as 20 mg twice
daily may be effective.
For acute agitation in patients with schizophrenia, ziprasidone may be given as the
mesilate by intramuscular injection. The recommended dose is 10 to 20 mg as required, up
to a maximum of 40 mg daily for 3 consecutive days. Doses of 10 mg may be given every
2 hours and doses of 20 mg may be given every 4 hours. Patients should be switched to
oral therapy as soon as possible.
For the treatment of mania, ziprasidone hydrochloride is given in an initial oral dose of 40
mg twice daily with food. The dose should be increased to 60 or 80 mg twice daily on the
second day of treatment and subsequently adjusted according to tolerance.
1.6C.13 Marketed formulations
TABLE 1.5: Marketed formulations of ziprasidone hydrochloride
Drug Name Brand Name Dosage Form Company Name Dose of Drug
Ziprasidone
Hydrochloride
Zipsydon Capsules Sun Pharma 20 mg /40 mg /
60 mg/ 80 mg
Geodon Capsules Pfizer 20 mg /40 mg /
60 mg/ 80 mg
Ziprasidone
Hydrochloride
Capsules
Capsules Apotex Worldwide 60 mg

CHAPTER 1 INTRODUCTION
39
1.7 Profile of excipients
1.7A Polyvinyl Alcohol USP [110]
1.7A.1 Structural formula
FIGURE 1.5: Structural formula of polyvinyl alcohol
1.7A.2 Description
Polyvinyl alcohol occurs as an odorless, white to cream-colored granular powder.
1.7A.3 Functional category
Coating agent, lubricant, stabilizing agent, viscosity-increasing agent.
1.7A.4 Applications in pharmaceutical formulation or technology
It is used as a stabilizing agent for emulsions (0.25–3.0% w/v).
Polyvinyl alcohol is also used as a viscosity-increasing agent for viscous formulations
such as ophthalmic products.
It is used in artificial tears and contact lens solutions for lubrication purposes, in
sustained release formulations for oral administration, and in transdermal patches.
Polyvinyl alcohol may be made into microspheres when mixed with a glutaraldehyde
solution.
1.7A.5 Regulatory status
It is included in the FDA Inactive Ingredients Guide, in non-parenteral medicines
licensed in the UK and in the Canadian List of Acceptable Non-medicinal Ingredients.
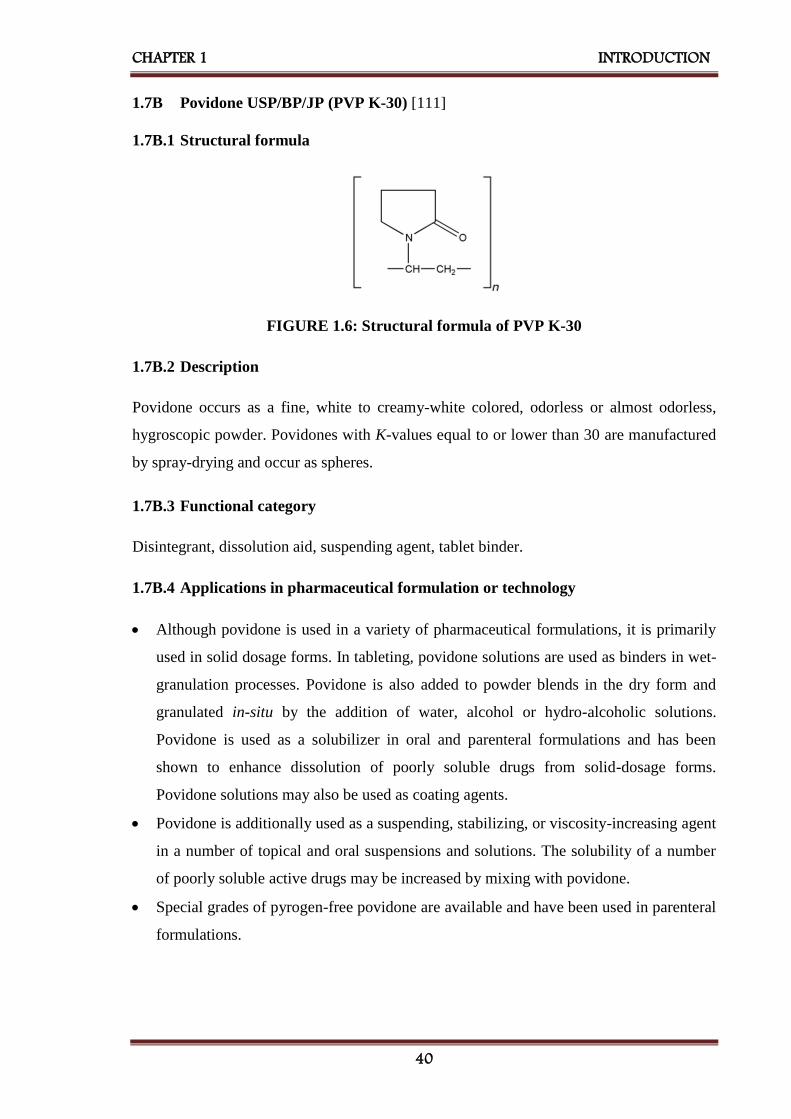
CHAPTER 1 INTRODUCTION
40
1.7B Povidone USP/BP/JP (PVP K-30) [111]
1.7B.1 Structural formula
FIGURE 1.6: Structural formula of PVP K-30
1.7B.2 Description
Povidone occurs as a fine, white to creamy-white colored, odorless or almost odorless,
hygroscopic powder. Povidones with K-values equal to or lower than 30 are manufactured
by spray-drying and occur as spheres.
1.7B.3 Functional category
Disintegrant, dissolution aid, suspending agent, tablet binder.
1.7B.4 Applications in pharmaceutical formulation or technology
Although povidone is used in a variety of pharmaceutical formulations, it is primarily
used in solid dosage forms. In tableting, povidone solutions are used as binders in wet-
granulation processes. Povidone is also added to powder blends in the dry form and
granulated in-situ by the addition of water, alcohol or hydro-alcoholic solutions.
Povidone is used as a solubilizer in oral and parenteral formulations and has been
shown to enhance dissolution of poorly soluble drugs from solid-dosage forms.
Povidone solutions may also be used as coating agents.
Povidone is additionally used as a suspending, stabilizing, or viscosity-increasing agent
in a number of topical and oral suspensions and solutions. The solubility of a number
of poorly soluble active drugs may be increased by mixing with povidone.
Special grades of pyrogen-free povidone are available and have been used in parenteral
formulations.

CHAPTER 1 INTRODUCTION
41
1.7B.5 Regulatory status
It is included in the FDA Inactive Ingredients Guide, in non-parenteral medicines
licensed in the UK, in the Canadian List of Acceptable Non-medicinal Ingredients.
1.7C Sodium Lauryl Sulphate USP/BP/JP [112]
1.7C.1 Structural formula
FIGURE 1.7: Structural formula of sodium lauryl sulfate
1.7C.2 Description
Sodium lauryl sulfate consists of white or cream to pale yellow-colored crystals, flakes, or
powder having a smooth feel, a soapy, bitter taste, and a faint odor of fatty substances.
1.7C.3 Functional category
Anionic surfactant, detergent, emulsifying agent, skin penetrant, tablet and capsule
lubricant, wetting agent.
1.7C.4 Applications in pharmaceutical formulation or technology
Sodium lauryl sulfate is an anionic surfactant employed in a wide range of non-
parenteral pharmaceutical formulations and cosmetics.
It is a detergent and wetting agent effective in both alkaline and acidic conditions.
In recent years it has found application in analytical electrophoretic techniques: SDS
(sodium dodecyl sulfate) polyacrylamide gel electrophoresis is one of the more widely
used techniques for the analysis of proteins, and sodium lauryl sulfate has been used to
enhance the selectivity of micellar electrokinetic chromatography (MEKC).

CHAPTER 1 INTRODUCTION
42
1.7C.5 Regulatory status
GRAS listed, also included in the FDA Inactive Ingredients Guide, in non-parenteral
medicines licensed in the UK, in the Canadian List of Acceptable Non-medicinal
Ingredients.
1.7D Poloxamer USPNF/BP (Poloxamer 188 and Poloxamer 407)[113]
1.7D.1 Structural formula
FIGURE 1.8: Structural formula of poloxamer
1.7D.2 Description
Poloxamers generally occur as white, waxy, free-flowing prilled granules, or as cast solids.
They are practically odorless and tasteless.
1.7D.3 Functional category
Dispersing agent, emulsifying and co-emulsifying agent, solubilizing agent, tablet
lubricant, wetting agent.
1.7C.4 Applications in pharmaceutical formulation or technology
Poloxamers are non-ionic polyoxyethylene–polyoxypropylene copolymers used
primarily in pharmaceutical formulations as emulsifying or solubilizing agents.
The polyoxyethylene segment is hydrophilic while the polyoxypropylene segment is
hydrophobic. All of the poloxamers are chemically similar in composition, differing
only in the relative amounts of propylene and ethylene oxides added during
manufacture. Their physical and surface-active properties vary over a wide range and a
number of different types are commercially available.
Poloxamers are used as emulsifying agents in intravenous fat emulsions, and as
solubilizing and stabilizing agents to maintain the clarity of elixirs and syrups.

CHAPTER 1 INTRODUCTION
43
Poloxamers may also be used as wetting agents; in ointments, suppository bases, and
gels and as tablet binders and coatings.
Poloxamer 188 has also been used as an emulsifying agent for fluorocarbons used as
artificial blood substitutes and in the preparation of solid-dispersion systems. More
recently, poloxamers have found use in drug-delivery systems.
Therapeutically, poloxamer 188 is administered orally as a wetting agent and stool
lubricant in the treatment of constipation. It is usually used in combination with a
laxative such as danthron.
Poloxamers may also be used therapeutically as wetting agents in eye-drop
formulations, in the treatment of kidney stones, and as skin-wound cleansers.
Poloxamer 407 is used in solutions for contact lens care.
1.7D.5 Regulatory status
Included in the FDA Inactive Ingredients Guide, in non-parenteral medicines licensed
in the UK, in the Canadian List of Acceptable Non-medicinal Ingredients.
1.8 Aim and objectives
Bioavailability enhancement is nowadays a great challenge to the pharmaceutical
industries. The drug specifically from BCS class II and IV are always considered to have a
dissolution rate limited bioavailability. Various approaches have been used to enhance the
rate of dissolution of such types of drugs in order to get better bioavailability.
Nanosuspension is one of those approaches which can tremendously enhance the effective
surface area of drug particles as well as shows vapor pressure effect and thereby increases
the rate of dissolution and hence bioavailability.
Telmisartan and candesartan cilexetil, antihypertensive agents - angiotensin II inhibitors as
well as ziprasidone hydrochloride monohydrate, an atypical antipsychotic drug are BCS
class II drugs which are poorly soluble in water. Hence, dissolution is a rate-limiting step
for enhancement of bioavailability of selected drugs. Reported bioavailability of
candesartan cilexetil, telmisartan and ziprasidone hydrochloride is 40%, 42%, 60%
respectively.

CHAPTER 1 INTRODUCTION
44
Various techniques like liposomes, microemulsions, solid-dispersions and inclusion
complexes using cyclodextrins have been utilized for improving the dissolution
characteristics of BCS class-II drugs, but the application of novel drug delivery strategy for
improving their dissolution characteristics is still lacking. Hence there is a need for the
development of a drug delivery strategy applicable to BCS class-II drugs for improving
dissolution characteristics. Novel drug delivery strategies such as nanosuspensions could
be studied for dissolution enhancement of such drugs. A nanosuspension is a submicron
colloidal dispersion of drug particles which are stabilized by stabilizers.
Hence, the aim of present work is to prepare lyophilized nanosuspension of poorly water-
soluble drugs by antisolvent precipitation – ultrasonication method. For convenience in
handling dosage form, the lyophilized product shall be converted to the solid unit dosage
form.
1.8.1 Complete hierarchy of work
Preformulation study of selected drugs. eg. drug - excipient compatibility study
Scanning and calibration curve preparation of selected drugs.
Selection of solvents and stabilizer for the formulation of nanosuspension.
Preparation of nanosuspension by antisolvent precipitation followed by ultrasonication
technique from selected drugs.
Identification of key factors affecting the formulation of nanosuspension by Plackett-
Burman design of experiments.
Optimization of nanosuspension formulation by 32 factorial design.
Characterization of developed nanosuspension formulation by various physicochemical
parameters as well as analytical techniques.
Study of in-vitro drug release profile of optimized formulation and comparison of it
with un-milled suspension and marketed formulation.
Performance of accelerated stability studies of the optimized formulation according to
ICH guidelines.
Performance of bioavailability study of optimized formulation and comparison with the
marketed formulation.
Bioavailability and dose reduction calculation of selected drugs by converting into
nanosuspension to have the same effect as of marketed formulation.

CHAPTER 1 INTRODUCTION
45
1.9 References
1. Makoid CM, Vuchetich PJ, Banakar UV (1999) Basic Pharmacokinetics. 1st Edition.
The Virtual University Press.
2. Aulton ME (2007) Pharmaceutics - The Science and Dosage Form Design. 2nd Edition.
Churchill Livingstone, New York.
3. Chow SC and Liu JP (2009) Design and Analysis of Bioavailability and
Bioequivalence Studies. 3rd Edition. CRC Press, Taylor and Francis Group, Boca
Raton.
4. Russell TL, Berardi RR, Burnet JL, O’Sullivan TL, Wagner JG and Dressman JB,
1994, pH-related changes in the absorption of Dipyridamole in the elderly,
Pharmaceutical Research, 11(1), 136-143, ISSN: 1573-904X.
5. Lipinski CA, 2001, Avoiding investment in doomed drugs, is poor solubility an
industry-wide problem? Current Drug Discovery, 4, 17-19.
6. Noyes AA, Whitney WR, 1897, The rate of solution of solid substances in their own
solutions, Journal of American Chemical Society, 19, 930–934, ISSN: 0002-7863.
7. Galia E, Nicolaides E, Horter D, Lobenberg R, Reppas C and Dressman JB, 1998,
Evaluation of various dissolution media for predicting in vivo performance of class I
and II drugs, Pharmaceutical Research, 15(5), 698-705, ISSN: 1573-904X.
8. Sravana Lakshmi M, Srivalli Kumari P, and Rajeev Kumar T, 2012, A Novel
Approach for Improvement of Solubility and Bioavailability of Poorly Soluble Drugs:
Liquisolid Compact Technique, International Journal of Research in Pharmaceutical
and Biomedical Sciences, 3(4), 1621-1632, ISSN: 2229-3701.
9. Stovall DM, Givens C, Keown S, Hoover KR, Barnes R, Harris C, Lozano J, Nguyen
M, Rodriguez E, Acree WE and Abraham MH, 2005, Solubility of crystalline
nonelectrolyte solutes in organic solvents: mathematical correlation of 4-chloro-3-
nitrobenzoic acid and 2-chloro-5-nitrobenzoic acid solubilities with the Abraham
solvation parameter model, Physics and Chemistry of Liquids, 43, 351–360, ISSN:
0031-9104.
10. Makhlof A, Miyazaki Y, Tozuka Y and Takeuchi H, 2008, Cyclodextrins as stabilizers
for the preparation of drug nanocrystals by the emulsion solvent diffusion method,
International Journal of Pharmaceutics, 357(1-2), 280–285, ISSN: 0378-5173.
11. Park YJ (2014) Revaprazan-containing solid dispersion and process for the
preparation thereof, European Patent EP 2101737B1.
CHAPTER 1 INTRODUCTION
46
12. Tao T, Zhao Y, Wu J and Zhou B, 2009, Preparation and evaluation of Itraconazole
dihydrochloride for the solubility and dissolution rate enhancement, International
Journal of Pharmaceutics, 367(1-2), 109–114, ISSN: 0378-5173.
13. Liversidge GG and Conzentino P, 1995, Drug particle size reduction for decreasing
gastric irritancy and enhancing absorption of naproxen in rats, International Journal of
Pharmaceutics, 125(2), 309–313, ISSN: 0378-5173.
14. Muller RH, Jacobs C and Kayer O (2000) Nanosuspensions for the formulation of
poorly soluble drugs. In: F Nielloud, G Marti- Mestres (ed). Pharmaceutical emulsion
and suspension, Marcel Dekker, New York, pp. 383-407.
15. Müller RH and Peters K, 1998, Nanosuspensions for the formulation of poorly soluble
drug I: Preparation by size reduction technique, International Journal of Pharmaceutics,
160(2), 229-237, ISSN: 0378-5173.
16. Nagaraju P, Krishnachaithanya K, Srinivas VDN and Padma SVN, 2010,
Nanosuspensions: Promising Drug Delivery Systems, International Journal of
Pharmaceutical Sciences and Nanotechnology, 2(4), 679-684, ISSN: 0974-3278.
17. Dhiman S and Thakur GS, 2011, Nanosuspension: A recent approach for nano drug
delivery system, International Journal of Current Pharmaceutical Research, 3(4), 96-
101, ISSN: 0975-7066.
18. Chandra A, Soni RK, Sharma U and Jain SK, 2013, Nanosuspension: an Overview,
Journal of Drug Delivery and Therapeutics, 3(6), 162-167, ISSN: 2250-1177.
19. Patravale VB, Date AA, and Kulkarni RM, 2004, Nanosuspension: a promising drug
delivery strategy, Journal of Pharmacy and Pharmacology, 56(7), 827-840, ISSN:
2042-7158.
20. Rabinow BE, 2004, Nanosuspensions in drug delivery, Nature Reviews Drug
Discovery, 3, 785-796, ISSN: 1474-1776.
21. Wongmekiat A, Tozuka Y, Oguchi T and Yamamoto K, 2002, Formation of fine drug
particles by co-grinding with cyclodextrin. I. the use of β-cyclodextrin anhydrate and
hydrate, Pharmaceutical Research, 19(12), 1867-1872, ISSN: 1573-904X.
22. Itoh K, Pongpeerapat A, Tozuka Y, Oguchi T and Yamamoto K, 2003, Nanoparticle
formation of poorly water-soluble drugs from ternary ground mixtures with PVP and
SDS, Chemical and Pharmaceutical Bulletin, 51(2), 171-174, ISSN: 1347-5223.
23. Mura P, Cirri M, Faucci MT, Ginès-Dorado JM and Bettinetti GP, 2002, Investigation
of the effects of grinding and co-grinding on physicochemical properties of glisentide,
Journal of Pharmaceutical and Biomedical Analysis, 30(2), 227-237, ISSN: 0731-7085.
CHAPTER 1 INTRODUCTION
47
24. Mura P, Faucci MT, and Bettinetti GP, 2001, The influence of polyvinylpyrrolidone on
naproxen complexation with hydroxyl propyl-β-cyclodextrin, European Journal of
Pharmaceutical Sciences, 13(2), 187-194, ISSN: 0928-0987.
25. Otsuka M and MatsudaY, 1995, Effect of co-grinding with various kinds of surfactants
on the dissolution behavior of phenytoin, Journal of Pharmaceutical Sciences, 84(12),
1434-1437, ISSN: 1520-6017.
26. Sugimoto M, Okagaki T, Narisawa S, Koida Y and Nakajima K, 1998, Improvement of
dissolution characteristics and bioavailability of poorly water-soluble drugs by novel
co-grinding method using water-soluble polymer, International Journal of
Pharmaceutics, 160(1), 11-19, ISSN: 0378-5173.
27. Yonemochi E, Kitahara S, Maeda S, Yamamura S, Oguchi T and Yamamoto K, 1999,
Physicochemical properties of amorphous clarithromycin obtained by grinding and
spray drying, European Journal of Pharmaceutical Sciences, 7(4), 331-338, ISSN:
0928-0987.
28. Watanabe T, Ohno I, Wakiyama N, Kusai A and Senna M, 2002, Stabilization of
amorphous indomethacin by co-grinding in a ternary mixture, International Journal of
Pharmaceutics, 241(1), 103-111, ISSN: 0378-5173.
29. Scholer N, Krause K, Kayser O, Muller RH, Borner K, Hahn H and Liesenfeld O,
2001, Atovaquone nanosuspensions show an excellent therapeutic effect in a new
murine model of reactivated toxoplasmosis, Antimicrobial Agents Chemotherapy,
45(6), 1771– 1779, ISSN: 1098-6596.
30. Venkatesh T, Reddy AK, Maheswari JU, Dalith MD and Kumar CKA, 2011,
Nanosuspensions: Ideal approach for the drug delivery of poorly water-soluble drugs,
Der Pharmacia Lettre, 3(2), 203-213, ISSN: 0975-508X.
31. Muller RH, Bohm BHL and Grau J (2000) Nanosuspensions: a formulation approach
for poorly soluble and poorly bioavailable drugs. In D. Wise (Ed.) Handbook of
pharmaceutical controlled release technology, Marcel Dekker Inc., New York, pp.
345- 357.
32. Jahnke S (1998) The theory of high-pressure homogenization. In: Muller RH, Benita S,
Bohm BHL, Emulsions and nanosuspensions for the formulation of poorly soluble
drugs, Medpharm Scientific Publishers, Stuttgart, pp. 177–200.
33. Kipp JE, Wong JCT, Doty MJ and Rebbeck CL (2003) Microprecipitation method for
preparing submicron suspensions, US Patent 6607784.

CHAPTER 1 INTRODUCTION
48
34. Zili Z, Sfar S and Fessi H, 2005, Preparation and characterization of poly-ε-
caprolactone nanoparticles containing griseofulvin, International Journal of
Pharmaceutics, 294(1-2), 261-267, ISSN: 0378-5173.
35. Patel VR and Agrawal YK, 2011, Nanosuspension: An approach to enhance the
solubility of drugs, Journal of Advanced Pharmaceutical Technology and Research,
2(2), 81-87, ISSN: 0976-2094.
36. Zhang X, Xia Q, and Gu N, 2006, Preparation of all-trans retinoic acid
nanosuspensions using a modified precipitation method, Drug Development and
Industrial Pharmacy, 32(7), 857-863, ISSN: 1520-5762.
37. Bodmeier R, McGinity JM, 1998, Solvent selection in the preparation of poly (DL-
lactide) microspheres prepared by a solvent evaporation method, International Journal
of Pharmaceutics, 43(1-2), 179–186, ISSN: 0378-5173.
38. Sah H, 1997, Microencapsulation technique using ethyl acetate as a dispersed solvent:
effects on its extraction rate on the characteristics of PLGA microspheres, Journal of
Controlled Release, 47(3), 233–245, ISSN: 0168-3659.
39. Sah H, 2000, Ethyl formate–alternative dispersed solvent useful in preparing PLGA
microspheres, International Journal of Pharmaceutics, 195(1-2), 103–113, ISSN: 0378-
5173
40. Trotta M, Gallarate M, Pattarino F and Morel S, 2001, Emulsions containing partially
water-miscible solvents for the preparation of drug nanosuspensions, Journal of
Controlled Release, 76(1-2), 119–128, ISSN: 0168-3659.
41. Eccleston GM (1992) Microemulsions. In: Swarbrick S, Boylan CJ, (eds) Encyclopedia
of pharmaceutical technology, Vol.9, Marcel Dekker Inc., New York, pp 375–421.
42. C. Francesco and L. Francesco, 2011, New Methods for Lipid Nanoparticles
Preparation, Recent Patents on Drug Delivery and Formulation, 5(3), 201-213,
ISSN: 2212-4039.
43. Watnasirichaikul S, Rades T, Tucker IG and Davies NM, 2002, Effects of formulation
variables on characteristics of poly (ethyl cyanoacrylates) nanocapsules prepared from
w/o micro-emulsions, International Journal of Pharmaceutics, 235(1-2), 237– 246,
ISSN: 0378-5173.
44. Trotta M, Gallarate M, Carlotti ME and Morel S, 2003, Preparation of Griseofulvin
nanoparticles from water-dilutable microemulsions, International Journal of
Pharmaceutics, 254(2), 235–242, ISSN: 0378-5173.

CHAPTER 1 INTRODUCTION
49
45. Kamble VA, Jagdale DM and Kadam VJ, 2010, Nanosuspension a novel drug delivery
system, International Journal of Pharma Biological Sciences, 1(4), 352-360, ISSN:
0975-6299.
46. Allen T (2004) Particle Size Measurement, 5th Edition, Springer, London.
47. Shanthakumar TR, Prakash S, Basavraj RM, Ramesh M, Kant R, Venkatesh P, Rao K,
Singh S and Srinivas NR (2004) ‘Comparative pharmacokinetic data of DRF-4367
using nanosuspension and HP-β-CD formulation’, Proceedings of the International
Symposium on Advances in Technology and Business Potential of New Drug Delivery
Systems, Mumbai, pp. 75.
48. Hunter RJ (2001) Foundations of Colloid Science. 2nd Edition, Oxford University
Press, New York.
49. Banavath H, Sivaramaraju K, Tahiransari MD, Sajidali MD and Pattnaik G, 2010,
Nanosuspension: an attempt to enhance bioavailability of poorly soluble drugs,
International Journal of Pharmaceutical Sciences and Research, 1(9), 1-11, ISSN:
0975-8232.
50. Gao L, Zhang D, and Chen M, 2008, Drug nanocrystals for the formulation of poorly
soluble drugs and its application as a potential drug delivery system, Journal of
Nanoparticulate Research, 10(5), 845-862, ISSN: 1388-0764.
51. Prasanna L and Giddam AK, 2010, Nanosuspension technology: A review,
International Journal of Pharmacy and Pharmaceutical Sciences, 2(4), 35-40, ISSN:
0975 – 1491.
52. D’Souza S, 2014, A review of in-vitro drug release test methods for nano-sized dosage
forms, Advances in Pharmaceutics, Volume 2014, 1-12, ISSN: 2314-775X.
53. Blunk T, Hochstrasser DF, Sanchez JC and Muller BW, 1993, Colloidal carriers for
intravenous drug targeting: Plasma protein adsorption patterns on surface-modified
latex particles evaluated by two-dimensional polyacrylamide gel electrophoresis,
Electrophoresis, 14(12), 1382–1387, ISSN: 1522-2683.
54. Faiyazuddin M, Ahmad S, Mustafa G, Ahmad FJ and Shakeel F, 2010, Bioanalytical
approaches, bioavailability assessment, and bioequivalence study for waiver drugs: In-
vivo and in-vitro perspective, Clinical Research and Regulatory Affairs, 27(2), 1–10,
ISSN: 1060-1333.
55. Shargel L and Yu ABC (2005) Applied biopharmaceutics and pharmacokinetics, 5th
Edition, McGraw-Hill Companies Inc; New York, USA.
CHAPTER 1 INTRODUCTION
50
56. Blum HH and Schug BS, 1999, The biopharmaceutics classification system (BCS):
class III drugs better candidates for BA/BE waiver? European Journal of
Pharmaceutical Sciences, 9(2), 117–121, ISSN: 0928-0987.
57. Ansel HC (1985) Introduction to pharmaceutical dosage forms. Philadelphia, PA: Lea
and Febiger.
58. Merisko LE, Sarpotdar P, Bruno J, Hajj S, Wei L, Peltier N, Rake J, Shaw JM, Pugh S,
Polin L, Jones J, Corbett T, Cooper E and Liversidge GG, 1996, Formulation and anti-
tumor activity evaluation of nanocrystalline suspensions of poorly soluble anti-cancer
drugs, Pharmaceutical Research, 13(2), 272–278, ISSN: 1573-904X.
59. Dandagi P, Kerur S, Mastiholimath V, Gadad A and Kulkarni A, 2009, Polymeric
ocular nanosuspension for controlled release of acyclovir: in-vitro release and ocular
distribution, Iranian Journal of Pharmaceutical Research, 8(2), 79-86, ISSN: 1735-
0328.
60. Kassem MA, Abdul Rahman AA, Ghorab MM, Ahmed MB and Khalil RM, 2007,
Nanosuspension as an ophthalmic delivery system for certain glucocorticoid drugs,
International Journal of Pharmaceutics, 340(1-2),126-33, ISSN: 0378-5173.
61. Pignatello R, Bucolo C, Spedalieri G, Maltese A and Puglisi G, 2002a, Flurbiprofen-
loaded acrylate polymer nanosuspensions for ophthalmic application, Biomaterials,
23(15), 3247–3255, ISSN: 0142-9612.
62. Bucolo C, Maltese A, Puglisi G and Pignatello R, 2002, Enhanced ocular anti-
inflammatory activity of ibuprofen carried by Eudragit RS100 nanoparticle suspension,
Ophthalmic Research, 34(5), 319–323, ISSN: 0030-3747.
63. Pignatello R, Bucolo C, Ferrara P, Maltese A, Puleo A and Puglisi G, 2002b, Eudragit
RS100 nanosuspensions for the ophthalmic controlled delivery of ibuprofen, European
Journal of Pharmaceutical Sciences, 16(1-2), 53–61, ISSN: 0928-0987.
64. Pignatello R, Bucolo C and Puglisi G, 2002c, Ocular tolerability of Eudragit RS100
and RL100 nanosuspensions as a carrier for ophthalmic controlled delivery, Journal of
Pharmaceutical Sciences, 91(12), 2636–2641, ISSN: 0928-0987.
65. Jacobs C and Muller RH, 2002b, Production and characterization of a budesonide
nanosuspension for pulmonary administration, Pharmaceutical Research, 19(2), 189–
194, ISSN: 1573-904X.
66. Ponchel G, Montisci MJ, Dembri A, Durrer C and Duchene D, 1997, Mucoadhesion of
colloidal particulate systems in the gastrointestinal tract, European Journal of
Pharmaceutics and Biopharmaceutics, 44(1), 25–31, ISSN: 0939-641.
CHAPTER 1 INTRODUCTION
51
67. Francesco L, Chiara S, Guido E, Francesc M, Giaime M and Anna MF, 2009,
Diclofenac nanosuspensions. Influence of preparation procedure and crystal form on
drug dissolution behavior, International Journal of Pharmaceutics, 373(1-2), 124–132,
ISSN: 0378-5173.
68. Hanafy A, Spahn‐Langguth HG, Vergnault G, Grenier P, Tubic Grozdanis M, Lenhardt
T and Langguth P, 2007, Pharmacokinetic evaluation of oral fenofibrate
nanosuspension and SLN in comparison to the conventional suspension of micronized
drug, Advanced Drug Delivery Reviews, 59(6), 419‐426, ISSN: 0169-409X.
69. Kayser O, Olbrich C, Yardley V, Kinderlen AF and Croft SL, 2003, Formulation of
amphotericin B as nanosuspension for oral administration, International Journal of
Pharmaceutics, 254(1), 73–75, ISSN: 0378-5173.
70. Muller RH and Jacobs C, 2002, Buparvaquone mucoadhesive nanosuspension:
preparation, optimization and long-term stability, International Journal of
Pharmaceutics, 237(1-2), 151-161, ISSN: 0378-5173.
71. Kayser O, 2001, A new approach for targeting to Cryptosporidium parvum using
mucoadhesive nanosuspensions: research and applications, International Journal of
Pharmaceutics, 214(1-2), 83-85, ISSN: 0378-5173.
72. Kohno S, Otsubo T, Tanaka E, Maruyama K and Hara K, 1997, Amphotericin B
encapsulated in polyethylene glycol immune-liposomes for infectious diseases,
Advanced Drug Delivery Reviews, 24(2-3), 325-329, ISSN: 0169-409X.
73. Kayser O, Lemke A and Hernandez TN, 2005, The impact of Nanobiotechnology on
the development of new drug delivery systems, Current Pharmaceutical Biotechnology,
6(1), 3-5, ISSN: 1873-4316.
74. Muller RH, Bohm BHL, and Grau MJ, 1999, Nanosuspensions- Formulations for
poorly soluble drugs with poor bioavailability / 2nd communication: Stability,
biopharmaceutical aspects, possible drug forms and registration aspects, Die
Pharmazeutische Industrie, 61(12), 175-178, ISSN: 0031-711X.
75. Shim J, Kang HS, Park WS, Han SH, Kim J and Chang IS, 2004, Transdermal delivery
of minoxidil with block copolymer nanoparticles, Journal of Controlled Release, 97(3),
477-484, ISSN: 0168-3659.
76. Kohli AK and Alpar HO, 2004, Potential use of nanoparticles for transcutaneous
vaccine delivery: Effect of particle size and charge, International Journal of
Pharmaceutics, 275(1-2), 13-17, ISSN: 0378-5173.

CHAPTER 1 INTRODUCTION
52
77. Yamaguchi Y, Nagasawa T, Nakamura N, Takenaga M, Mizoguchi M, Kawai SI,
Mizushima Y and Igarashi R, 2005, Successful treatment of photo-damaged skin of
nano-scale at RA particles using a novel transdermal delivery, Journal of Controlled
Release, 104(1), 29-40, ISSN: 0168-3659.
78. Chen X, Lo CY-L, Sarkari M, Williams III RO and Johnston KP, 2006, Ketoprofen
nanoparticle gels formed by evaporative precipitation into an aqueous solution, AIChE
Journal, 52(7), 2428-2435, ISSN: 1547-5905.
79. Eerdenbrugh BV, Mooter GV, and Augustijns P, 2008, Top-down production of drug
nanocrystals: Nanosuspension stabilization, miniaturization, and transformation into
solid products, International Journal of Pharmaceutics, 364(1), 64-75.
80. Mauludin R (2008) Nanosuspension of poorly soluble drugs for oral administration.
Ph.D. Thesis. The Free University of Berlin.
81. Anonymous (2015) Candesartan Cilexetil. In: British Pharmacopoeia, Vol. 1, British
Pharmacopoeia Commission Office, MHRA, London, pp. 393-395
82. Budvari S (1996) Candesartan Cilexetil. In: O’ Neil MJ, Heckelman PE, Koch CB,
Roman KJ, Kenny Cm and D’Arecca MR (Editors) The Merck Index – An
encyclopedia of chemicals, drugs and biological, 14th Edition, Merck Research
Laboratory, Division of Merck and Co., Inc., Whitehouse Station, New Jersey, pp. 283-
284.
83. Sweetman SC (2009) Candesartan Cilexetil. In: Martindale - The Complete Drug
Reference, 36th Edition, Pharmaceutical Press, London, pp. 1238-1239.
84. Gleiter CH, Morike KE, 2002, Clinical pharmacokinetics of Candesartan, Clinical
Pharmacokinetics, 41(1), 7–17, ISSN: 1179-1926.
85. Sever P, Menard J, 1997, Angiotensin II antagonism refined: candesartan cilexetil,
Journal of Human Hypertension, 11 (suppl 2), S1–S95, ISSN: 1476-5527.
86. McClellan KJ and Goa KL, 1998, Candesartan cilexetil: a review of its use in essential
hypertension, Drugs, 56(5), 847–69, ISSN: 1179-1950.
87. Stoukides CA, McVoy HJ, Kaul AF, 1999, Candesartan cilexetil: an angiotensin II
receptor blocker, The Annals of Pharmacotherapy, 33(12), 1287–1298, ISSN: 1542-
6270.
88. See S and Stirling AL, 2000, Candesartan cilexetil: an angiotensin II-receptor blocker,
American Journal of Health-System Pharmacy, 57(8), 739–46, ISSN: 1535-2900.
89. Easthope SE and Jarvis B, 2002, Candesartan cilexetil: an update of its use in essential
hypertension, Drugs, 62(8), 1253–1287, ISSN: 1179-1950.

CHAPTER 1 INTRODUCTION
53
90. Fenton C and Scott LJ, 2005, Candesartan cilexetil: a review of its use in the
management of chronic heart failure, Drugs, 65(4), 537–58, ISSN: 1179-1950.
91. McKelvie RS, 2006, Candesartan for the management of heart failure: more than an
alternative, Expert Opinion on Pharmacotherapy, 7(14), 1945–1956, ISSN: 1465-6566.
92. Meredith PA, 2007, Candesartan cilexetil—a review of effects on cardiovascular
complications in hypertension and chronic heart failure, Current Medical Research and
Opinion, 23(7), 1693–1705, ISSN: 1473-4877.
93. Anonymous (2015) Telmisartan. In: British Pharmacopoeia, Vol. 2, British
Pharmacopoeia Commission Office, MHRA, London, pp. 979-980.
94. Budvari S (1996) Telmisartan. In: O’ Neil MJ, Heckelman PE, Koch CB, Roman KJ,
Kenny Cm and D’Arecca MR (Editors) The Merck Index – An encyclopedia of
chemicals, drugs and biological, 14th Edition, Merck Research Laboratory, Division of
Merck and Co., Inc., Whitehouse Station, New Jersey, pp. 1569.
95. Sweetman SC (2009) Telmisartan. In: Martindale - The Complete Drug Reference, 36th
Edition, Pharmaceutical Press, London, pp. 1409.
96. Stangier J, Schmid J, Turck D, Switek H, Verhagen A, Peeters PA, vanMarle SP,
Tamminga WJ, Sollie FA and Jonkman JH, 2000, Absorption, metabolism, and
excretion of intravenously and orally administered [14C] telmisartan in healthy
volunteers, Journal of Clinical Pharmacology, 40(1), 1312–22, ISSN: 1552-4604.
97. Mazzolai L and Burnier M, 1999, Comparative safety and tolerability of angiotensin II
receptor antagonists, Drug Safety, 21(1), 23–33, ISSN: 1179-1942.
98. Michel MC, Bohner H, Koster J, Schafers R and Heemann U, 2004, Safety of
telmisartan in patients with arterial hypertension: an open-label observational study,
Drug Safety, 27(5), 335–44, ISSN: 1179-1942.
99. McClellan KJ and Markham A, 1998, Telmisartan, Drugs, 56(6), 1039–44, ISSN:
1179-1950.
100. Sharpe M, Jarvis B, and Goa KL, 2001, Telmisartan: a review of its use in
hypertension, Drugs, 61(10), 1501–29, ISSN: 1179-1950.
101. Battershill AJ and Scott LJ, 2006, Telmisartan: a review of its use in the
management of hypertension, Drugs, 66(1), 51–83, ISSN: 1179-1950.
102. Gosse P, 2006, A review of telmisartan in the treatment of hypertension: blood
pressure control in the early morning hours, Vascular Health and Risk
Management, 2(3), 195–201, ISSN: 1176-6344.
CHAPTER 1 INTRODUCTION
54
103. Yamagishi S, Nakamura K and Matsui T, 2007, The potential utility of telmisartan,
an angiotensin II type 1 receptor blocker with peroxisome proliferator-activated
receptor γ(PPAR-γ)-modulating activity for the treatment of cardiometabolic
disorders, Current Molecular Medicine, 7(5), 463–469, ISSN: 1875-5666.
104. Francischetti EA, Celoria BM, Francischetti A and Genelhu VA, 2008, Treatment
of hypertension in individuals with the cardiometabolic syndrome: the role of an
angiotensin II receptor blocker, telmisartan. Expert Review of Cardiovascular
Therapy, 6(3), 289–303, ISSN: 1477-9072.
105. Anonymous, (2015) Ziprasidone Hydrochloride. In: British Pharmacopoeia, Vol.
2, British Pharmacopoeia Commission Office, MHRA, London, pp. 1209-1210.
106. Sweetman SC (2009) Ziprasidone Hydrochloride. In: Martindale - The Complete
Drug Reference, 36th Edition, Pharmaceutical Press, London, pp. 1036-1037.
107. Aweeka F, Jayesekara D, Horton M, Swan S, Lambrecht L, Wilner KD, Sherwood
J, Anziano RJ, Smolarek TA and Turncliff RZ, 2000, The pharmacokinetics of
ziprasidone in subjects with normal and impaired renal function, British Journal of
Clinical Pharmacology, 49 (suppl 1), 27S–33S, ISSN: 1365-2125.
108. Miceli JJ, Wilner KD, Swan SK, Tensfeldt TG, 2005, Pharmacokinetics, safety,
and tolerability of intramuscular Ziprasidone in healthy volunteers. Journal of
Clinical Pharmacology, 45(6), 620–30, ISSN: 1552-4604.
109. Preskorn SH, 2005, Pharmacokinetics and therapeutics of acute intramuscular
Ziprasidone, Clinical Pharmacokinetics, 44(11), 1117–1133, ISSN: 1179-1926.
110. Rowe RC (2009) Polyvinyl alcohol, In: Rowe RC, Sheskey PJ and Quinn ME
(Eds). Pharmaceutical Excipients, 6th Edition, Pharmaceutical Press, London, pp.
564-565.
111. Rowe RC (2009) Povidone, In: Rowe RC, Sheskey PJ and Quinn ME (Eds).
Pharmaceutical Excipients, 6th Edition, Pharmaceutical Press, London, pp. 581-
585.
112. Rowe RC (2009) Sodium Lauryl Sulphate, In: Rowe RC, Sheskey PJ and Quinn
ME (Eds). Pharmaceutical Excipients, 6th Edition, Pharmaceutical Press, London,
pp. 651-653.
113. Rowe RC (2009) Poloxamer, In: Rowe RC, Sheskey PJ and Quinn ME (Eds).
Pharmaceutical Excipients, 6th Edition, Pharmaceutical Press, London, pp. 506-
509.

REVIEW
OF
LITERATURE

CHAPTER 2 REVIEW OF LITERATURE
56
CHAPTER - 2
Review of Literature
2.1 Review of literature on bioavailability enhancement by nanosuspension
Arunkumar N et al (2010) [114] prepared nanosuspensions of a poorly soluble
atorvastatin calcium in order to enhance its dissolution and oral bioavailability.
Nanosuspensions were prepared by antisolvent precipitation followed by sonication
technique. They were characterized by thermal gravimetric analysis (TGA), differential
scanning calorimetry (DSC), powder x-ray diffraction (PXRD), solubility, dissolution and
in-vivo bioavailability studies. The absence of atorvastatin peaks in PXRD profiles of
nanosuspensions suggested the transformation of the crystalline drug into an amorphous
form. TGA examination suggested that the drug was converted into anhydrous form from
the original tri-hydrate form. DSC curves also complimented the result obtained by TGA
and PXRD. The effect of particle size was found to be significant on the saturation
solubility of the drug. The in-vitro drug release studies showed a significant increase in the
dissolution rate of nanosuspensions as compared with the pure drug. Bioavailability studies
have shown a nearly 3-fold increase in the AUC for the nanosuspensions as opposed to the
pure drug.
Patel GV et al (2014) [115] developed nanosuspension (NS) of efavirenz (EFV) and
investigated its potential in enhancing the oral bioavailability of EFV. EFVNS was
prepared using the media milling technique. The Box – Behnken design was used for

CHAPTER 2 REVIEW OF LITERATURE
57
optimization of the factors affecting EFVNS. Sodium lauryl sulfate and PVP K-30 were
used to stabilize the NS. Freeze-dried NS was completely re-dispersed with double-
distilled filtered water. Mean particle size and zeta potential of the optimized NS were
found to be 320.4 ± 3.62 nm and –32.8 ± 0.4 mV, respectively. X-ray diffraction and
differential scanning calorimetric analysis indicated no phase transitions. Rate and extent
of drug dissolution in the dissolution medium for NS was significantly higher compared to
the marketed formulation. The parallel artificial membrane permeability assay indicated
that NS successfully enhanced the permeation of EFV. Results of in-situ absorption studies
showed a significant difference in absorption parameters such as Ka, t1/2 and uptake
percentages between lyophilized NS and marketed formulation of EFV. Oral
bioavailability of EFV in rabbits resulting from NS was increased by 2.19-fold compared
to the marketed formulation. Thus, it can be concluded that NS formulation of EFV can
provide improved oral bioavailability due to enhanced solubility, dissolution velocity,
permeability and hence absorption.
Wahlstrom JL et al (2007) [116] developed a nanosuspension formulation of 1,3-
Dicyclohexylurea (DCU) to support oral, intravenous bolus and intravenous infusion
dosing. Use of the nanosuspension formulation maintained DCU free plasma levels above
the soluble epoxide hydrolase (sEH) IC50 and demonstrated that the application of
formulation technology can accelerate the in-vivo evaluation of new targets by enabling
pharmacodynamics studies of poorly soluble compounds. The use of nanoparticle
parenteral drug delivery systems for oral, IV injection and IV infusion of tool compounds
to reach desired exposures allowed to obtain reliable and critical data for early decision
making early in the discovery process without large investment by utilizing less-than-ideal,
prototype compounds for target validation.
Zhao J et al (2016) [117] improved the oral bioavailability of Lacidipine (LCDP) by
applying nanosuspension technology prepared by a hybrid method of micro-precipitation
and high-pressure homogenization. The effects of the production parameters (shearing rate
and time, the stabilizers and their concentrations, homogenization pressure and a number
of cycles) were investigated to optimize the preparation process. In-vitro characterizations
(X-ray powder diffraction, differential scanning calorimetry, scanning electron microscopy
and dissolution measurement) were carried out and an oral pharmacokinetic study was
performed in beagle dogs. LCDP was transformed into an amorphous state using the

CHAPTER 2 REVIEW OF LITERATURE
58
preparation process, and the mean particle size was about 714.0 ± 12.7 nm. The dissolution
rate of LCDP nanosuspensions was faster than that of physical mixtures but slower than
that of Lacipil® (the commercial tablet). Regarding the in-vivo pharmacokinetics, the key
pharmacokinetic parameters (Cmax and AUC0→∞) of the nanosuspensions were statistically
significantly higher than those of both the commercial tablet and physical mixtures. So,
this is an efficient drug delivery strategy to facilitate the oral administration of LCDP by
using nanosuspension technology and should be generally applicable to many poorly
water-soluble drugs with dissolution rate-limited absorption.
Anju Raju et al (2014) [118] prepared and characterized nevirapine nanosuspensions so
as to improve the dissolution rate of nevirapine. The low solubility of nevirapine leads to a
decrease and variable oral bioavailability. Nanosuspension can overcome the oral
bioavailability problem of nevirapine. Nevirapine nanosuspensions were prepared using
nanoedge method. The suspensions were stabilized using surfactants Lutrol F127 or
Poloxamer 407 and hydroxypropyl methylcellulose. The nanosuspension was characterized
by particle size, polydispersity index, crystalline state, particle morphology, in-vitro drug
release and pharmacokinetics in rats after oral administration. The results supported the
claim for the preparation of nanosuspensions with enhanced solubility and bioavailability.
Xia D et al (2010) [119] prepared nanosuspension by the precipitation–ultrasonication
method. The effects of five important process parameters, i.e. the concentration of
polyvinyl alcohol in the antisolvent, the concentration of nitrendipine in the organic phase,
the precipitation temperature, the power input and the time length of ultrasonication on the
particle size of nanosuspensions were investigated systematically and the optimal values
were 0.15%, 30 mg/ml, below 3°C, 400 W, and 15 min, respectively. The particle size and
zeta potential of nanocrystals were 209 nm (±9 nm) and -13.9 mV (±1.9 mV), respectively.
The morphology of nanocrystals was found to be flaky in shape by scanning electron
microscopy (SEM) observation. The X-ray powder diffraction (XRPD) and differential
scanning calorimetry (DSC) analysis indicated that there was no substantial crystalline
change in the nanocrystals compared with raw crystals. The in-vitro dissolution rate of
nitrendipine was significantly increased by reducing the particle size. The in-vivo test
demonstrated that the Cmax and AUC values of nanosuspension in rats were approximately
6.1-fold and 5.0-fold greater than that of commercial tablets, respectively.

CHAPTER 2 REVIEW OF LITERATURE
59
Liu D et al (2012) [120] prepared carvedilol (CAR) nanosuspensions using antisolvent
precipitation–ultrasonication technique to improve its dissolution rate and oral
bioavailability. α-tocopherol succinate (VES) was first used as a co-stabilizer to enhance
the stability of the nanosuspension. The optimal values of the precipitation temperature,
power inputs and time length of ultrasonication were selected as 10°C, 400 W, and 15 mins
respectively. Response surface methodology based on central composite design was
utilized to evaluate the formulation factors that affect the size of nanosuspensions. The
optimized formulation showed a mean size of 212±12 nm and a zeta potential of -42±3
mV. Scanning electron microscopy indicated that the nanosuspensions were flaky-shaped.
Powder X-ray diffraction and differential scanning calorimetry analysis confirmed that the
nanoparticles were in the amorphous state. Fourier transform infrared analysis
demonstrated that the reaction between CAR and VES is probably due to hydrogen
bonding. The nanosuspension was physically stable at 25°C for 1 week, which allows it to
be further processing such as drying. The dissolution rate of the nanosuspensions was
markedly enhanced by reducing the size. The in-vivo test demonstrated that the Cmax and
AUC values of nanosuspensions were approximately 3.3- and 2.9-fold greater than that of
the commercial tablets, respectively.
Sahu BP et al (2014) [121] formulated nanosuspension of furosemide to enhance its oral
bioavailability by increasing its dissolution in the stomach where it has better permeability.
The nanosuspensions were prepared by precipitation with ultrasonication method.
Polyvinyl acetate was used for sterically stabilizing the nanosuspensions. The diffusing
drug concentration and stabilizer were used as the independent variables and the particle
size, polydispersity index and drug release were selected as dependent variables and
characterized. The effect of nanoprecipitation on the enhancement of oral bioavailability of
furosemide nanosuspension was studied by in-vitro dissolution and in-vivo absorption
studies in rats and compared to pure drug. The in-vivo studies on rats indicated a
significant increase in the oral absorption of furosemide in the nanosuspension compared
to pure drug. The AUC0→24 and Cmax values of nanosuspension were approximately 1.38-
and 1.68 -fold greater than that of pure drug, respectively. The improved oral
bioavailability and pharmacodynamic effect of furosemide may be due to the improved
dissolution of furosemide in the simulated gastric fluid which results in enhanced oral
systemic absorption of furosemide from stomach region where it has better permeability.
CHAPTER 2 REVIEW OF LITERATURE
60
Thadkala K et al (2014) [122] investigated for better and stable amorphous ezetimibe
nanosuspensions for oral bioavailability enhancement. Nanosuspensions of ezetimibe were
prepared by solvent-antisolvent precipitation technique using a surfactant, tween 80 as a
stabilizer. Nanosuspension preparation was optimized for particle size by investigating two
factors that are, solvent: antisolvent ratio and surfactant concentration, at three levels. The
formulations were characterized for particle size, surface morphology, crystallinity, zeta
potential, saturation solubility, in-vitro drug release and in-vivo drug absorption.
Nanosuspensions were smooth and spherical. The X-ray powdered diffraction and
differential scanning calorimetry results indicated that the antisolvent precipitation method
led to the amorphization of ezetimibe. Ezetimibe nanosuspensions increased the saturation
solubility to an extent of 4-times. The Cmax with ezetimibe nanosuspension was
approximately 3-fold higher when compared with that of ezetimibe conventional
suspensions administered orally.
Bhalekar MR et al (2014) [123] formulated and characterized nanosuspensions of
acyclovir to increase the oral bioavailability. Nanosuspensions were prepared by the
precipitation-ultrasonication method and the effects of important process parameters i.e.,
precipitation temperature, stirring speed, endpoint temperature of probe sonicator, energy
input and sonication time were investigated systematically. The optimal nanosuspension
(particle size 274 nm) was obtained at values of 4°C, 10,000 RPM, 30°C, 600 Watt and 20
mins respectively. The nanosuspension was lyophilized using different matrix formers and
sucrose (100% w/w to the drug) was found to prevent agglomeration and particle size upon
reconstitution was found to be 353 nm. The lyophilized nanocrystals appeared flaky in
scanning electron microscopy images, the X-ray powder diffraction and differential
scanning calorimetry analysis showed the nanoparticles to be in the crystalline state. Ex-
vivo permeation study for calculating absorption rate and in-vivo bioavailability area under
the curve both showed a three-fold increase over marketed suspension.
Natarajan J et al (2013) [124] prepared olanzapine nanosuspension using solvent
diffusion followed by sonication technique. The nanosuspension was characterized for
particle size distribution, polydispersity index, zeta potential, crystallinity study (DSC), in-
vitro dissolution release profile and pharmacokinetic studies. The average size of the
nanoparticles in F6 was 122.2 nm. Saturation solubility of an optimized batch of
nanosuspension and the plain drug was found to be 2851.3±6.3 μg/ml and 251.3±6.1

CHAPTER 2 REVIEW OF LITERATURE
61
μg/ml, respectively. In-vitro cumulative drug release from the nanosuspension was 83.54%
at 45 min when compared to pure drug 22.91% and in freeze-dried nanosuspension
92.67%. Pharmacokinetic studies in rats indicated that AUC (0→∞) was increased and
clearance was decreased when olanzapine nanosuspensions were administered orally
compared with that of olanzapine suspension which in turn 2 folds increased
bioavailability. The enhanced relative bioavailability by the formulation might be
attributed to oral bioavailability can be attributed to the adhesiveness of the drug
nanosuspension, increased surface area (due to a reduction in particle size), increased
saturation solubility, leading to an increased concentration gradient between the
gastrointestinal tract lumen and blood, and increased dissolution velocity. This
enhancement in bioavailability will lead to a subsequent reduction in drug dose, rendering
the therapy cost-effective and obliterating any undue drug dumping in the body.
Sawant KK et al (2016) [125] developed nanosuspensions (NS) of Cefdinir (CEF) by the
media milling technique using zirconium oxide beads as the milling media to improve its
oral bioavailability. The particle size and zeta potential were found to be 224.2±2.7nm and
-15.7±1.9mV, respectively. Saturation solubility of NS was found to be 1985.3±10.2µg/ml
which was 5.64 times higher than pure drug (352.2±6.5µg/ml). The DSC thermograms and
XRD patterns indicated that there was no interaction between drug and excipients and that
the crystallinity of CEF remained unchanged after media milling process. Results of in-
vitro release studies and ex-vivo permeation studies showed improved drug release of
88.21 ± 2.90% and 83.11±2.14%, respectively, from NS after 24h as compared to drug
release of 54.09±2.54 and 48.21±1.27%, respectively, from the marketed suspension
(Adcef). In-vivo studies in rats demonstrated a 3-fold increase in oral bioavailability from
the NS in comparison to marketed suspension.
Patel Y et al (2014) [126] prepared nanosuspension of cefuroxime axetil for improving its
solubility and thereby its bioavailability. Cefuroxime axetil nanosuspensions were
prepared by the media milling technique using zirconium oxide beads. The particle size of
the drug was drastically reduced to 221.2±0.26 nm from 5 µm after nanosizing. Saturation
solubility achieved was 2387±3.35 µg/ml which was 16 times more than the bulk drug.
DSC thermograms confirmed the non-interference of excipients on the drug particles. In-
vivo diffusion studies showed 94.17±5.689% drug release from nanosuspension as against
62.34±1.139% release from plain Cefuroxime axetil suspension in 24 hours. Similarly, for
CHAPTER 2 REVIEW OF LITERATURE
62
ex-vivo studies, 57.52 ± 1.159% was released from plain cefuroxime axetil suspension in
comparison to 85.58 ± 3.12% for nanosuspension in 24 hours. In-vivo studies in rats
demonstrated a two times increase in oral bioavailability from the nanosuspension in
comparison to the marketed formulation. Therefore, nanosuspension which exhibited
improved solubility, dissolution and absorption could be a better option as a delivery
system compared to the present oral suspension formulation.
2.2 Review of literature on the preparation of nanosuspension by precipitation
method
Nagajyothi N et al (2014) [127] formulated nanosuspension of pitavastatin by
precipitation method to improve its dissolution characteristics. Pitavastatin was dissolved
in a methanol at room temperature. This was poured into water containing different amount
of β-cyclodextrin and tween 80 maintained at room temperature and subsequently stirred
on magnetic stirrer to allow the volatile solvent to evaporate. The prepared nanosuspension
were evaluated by differential scanning calorimetry (DSC), zeta potential analysis,
scanning electron microscopy, fourier transform infrared spectroscopy, saturation
solubility, and in-vitro drug release studies. DSC curve obtained confirmed the transfer of
drug crystalline form to amorphous form. Solubility studies and in-vitro drug release
studies showed that the prepared nanosuspension has increased solubility and dissolution
rate compared to pure drug. The technology is easy to scale up and requires less
sophistication, the method can be extended to various poorly water-soluble drugs.
Shah SMH et al (2016) [128] optimized the processes and experimental conditions for
fabrication of stable artemisinin (ART) nanosuspension using precipitation ultrasonication
approach with subsequent enhanced dissolution rate compared to raw and micronized
ART. The effect of important parameters including concentrations of stabilizer solution
using polyvinyl alcohol (PVA), ultrasonication power inputs, length of ultrasonication and
effect of temperature were systematically investigated for fabrication of stable ART
nanosuspension. The optimized parameters to produce ART nanocrystals with smaller
particle sizes were found to be 0.15% of PVA, at 200 Watt ultrasonic power input over 15
minutes of ultra-sonication at 4°C temperature. The average particle size and
polydispersity index for ART nanosuspension were found to be 98.77± 1.5 nm and 0.186±
0.01 respectively. The crystallinity of the processed ART particles was confirmed using
DSC and PXRD. Physical stability studies conducted for 30 days at different storage

CHAPTER 2 REVIEW OF LITERATURE
63
temperatures which include 4, 25 and 40°C demonstrated that nanosuspensions stored at
4°C and 25°C were most stable compared to the samples stored at 40°C. The ART
nanosuspension showed significantly (P<0.05) increased (87 fold) in dissolution rate of the
produced nanocrystals compared to the micronized and raw ART which include 97%,
70%, and 10.5% respectively after 60 minutes.
Shinde S et al (2014) [129] prepared and characterized lornoxicam nanosuspensions to
enhance the dissolution rate of the drug. Nanosuspensions were prepared by the
precipitation–ultrasonication method. The particle size and zeta potential of nanospray
dried powder were 213nm and −20mV, respectively. The morphology of nanocrystals was
found to be spherical in shape by scanning electron microscopy (SEM) observation. The
X-ray powder diffraction (XRPD) and differential scanning calorimetry (DSC) analysis
indicated that there was no substantial crystalline change in the nanocrystals compared
with the pure drug. The in-vitro dissolution rate of lornoxicam was significantly increased
by reducing the particle size. The amorphous lornoxicam nanoparticles showed dramatic
improvement in rate as well as the extent of in-vitro drug dissolution. The improvement
can be attributed to amorphization and surface area, reduced particle size and decreased
diffusion layer thickness. Spray drying process produced dry nanosuspension with high
stability compared to liquid formulation.
Sahu BP et al (2014) [130] worked to enhance the oral bioavailability of furosemide by
preparation of nanosuspensions by nanoprecipitation with sonication using dimethyl
sulfoxide (DMSO) as a solvent and water as an antisolvent (NA). The prepared
nanosuspensions were sterically stabilized with polyvinyl acetate (PVA). These were
characterized by particle size, zeta potential, polydispersity index, scanning electron
microscopy (SEM), differential scanning calorimetry (DSC), X-ray diffraction (XRD)
pattern and drug release behavior. The average particle size of furosemide nanoparticles
was found to be in the range of 150-300 nm. The particle size varied with an increase in
the concentration of drug and stabilizer. The preparations showed negative zeta potential
and polydispersity index in the range of 0.3 ± 0.1. DSC and XRD studies indicated that the
crystalline furosemide was converted to amorphous form upon precipitation into
nanoparticles. The saturation solubility of prepared furosemide nanoparticles markedly
increased compared to the original drug in the simulated gastric fluid. The release profiles
of nanosuspension formulation showed up to 81.2% release in 4 h. It may be concluded

CHAPTER 2 REVIEW OF LITERATURE
64
that the nanoprecipitation with ultrasonication have potential to formulate homogenous
nanosuspensions with uniform sized amorphous nanoparticles of furosemide. It was
concluded that polyvinyl acetate can be used as a suitable steric stabilizer to prepare stable
furosemide nanosuspensions. The enhanced saturation solubility in simulated gastric fluid
leads to enhanced absorption of furosemide.
Agarwal V et al (2014) [131] prepared and optimized esomeprazole nanosuspension to
enhance drug dissolution rate. Esomeprazole nanosuspensions were prepared by an
evaporative precipitation-ultrasonication method using poloxamer 188 and poloxamer 407
as stabilizers. Formulation and process variables (concentration of stabilizers and drug,
power input and duration of ultrasonication) affecting the characteristics of
nanosuspensions were optimized. The nanosuspensions were characterized by particle size,
shape, zeta potential, stability and in-vitro drug release study. For optimization of
esomeprazole nanosuspension, the effect of some important parameters, including
concentration of poloxamer 188, concentration of esomeprazole, precipitation temperature,
duration of ultrasonication and power input, on particle size was investigated and the
optimal values were 0.4% w/v, 3.5 mg/ml, 4°C, 20 mins and 60 W, respectively. Particle
size was in the range of 125 - 184 nm with good zeta potential (15.9 - 25.5 mV). The in-
vitro dissolution rate of esomeprazole was enhanced 4-fold (100% in 60 mins) compared
with crude esomeprazole (24% in 60 min), and this was due to a decrease in particle size.
The stability results indicated that nano-formulations stored at 4°C for two months showed
maximum stability. The results indicated the suitability of the evaporative-precipitation-
ultrasonication method for preparation of nanosuspensions of poorly soluble drugs with
improved in-vitro dissolution rate, thus potentially capable of enhancing fast onset of
therapeutic activity and bioavailability.
Singh C et al (2015) [132] enhanced the dissolution rate of a poorly water-soluble drug
cefpodoxime proxetil by nanosuspension formation using a precipitation method.
Cefpodoxime proxetil (CP), a semisynthetic β-lactam antibiotic of cephalosporin class
belonging to BCS class IV with poor solubility and poor permeability is the ideal drug
candidate with limited oral bioavailability when orally administered. The selected
parameter of nanosuspension such as the concentration of drug, solvent-anti solvent
volume ratio was varied so as obtain nanoparticle within the size range less than 1μm.
Characterization of the Cefpodoxime proxetil of nanoparticle was carried out on the basis

CHAPTER 2 REVIEW OF LITERATURE
65
of scanning electron microscopy (SEM), X-ray diffraction (XRD), FTIR spectrum, particle
size, zeta potential and dissolution profile. Results signified that the combination of the
lowest concentration of stabilizer HPMC E50 (0.1%w/v) with low stirring speed (800 rpm)
tends to achieves smallest particle size 755.6 nm and -22.6 mV respectively. FTIR spectra
are shown, that no chemical incompatibility between drug and polymer exist. The in-vitro
drug release (%) cumulative profile of cefpodoxime proxetil nanosuspension was
significantly higher (94%) as compared to marketed preparation (54%) in simulated
intestinal fluid (pH 6.8).
Kakran M et al (2015) [133] developed nanoparticles by evaporative precipitation of
nanosuspension (EPN) of poorly water-soluble drugs, namely silymarin (SLM), hesperetin
(HSP) and glibenclamide (GLB), with the aim of improving their rate of dissolution. The
original drugs and EPN prepared drug nanoparticles were characterized by scanning
electron microscopy (SEM), differential scanning calorimetry (DSC) and dissolution test.
The particle sizes were found to be influenced by the drug concentration and the solvent to
antisolvent ratio. The smallest average particle sizes obtained were 350 nm for SLM, 450
nm for HSP and 120 nm for GLB. The DSC study suggested that the crystallinity of
nanosuspension prepared drug nanoparticles was lower than the original drug. The
dissolution rate of nanosuspension prepared drug nanoparticles markedly increased as
compared to the original drug. The dissolution rate was increased up to 95% for SLM
nanoparticles, up to 90% for HSP and up to almost 100% for the GLB nanoparticles
fabricated. From this study, it was be concluded that the evaporative precipitation
nanosuspension is an effective method to fabricate drug nanoparticles with enhanced
dissolution rate.
Esfandi EH et al (2014) [134] investigated series of nanosuspensions containing
Clarithromycin (CLM) and stabilizers such as HPMC, NaCMC, Polysorbate 80, poloxamer
188 and polyvinyl alcohol in various ratios using sono-precipitation method. Briefly, CLM
was dissolved in acid solution and the pH of the solution was raised under sonication and
the effects of different stabilizers on the particle size of nanoparticles were evaluated.
Characterization of nanoparticles in terms of size, polydispersity index, zeta potential,
differential scanning calorimetry and dissolution studies were performed. Antimicrobial
activity of CLM nanosuspension was compared with coarse powder by using an agar well
diffusion method. The results showed that HPMC was more efficient in size reduction of

CHAPTER 2 REVIEW OF LITERATURE
66
particles and presence of HPMC E5 with a ratio of 3:5 to CLM in formulation led to
developing the stable nanosuspension with a particle size of 340 nm. The obtained
nanosuspension successfully showed enhanced dissolution rate and antimicrobial activity.
Zhang X et al (2006) [36] prepared All-Trans Retinoic Acid (ATRA) nanosuspensions
with a modified precipitation method. The ATRA solution in acetone was injected into the
pure water by an air compressor under the action of ultrasonication. Photon correlation
spectroscopy results showed that the mean particle size of ATRA nanoparticles in
nanosuspensions reduced from 337 nm to 155 nm as the injection velocity increased and
the polydispersity index was 0.45–0.50. The morphology of ATRA nanoparticles varied
with the different concentration of ATRA solution in acetone. ATRA nanoparticles
showed an amorphous state and stable for 6 months. It could be concluded that this
modified precipitation method could produce stable and controllable ATRA
nanosuspension to a certain extent, thus benefit from higher saturation solubility.
Ghasemian E et al (2015) [135] formulated and characterize cefixime nanosuspensions in
order to enhance the dissolution rate and solubility of this drug. Nanosuspensions were
prepared using sono-precipitation method and the effects of surfactant type, surfactant and
solid content, sonication power input, and interval of acid addition on the yield and particle
size of nanosuspensions was investigated. Particle size and yield of the optimal
nanosuspension formulation were 266±10 nm and 35±2%, respectively. Scanning electron
microscopy (SEM) results showed a nearly spherical morphology of cefixime
nanoparticles. Thermal analysis indicated that there was a partially crystalline structure in
the nanoparticles and in-vitro dissolution rate of the drug was significantly increased by the
reduction in particles size. Sono-precipitation was shown to be a successful method to
produce cefixime nanosuspensions and the optimum conditions of the process were
introduced.
Zhang Z et al (2012) [136] enhanced the dissolution rate by preparing Irbesartan (IBS)
nanocomposite particles via antisolvent precipitation combined with a spray drying
process. Four pharmaceutically acceptable excipients, including three different polymers
and one charged surfactant, were evaluated as stabilizers to control the particle size and to
prevent the agglomeration of particles. The experiment results indicated that PVP
combined with sodium dodecyl sulfate (SDS) significantly decreased the particle size and
enhanced the stability of drug nanoparticles. As a result, finally obtained stable IBS
CHAPTER 2 REVIEW OF LITERATURE
67
nanoparticles, with an average size of approximately 55 nm. In the dissolution test, the IBS
nanocomposite particles showed a significantly enhanced dissolution rate and 100% of the
drug dissolved within 20 min. In contrast, the physical mixture with the same recipe as the
IBS nanocomposite particles and the raw IBS reached only 8% and 40% of drug dissolved
in 20 min respectively and both of them did not dissolve completely, even after 120 min.
Suthar AK et al (2011) [137] investigated promising methods of nanoparticle engineering
for the formulation of poorly water-soluble drug compounds to enhance in-vitro
dissolution and oral bioavailability of poorly water-soluble Raloxifene Hydrochloride (RH)
by preparing stable nanoparticles. Mechanism of dissolution enhancement was also
investigated. Nanoparticles were produced by combining the antisolvent precipitation and
high-pressure homogenization (HPH) approaches in the presence of HPMC E5 and SDS
(2:1, w/w). Then the nanosuspensions were converted into dry powders by spray-drying.
The effect of process variables on particle size and physical state of the drug were
investigated. The physicochemical properties of raw RH and nanoparticles were
characterized by Scanning Electron Microscopy (SEM). The images of SEM indicated
spherical RH nanoparticles. Nanoparticles showed good dissolution profile. The process by
combining the antisolvent precipitation under sonication and HPH was producing small,
uniform and stable nanoparticles which markedly enhanced dissolution rate.
Vishnu Priya P et al (2016) [138] prepared oral nanosuspensions of Irbesartan which is an
angiotensin II receptor antagonist used mainly for the treatment of hypertension, in order
to overcome bioavailability problems, to reduce dose-dependent side effects and frequency
of administration. Nanosuspension containing the drug was prepared by precipitation
method using combinations of polymers (such as PVP K-15, Tween 80, SLS and
Poloxamer F127). The oral nanosuspension was evaluated for various physical and
biological parameters, drug content uniformity, entrapment efficiency, scanning electron
microscopy, in-vitro drug release, short-term stability and drug-excipient interactions
(FTIR) indicated that all were within limits. In-vitro drug release studies of all the
formulations were studied, out of that formulation, F9 showed 100.02 % of drug release
within 20 min. and follows first order release kinetics. Short-term stability studies
(40±2°C/75±5% RH for 3 months) indicated that the oral nanosuspension was stable with
respect to drug content and dissolution. IR spectroscopic studies indicated that there are no
drug-excipient interactions.

CHAPTER 2 REVIEW OF LITERATURE
68
2.3 Review of literature on bioavailability enhancement of candesartan cilexetil
Zulal NA et al (2015) [139] formulated various solid dispersions. The different drug:
carrier ratio for urea 1:2, 1:4 and 1:6, for polyethylene glycol 6000 (PEG), 1:2 and 1:4, 1:8
and mannitol 1:2, 1:4 and 1:6. Piperin and quercetin natural P-glycoprotein inhibitors were
used as bioavailability enhancers. Bioavailability studies were carried out in a rat model
with the SDs formulated in a suspension form and administered by the oral route. All the
carriers enhanced drug dissolution in water 2 to 4-fold depending on drug/carrier ratio.
Release kinetics from solid dispersions made with mannitol showed zero order drug
release. Urea and PEG 6000-based solid dispersions showed 1st order drug release kinetics.
FTIR studies confirmed transformation to an amorphous form of CDS in mannitol solid
dispersion; this was supported by release kinetic studies. Bioavailability of the drug in the
animals was enhanced by 27 and 68 % when quercetin and piperine, respectively, were
incorporated. Formation of solid dispersion enhances the solubility and bioavailability of
CDS when natural P-glycoprotein inhibitors such as piperine and quercetin are
incorporated as enhancers.
Beg S et al (2013) [140] worked on formulation development and evaluation of P-
SNEDDS of candesartan cilexetil, using Formulation by Design (FbD). Pseudo-ternary
phase diagrams and FT-IR studies facilitated selection of constituents for P-SNEDDS viz.,
lauroglycol 90 (oil), tween 40 (surfactant), transcutol HP (co-surfactant) and oleylamine
(cationic charge inducer). A D-optimal mixture design (three factors and two levels) was
employed for optimizing P-SNEDDS employing Design Expert® software. Globule size,
percent dissolution efficiency, mean dissolution time, amount permeated through intestine
and emulsification time were employed as response variables to optimize the formulation.
The optimized formulation was studied for ex-vivo permeability using everted sac
technique, in-vivo pharmacokinetics studies and in-situ single pass perfusion (SPIP) studies
in Wistar rats. The curvilinear 3-D response surface and 2-D contour plots construed
remarkable diminution in globule size and consequent improvement in drug release (>90%
in 15 min) with decreasing oil and increasing surfactant and co-surfactant levels.
Pharmacokinetic and SPIP studies on the optimized positively charged system indicated 3-
4 fold bioavailability enhancement vis-à-vis the marketed formulation (CANDESARTM)
and significant improvement as compared to conventional SEDDS. In a nutshell, the P-

CHAPTER 2 REVIEW OF LITERATURE
69
SNEDDS had immense potential to significantly enhance bioavailability of poorly soluble
drugs.
Acharya A et al (2016) [141] prepared a pro-niosomal formulation of candesartan cilexetil
by a slurry method, using span 60 and tween 60 as non-ionic surfactants, maltodextrin as
carrier and cholesterol and soya lecithin as stabilizers. FT-IR study showed drugs and
excipients compatibility. Mean vesicles size of pro-niosome derived niosome was found in
the range of 16.34-32.48 μm and 7.25-16.45 μm before and after shaking. An optimized
formulation A3 containing a 2:1 ratio of span 60 and cholesterol showed maximum
entrapment (86.17%) and in-vitro drug release (93.8%) compared to other formulations. In-
vitro skin permeation studies were carried out using Albino rat skin and results showed that
formulation A3 exhibited 88.65% drug permeation in a steady-state manner over a period
of 24 h with a flux value of 1.94 μg/cm2/h and enhancement ratio of 3.73. In-vivo
pharmacokinetics studies of pro-niosomal gel formulation A3 showed a significant
increase in bioavailability (1.425 folds) compared with an oral formulation of candesartan
cilexetil. Stability studies showed that pro-niosomal gel formulation was stable throughout
its study period.
Gurunath S et al (2014) [142] investigated the absorption of candesartan cilexetil (CAN)
by improving its solubility and inhibiting intestinal P-gp activity. A phase solubility
method was used to evaluate the aqueous solubility of CAN in PVP K-30 (0.2–2%). Gibbs
free energy (ΔGtro) values were all negative. Solubility was enhanced by the freeze drying
technique. FTIR spectra indicated no interaction between drug and PVP K-30. From XRD
and DSC data, CAN was in the amorphous form, which explains the cumulative release of
drug from its prepared systems. Enhancement of CAN absorption was noticed by
improving its solubility and inhibiting the P-gp activity. The significant results (p < 0.05)
were obtained for freeze-dried solid dispersions in the presence of P-gp inhibitor than
without naringin (15 mg/kg) with an absorption enhancement of 8-fold. Naringin could be
employed as an excipient in the form of solid dispersions to increase CAN intestinal
absorption and its oral bioavailability.
Shaikh SM et al (2016) [143] improved the solubility and dissolution rate and hence the
permeability of candesartan cilexetil (CAN) by preparing solid dispersions/inclusion
complexes. Solid dispersions were prepared using PEG 6000 [hydrophilic polymer] and

CHAPTER 2 REVIEW OF LITERATURE
70
Gelucire 50/13 [Amphiphillic surfactant] by melt agglomeration (MA) and solvent
evaporation (SE) methods in different drug-to-carrier ratios, while inclusion complexes
were made with hydroxypropyl- β-cyclodextrin (HP-β-CD) [complexing agent] by
grinding and spray drying method. Saturation solubility method was used to evaluate the
effect of various carriers on aqueous solubility of CAN. Based on the saturation solubility
data, two drug-carrier combinations, PEG 6000 (MA 1:5) and HP-β-CD (1:1 M grinding)
were selected as optimized formulations. FTIR, DSC, and XRD studies indicated no
interaction of the drug with the carriers and provided valuable insight on the possible
reasons for enhanced solubility. Dissolution studies showed an increase in drug dissolution
of about 22 fold over the pure drug for PEG 6000 (MA 1:5) and 12 fold for HP-β-CD (1:1
M grinding). Ex-vivo permeability studies indicated that the formulation having the
greatest dissolution also had the best absorption through the chick ileum. Capsules
containing solid dispersion/ complex exhibited better dissolution profile than the marketed
product.
2.4 Review of literature on bioavailability enhancement of telmisartan
Kothawade PC et al (2013) [144] enhanced the solubility and bioavailability of poorly
water-soluble drug telmisartan by formulating solid dispersions (SDs) using spray drying
method. Telmisartan was selected as a model drug due to its poor and pH-dependent
solubility. Meglumine has been used as an alkalizer in SDs to increase the solubility of
telmisartan. HPMC E5LV and PVP K-30 were used as polymers for preparation of solid
dispersions. The prepared SDs were characterized by scanning electron microscopy
(SEM), differential scanning calorimetry (DSC), powder X-ray diffraction (XRD), fourier
transform infrared spectroscopy (FTIR) study, solubility study, in-vitro drug release study
and in-vivo study. SEM, DSC and XRD study showed the partial conversion of crystalline
telmisartan to amorphous form. The solubility of telmisartan has been found to be
increased by more than 300 folds when formulated as SDs using PVP K-30. In-vitro drug
release study showed marked enhancement in the drug release, SDs showed 100 % drug
release within 30 mins while pure telmisartan showed within 120 mins. The in-vivo study
showed significant enhancement in bioavailability of telmisartan from SDs with PVP K-30
than the plain drug. Prepared solid dispersion using spray drying technique showed
significant enhancement in drug solubility, drug release, and bioavailability. This may aid
in improving bioavailability to a greater extent requiring less amount of the drug.

CHAPTER 2 REVIEW OF LITERATURE
71
Patel JM et al (2014) [145] developed nanoparticulate solid oral dosage forms of
telmisartan (TLM) by converting the optimized batch of drug loaded nanosuspensions into
a tablet dosage form using lyophilization technique. The TLM loaded nanosuspensions
were optimized by the implementation of 32 full factorial design along with principal
component analysis (PCA) with a concentration of stabilizer and amount of milling agents
as factors. The optimized batch of TLM loaded nanosuspension exhibited a mean particle
size of 334.67± 10.43 nm. The results of various instrumental techniques illustrated
retention of drug crystallinity after milling and lyophilization. The results of in-vitro drug
release study of tablets containing drug nanocrystals indicated remarkable improvement in
the dissolution rate as compared to the marketed tablet (Sartel® 20). The results of an in-
vivo pharmacokinetic study on Wister rats indicated a 1.5-fold enhancement in oral
bioavailability for tablets containing TLM nanocrystals against the marketed tablets.
Cao Y et al (2016) [146] prepared organic solvent-free solid dispersions (OSF-SDs)
containing telmisartan (TEL) using polyvinylpyrrolidone K-30 (PVP K-30) and
polyethylene glycol 6000 (PEG 6000) as hydrophilic polymers, sodium hydroxide (NaOH)
as an alkalizer and poloxamer 188 as a surfactant by a lyophilization method. In-vitro
dissolution rate and physicochemical properties of the OSF-SDs were characterized using
USP-I basket method, differential scanning calorimetry (DSC), X-ray diffractometry
(XRD) and Fourier transform-infrared (FT-IR) spectroscopy. In addition, the oral
bioavailability of OSF-SDs in rats was evaluated by using TEL bulk powder as a reference.
The dissolution rates of the OSF-SDs were significantly enhanced as compared to TEL
bulk powder. The results from DSC, XRD showed that TEL was molecularly dispersed in
the OSF-SDs as an amorphous form. The FT-IR results suggested that intermolecular
hydrogen bonding had formed between TEL and its carriers. The OSF-SDs exhibited
significantly higher AUC0–24 h and Cmax. This study demonstrated that OSF-SDs can be a
promising method to enhance the dissolution rate and oral bioavailability of TEL.
Padia N et al (2015) [147] developed a self-micro emulsifying drug delivery system
(SMEDDS), a mixture of oil, surfactant, and co-surfactant, which are emulsified in an
aqueous medium under gentle digestive motility in the gastrointestinal tract, to enhance the
oral bioavailability of poorly water-soluble telmisartan. Psuedoternary phase diagrams
were constructed to identify the efficient self-emulsifying region. A SMEDDS were further
evaluated for its percentage transmittance, emulsification time, drug content, phase
CHAPTER 2 REVIEW OF LITERATURE
72
separation, globule size, zeta potential, pH, refractive index, X-ray diffraction, differential
scanning calorimetry and in-vitro dissolution studies. Optimized formulation was also
compared with the marketed product (Telma 20) in male SD rats. The pharmacokinetic
study exhibited 1.54 fold increase in the oral bioavailability of telmisartan SMEDDS
compared with the marketed product.
Ahmad J et al (2011) [148] developed, characterized self-nano emulsifying drug delivery
system and its relative bioavailability was compared to the commercially available
formulation. Safsol-218, tween-20, and transcutol P were chosen as oil, surfactants, and
co-surfactants respectively as they show the highest solubility for telmisartan. The
solubility of the drug was further improved by adding sodium hydroxide (0.67%). The
droplet size of the optimized emulsion was also evaluated and was observed to be in nano
range. The dissolution of the drug was rapid in simulated gastric fluid (pH 1.2) as well as
in simulated intestinal fluid (pH 6.8) and was found to be pH independent. The
pharmacokinetic parameters (AUC0→t ± SD, Cmax, and Tmax) of the optimized formulation
of telmisartan after oral administration as SNEDDS were compared with oral tablet and
API suspension of the drug. The results showed a 4.34-fold increase in oral bioavailability
of the drug in comparison to the tablet. The results demonstrate that SNEDDS composed
of sefsol-218, tween-20 and transcutol P substantially enhanced the bioavailability of
telmisartan. Further, it showed highly significant fall (p < 0.001) in mean blood pressure of
hypertensive rats for 48 hours.
Charman SA et al (1992) [149] formulated, a lipophilic compound, WIN 54954, in a
medium chain triglyceride oil/non-ionic surfactant mixture which exhibited self-
emulsification under conditions of gentle agitation in an aqueous medium. The efficiency
of emulsification was studied using a laser diffraction sizer to determine particle size
distributions of the resultant emulsions. An optimized formulation which consisted of 25%
(w/w) surfactant, 40% (w/w) oil and 35% (w/w) WIN 54954 emulsified rapidly with gentle
agitation in 0.1 N HCl (37°C), producing dispersions with mean droplet diameters of less
than 3 microns. The self-emulsifying preparation was compared to a polyethylene glycol
600 (PEG 600) solution formulated by administering each as prefilled soft gelatin capsules
to fasted beagle dogs in a parallel crossover study. Pharmacokinetic parameters were
determined and the absolute bioavailability of the drug was calculated by comparison to an
i.v. injection. The SEDDS improved the reproducibility of the plasma profile in terms of

CHAPTER 2 REVIEW OF LITERATURE
73
the maximum plasma concentration (Cmax) and the time to reach the maximum
concentration (tmax). There was no significant difference in the absolute bioavailability of
WIN 54954 from either the SEDDS or the PEG formulations.
2.5 Review of literature on bioavailability enhancement of ziprasidone
hydrochloride
Miao Y et al (2016) [150] developed self-nano emulsifying drug delivery systems
(SNEDDS) in sustained-release pellets of ziprasidone to enhance the oral bioavailability
and overcome the food effect of ziprasidone. Preformulation studies including a screening
of excipients for solubility and pseudo-ternary phase diagrams suggested the suitability of
Capmul MCM as the oil phase, Labrasol as a surfactant and PEG 400 as co-surfactant for
preparation of self-nano emulsifying formulations. The preliminary composition of the
SNEDDS formulations was selected from the pseudo-ternary phase diagrams. The
prepared ziprasidone-SNEDDS formulations were characterized for self-emulsification
time, the effect of pH and robustness to dilution, droplet size analysis, and zeta potential.
The optimized ziprasidone-SNEDDS were used to prepare ziprasidone-SNEDDS
sustained-release pellets via extrusion-spheronization method. The pellets were
characterized by SEM, particle size, droplet size distribution, and zeta potential. In-vitro
drug release studies indicated the ziprasidone-SNEDDS sustained-release pellets showed
sustained release profiles with 90% released within 10 h. The ziprasidone-SNEDDS
sustained-release pellets were administered to fasted and fed beagle dogs and their
pharmacokinetics were compared to the commercial formulation of Zeldox as a control.
Pharmacokinetic studies in beagle dogs showed ziprasidone with prolonged actions and
enhanced bioavailability with no food effect was achieved simultaneously in ziprasidone-
SNEDDS sustained-release pellets compared with Zeldox in the fed state. The results
indicated a sustained release with prolonged actions of schizophrenia and bipolar disorder
treatment.
Banerjee S et al (2016) [151] developed a stable capsule formulation of ziprasidone
hydrochloride which can be administered without regards to food intake. The unstable
anhydrous form of ziprasidone hydrochloride was stabilized employing hot-melt extrusion
and further optimized by 32 central composite design. The formulation was optimized after
establishing acceptable ranges for response variables like disintegration time, dissolution
and impurity profile. A crossover fasted and fed in-vivo study was conducted in human

CHAPTER 2 REVIEW OF LITERATURE
74
volunteers to assess the food-effect of optimized formulation vis-à-vis the marketed brand.
The optimized formulation met in-house specifications for various response variables.
Further, high values of correlation coefficient which for the adequate selection of
experimental design and its high prognostic ability. No significant difference was observed
between the Cmax and AUC values after administration of the optimized formulation in
fasted and fed states. On the contrary, there was a statistically significant increase in the
Cmax and AUC values after oral administration of Zeldox in fed state in comparison to the
fasted state. The present study describes the successful development of a stable
formulation of 20 mg of ziprasidone devoid of any food-effects.
Thombre AG et al (2012) [152] prepared and characterized a solid nanocrystalline
dispersion (SNCD) to improve the oral absorption of ziprasidone in the fasted state,
thereby reducing the food effect observed for the commercial formulation. A solution of
ziprasidone hydrochloride and the polymer hydroxypropyl methylcellulose acetate
succinate (HPMCAS) was spray-dried to form a solid amorphous spray-dried dispersion
(SDD), which was then exposed to a controlled temperature and relative humidity (RH) to
yield the ziprasidone SNCD. The SNCD was characterized using powder X-ray diffraction,
thermal analysis, microscopy and in-vitro dissolution testing. These tools indicate the
SNCD consists of a high-energy crystalline form of ziprasidone in domains approximately
100 nm in diameter but with crystal grain sizes on the order of 20 nm. The SNCD was
dosed orally in capsules to beagle dogs. Pharmacokinetic studies showed complete fasted-
state absorption of ziprasidone, achieving the desired improvement in the fed/fasted ratio.
Miao Y et al (2016) [153] worked to develop ziprasidone–phospholipid complex (ZIP-
PLC) in sustained-release pellets to enhance the oral bioavailability and overcome the food
effect of ziprasidone. Ziprasidone–phospholipid complex was formulated by the solvent
evaporation method. The optimized ZIP-PLC was used to prepare ZIP-PLC sustained-
release pellets via extrusion–spheronization method. The pellets were characterized by in-
vitro drug-release studies and administered to fasted and fed beagle dogs and their
pharmacokinetics were compared with commercial formulation Zeldox capsule as a
control. The results of FTIR, SEM, DSC and PXRD studies confirmed the formation of
phospholipid complex. Solubility studies showed there was a higher solubility in water for
ZIP-PLC than monohydrate ziprasidone. The in-vitro release rate of ziprasidone from the
ZIP-PLC sustained-release pellet exhibited controlled-release characteristics with over

CHAPTER 2 REVIEW OF LITERATURE
75
95% total release in 12 h. Pharmacokinetic studies in beagle dogs showed ziprasidone with
prolong actions and no food effect was achieved simultaneously in ZIP-PLC sustained-
release pellet compared with Zeldox capsule. The results indicated a sustained release with
prolonged actions of schizophrenia and bipolar disorder treatment.
2.6 Review of patents related to selected project work
Robert B et al (1999) [154] patented drug carrier comprising particles of at least one pure
active compound which is insoluble, only sparingly soluble or moderately soluble in water,
aqueous media and/or organic solvents, wherein active ingredient is solid at room
temperature and has an average diameter, determined by photon correlation spectroscopy
(PCS) of 10 nm to 1,000 nm, the proportion of particles larger than 5 pm in the total
population being less than 0.1% (number distribution determined with a Coulter counter),
and when introduced into water, aqueous media and/or organic solvents, the active
compound has an increased saturation solubility and an increased rate of dissolution
compared with powders of the active compound prepared using an ultrasonic probe, a ball
mill or a pearl mill, the solid particles having been comminuted, without prior conversion
into a melt, by using cavitation or shearing and impact forces with introduction of a high
amount of energy.
Chen MJ et al (2011) [155] patented that compositions and methods for preparation and
administration of an oral nanosuspension of a poorly soluble drug with improved
bioavailability. The method was optimized through the microfluidization process with
water soluble polymeric excipients in the absence of surfactants.
Binner JGP (2010) [156] patented a method for concentrating a nanosuspension including
nanopowder particles suspended in a liquid includes reducing the liquid content of the
nanosuspension and controlling the dispersion of the nanopowder particles in the liquid.
Ferreiro MG et al (2012) [157] patented invention relates to a method for the production
of a nanoparticulate pharmaceutical composition. The method comprised the steps of
a) suspending in water a poorly soluble active ingredient without the presence of a
detergent, b) mechanically treating said suspension to obtain particles comprising the
active ingredient with an effective average size of less than about 5000 nm, c) contacting
said active ingredient or suspension with a first polyelectrolyte during, and/or before
mechanically treating, d) optionally contacting said suspension with a one or more second

CHAPTER 2 REVIEW OF LITERATURE
76
or further poly electrolytes during, before and/or after mechanically treating, e) optionally
drying said suspension. The invention also pertains to the pharmaceutical compositions
obtained by the method of the invention
Amarnath S et al (2012) [158] patented oral pharmaceutical compositions comprising
candesartan or its pharmaceutically acceptable salts, esters, solvates, hydrates,
enantiomers, polymorphs, or their mixtures, and processes for preparing the same are
described. Also described pharmaceutical formulations comprising compositions
containing candesartan or an ester thereof, processes for preparing the formulations and
methods of use, treatment, and administration involving the formulations.
Nakatani M et al (2004) [159] patented a pharmaceutical composition comprising 3 to 50
wt. % telmisartan dispersed in a dissolving matrix comprising: (a) a basic agent in a molar
ratio of basic agent: telmisartan of 1:1 to 10:1; (b) about 1 to 20 wt. % of a surfactant or
emulsifier; (c) 25 to 70 wt. % of a Water-soluble diluent; and (d) 0 to 20 wt. % of one or
more additional excipients and/or adjuvants; wherein the sum of all components is 100%,
methods of making wherein the sum of all components are 100%, methods of making such
pharmaceutical compositions, and their use.
Shah JC et al (2008) [160] patented pharmaceutical formulations comprising: a compound
selected from the group consisting of ziprasidone, having a maximum average particle
size; a carrier; and preferably at least two surface stabilizers are disclosed. The present
invention also comprises methods of treating psychosis with such a formulation and
processes for making such a formulation.
2.7 References
114. Arunkumar N, Deccaraman M, Rani C, Mohanraj KP and Venkates K, 2010,
Dissolution enhancement of Atorvastatin calcium by nanosuspension technology,
Journal of Pharmacy Research, 3(8), 1903, ISSN: 0974-6943.
115. Patel GV, Patel VB, Pathak A and Rajput SJ, 2014, Nanosuspension of efavirenz
for improved oral bioavailability: formulation optimization, in-vitro, in-situ and in-
vivo evaluation, Drug Development and Industrial Pharmacy, 40(1), 80–91, ISSN:
1520-5762.
116. Wahlstrom JL, Warren CJ, Wene SP, Albin LA, Smith ME, Chiang PC, Ghosh S,
and Roberds SL, 2007, Pharmacokinetic evaluation of a 1, 3-dicyclohexylurea
CHAPTER 2 REVIEW OF LITERATURE
77
nanosuspension formulation to support early efficacy assessment, Nanoscale
Research Letters, 2(6), 291–296, ISSN: 1556-276X.
117. Zhao J, Luo L, Fu Q, Guo B, Li Y, Geng Y, Wang J and Zhang T, 2016, Improved
oral bioavailability of Lacidipine using nanosuspension technology: inferior in-
vitro dissolution and superior in-vivo drug absorption versus Lacipil®, Current Drug
Delivery, 13(5), 764 – 773, ISSN: 1875-5704.
118. Anju Raju, Reddy AJ, Satheesh J and Jithan AV, 2014, Preparation and
characterization of nevirapine oral nanosuspensions, Indian Journal of
Pharmaceutical Sciences, 76(1), 62–71, ISSN: 0250-474X.
119. Xia D, Quan P, Piao H, Piao H, Sun S, Yin Y and Cui F, 2010, Preparation of
stable nitrendipine nanosuspensions using the precipitation–ultrasonication method
for enhancement of dissolution and oral bioavailability, European Journal of
Pharmaceutical Sciences, 40(4), 325–334, ISSN: 0928-0987
120. Liu D, Xu H, Tian B, Yuan K, Pan H, Ma S, Yang X and Pan W, 2012, Fabrication
of Carvedilol Nanosuspensions through the antisolvent precipitation–
ultrasonication method for the improvement of dissolution rate and oral
bioavailability, AAPS PharmSciTech, 13(1), 295-304, ISSN: 1530-9932.
121. Sahu BP and Das MK, 2014, Formulation, optimization and in-vitro/in-vivo
evaluation of furosemide nanosuspension for enhancement of its oral
bioavailability, Journal of Nanoparticle Research, 16(4), 2360, ISSN: 1572-896X.
122. Thadkala K, Nanam PK, Rambabu B, Sailu C and Aukunuru J, 2014, Preparation
and characterization of amorphous ezetimibe nanosuspensions intended for
enhancement of oral bioavailability, International Journal of Pharmaceutical
Investigation, 4(3), 131–137, ISSN: 2230-9713.
123. Bhalekar MR, Upadhaya PG, Reddy S, Kshirsagar SJ and Madgulkar AR, 2014,
Formulation and evaluation of acyclovir nanosuspension for enhancement of oral
bioavailability, Asian Journal of Pharmaceutics, 8(2), 110‑118, ISSN: 1998-409X.
124. Natarajan J, Subramanya NM, Venkatachalam S, Kuppusamy G and Kannan E,
2013, Studies on Physico-chemical and Pharmacokinetic Properties of Olanzapine
through Nanosuspension, Journal of Pharmaceutical Sciences and Research, 5(10),
196 – 202, ISSN: 0975-1459.
125. Sawant KK, Patel MH and Patel K, 2016, Cefdinir nanosuspension for improved
oral bioavailability by media milling technique: formulation, characterization and

CHAPTER 2 REVIEW OF LITERATURE
78
in vitro-in vivo evaluations, Drug Development and Industrial Pharmacy, 42(5),
758-68, ISSN: 1520-5762.
126. Patel Y, Poddar A, and Sawant KK, 2014, Improved oral bioavailability of
cefuroxime axetil utilizing nanosuspensions developed by media milling technique,
Pharmaceutical Nanotechnology, 2(2), 75-86, ISSN: 2211-7393.
127. Nagajyothi N, Dhanalakshmi M, Thenmozhi S, Natarajan R and Rajendran N,
2014, Formulation and evaluation of pitavastatin nanosuspension, International
Journal of Pharmacy and Life Sciences, 5(2), 3318-3324, ISSN: 0976-7126.
128. Shah SMH, Ullah F, Khan S, Shah SMM and Sadiq A, 2016, Combinative
precipitation ultrasonication approach for fabrication for stable artemisinin
nanosuspension, American-Eurasian Journal of Agriculture and Environmental
Sciences, 16(2), 390-401, ISSN: 1818-6769.
129. Shinde SS and Hosmani AH, 2014, Preparation and evaluation of nanosuspensions
for enhancing the dissolution of lornoxicam by antisolvent precipitation technique,
Indo American Journal of Pharmaceutical Research, 4(1), 398-405, ISSN: 2231-
6876.
130. Sahu BP and Das MK, 2014, Nanoprecipitation with sonication for enhancement of
oral bioavailability of furosemide, Acta Poloniae Pharmaceutica, 71(1), 129-137,
ISSN: 0001-6837.
131. Agarwal V and Bajpai M, 2014, Preparation and optimization of esomeprazole
nanosuspension using evaporative precipitation–ultrasonication, Tropical Journal of
Pharmaceutical Research, 13(4), 497-503, ISSN: 1596-9827.
132. Singh C, Tiwari V, Mishra CP, Shankar R, Sharma D and Jaiswal S, 2015,
Fabrication of Cefpodoxime Proxetil nanoparticles by solvent antisolvent
precipitation method for enhanced dissolution, International Journal of Research in
Pharmaceutical and Nano Sciences, 4(4), 217 – 235, ISSN: 2319-9563.
133. Kakran M, Sahoo GN, and Lin Li, 2015, Fabrication of nanoparticles of Silymarin,
Hesperetin and Glibenclamide by evaporative precipitation of nanosuspension for
fast dissolution, Pharmaceutica Analytical Acta, 6(1), 326-332, ISSN: 2153-2435.
134. Esfandi EH, Ramezania V, Vatanara A, Najafabadi AR and Moghaddam SPH,
2014, Clarithromycin dissolution enhancement by preparation of aqueous
nanosuspensions using sono-precipitation technique, Iranian Journal of
Pharmaceutical Research,13(3), 809-818, ISSN: 1726-6890.

CHAPTER 2 REVIEW OF LITERATURE
79
135. Ghasemian E, Rezaeian B, Alaei S, Vatanara A and Ramezani V, 2015,
Optimization of Cefixime Nanosuspension to improve drug dissolution,
Pharmaceutical Sciences, 21(Suppl 1), 136-144, ISSN: 2383-2886.
136. Zhang Z, Le Y, Wang J, Zhao H and Chen J, 2012, Irbesartan drug formulated as
nanocomposite particles for the enhancement of the dissolution rate, Particuology,
10(4), 462–467, ISSN: 1674-2001.
137. Suthar AK, Solanki SS and Dhanwani RK, 2011, Enhancement of dissolution of
poorly water-soluble raloxifene hydrochloride by preparing nanoparticles, Journal
of Advanced Pharmacy Education and Research, 2, 189-194, ISSN: 2249-3379.
138. Vishnu Priya P, Saritha BA, and Shravani T, 2016, Formulation and evaluation of
Irbesartan nanosuspension by the precipitation method, Der Pharmacia Lettre, 8(2),
502-510, ISSN: 0975-5071.
139. Zulal NA and Lakshmi PK, 2015, Enhancement of solubility and bioavailability of
Candesartan Cilexetil using natural p-glycoprotein inhibitors, Tropical Journal of
Pharmaceutical Research, 14(1), 21-26, ISSN: 1596-9827.
140. Beg S, Sharma G, Katare OP and Singh B, 2013, Optimized positively charged
self-nano-emulsifying systems of candesartan cilexetil with enhanced
bioavailability potential, Proceedings of the 3rd International Conference on
Nanotek and Expo, OMICS Group Conferences, Hampton Inn Tropicana, Las
Vegas, NV, USA, pp. 296.
141. Acharya A, Kiran Kumar GB, Ahmed MG and Paudel S, 2016, A novel approach
to increase the bioavailability of Candesartan Cilexetil by proniosomal gel
formulation: in-vitro and in-vivo evaluation, International Journal of Pharmacy and
Pharmaceutical Sciences, 8(1), 241-246, ISSN: 0975-1491.
142. Gurunath S, Nanjwade BK and Patila PA, 2014, Enhanced solubility and intestinal
absorption of candesartan cilexetil solid dispersions using everted rat intestinal
sacs, Saudi Pharmaceutical Journal, 22(3), 246–257, ISSN: 1319-0164.
143. Shaikh SM and Avachat AM, 2016, Enhancement of solubility and permeability of
Candesartan Cilexetil by using different pharmaceutical interventions, Current
Drug Delivery, 13(8), 346-353, ISSN: 1875-5704.
144. Kothawade PC, Belgamwar VS, and Deshmukh SA, 2013, Solid Dispersions of
Telmisartan for enhancing solubility, dissolution rate and oral bioavailability, Indo
American Journal of Pharmaceutical Research, 3(9), 7035-7045, ISSN: 2231-6876.
CHAPTER 2 REVIEW OF LITERATURE
80
145. Patel JM, Dhingani A, Garala K, Raval MK and Sheth NR, 2014, Design and
development of solid nanoparticulate dosage forms of telmisartan for
bioavailability enhancement by integration of experimental design and principal
component analysis, Powder Technology, 258, 331–343, ISSN: 0032-5910.
146. Cao Y, Shi LL, Cao QR, Yang M and Cui JH, 2016, In-Vitro characterization and
oral bioavailability of organic solvent-free solid dispersions containing telmisartan,
Iranian Journal of Pharmaceutical Research, 15(2), 385-394, ISSN: 1726-6890.
147. Padia N, Shukla A, and Shelat P, 2015, Development and characterization of
telmisartan self-micro emulsifying drug delivery system for bioavailability
enhancement, Journal of Scientific and Innovative Research, 4(3), 153-164, ISSN:
2320 – 4818.
148. Ahmad J, Kohli K, and Showkat RM, 2011, Formulation of self-nano emulsifying
drug delivery system for telmisartan with improved dissolution and oral
bioavailability, Journal of Dispersion Science and Technology, 32(7), 958-968,
ISSN: 0193-2691.
149. Charman SA, Charman WN, Rogge MC, Wilson TD, Dutko FJ and Pouton CW,
1992, Self-emulsifying drug delivery systems: formulation and biopharmaceutic
evaluation of an investigational lipophilic compound, Pharmaceutical Research,
9(1), 87-93, ISSN: 1573-904X.
150. Miao Y and Ren L, 2016, Characterization and evaluation of self-nano emulsifying
sustained-release pellet formulation of ziprasidone with enhanced bioavailability
and no food effect, Drug Delivery, 23(7), 2163-2172, ISSN: 1521-0464.
151. Banerjee S, Ravishankar K and Prasad RY, 2016, Formulation development and
systematic optimization of stabilized ziprasidone hydrochloride capsules devoid of
any food effect, Pharmaceutical Development and Technology, 21(7) 775-786,
ISSN: 1097-9867.
152. Thombre AG, Caldwell WB, Friesen DT, McCray SB and Sutton SC, 2012, Solid
nanocrystalline dispersions of ziprasidone with enhanced bioavailability in the
fasted state, Molecular Pharmaceutics, 9(12), 3526-3534, ISSN: 1543-8384.
153. Miao Y, Chen G, Ren L, Ouyang P, 2016, Preparation and evaluation of
ziprasidone–phospholipid complex from sustained-release pellet formulation with
enhanced bioavailability and no food effect, Journal of Pharmacy and
Pharmacology, 68(2), 185–194, ISSN: 2042-7158.

CHAPTER 2 REVIEW OF LITERATURE
81
154. Robert B, Bernd K, Muller RH and Peters K (1999) Pharmaceutical
nanosuspensions for medicament administration as systems with increased
saturation solubility and rate of solution, US Patent 5858410.
155. Chen MJ, Hui HW, Lee T, Paul K and Surapaneni S (2011) Nanosuspension of a
poorly soluble drug via microfluidization process, US Patent 20110124702.
156. Binner JGP L (2010) Method for concentrating nanosuspensions, EP1912898.
157. Ferreiro MG, Dunmann C, Kroehne L and Voigt A (2012) Nano-particulate
compositions poorly soluble compounds, US Patent 20120058151.
158. Amarnath Suseendharnath, Venkatesh Madhavacharya Joshi, Sunil Reddy Beeram,
Venkateswarlu Vobalaboina, Harshal Prabhakar Bhagwatwar and Manish Chawla
(2012) Candesartan pharmaceutical compositions. WO2012033983 A2
159. Nakatani M, Takeshi S, Ohki T and Toyoshima K (2004) Solid Telmisartan
Pharmaceutical Formulations. US Patent 20040110813A1.
160. Shah JC, Shah PS, Wisniecki P and Wagner DR (2008) Injectable depot
formulations and methods for providing sustained release of nanoparticle
compositions, US Patent 20080193542A1.

EXPERIMENTAL

CHAPTER 3 Experimental
83
CHAPTER – 3
Experimental
3.1 List of materials used for the study
TABLE 3.1: List of materials used for the study
Use Material Grade Manufacturer
Drugs Candesartan
Cilexetil (CC)
USP Gift Sample from Alembic Research
Centre, Vadodara
Telmisartan (TM) USP Gift Sample from Alembic Research
Centre, Vadodara
Ziprasidone
Hydrochloride
Monohydrate (ZH)
USP Gift Sample from Amneal
Pharmaceuticals, Ahmedabad
Stabilizer Poloxamer 188
AR Grade Gift Sample from Astron Research
Centre, Ahmedabad
Poloxamer 407 AR Grade Gift Sample from Astron Research
Centre, Ahmedabad
Polyvinyl alcohol AR Grade Loba Chemie Pvt. Ltd., Mumbai
PVP K30 AR Grade S. D. Fine Chemicals, Mumbai
Sodium Lauryl
Sulphate
AR Grade Himedia Laboratories Pvt. Ltd.,
Mumbai
Solvent Dichloromethane AR Grade Chemdyes Corporation, Rajkot
Ethanol AR Grade Shree Chaltan Vibhag Khand Udyog
Sahkari Mandli Ltd., Surat
Methyl alcohol AR Grade Finnar Chemicals, Ahmedabad
2-Propanol AR Grade ACS Chemicals, Ahmedabad
Butanol AR Grade Astron Chemicals, Ahmedabad
Ethyl Acetate AR Grade ACS Chemicals, Ahmedabad
Dimethyl sulphoxide AR Grade Chemdyes Corporation, Rajkot
Cryoprotectant Mannitol AR Grade Merck Specialities Pvt. Ltd., Mumbai

CHAPTER 3 Experimental
84
3.2 List of equipments used for the study
TABLE 3.2: List of equipments used for the study
Sr. No. Equipments Model/ Make
1 Digital weighing balance Shimadzu AUX 220, Japan
2 Overhead stirrer Remi Equipments Pvt. Ltd., India
3 Bath sonicator Bransone Ulrasonic Corporation, USA
4 Probe sonicator Frontline Electronics and Machinery Pvt. Ltd, India
5 UV spectrophotometer Shimadzu UV 1800, Japan
6 Cooling microcentrifuge C24BL Remi Equipments Pvt. Ltd., India
7 FTIR spectrophotometer Shimadzu 8400, Japan
8 Particle sizr analysier Zetatrac, Microtrac, USA
9 Magnetic stirrer 2 LH Remi Equipments Pvt. Ltd., India
10 Digital Water bath Bio-Tech, India
11 Differential scanning calorimeter Shimadzu DSC, TA-60WS, Japan
12 Scanning electron microscope ZEISS International, Germany
13 Lyophilizer Thermo Scientific, Japan
3.3 Scanning and calibration curve preparation of drugs
3.3A Scanning and calibration curve preparation of candesartan cilexetil
For estimation of drug content in candesartan cilexetil nanosuspension, a calibration curve
was prepared in methanol as candesartan cilexetil is having a solubility in methanol. [81]
For estmination of cumulative percentage drug release of candesartan cilexetil
nanosuspension, 0.05M phosphate buffer, pH 6.5 containing 0.7% v/v polysorbate 20 was
taken as dissolution media. [161]
3.3A.1 Scanning and calibration curve preparation of candesartan cilexetil in
methanol
A standard stock solution (100 μg/ml) of candesartan cilexetil was prepared by accurately
weighing 10 mg of candesartan cilexetil and dissolved in 5 ml of methanol in a 100 ml
volumetric flask. It was sonicated for 5 mins and the volume was made up to 100 ml with
methanol. From the standard stock solution, candesartan cilexetil (10 μg/ml) solution was
prepared in methanol and UV-scan was taken between a wavelength range of 200 - 400
nm and a wavelength showing maximum absorbance was selected as λmax for further
analytical work.

CHAPTER 3 Experimental
85
From the standard stock solution (100 μg/ml), appropriate aliquots were taken into
different volumetric flasks of 10 ml and made up to 10 ml with methanol, so as to get the
concentration of 5-30 μg/ml. The absorbance of these solutions was measured at selected
λmax. The experiment was performed in triplicate to validate the calibration curve. A
calibration curve was constructed by plotting absorbance vs. concentration (µg/ml).
3.3A.2 Scanning and calibration curve preparation of candesartan cilexetil in 0.7%
v/v polysorbate 20 in 0.05 M phosphate buffer, pH 6.5.
A standard stock solution (100 μg/ml) of candesartan cilexetil was prepared by accurately
weighing 10 mg of candesartan cilexetil and dissolved in 5 ml of 0.05M phosphate buffer,
pH 6.5 containing 0.7% v/v polysorbate 20 in a 100 ml volumetric flask. It was sonicated
for 5 mins and the volume was made up to 100 ml with 0.05M phosphate buffer, pH 6.5
containing 0.7% v/v polysorbate 20. From the standard stock solution, candesartan
cilexetil (10 μg/ml) solution was prepared in 0.05M phosphate buffer, pH 6.5 containing
0.7% v/v polysorbate 20 and UV-scan was taken between a wavelength range of 200-400
nm and a wavelength showing maximum absorbance was selected as λmax for further
analytical work.
From the standard stock solution (100 μg/ml), appropriate aliquots were taken into
different volumetric flasks of 10 ml and made up to 10 ml with 0.05 M phosphate buffer,
pH 6.5 containing 0.7% v/v polysorbate 20, so as to get the concentration of 4-16 μg/ml.
The absorbance of these solutions was measured at selected λmax. The experiment was
performed in triplicate to validate the calibration curve. A calibration curve was
constructed by plotting absorbance vs. concentration (µg/ml).
3.3B Scanning and calibration curve preparation of telmisartan
For estimation of drug content in telmisartan nanosuspension, a calibration curve was
prepared in methanol as telmisartan is having a solubility in methanol. [93] For estimation
of cumulative percentage drug release of telmisartan nanosuspension, phosphate buffer,
pH 7.5 was taken as dissolution media. [162]
3.3B.1 Scanning and calibration curve preparation of telmisartan in methanol
A standard stock solution (100 μg/ml) of telmisartan was prepared by accurately weighing
10 mg of telmisartan and dissolved in 5 ml of methanol in a 100 ml volumetric flask. It
CHAPTER 3 Experimental
86
was sonicated for 5 mins and the volume was made up to 100 ml with methanol. From the
standard stock solution, telmisartan (10 μg/ml) solution was prepared in methanol and UV-
scan was taken between a wavelength range of 200- 400 nm and a wavelength showing
maximum absorbance was selected as λmax for further analytical work.
From the standard stock solution (100 μg/ml), appropriate aliquots were taken into
different volumetric flasks of 10 ml and made up to 10 ml with methanol, so as to get the
concentration of 2-20 μg/ml. The absorbance of these solutions was measured at λmax. The
experiment was performed in triplicate to validate the calibration curve. A calibration
curve was constructed by plotting absorbance vs. concentration (µg/ml).
3.3B.2 Scanning and calibration curve preparation of telmisartan in phosphate
buffer, pH 7.5.
A standard stock solution (100 μg/ml) of telmisartan was prepared by accurately weighing
10 mg of telmisartan and dissolved in 5ml of phosphate buffer, pH 7.5 in a 100 ml
volumetric flask. It was sonicated for 5 mins and the volume was made up to 100 ml with
phosphate buffer, pH 7.5. From the standard stock solution, telmisartan (10 μg/ml)
solution was prepared in phosphate buffer, pH 7.5 and UV-scan was taken between a
wavelength range of 200-400 nm and a wavelength showing maximum absorbance was
selected as λmax for further analytical work.
From the standard stock solution (100 μg/ml), appropriate aliquots were taken into
different volumetric flasks of 10 ml and the volume was made up to 10 ml with phosphate
buffer, pH 7.5, so as to get the concentration of 2-20 μg/ml. The absorbance of these
solutions was measured at selected λmax. The experiment was performed in triplicate to
validate the calibration curve. A calibration curve was constructed by plotting absorbance
vs. concentration (µg/ml).
3.3C Scanning and calibration curve preparation of ziprasidone hydrochloride
For estimation of drug content in ziprasidone hydrochloride nanosuspension, a calibration
curve was prepared in methanol as ziprasidone hydrochloride is having a solubility in
methanol. [105] For estimation of cumulative percentage drug release of ziprasidone
hydrochloride nanosuspension, 0.05M sodium phosphate buffer, pH 7.5 containing 2%
w/w sodium dodecyl sulfate (SDS) it was taken as dissolution media. [163]

CHAPTER 3 Experimental
87
3.3C.1 Scanning and calibration curve preparation of ziprasidone hydrochloride in
methanol
A standard stock solution (100 μg/ml) of ziprasidone hydrochloride was prepared by
accurately weighing 10 mg of ziprasidone hydrochloride and dissolved in 5 ml of methanol
in a 100 ml volumetric flask. It was sonicated for 5 mins and the volume was made up to
100 ml with methanol. From the standard stock solution, ziprasidone hydrochloride
(10 μg/ml) solution was prepared in methanol and UV-scan was taken between a
wavelength range of 200-400 nm and a wavelength showing maximum absorbance was
selected as λmax for further analytical work.
From the standard stock solution (100 μg/ml), appropriate aliquots were taken into
different volumetric flasks of 10 ml and made up to 10 ml with methanol, so as to get the
concentration of 10-60 μg/ml. The absorbance of these solutions was measured at λmax. The
experiment was performed in triplicate to validate the calibration curve. A calibration
curve was constructed by plotting absorbance vs. concentration (µg/ml).
3.3C.2 Scanning and calibration curve preparation of ziprasidone hydrochloride in
0.05M sodium phosphate buffer, pH 7.5 containing 2%w/w SDS
A standard stock solution (100 μg/ml) of ziprasidone hydrochloride was prepared by
accurately weighing 10 mg of ziprasidone hydrochloride and dissolved in 5 ml of 0.05M
sodium phosphate buffer, pH 7.5 containing 2%w/w SDS in a 100 ml volumetric flask. It
was sonicated for 5 mins, the volume was made up to 100 ml with 0.05M sodium
phosphate buffer, pH 7.5 containing 2%w/w SDS. From the standard stock solution,
ziprasidone hydrochloride (10 μg/ml) solution was prepared in 0.05M sodium phosphate
buffer, pH 7.5 containing 2%w/w SDS and UV-scan was taken between a wavelength
range of 200-400 nm and a wavelength showing maximum absorbance was selected as
λmax for further analytical work.
From the standard stock solution (100 μg/ml), appropriate aliquots were taken into
different volumetric flasks of 10ml and the volume was made up to 10 ml with 0.05M
sodium phosphate buffer, pH 7.5 containing 2%w/w SDS, so as to get the concentration of
10-60 μg/ml. The absorbance of these solutions was measured at selected λmax. The
experiment was performed in triplicate to validate the calibration curve. A calibration
curve was constructed by plotting absorbance vs. concentration (µg/ml).

CHAPTER 3 Experimental
88
3.4 Selection of solvent and antisolvent
The solubility of selected drugs was studied in different solvents and their combinations.
Selection of good and poor solvent was done based upon the solubility of the drug in
respective solvents. About 10 mg of drug was added to 10 ml of solvent in specific gravity
bottles. This amount was sufficient to obtain a saturated solution. These specific gravity
bottles were shaken at 100 RPM for 24 h at 25ºC by keeping in a cryostatic constant
temperature reciprocating shaker bath. The bottles were then opened and solutions were
filtered with the help of Whatman filter paper (0.22 µm). The absorbance of the solution
was measured at the respective λmax of the drugs. This method was repeated for three times.
[164]
3.5 Preparation of nanosuspension by antisolvent precipitation-ultrasonication
method
Nanosuspension was prepared by the precipitation–ultrasonication method. The drug was
dissolved in methanol by sonication for 5 mins at room temperature. Different stabilizers
were dissolved in water to obtain a series of antisolvent. Both solutions were passed
through a 0.45µm filter. The antisolvent was cooled to 3°C in an ice-water bath. Then,
drug solution was quickly introduced by means of a syringe positioned with the needle
directly into stabilizer solution into 40 ml of the pre-cooled antisolvent at different stirring
speed under overhead stirrer to allow the volatile solvent to evaporate at room temperature
for 4-5 hours. After precipitation of antisolvent, the sample was immediately transferred to
a test tube and was treated with an ultrasonic probe at different time lengths (in mins). The
probe with a tip diameter of 6 mm was immersed in the liquid, resulting in the wave
traveling downwards and reflecting upwards. Batch size for preparation of nanosuspension
was taken 40 ml.[119]
3.6 Lyophilization of nanosuspension of optimized batch
Nanosuspension was converted into the dry powder using mannitol (1:1, Total solid:
Cryoprotectant) as a cryoprotectant by using lyophilizer. In lyophilization process sample
was kept in the chamber and temperature maintained at -80°C for 8 h. After the 6-8 h
nanosuspension was converted into the dry powder and removed from the chamber and
placed in an airtight container for further work.

CHAPTER 3 Experimental
89
3.7 Selection of stabilizer
Different stabilizers like Polyvinyl Alcohol, PVP K-30, Sodium Lauryl Sulphate,
Poloxamer 188 and Poloxamer 407 were screened by preparing nanosuspensions and
measuring their saturation solubility, mean particle size, polydispersity index (PDI) and
zeta potential for selection of the best one which can be utilized for further research work.
[165]
3.8 Drug-excipient compatibility study
Studies of drug-excipient compatibility represent an important phase in the preformulation
stage of the development of all dosage forms. The potential physical and chemical
interactions between drugs and excipients can affect the chemical, physical, therapeutical
properties and stability of the dosage form. FTIR and DSC study were selected for
checking of drug-excipient compatibility study.
3.8.1 Fourier transformed infrared (FTIR) spectroscopy
FTIR spectroscopy was conducted using a Shimadzu FTIR 8400 Spectrophotometer
(Shimadzu, Tokyo, Japan) and the spectrum was recorded in the wavelength region of
4000–400 cm-1. The procedure consisted of dispersing sample (drug, stabilizer, physical
mixture) by KBr pellet method. The pellet was placed in the light path and the spectrum
was recorded.
3.8.2 Differential scanning calorimetry (DSC)
DSC was performed using DSC-60 (Shimadzu, Tokyo, Japan) calorimeter to study the
thermal behavior of the sample (drug, stabilizer, physical mixture and lyophilized
nanosuspension). The instrument comprised of the calorimeter (DSC 60), flow controller
(FCL60), the thermal analyzer (TA 60WS) and operating software (TA 60). The samples
were heated in hermetically sealed aluminum pans under air atmosphere at a scanning rate
of 10°C/min from 30°C to 330°C in an air atmosphere. Empty aluminum pan was used as a
reference.

CHAPTER 3 Experimental
90
3.9 Plackett-Burman Design [166]
The Plackett-Burman design is suitably used to screen a large number of factors believed
to be affecting important product characteristics or attributes and is generally used during
the initial phase of the study. By review of the literature, five factors were selected to affect
the quality of nanosuspension. To identify which factor has its prominent effect on quality,
stability as well as the efficacy of the nanosuspension, the plackett-burman design was
used. A total of 8 experiments (preliminary screening formulations) were generated for
screening of five independent factors namely amount of drug in mg (X1), amount of
stabilizer in mg (X2), solvent to antisolvent volume ratio (X3), stirring speed in rpm (X4)
and sonication time in min (X5) for the all three drugs. Saturation solubility in µg/ml (Y1)
and mean particle size in nm (Y2) were selected as dependent factors.
The net effect of an individual factor was calculated from the value of evaluated
parameters from following equations,
Effect of X1 = [(Y1+Y4+Y6+Y7)-(Y2+Y3+Y5+Y8)]/8 Eq...(3.1)
Effect of X2 = [(Y1+Y2+Y5+Y7)-(Y3+Y4+Y6+Y8)]/8 Eq...(3.2)
Effect of X3 = [(Y1+Y2+Y3+Y6)-(Y4+Y5+Y7+Y8)]/8 Eq...(3.3)
Effect of X4 = [(Y2+Y3+Y4+Y7)-(Y1+Y5+Y6+Y8)]/8 Eq...(3.4)
Effect of X5 = [(Y1+Y3+Y4+Y5)-(Y2+Y6+Y7+Y8)]/8 Eq...(3.5)
After getting net effect of individual parameters two key parameters were identified which
had maximum effect on product characteristics. These two parameters can be selected for
product optimization by factorial design and other three parameters can be optimized by
trial and error method.
3.10 Optimization of other preliminary parameters
Preliminary parameters were optimized by varying one parameter at a time while keeping
others constant, so that effect of varied parameters could be evaluated. Each batch was
repeated thrice (n=3) for the confirmation of repeatability. The parameters were optimized
to achieve minimum particle size and maximum saturation solubility. Optimized
parameters were,

CHAPTER 3 Experimental
91
Solvent to antisolvent volume ratio (1:4, 1:6, 1:8),
Amount of stabilizer (30 mg, 40 mg, 50 mg),
Stirring speed (800RPM, 1000RPM, 1200RPM),
Sonication time (10 min, 20 min, 30 min) etc.
3.11 Factorial design for optimization of key parameters
A 32 factorial design was applied for optimization of key parameters of the drugs, like for
candesartan cilexetil amount of drug in mg and solvent to antisolvent volume ratio,
[167,168] while for telmisartan and ziprasidone hydrochloride amount of drug in mg and
stirring speed. [61] Both particle size and saturation solubility, [additionally CPR at
15 mins in ziprasidone hydrochloride nanosuspension] important features of
nanosuspension considered to play a significant role in the formulation performance, were
taken as dependent parameters in this study. Multiple regression analysis, contour plots
and 3D response surface plots were used to study the main and interaction effects of the
variables on the dependent factors. The numbers of experiments required in factorial
design studies were dependent on the number of independent variables selected and the
number of levels at which they were studied. The response was measured for each trial and
then either simple linear equation (1), or interactive equation (2) or quadratic (3) model
was fitted by carrying out multiple regression analysis and F-statistics to identify
statistically significant terms.
Y = b0 + b1X1 + b2X2 Eq...(3.6)
Y= b0 + b1X1 + b2X2 + b12X1X2 Eq...(3.7)
Y= b0 + b1X1 + b2X2 + b11X12 + b22X2
2 + b12X1X2 Eq...(3.8)
Where, Y is the dependent variable, while b0 is the intercept, bi (b1 and b2), bij (b12)
represents the regression coefficient for the second order polynomial equation and Xi
represents the levels of independent formulation variables. Mathematical modeling was
carried out by using equation (3.8) to obtain a second order polynomial equation.[169] The
values of dependent variable obtained at various levels of two independent variables (X1
and X2) were subjected to multiple regressions to yield a second order polynomial
equation. The main effects of X1 and X2 represent the average result of changing one
variable at a time from its low to high value. The interaction (X1X2) shows how the particle
size and saturation solubility changed when two variables were simultaneously changed.
CHAPTER 3 Experimental
92
3.12 Checkpoint analysis
A checkpoint analysis was performed to confirm the utility of established response surface
plots and contour plots in the preparation of nanosuspension. Values of independent
variables (X1 and X2) were selected and corresponding values of dependent variables were
calculated by substituting the values in the reduced polynomial equation. Nanosuspensions
were prepared experimentally by taking the amounts of the independent variables (X1 and
X2) on the same checkpoints. Checkpoint cum optimized batch was prepared three times
and mean values were determined. The difference of theoretically computed values of
particle size, as well as saturation solubility and the mean values of experimentally
obtained for both responses, were compared.
3.13 Evaluation of nanosuspensions
3.13.1 Particle size and PDI
Mean particle size and size distribution (polydispersity index) of the prepared
nanosuspension was determined by using Zetasizer [Zetatrac, Microtrac, Japan] which
follows the principle of light diffraction, also called Photon Correlation Spectroscopy
(PCS). Prior to the measurement, the samples were appropriately diluted with water to a
suitable scattering intensity and re-dispersed by shaking before measurement.[129]
3.13.2 Zeta potential
The Zeta potential is a measure of the electric charge at the surface of the particles,
indicating the physical stability of colloidal systems. The zeta potential values higher than
|30mV| indicate long-term electrostatic stability of aqueous dispersions. In this study, the
Zeta Potential was assessed by determining the electrophoretic mobility of the particles
using Zetasizer [Zetatrac, Microtrac, Japan].[129]
3.13.3 Drug content
An aliquot (1ml) of the prepared nanosuspension was diluted in methanol and filtered with
a 0.2 μm filter. Total drug content was determined by UV spectrophotometer at λmax of the
drug. Formula: [170]
Total Drug Content = (Total volume of nanosuspension × amount of drug in aliquot)
Volume of aliquot Eq...(3.9)

CHAPTER 3 Experimental
93
3.13.4 Saturation solubility
The saturation solubility of prepared nanosuspension was performed by filling it in a vial
and kept for 48 h stirring with the help of magnetic stirrer at 100 RPM to ensure saturation.
Then 2 ml of nanosuspension was filled in an eppendorf tube and centrifuged at 10,000
RPM for 30 minutes. The supernatant was filtered through a 0.2μm syringe filter and
analyzed by UV-visible spectrophotometer [UV-1800, Shimadzu, Japan] at λmax of the
drug after suitable dilution with dissolution media which was used as a blank. Triplicate
analysis of each sample was carried out. By using the calibration curve, saturation
solubility was calculated. [171]
3.13.5 In-vitro dissolution study
An in-vitro dissolution study was performed using USP 24 paddle instrument
(ELECTROLAB TDT-06P). The dissolution medium was taken as per Table 3.3. To
minimize foaming of the medium during the experiment, the medium was gently
transferred into the dissolution vessel. Dissolution was performed at 37ºC, using a paddle
speed specified in following Table 3.3. Nanosuspension equivalent to a dose of the drug
was added to the dissolution vessels. 5 ml samples were withdrawn at a specific time
interval of 2, 4, 6, 8, 10, 15, 30, 45, 60 mins and filtered immediately through 0.2 μm
syringe filter and analyzed spectrophotometrically. Subsequently, 5 ml of fresh medium
was added to the dissolution vessel. The experiments were performed in triplicate and the
mean values were reported.[172]
TABLE 3.3: Dissolution conditions for nanosuspensions [161–163]
Dissolution
Condition
Candesartan Cilexetil
Nanosuspension
Telmisartan
Nanosuspension
Ziprasidone Hydrochloride
Nanosuspension
Dissolution media 0.05M Phosphate buffer
pH 6.5, containing
0.7% v/v Polysorbate 20
Phosphate buffer
pH 7.5
0.05M Sodium Phosphate
buffer, pH 7.5 containing
2% w/w SDS
Volume of
Dissolution media
250 900 900
Speed in RPM 50 75 75
Sampling Intervals 2, 4, 6, 8, 10, 15, 30, 45,
60mins
2, 4, 6, 8, 10, 15,
30, 45, 60mins
2, 4, 6, 8, 10, 15, 30, 45,
60mins
Dose of drug 16mg 40mg 20mg

CHAPTER 3 Experimental
94
3.13.6 Scanning electron microscopy (SEM)
The surface characteristics of lyophilized nanosuspensions of all three drugs were studied
by Scanning electron microscopy (EVO-18, ZEISS, Germany) at 3kx to 28kx. The samples
were mounted on double-sided carbon adhesive tape that has previously been secured on
brass stubs and then subjected to gold coating by sputter coater, using process current of 10
mA for 4mins. The accelerating voltage was 15 kV.
3.13.7 Residual solvent by gas – chromatography (GC)
Residual solvents are considered as critical impurities because they may cause serious
toxicity and safety issues. For the control of residual solvents, ICH Q3C guideline provides
specific criteria for Class-1, Class-2, and Class-3 solvents. [173]
Residual solvent in lyophilized nanosuspension was analyzed by gas chromatography
using head-space sampler. For that accurately weighed 50 mg lyophilized nanosuspension
was dissolved in dimethylformamide (DMF). Subsequently, the prepared solution was
analyzed using gas chromatography. GC-HS chromatograms of a standard solution of
methanol and lyophilized nanosuspension were taken. Retention time for a peak
corresponds to the methanol in a standard solution of methanol and sample solution of
lyophilized nanosuspension were obtained and compared.
Method of Headspace gas chromatography
The analysis was carried out by using Perkin Elmer’s Clarus 500 gas chromatography with
flame ionization detector. Dimethylformamide (DMF) was used as diluents.
Preparation of blank solution
Blank solution was prepared by transferring 5 ml of diluent into a headspace vial,
Polytetrafluoroethylene (PTFE) butyl septum was closed and sealed with aluminum crimp
cap.
Preparation of standard solution
Accurately measured 10 µl of methanol was mixed in dimethyl sulfoxide and volume was
made to 5 ml with dimethyl sulfoxide. This solution was transferred into a headspace vial,
PTFE butyl septum was closed and sealed with aluminum crimp cap.

CHAPTER 3 Experimental
95
Preparation of sample solution
Accurately weighed 50 mg of lyophilized nanosuspension of candesartan cilexetil was
transferred accurately into headspace vial and 5 ml of dimethyl sulfoxide was added to it.
PTFE butyl septum was closed and sealed with aluminum crimp cap. It was vortexed for 5
mins.
Procedure for gas chromatography
By following above-mentioned procedure, 1 vial for a blank solution, 3 vials for the
standard solution, and 2 vials for the sample was prepared. These sealed vials were placed
in the sample magazine and headspace analyzer was started to run. Peaks were measured
and chromatograms were recorded. Amount of residual methanol was calculated by using
following formula : [174,175]
Amount of organic solvent (ppm) = (AT/ AS) x (W/ T) x 106 Eq...(3.10)
Where,
AT = Average area count of peak in the sample solution chromatogram.
AS = Average area count of the peak in the standard solution chromatogram.
W = Concentration in mg of standard sample
T = Weight in mg of test sample
Instrument: Perkin Elmer Clarus 500
Column: ZB-624 30m*0.53mm*3um
Oven program
Initial Temp : 35°C, Hold 3.00 min
Rate : 25 deg/min to 120°C holds for 5.00 min
Split ratio : 20:1
Detector : 250°C
Injector temperature : 150°C
Carrier gas : N2
CHAPTER 3 Experimental
96
Headspace condition
Oven : 90°C
Needle : 95°C
Transfer Line : 100°C
Thermostat : 30 min
3.13.8 Accelerated Stability study as per ICH Guidelines
Accelerated stability studies of lyophilized nanosuspension were conducted at 25 ± 2°C
and 60 ± 5% RH for 6 months as per ICH guidelines. Lyophilized nanosuspension was
encapsulated in hard gelatin capsules. At periodic time intervals (0, 1, 3 and 6 months), the
samples were withdrawn and analyzed for particle size, saturation solubility, % CPR at 2
min and % w/w of drug content. [176]
3.14 Bioavailability study
3.14.1 Study objective
To study the oral bioavailability study of poorly water-soluble selected drugs after
converting it into nanosuspension
To study possible pharmacokinetic parameters of drugs formulated in
nanosuspension dosage form.
To compare the bioavailability of optimized batch of nanosuspensions with
available marketed preparation.
3.14.2 Experimental procedure
The total study protocol was divided into three parts each for one selected drug.
Part –A: Candesartan Cilexetil Nanosuspension
Part –B: Telmisartan Nanosuspension
Part –C: Ziprasidone Hydrochloride Nanosuspension
3.14.3 Selection of animals
Wister rats of either sex with an average weight of 200 ± 20 gm or age ~ 10 weeks (on the
day of study) were procured in order to investigate the pharmacokinetic behavior of
nanosuspensions. The study was approved by Institutional Ethics Committee of
Department of Pharmaceutical Sciences, Saurashtra University, Rajkot, Gujarat, India

CHAPTER 3 Experimental
97
(CPCSEA No: IAEC/DPS/SU/1508, Dated: 04/06/2015) and the guidelines were followed
throughout the study. All the rats were acclimatized to a temperature (20 ± 2°C) and
relative humidity (45 ± 15%RH), with a 12 hr light/dark cycle over a period of 5 days prior
to administration of the drug. During this acclimatization period, the animals were
carefully observed to ensure their good health and suitability for inclusion in the study. For
all rats, a standard laboratory diet (Pranav Agromart Ltd, Baroda, India) and domestic
mains tap water were available ad libitum. The animals were disconnected from the diet at
least 12 h before dosing. During study periods, rats were housed singly in polypropylene
and stainless steel cages. [177,178] One group of rats for optimized nanosuspension
formulation and one group of rats for marketed formulation were taken.
Group-I: 6 Rats for the optimized nanosuspension formulation
Group-II: 6 Rats for the marketed formulation
3.14.4 Dosing Details
TABLE 3.4: Dosing details for bioavailability study
Group Treatment Animals
Per
group
Blood
collection
time points
(h)
Dose
(mg/kg)
[179]
Route of
administration
1 Candesartan Cilexetil
Nanosuspension (CCNS)
6 0.25,0.5,1,2,
4, 6,8,12,24
1.65mg/kg Oral
2 Marketed formulation of
Candesartan Cilexetil
(Atacand®) (CCMKT)
6 0.25,0.5,1,2,
4,6,8,12,24
1.65mg/kg Oral
3 Telmisartan Nanosuspension
(TMNS)
6 0.25,0.5,1,2,
4,6,8,12,24
4.11mg/kg Oral
4 Marketed formulation of
Telmisartan (Inditel® 40)
(TMMKT)
6 0.25,0.5,1,2,
4,6,8,12,24
4.11mg/kg Oral
5 Ziprasidone Hydrochloride
Nanosuspension (ZHNS)
6 0.25,0.5,1,2,
4,6,8,12
2.05mg/kg Oral
6 Marketed formulation of
Ziprasidone Hydrochloride
(Zipsydon® 20) (ZHMKT)
6 0.25,0.5,1,2,
4,6,8,12
2.05mg/kg Oral
3.14.4 Collection of blood samples
A blood sample was collected from the retro-orbital plexus of anesthetized rats with
diethyl ether. For zero time analysis, a blood sample was withdrawn before administration
of the drug and after administration, blood samples were collected at the specific intervals.
Samples were collected as per above-mentioned Table 3.4 for each group. Blood was

CHAPTER 3 Experimental
98
collected in such a quantity to get 0.5 ml plasma from it at each time point. The collected
sample was analyzed by the suitable analytical method. Maximum blood concentration
(Cmax) and time to achieve Cmax (Tmax) was calculated from concentration-time curve data.
The area under the concentration-time curve (AUC0→24) was calculated to the last blood
concentration. These parameters and other pharmacokinetic parameters were calculated by
Microsoft Excel® version 2013 (Microsoft Corporation, Washington, USA). Reduction of
dose to reach Cmax of the marketed formulation was also calculated.
3.14.6A Bioanalytical method for candesartan cilexetil nanosuspension
A Liquid Chromatograph Mass Spectroscopy (LC/MS/MS) system equipped with
Shimadzu LC SOLUTION (5.53 SP3C) was employed for the present investigation. The
system consisted of Shimadzu LC-20ADvp as a binary solvent delivery system, Shimadzu
SIL-20AC Auto Sampler, Shimadzu HPLC-ESI-MS/MS injector and MS/MS 8030
detector as a source of detection.
Chromatographic conditions
Mobile phase : Methanol and Acetonitrile (5 mM Ammonium Acetate in
Water: Acetonitrile 10:90 % v/v)
Column : Zodiac CN®C18 (5 µm*250 mm*4.6 mm)
Flow rate : 0.5 ml/min
Injection volume : 10 μl
Runtime : 7 min
Preparation of mobile phase
For preparing a mobile phase, in measuring cylinder 900 ml of HPLC grade acetonitrile
and 100 ml of 5 mM ammonium acetate in water was taken, then transferred into a reagent
bottle and mixed the contents thoroughly and stored at ambient temperature. This solution
was used within 3 days from the date of preparation.
Preparation of Internal Standard (ISTD) solutions
Carbamazepine was weighed accurately equivalent to 2 mg of carbamazepine and the
appropriate volume of methanol was added to make a final concentration of carbamazepine
equivalent to 0.1 mg/ml accounting for its potency and the actual amount weighed. The

CHAPTER 3 Experimental
99
solution was stored in a refrigerator at 5 ± 3°C and equilibrated to room temperature prior
to use. The solution was used within 7 days from the date of preparation.
10.0 μl of ISTD stock solution, 0.1 mg/ml was pipetted out in 10.0 ml volumetric flask and
made up the volume to 10.0ml with methanol. The solution was stored in a refrigerator at
5 ± 3°C and equilibrated to room temperature prior to use. The solution was used within 7
days from the date of preparation.
Sample preparation
500 μl of respective spiking solution was spiked into a tube containing 9500 μl of rat
plasma and vortex to mix. The required number of calibration curve standards were
retrieved from the deep freezer, thawed them at room temperature and the tubes were
vortexed to mix. 0.2 ml of sample were transferred into the pre-labeled tube. 50 μl of ISTD
dilution was added to all the samples except standard blank and vortexed for about 15
seconds. 1.2 ml of ethyl acetate was added to the tubes, capped and vortexed all the
samples on cyclo mixer, for 10 minutes. Extracted samples were centrifuged at 10,000
RPM, at 10 ± 2°C for 10 mins. 1.0 ml of supernatant was transferred into pre-labeled tubes
and evaporated to dryness under vacuum by using a vacuum oven set at 40 ± 5°C. After
drying, samples were reconstituted with 100 μl of reconstitution solution and vortexed for
about 30 seconds. Reconstituted samples were transferred into pre-labeled autosampler
vials, arranged in the autosampler and injected by using HPLC-ESI-MS/MS.
Procedure for aqueous sample preparation
400 μl of reconstitution solution was taken in pre-labeled tubes. 500 μl of ISTD dilution
was added and vortexed to mix. 100 μl of respective spiking solution was added and
vortexed to mix. The appropriate volume of samples transferred into pre-labeled
autosampler vials and injected by HPLC-ESI-MS/MS.
Construction of calibration curve
The chromatograms were acquired by using Lab Solution Software 5.60 SP2D supplied by
Shimadzu. The calibration curve was plotted as the peak area ratio (Drug/ISTD) on Y-axis
vs. the nominal concentration of Drug on the X-axis. The concentrations of the unknown
samples were calculated by using linear regression equation with a 1/C2 weighting factor,
CHAPTER 3 Experimental
100
performed for each set of data using Microsoft Excel® version 2013 (Microsoft
Corporation, Washington, USA).
Pharmacokinetic studies
The applicability of the developed LCMS method for candesartan cilexetil in rat plasma
was demonstrated by the results obtained from pharmacokinetic studies conducted on
Wister rats (n=6). Each rat was treated with oral nanosuspension of candesartan cilexetil at
a dose of 1.65 mg/kg in a single dose by curved gastric gavage tubes directly into the
stomach. Serial blood samples were collected from retro-orbital venous plexus with
hematocrit over a period 24 h. Blood samples from each group were collected at
predetermined time intervals into heparinized plastic tubes. All these samples of blood
were kept in refrigerated cold conditions (2-8°C) until separation of plasma. Each sample
was processed further by the method as mentioned under sample preparation and subjected
to LCMS analysis for the estimation of drug content by a bioanalytical method. The
pharmacokinetic calculations were performed on the basis of plasma concentration-time
data. Reduction of a dose of candesartan cilexetil after conversion into nanosuspension to
reach Cmax of the marketed formulation was also calculated.
3.14.6B Bioanalytical method for telmisartan nanosuspension [180]
A High-Performance Liquid Chromatographic System (HPLC) equipped with Shimadzu
LC SOLUTION was employed for the present investigation. The system consisted of
Shimadzu UFLC 20-AD as a binary solvent delivery system, Shimadzu 7D Rheodyne
injector loop injector and Photo Diode Array (PDA) detector as a source of detection.
Chromatographic conditions
Mobile phase : Methanol and Acetonitrile (70:30 %v/v)
Column : Phenomenex Luna® C8 column (300 mm*4.6 mm + pore
size 100 Å)
Flow rate : 1 ml/min
Injection volume : 20 μl
Run time : 10 min

CHAPTER 3 Experimental
101
Preparation of mobile phase
For preparing a mobile phase, HPLC grade methanol and acetonitrile were filtered through
a 0.2 μm membrane filter and subjected to degassing in an ultrasonic bath for a period of
15 mins.
Standard solutions
A primary stock solution (1 mg/ml) was prepared by dissolving 10 mg of telmisartan in
10 ml of HPLC grade methanol. The stock solution was suitably diluted with HPLC grade
methanol to obtain a working range of standard solutions. The working standard solutions
were used to prepare a calibration curve. Plasma used in the study was isolated from rat's
blood by centrifugation at 10000 RPM for a period of 15 min at 4°C, using a laboratory
centrifuge. The calibration curve samples were prepared by spiking 500 μl of drug-free rat
plasma with 100 μl of previously diluted working standard solution in order to obtain final
concentrations of 10, 25, 50, 75, 100, 250, 500, 750 and 1000 ng/ml. All samples were
stored in refrigerated cold conditions (2-8°C) and equilibrated to room temperature prior to
use.
Sample preparation
Prior to sample analysis, 100 μl of each solution was extracted using 300 μl of diethyl
ether: dichloromethane (60:40% v/v) for protein precipitation. Further, each of the
mixtures was vortexed for a period of 5 min in a vortex mixer with subsequent
centrifugation at 10,000 RPM, for a period of 10 mins at 4°C using a centrifuge. For each
sample, an aliquot of a supernatant was isolated and subjected to dryness. The residue was
reconstituted in 100 μl of mobile phase and subsequently centrifuged at 10,000 RPM for
10 min at 4°C in a laboratory centrifuge. The supernatant was finally collected and directly
injected into the HPLC system.
Construction of calibration curve
The values of peak areas were plotted against their respective concentrations in order to
construct the calibration curve for telmisartan. Linear regression analysis was performed
for each set of data using Microsoft Excel® version 2013 (Microsoft Corporation,
Washington, USA).

CHAPTER 3 Experimental
102
Pharmacokinetic studies
The applicability of the developed HPLC method for telmisartan in rat plasma was
demonstrated by the results obtained from pharmacokinetic studies conducted on Wister
rats (n=6). Each rat was treated with oral nanosuspension of telmisartan at a dose of 4.11
mg/kg in a single dose by curved gastric gavage tubes directly into the stomach. Serial
blood samples were collected from retro-orbital venous plexus with hematocrit over a
period 24 h. Blood samples from each group were collected at predetermined time intervals
into heparinized plastic tubes. All these samples of blood were kept in refrigerated cold
conditions (2-8°C) until separation of plasma. Each sample was processed further by the
method as mentioned under sample preparation and subjected to HPLC analysis for the
estimation of drug content by a bioanalytical method. The pharmacokinetic calculations
were performed on the basis of plasma concentration-time data.
3.14.6C Bioanalytical method for ziprasidone hydrochloride [181]
The integrated high-performance liquid chromatography system (LC 2010C, Shimadzu
Corporation, Tokyo, Japan) was equipped with a quaternary pump, a degasser, an
autosampler, an injector with a 100 μl loop, a column oven, a Fluorescence detector and a
data system (LC solution software version 1.21).
Chromatographic conditions
Mobile phase : 10mM Potassium dihydrogen phosphate buffer (pH: 2.5):
Acetonitrile (70: 30)
Column : Hypersil gold C-18 (150 mm* 4.6 mm* 5 μ)
Flow rate : 1 ml/min
Injection volume : 20 μl
Runtime : 10 min
Standard solutions
A standard stock solution of ziprasidone hydrochloride (1 mg /ml) was prepared in Milli Q
water and the Prazosin Internal Standard (1 mg/ml) was separately prepared in methanol.
Spiking solutions were prepared by appropriate dilution in methanol: water (50:50). The
Internal Standard working solution (75ng/ml) was prepared by diluting its stock solution

CHAPTER 3 Experimental
103
with methanol: water (50:50). Spiking solutions (0.2 ml) were added to drug-free human
serum (9.8 mL) as a bulk, to obtain ziprasidone hydrochloride spiking concentration levels
of 1.5 ng/ml to 200 ng/ml.
Sample preparation
A 400 μl volume of serum was transferred to a 4 ml ria vial, and then 50 μl of Internal
standard working solution (75 ng/ml) was spiked. After vortexing for the 30s, add 100 μl
of 0.05 M sodium hydroxide in ria vials. Then 2.5 ml aliquot of the extraction solvent,
methyl-tertbutyl ether was added using hand step (Brand Eppendorf, Germany). The
sample was vortex-mixed for 10 min using a multi-pulse vortexer (Heidolph, Germany).
The sample was then centrifuged at RPM 1891 ± 100 for 5 minutes at 10°C using
Multifuge 3S-R (Kendro Lab, Heraeus, Germany). The organic layer (2.0 ml) was
quantitatively transferred to a 4 ml glass tube and evaporated to dryness using a TurboVap
LV Evaporator (Speedoap, India) at 40°C under a stream of nitrogen. Then, the dried
extract was reconstituted in 250 μl of Mobile phase and a 20 μl aliquot was injected into
the chromatographic system.
Construction of calibration curve
The chromatograms were acquired by using Lab Solution Software supplied by Shimadzu.
The calibration curve was plotted as the peak area ratio (Drug/ISTD) on Y-axis vs. the
nominal concentration of drug on the X-axis. The concentrations of the unknown samples
were calculated by using linear regression equation with a 1/C2 weighting factor. Linear
regression analysis was performed for each set of data using Microsoft Excel® version
2013 (Microsoft Corporation, Washington, USA).
Pharmacokinetic studies
The applicability of the developed HPLC method for ziprasidone hydrochloride in rat
plasma was demonstrated by the results obtained from pharmacokinetic studies conducted
on Wister rats (n=6). Each rat was treated with oral nanosuspension of ziprasidone
hydrochloride at a dose of 2.05 mg/kg in a single dose by curved gastric gavage tubes
directly into the stomach. Serial blood samples were collected from retro-orbital venous
plexus with hematocrit over a period 12 h. Blood samples from each group were collected
at predetermined time intervals into heparinized plastic tubes. All these samples of blood

CHAPTER 3 Experimental
104
were kept in refrigerated cold conditions (2-8°C) until serum separation. Each sample was
processed further by the method as mentioned under sample preparation and subjected to
HPLC analysis for the estimation of drug content by a bioanalytical method. The
pharmacokinetic calculations were performed on the basis of serum concentration-time
data.
3.15 References
161. http://www.accessdata.fda.gov/scripts/cder/dissolution/candesartancilexetil
(Accessed 1 March 2011)
162. http://www.accessdata.fda.gov/scripts/cder/dissolution/telmisartan (Accessed 13
March 2011)
163. http://www.accessdata.fda.gov/scripts/cder/dissolution/ziprasidone hydrochloride
(Accessed 30 March 2012)
164. Shivakumar HG, Ramalingaraju G, and Siddaramaiah, 1999, Influence of solvents
on crystal habit and properties of paracetamol crystals, Indian Journal of
Pharmaceutical Sciences, 61(2), 100-104, ISSN: 0250-474X.
165. Pandya VM, Patel JK and Patel DJ, 2011, Formulation, optimization and
characterization of Simvastatin Nanosuspension prepared by nanoprecipitation
technique, Der Pharmacia Lettre, 3(2), 129-140, ISSN: 0975-5071.
166. Gacula MC (1993) Product Optimization. In: Design and Analysis of Sensory
Optimization, Food and Nutrition Press, Trumbull: Connecticut USA, pp. 105-236.
167. Kakran M, Sahoo NG, Li L, Judeh Z, Wang Y, Chong K and Loh L, 2010,
Fabrication of drug nanoparticles by evaporative precipitation of nanosuspension,
International Journal of Pharmaceutics, 383(1-2), 285–292, ISSN: 0378-5173.
168. Das S and Suresh PK, 2011, Nanosuspension: a new vehicle for the improvement
of the delivery of drugs to the ocular surface: Application to amphotericin B,
Nanomedicine: Nanotechnology, Biology, and Medicine, 7(2), 242–247, ISSN:
1549-9634.
169. Armstrong NC and James KC (1996) Pharmaceutical experimental design and
interpretation, Second Edition, CRC Press, USA, pp. 131-192.
170. Shid RL, Dhole SN, Kulkarni N and Shid SL, 2014, Formulation and evaluation of
nanosuspension formulation for drug delivery of simvastatin, International Journal
of Pharmaceutical Sciences and Nanotechnology, 7(4), 2650-2665, ISSN: 0974-
3278.
CHAPTER 3 Experimental
105
171. Muller RH, Jacobs C, and Kayser O, 2001, Nanosuspensions as particulate drug
formulations in therapy rationale for development and what we can expect for the
future, Advanced Drug Delivery Reviews, 47(1), 3–19, ISSN: 0169-409X.
172. Li W, Yang Y, Tian Y, Xu X, Chen Y, Mu L, Zhang Y and Fang L, 2011,
Preparation and in-vitro/in-vivo evaluation of Revaprazan Hydrochloride
nanosuspension, International Journal of Pharmaceutics, 408(1-2), 157–162, ISSN:
0378-5173.
173. ICH Harmonised Tripartite Guideline, Guideline for Residual Solvents, Q3C(R6).
http://www.ich.org/fileadmin/Public_Web_Site/ICH_Products/Guidelines/Quality/
Q3C/Q3C_R6__Step_4.pdf
174. Reddy PB and Reddy MS, 2009, Residual Solvents Determination by HS-GC with
Flame Ionization Detector in Omeprazole, Pharmaceutical formulations,
International Journal of PharmTech Research, 1(2), 230-234, ISSN: 0974-4304.
175. Paul SD, Mazumder R, Bhattacharya S and Jha AK, 2013, Method development
and validation for the determination of residual solvents in ophthalmic nanoparticle
suspension, World Journal of Pharmacy and Pharmaceutical Sciences, 2(6), 5802-
5810, ISSN: 2278-4357.
176. ICH Harmonised Tripartite Guideline, Stability Testing of New Drug Substances
and Products, Q1A (R2).
http://www.ich.org/fileadmin/Public_Web_Site/ICH_Products/Guidelines/Quality/
Q1A_R2/Step4/Q1A_R2__Guideline.pdf
177. Zhang H, Jiang Y, Wen J, Zhou T, Fan G and Wu Y, 2009, Rapid determination of
telmisartan in human plasma by HPLC using a monolithic column with
fluorescence detection and its application to a bioequivalence study, Journal of
Chromatography B : Analytical Technologies in the Biomedical and Life Sciences,
877(29), 3729-3733. ISSN: 1570-0232.
178. Balakrishnan P, Lee B, Hoon DO, Kim JO, Hong MJ, Jee J, Kim JA, Yoo BK,
Woo JS, Yong CS and Choi H, 2009, Enhanced oral bioavailability of
dexibuprofen by a novel solid self-emulsifying drug delivery system (SEDDS),
European Journal of Pharmaceutics and Biopharmaceutics, 72(3), 539-545, ISSN:
1929-8857.
CHAPTER 3 Experimental
106
179. Jang-Woo S, In-Chan S, and Chang-Gue S, 2010, Interpretation of animal dose and
human equivalent dose for drug development, The Journal of Korean Oriental
Medicine, 31(3), 1-7, ISSN: 1011-8934.
180. Patel JM, Dhingani AP, Garala KC, Raval MK and Sheth NR, 2012, Development
and validation of bioanalytical HPLC method for estimation of Telmisartan in rat
plasma: application to pharmacokinetic studies, Dhaka University Journal of
Pharmaceutical Sciences, 11(2), 121-127, ISSN: 1816-1839.
181. Tripathi P and Pandey Y, 2012, High performance liquid chromatographic
estimation of ziprasidone in human serum, Journal of Pharmaceutical and
Bioanalytical Science, 1(1), 8-15, ISSN: 0731-7085.

RESULT
AND
DISCUSSION

CHAPTER 4 RESULTS AND DISCUSSION
108
CHAPTER – 4
Result and Discussion
4A. Result and discussion of candesartan cilexetil
nanosuspension
4A.1 Scanning and calibration curve preparation
4A.1.1 Scanning and calibration curve preparation of candesartan cilexetil in
methanol
The standard stock solution of candesartan cilexetil was prepared in methanol as per the
method described in experimental section and scanned by UV Visible spectrophotometer
between 200 to 400 nm. The UV absorption spectrum of candesartan cilexetil showed λmax
at 254 nm [182] as shown in Figure 4.1.

CHAPTER 4 RESULTS AND DISCUSSION
109
FIGURE 4.1: Scanning of candesartan cilexetil in methanol
A calibration curve was prepared in methanol in the range of 5-30 μg/ml by UV-Visible
spectrophotometer. The absorbance of these solutions was measured at 254 nm. This
procedure was performed in triplicate to validate the calibration curve. The data is given in
Table 4.1.
TABLE 4.1: Calibration curve data of candesartan cilexetil in methanol
Sr.
No.
Concentration
(µg/ml)
Absorbance at 254 nm*
(Mean ±SD)
1 0 0.000 ± 0.000
2 5 0.164 ± 0.012
3 10 0.309 ± 0.015
4 15 0.463 ± 0.015
5 20 0.596 ± 0.015
6 25 0.751 ± 0.010
7 30 0.889 ± 0.018
*Indicates average of three determinations
A calibration curve was constructed by plotting absorbance vs. concentration in µg/ml as
shown in Figure 4.2 and a regression equation was found to be Y = 0.0295X + 0.0109 with
regression coefficient 0.9995.

CHAPTER 4 RESULTS AND DISCUSSION
110
FIGURE 4.2: Calibration curve of candesartan cilexetil in methanol
4.1A.2 Scanning and calibration curve preparation of candesartan cilexetil in
0.05 M phosphate buffer, pH 6.5 containing 0.7% v/v polysorbate 20.
The standard stock solution of candesartan cilexetil (10 µg/ml) was prepared in 0.05 M
phosphate buffer, pH 6.5 containing 0.7% v/v polysorbate 20 and scanned by UV Visible
spectrophotometer between 200 to 400 nm. The UV absorption spectrum of candesartan
cilexetil showed λmax at 259 nm [183] as shown in Figure 4.3.
FIGURE 4.3: Scanning of candesartan cilexetil in 0.05 M phosphate buffer, pH 6.5
containing 0.7% v/v polysorbate 20
A calibration curve was prepared in 0.05 M phosphate buffer, pH 6.5 containing 0.7% v/v
polysorbate 20 [172] in the range of 4-16 μg/ml by UV-Visible spectrophotometer. The

CHAPTER 4 RESULTS AND DISCUSSION
111
absorbance of these solutions was measured at 259 nm. This procedure was performed in
triplicate to validate the calibration curve. The data is given in Table 4.2.
TABLE 4.2: Calibration curve data of candesartan cilexetil in 0.05 M phosphate
buffer, pH 6.5 containing 0.7% v/v polysorbate 20
Sr.
No.
Concentration
(µg/ml)
Absorbance at 259 nm*
(Mean ± SD)
1 0 0.000 ± 0.000
2 4 0.184 ± 0.005
3 6 0.284 ± 0.008
4 8 0.383 ± 0.012
5 10 0.482 ± 0.012
6 12 0.595 ± 0.012
7 14 0.686 ± 0.010
8 16 0.800 ± 0.010
*Indicates average of three determinations
A calibration curve was prepared in 0.05 M phosphate buffer, pH 6.5 containing 0.7% v/v
polysorbate 20 in the range of 4-16 μg/ml as shown in Figure 4.4 and regression equation
was found to be Y = 0.0501X - 0.0116 with regression coefficient 0.9992.
FIGURE 4.4: Calibration curve of candesartan cilexetil in 0.05 M phosphate
buffer, pH 6.5 containing 0.7% v/v polysorbate 20

CHAPTER 4 RESULTS AND DISCUSSION
112
4A.2 Selection of solvent and antisolvent
Selection of solvent and antisolvent was performed on the basis of solubility of
candesartan cilexetil in different solvents and their combinations. [164] Results indicated
that drug had the highest solubility (5.31mg/ml) in methanol and least solubility (0.00119
mg/ml) in water, so they were selected as solvent and antisolvent respectively as shown in
Table 4.3.
TABLE 4.3: Results of selection of solvents for CCNS
Drug Solvents Solubility
(mg/ml)
(Mean ± SD)*
Candesartan
Cilexetil
Water 0.00119 ±0.0001
Methanol 5.31 ± 0.54
Alcohol 2.51 ± 0.21
Iso-propanol 0.33 ± 0.012
N-Butanol 0.13 ± 0.052
Alcohol:2-Propanol (1:1) 0.55 ± 0.034
Alcohol: Butanol (1:1) 0.17 ± 0.029
Ethyl Acetate 0.34 ± 0.038
* Indicates average of three determinations
4A.3 Selection of stabilizer
Different stabilizers like polyvinyl alcohol, PVP K-30, sodium lauryl sulfate, poloxamer
188 and poloxamer 407 were screened by preparing nanosuspensions with bellow
mentioned formulating and processing parameters as shown in Table 4.4 [184]

CHAPTER 4 RESULTS AND DISCUSSION
113
TABLE 4.4: Formulating and processing parameters for selection of stabilizer for
CCNS
Batch
Code
Stabilizers Amount of
Stabilizers
(mg)
Amount of
Candesartan
Cilexetil
(mg)
Stirring
Speed
(RPM)
Stirring
Time
(h)
Sonication
Time
(min)
Solvent :
Antisolve
nt
Volume
Ratio
CF1 Polyvinyl Alcohol 30
10 800 4 20 1:20
CF2 PVP K30 30
CF3 Sodium Lauryl
Sulphate
4
CF4 Poloxamer 188 30
CF5 Poloxamer 407 30
The prepared nanosuspensions (CF1 to CF5) were evaluated by measuring their saturation
solubility, mean particle size, polydispersity index (PDI) and zeta potential for selection of
the best stabilizer which can be utilized for further research work, as shown in Table 4.5.
TABLE 4.5: Results for selection of stabilizer for CCNS
Batch
Code
Stabilizer
Used
Saturation
Solubility
(µg/ml)
(Mean ± SD)*
Mean
Particle
Size
(nm)
(Mean ± SD)*
PDI
(Mean ± SD)*
Zeta
Potential
(mV)
(Mean ± SD)*
CF1 Polyvinyl Alcohol 54.26 ± 1.28 512.0 ± 4.2 1.093 ± 0.11 31.22 ± 1.02
CF2 PVP K-30 80.13 ± 2.01 243.3 ± 5.4 0.298 ± 0.04 -32.89 ± 0.89
CF3 Sodium Lauryl
Sulphate
51.39 ± 0.98 436.0 ± 9.3 0.732 ± 0.02 -30.79 ± 0. 92
CF4 Poloxamer 188 60.81 ± 0.57 320.0 ± 8.8 0.553 ± 0.03 -31.17 ± 1.25
CF5 Poloxamer 407 57.21 ± 0.87 598.0 ± 5.8 1.089 ±0.15 20.53 ± 1.10
* Indicates average of three determinations
Table 4.5 indicated that PVP K-30 showing highest saturation solubility and lowest mean
particle size. It also showed minimum PDI showing uniformity in particle size of
nanosuspension and highest zeta potential indicating greater stability, so PVP K-30 was
selected as a stabilizer for further studies.

CHAPTER 4 RESULTS AND DISCUSSION
114
4A.4 Drug-excipient compatibility study
Studies of drug-excipient compatibility represent an important phase in the preformulation
stage of the development of all dosage forms. The potential physical and chemical
interactions between drugs and excipients can affect the chemical, physical, therapeutical
properties and stability of the dosage form. Fourier transformed infrared (FTIR)
spectroscopy and differential scanning calorimetry (DSC) were selected for checking of
drug-excipient compatibility. [185]
4A.4.1 Fourier transformed infrared (FTIR) spectroscopy
FTIR spectroscopy was conducted using a Shimadzu FTIR 8400 spectrophotometer
(Shimadzu, Tokyo, Japan) and the spectrum was recorded in the wavelength region of
4000–400 cm-1 as shown in Figure 4.5 [A, B, C].
FIGURE 4.5 [A]: FT-IR spectra of candesartan cilexetil
400600800120016002000240028003200360040001/cm
0
7.5
15
22.5
30
37.5
45
52.5
60
67.5
75
82.5
90%T
3553
.0034
62.34
2947
.3328
83.68
2328
.16
2131
.41
1662
.6916
41.48
1460
.1614
25.44
1280
.78 1111
.03
1020
.38 935.5
1
842.9
2 734.9
064
4.25
570.9
5 493.7
9
7
FIGURE 4.5 [B]: FT-IR spectra of PVP K-30

CHAPTER 4 RESULTS AND DISCUSSION
115
400800120016002000240028003200360040001/cm
-7.5
0
7.5
15
22.5
30
37.5
45
52.5
60
67.5
75
82.5
90
97.5%T
3851
.97
3483
.5634
06.40
2939
.6128
58.60 27
27.44
2605
.92 2345
.52
1751
.42 1712
.8516
12.54
1552
.7514
46.66
1350
.2212
73.06
1249
.91 1072
.4610
39.67 995.3
092
2.00
869.9
275
0.33
696.3
359
0.24
486.0
843
4.00
FIGURE 4.5 [C]: FT-IR spectra of a physical mixture of candesartan cilexetil and
PVP K-30
Candesartan cilexetil, PVP K-30, and its physical mixture were subjected to FTIR studies
and characteristic bands were identified and presented in Table 4.6.
TABLE 4.6: Comparison of characteristic bands between candesartan cilexetil
and its physical mixture.
Characteristic bands
[186–188]
Peak Value, cm-1
Candesartan Cilexetil Physical Mixture
Aromatic –C-H stretching 3066.92 3066.92
Aliphatic – C-H stretching 2937.68 2939.61
-N=N stretching 1612.54 1612.54
-C=N-N stretching 1548.89 1552.75
-C-N stretching 1274.99 1273.06
-C-O stretching of ether 1244.13 1249.91
-C-N stretching 1037.74 1039.67
Table 4.6 indicates that the bands were similar for both pure drug and physical mixture and
therefore there was no incompatibility between candesartan cilexetil and PVP K-30.
4A.4.2 Differential scanning calorimetry (DSC)
DSC was performed using DSC-60 (Shimadzu, Tokyo, Japan) calorimeter to study the
thermal behavior of samples (candesartan cilexetil, PVP K-30, physical mixture and
lyophilized nanosuspension). Information of thermal analysis by DSC can be seen in
Figure 4.6.
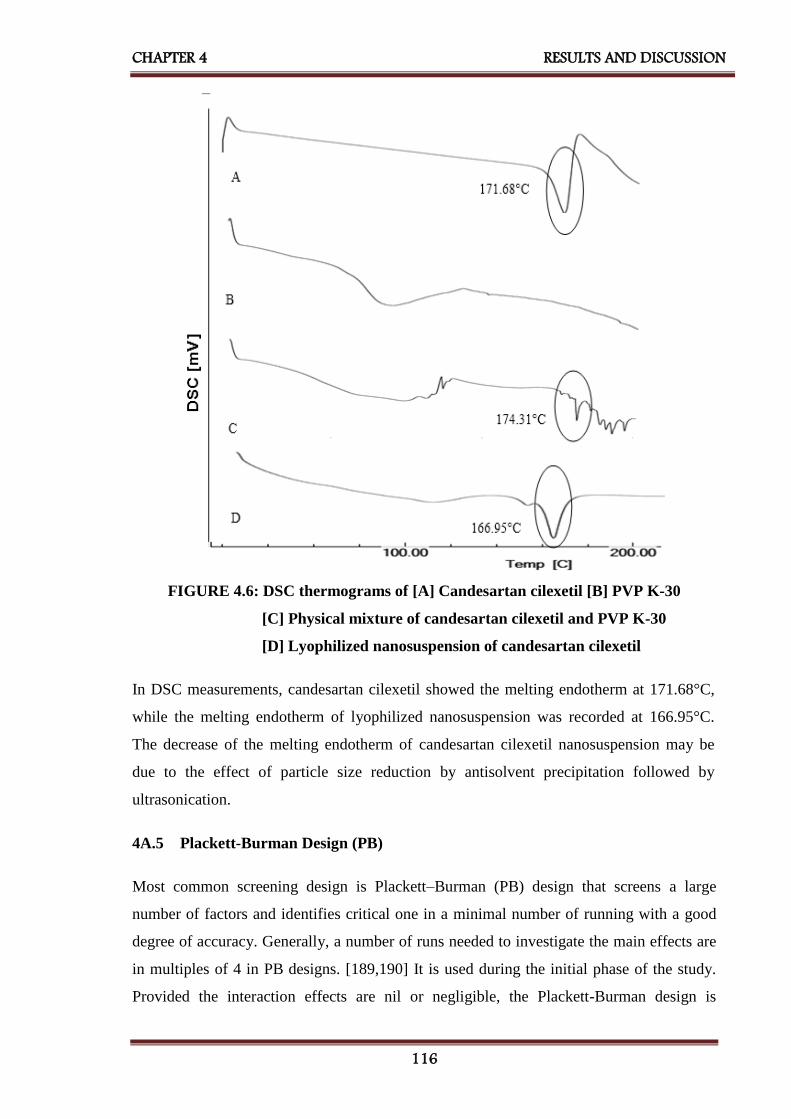
CHAPTER 4 RESULTS AND DISCUSSION
116
FIGURE 4.6: DSC thermograms of [A] Candesartan cilexetil [B] PVP K-30
[C] Physical mixture of candesartan cilexetil and PVP K-30
[D] Lyophilized nanosuspension of candesartan cilexetil
In DSC measurements, candesartan cilexetil showed the melting endotherm at 171.68°C,
while the melting endotherm of lyophilized nanosuspension was recorded at 166.95°C.
The decrease of the melting endotherm of candesartan cilexetil nanosuspension may be
due to the effect of particle size reduction by antisolvent precipitation followed by
ultrasonication.
4A.5 Plackett-Burman Design (PB)
Most common screening design is Plackett–Burman (PB) design that screens a large
number of factors and identifies critical one in a minimal number of running with a good
degree of accuracy. Generally, a number of runs needed to investigate the main effects are
in multiples of 4 in PB designs. [189,190] It is used during the initial phase of the study.
Provided the interaction effects are nil or negligible, the Plackett-Burman design is
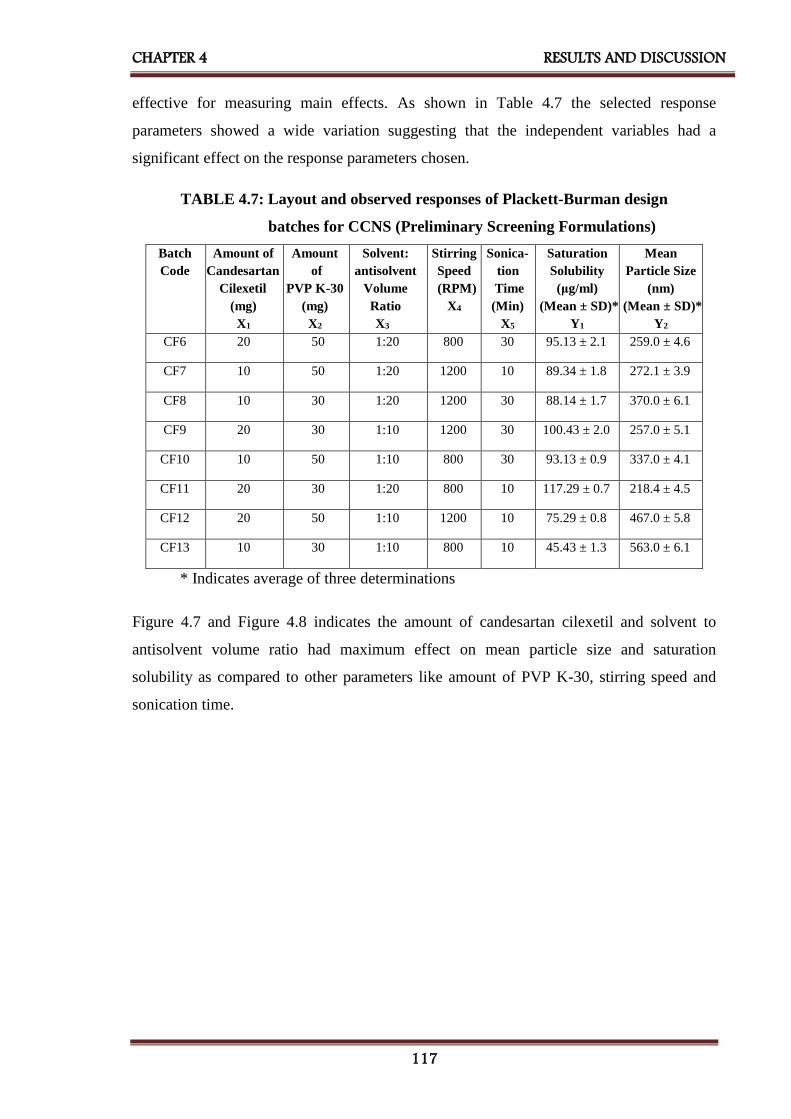
CHAPTER 4 RESULTS AND DISCUSSION
117
effective for measuring main effects. As shown in Table 4.7 the selected response
parameters showed a wide variation suggesting that the independent variables had a
significant effect on the response parameters chosen.
TABLE 4.7: Layout and observed responses of Plackett-Burman design
batches for CCNS (Preliminary Screening Formulations)
Batch
Code
Amount of
Candesartan
Cilexetil
(mg)
X1
Amount
of
PVP K-30
(mg)
X2
Solvent:
antisolvent
Volume
Ratio
X3
Stirring
Speed
(RPM)
X4
Sonica-
tion
Time
(Min)
X5
Saturation
Solubility
(μg/ml)
(Mean ± SD)*
Y1
Mean
Particle Size
(nm)
(Mean ± SD)*
Y2
CF6 20 50 1:20 800 30 95.13 ± 2.1 259.0 ± 4.6
CF7 10 50 1:20 1200 10 89.34 ± 1.8 272.1 ± 3.9
CF8 10 30 1:20 1200 30 88.14 ± 1.7 370.0 ± 6.1
CF9 20 30 1:10 1200 30 100.43 ± 2.0 257.0 ± 5.1
CF10 10 50 1:10 800 30 93.13 ± 0.9 337.0 ± 4.1
CF11 20 30 1:20 800 10 117.29 ± 0.7 218.4 ± 4.5
CF12 20 50 1:10 1200 10 75.29 ± 0.8 467.0 ± 5.8
CF13 10 30 1:10 800 10 45.43 ± 1.3 563.0 ± 6.1
* Indicates average of three determinations
Figure 4.7 and Figure 4.8 indicates the amount of candesartan cilexetil and solvent to
antisolvent volume ratio had maximum effect on mean particle size and saturation
solubility as compared to other parameters like amount of PVP K-30, stirring speed and
sonication time.

CHAPTER 4 RESULTS AND DISCUSSION
118
FIGURE 4.7: Pareto chart of the effect of independent variables on saturation
solubility of CCNS
FIGURE 4.8: Pareto chart of the effect of independent variables on mean particle
size of CCNS
4A.6 Optimization of other preliminary parameters [191–193]
Candesartan cilexetil nanosuspension was prepared using PVP K-30 as a stabilizer. The
three different amounts of PVP K-30 viz. 30 mg, 40 mg, and 50 mg were selected.
Nanosuspensions were prepared according to the procedure given in experimental section.
Prepared nanosuspensions were evaluated with different evaluation parameters like mean

CHAPTER 4 RESULTS AND DISCUSSION
119
particle size and saturation solubility to select amount of PVP K-30 for further formulation
work. As shown in Table 4.8, 50 mg PVP K-30 was selected which was showing minimum
mean particle size and maximum saturation solubility.
Stirring speed is important processing parameter for preparation of nanosuspension. For
the optimization of stirring speed 800 RPM, 1000 RPM and 1200 RPM were selected.
Nanosuspensions were prepared according to the procedure given in experimental section.
Prepared nanosuspensions were evaluated with different evaluation parameters like mean
particle size and saturation solubility to select the stirring speed for further formulation
work, as shown in Table 4.8, 1200 RPM stirring speed was selected which was showing
minimum mean particle size and maximum saturation solubility.
Once the precipitation of drug particle had occurred in suspension, to convert into the
uniform nanosized particles probe sonicator was used. 10 mins, 20 mins and 30 mins
periods were screened for sonication time. Nanosuspension was prepared according to the
procedure given before. Prepared nanosuspensions were evaluated with different
evaluation parameters like mean particle size and saturation solubility to select the
optimized time period of sonication for further formulation work. As shown in Table 4.8,
30 mins sonication time was selected which was showing minimum mean particle size and
maximum saturation solubility.
TABLE 4.8: Results of optimization of other preliminary parameters for CCNS
Batch
Code
Preliminary
Parameters
Mean
Particle Size
(nm)
(Mean ± SD)*
Saturation
Solubility
(µg/ml)
(Mean ± SD)*
CF14 Amount
of Stabilizer
(mg)
30 328.5 ± 5.1 85.07 ± 1.11
CF15 40 301.1 ± 8.2 92.15 ± 1.21
CF16 50 293.5 ± 7.7 95.67 ± 1.14
CF17 Stirring
Speed
(RPM)
800 389.8 ± 6.7 88.01 ± 0.98
CF18 1000 342.2 ± 9.8 91.32 ± 1.29
CF19 1200 251.0 ± 4.6 102.22± 1.02
CF20 Sonication
Time
(min)
10 382.8 ± 3.8 79.71 ± 1.1 9
CF21 20 319.0 ± 9.4 87.24 ± 1.31
CF22 30 244.5 ± 6.2 95.3 ± 1.14
*Indicates average of three determinations

CHAPTER 4 RESULTS AND DISCUSSION
120
4A.7 32 Factorial Design
Various formulations were prepared the varying amount of candesartan cilexetil and
solvent: antisolvent volume ratio. [167,168] As shown in Table 4.9 a 32 full factorial
design was used to evaluate the effect of both independent variables on the predetermined
dependent variables viz., mean particle size and saturation solubility.
TABLE 4.9: Layout and observed responses of 32 factorial design for CCNS
Batch
Code
Level of
Amount of
Candesartan
Cilexetil
X1
Level of
Solvent :
Antisolvent
Volume Ratio
X2
Mean
Particle Size
(nm)
(Mean ± SD)*
Y1
Saturation
Solubility
(µg/ml)
(Mean ± SD)*
Y2
CFD1 -1 -1 434.0 ± 9.1 72.91 ± 2.14
CFD2 -1 0 342.0 ± 6.0 95.12 ± 2.03
CFD3 -1 1 375.0 ± 8.7 85.67 ± 1.67
CFD4 0 -1 406.0 ± 7.0 35.88 ± 0.61
CFD5 0 0 309.0 ± 11.0 50.94 ± 0.91
CFD6 0 1 353.7 ± 5.9 38.03 ± 1.11
CFD7 1 -1 335.7 ± 7.6 94.90 ± 1.54
CFD8 1 0 240.7 ± 8.2 113.92 ± 2.50
CFD9 1 1 308.0 ± 9.0 101.24 ± 1.32
Translation of Coded Levels in Actual Units
Variables Level Low (-1) Medium (0) High (1)
X1 10 mg 15 mg 20 mg
X2 1:10 1:15 1:20
*Indicates average of three determinations
Some other parameters were also evaluated like, cumulative percentage released (CPR) at
2 minutes, zeta potential, PDI and % w/w drug content etc. as shown in Table 4.10.

CHAPTER 4 RESULTS AND DISCUSSION
121
Table 4.10: Other evaluation parameters of factorial batches of CCNS
Batch
Code
CPR at 2mins
(% w/w)
(Mean ± SD)*
PDI
(Mean ± SD)*
Zeta Potential
(mV)
(Mean ± SD)*
Drug Content
(%w/w)
(Mean ± SD)*
CFD1 91.45 ± 3.84 0.539 ± 0.051 18.88 ± 1.52 93.29 ± 1.21
CFD2 99.79 ± 1.02 0.514 ± 0.059 -29.41 ± 2.12 94.81 ± 2.14
CFD3 97.11 ± 1.43 0.654 ± 0.071 16.55 ± 1.24 95.39 ± 1.33
CFD4 95.40 ± 2.01 0.734 ± 0.084 -24.36 ± 0.98 92.74 ± 0.54
CFD5 98.36 ± 3.87 0.855 ± 0. 095 -10.51 ± 0.57 99.33 ± 0.86
CFD6 98.92 ± 0.83 0.866 ± 0. 101 18.74 ± 1.65 99.43 ± 1.52
CFD7 99.63 ± 1.44 0.521 ± 0.085 17.17 ± 1.88 98.22 ± 1.43
CFD8 97.13 ± 1.91 0.343 ± 0.042 25.98 ± 1.85 101.1 ± 1.57
CFD9 93.90 ± 2.11 0.987 ± 0.058 22.14 ± 2.12 98.94 ± 1.29
*Indicates average of three determinations
4A.8 Statistical analysis
A full model was derived after putting the values of regression coefficients in the equation
(3.8). Regression analysis was carried out using Microsoft Excel® version 2013 (Microsoft
Corporation, Washington, USA); the fitted results are shown in Table 4.11, Table 4.12,
equation (4.1) and (4.2).
TABLE 4.11: Results of regression analysis of mean particle size for CCNS
Mean Particle Size (nm) (Y1)
Coefficient Std. Error P- value
b0 308.3333 5.35182 1.15E-05
b1 -44.6667 2.931312 0.000614
b2 -23.1667 2.931312 0.004223
b11 -17 5.077182 0.044114
b22 71.5 5.077182 0.000776
b12 8 3.59011 0.007058
R2= 0.994142
For mean particle size (nm) (Y1)
Y1 = 308.3333 - 44.6667X1 - 23.1667X2 - 17X12 + 71.5X2
2 + 8.701X1X 2 Eq...(4.1)

CHAPTER 4 RESULTS AND DISCUSSION
122
TABLE 4.12: Results of regression analysis of saturation solubility for CCNS
Saturation Solubility (µg/ml) (Y2)
Coefficient Std. Error P- value
b0 51.7644 1.914023 0.000111
b1 9.3933 1.048354 0.002934
b2 3.5416 1.048354 0.043145
b11 52.3431 1.815802 9.17E-05
b22 -15.2217 1.815802 0.00356
b12 -1.605 1.283966 0.299919
R2 = 0.996992
For saturation solubility (µg/ml) (Y2)
Y2 = 51.76444 + 9.3933X1 + 3.5416X2 + 52.3431X12 – 15.2217X2
2 – 1.605X1X2 Eq...(4.2)
The coefficients in Table 4.11 and Table 4.12 represent the respective quantitative effect
of independent variables (X1 and X2) and their interactions on the various responses. It was
seen that all the independent variables had a significant effect on the response (p<0.05).
The negative sign of the coefficient indicated that increase in the value of independent
variable decreases the value of response and vice versa. The absolute value of the
coefficient indicates the magnitude of the effect of the independent variable on the
response; higher the value higher the magnitude.
TABLE 4.13: ANOVA for a full model for CCNS
Source of
variation
DF SS MS F F significant
Mean Particle Size (nm)
Regression 5 26249.33 5249.867 101.8293 0.001514
Residual 3 154.6667 51.55556 - -
Total 8 26404 - - -
Saturation Solubility (µg/ml)
Regression 5 6558.02 1311.604 198.9006 0.000558
Residual 3 19.78281 6.59427 - -
Total 8 6577.803 - - -
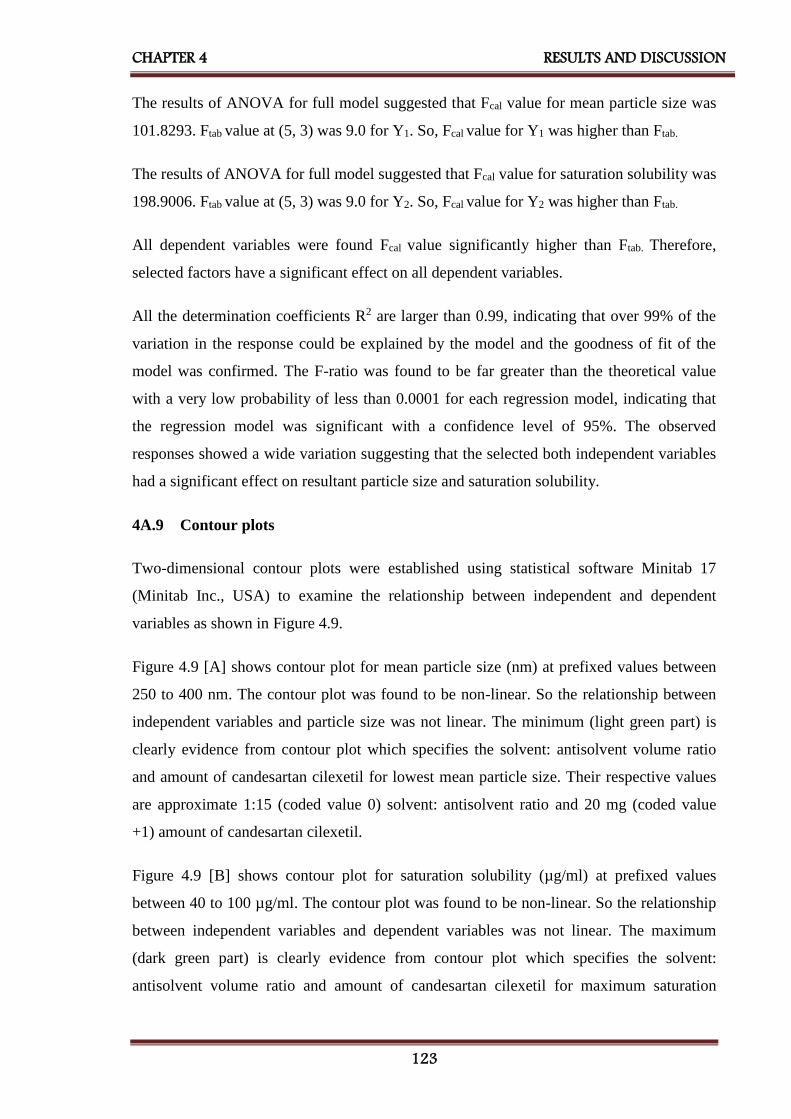
CHAPTER 4 RESULTS AND DISCUSSION
123
The results of ANOVA for full model suggested that Fcal value for mean particle size was
101.8293. Ftab value at (5, 3) was 9.0 for Y1. So, Fcal value for Y1 was higher than Ftab.
The results of ANOVA for full model suggested that Fcal value for saturation solubility was
198.9006. Ftab value at (5, 3) was 9.0 for Y2. So, Fcal value for Y2 was higher than Ftab.
All dependent variables were found Fcal value significantly higher than Ftab. Therefore,
selected factors have a significant effect on all dependent variables.
All the determination coefficients R2 are larger than 0.99, indicating that over 99% of the
variation in the response could be explained by the model and the goodness of fit of the
model was confirmed. The F-ratio was found to be far greater than the theoretical value
with a very low probability of less than 0.0001 for each regression model, indicating that
the regression model was significant with a confidence level of 95%. The observed
responses showed a wide variation suggesting that the selected both independent variables
had a significant effect on resultant particle size and saturation solubility.
4A.9 Contour plots
Two-dimensional contour plots were established using statistical software Minitab 17
(Minitab Inc., USA) to examine the relationship between independent and dependent
variables as shown in Figure 4.9.
Figure 4.9 [A] shows contour plot for mean particle size (nm) at prefixed values between
250 to 400 nm. The contour plot was found to be non-linear. So the relationship between
independent variables and particle size was not linear. The minimum (light green part) is
clearly evidence from contour plot which specifies the solvent: antisolvent volume ratio
and amount of candesartan cilexetil for lowest mean particle size. Their respective values
are approximate 1:15 (coded value 0) solvent: antisolvent ratio and 20 mg (coded value
+1) amount of candesartan cilexetil.
Figure 4.9 [B] shows contour plot for saturation solubility (µg/ml) at prefixed values
between 40 to 100 µg/ml. The contour plot was found to be non-linear. So the relationship
between independent variables and dependent variables was not linear. The maximum
(dark green part) is clearly evidence from contour plot which specifies the solvent:
antisolvent volume ratio and amount of candesartan cilexetil for maximum saturation

CHAPTER 4 RESULTS AND DISCUSSION
124
solubility. Their respective values are approximate 1:15 (coded value 0) solvent:
antisolvent ratio and 20 mg (coded value +1) amount of candesartan cilexetil.
The maxima of saturation solubility and minima of particle size are seemed to be
overlapping. So, there exists a direct relation between saturation solubility and particle
size. The batch showing lowest particle size is also having highest saturation solubility.
FIGURE 4.9: Contour plot of CCNS for effect on [A] Mean particle size and
[B] Saturation solubility
4A.10 Surface plots
To find out main and interaction effect of the independent variables, response surface plots
are very helpful.
Figure 4.10 [A] shows the response surface plot of mean particle size as a function of
independent variables. Mean particle size decreases as the plot comes toward central part.
The center of the plot indicates the minimum particle size which was obtained by
intermediate solvent: antisolvent volume ratio (coded value 0) and highest amount of
candesartan cilexetil (coded value +1).
Figure 4.10 [B] shows the response surface plot of saturation solubility respectively as a
function of solvent: antisolvent volume ratio and amount of candesartan cilexetil using
statistical software Minitab 17. (Minitab Inc., USA) Saturation solubility increases as the
A
B
A
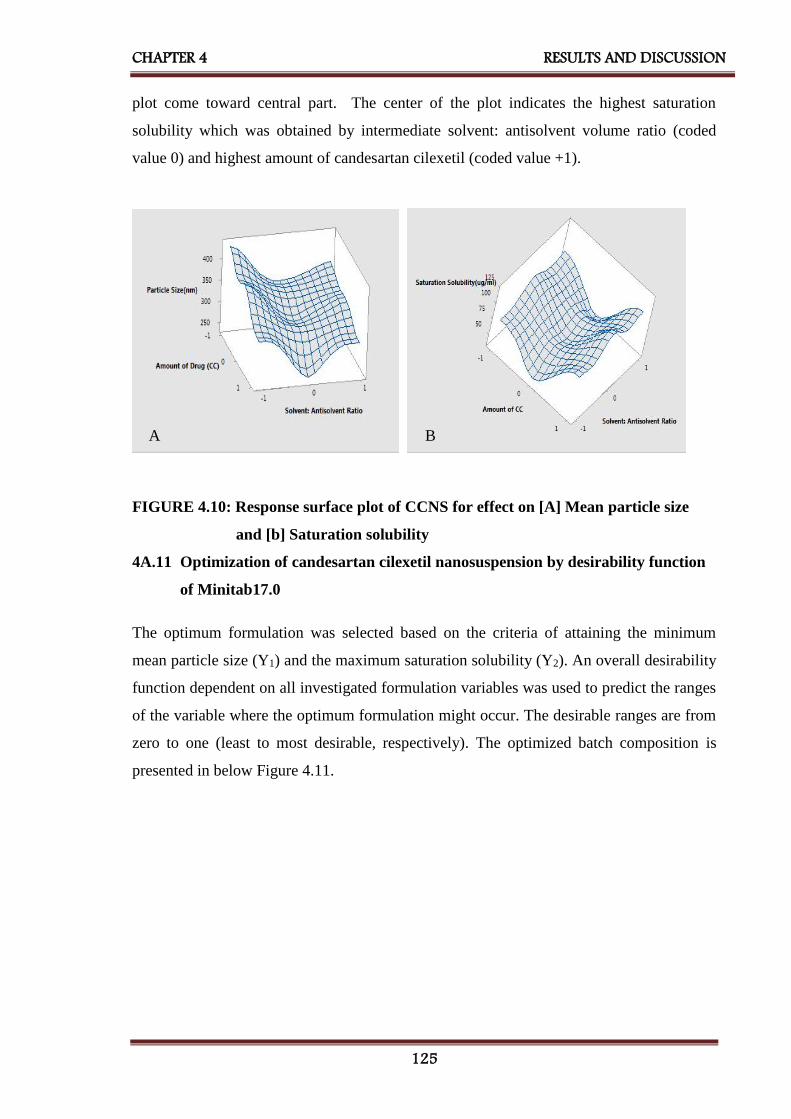
CHAPTER 4 RESULTS AND DISCUSSION
125
plot come toward central part. The center of the plot indicates the highest saturation
solubility which was obtained by intermediate solvent: antisolvent volume ratio (coded
value 0) and highest amount of candesartan cilexetil (coded value +1).
FIGURE 4.10: Response surface plot of CCNS for effect on [A] Mean particle size
and [b] Saturation solubility
4A.11 Optimization of candesartan cilexetil nanosuspension by desirability function
of Minitab17.0
The optimum formulation was selected based on the criteria of attaining the minimum
mean particle size (Y1) and the maximum saturation solubility (Y2). An overall desirability
function dependent on all investigated formulation variables was used to predict the ranges
of the variable where the optimum formulation might occur. The desirable ranges are from
zero to one (least to most desirable, respectively). The optimized batch composition is
presented in below Figure 4.11.
B A
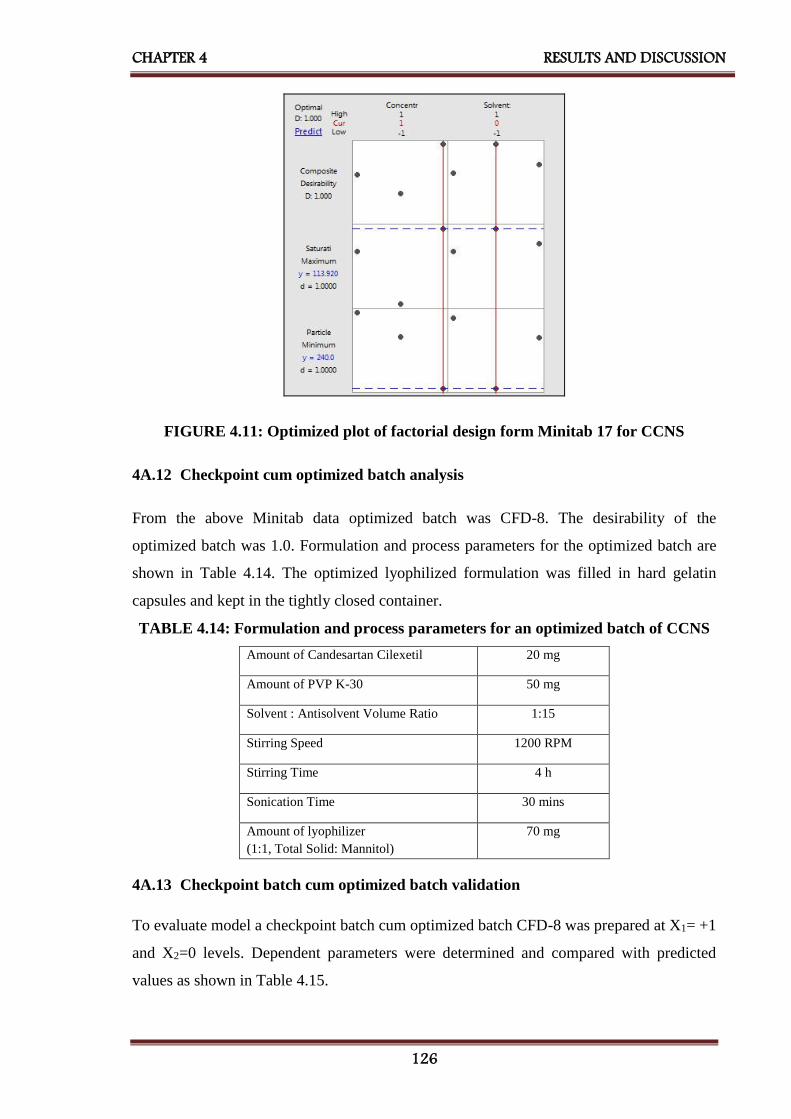
CHAPTER 4 RESULTS AND DISCUSSION
126
FIGURE 4.11: Optimized plot of factorial design form Minitab 17 for CCNS
4A.12 Checkpoint cum optimized batch analysis
From the above Minitab data optimized batch was CFD-8. The desirability of the
optimized batch was 1.0. Formulation and process parameters for the optimized batch are
shown in Table 4.14. The optimized lyophilized formulation was filled in hard gelatin
capsules and kept in the tightly closed container.
TABLE 4.14: Formulation and process parameters for an optimized batch of CCNS
Amount of Candesartan Cilexetil 20 mg
Amount of PVP K-30 50 mg
Solvent : Antisolvent Volume Ratio 1:15
Stirring Speed 1200 RPM
Stirring Time 4 h
Sonication Time 30 mins
Amount of lyophilizer
(1:1, Total Solid: Mannitol)
70 mg
4A.13 Checkpoint batch cum optimized batch validation
To evaluate model a checkpoint batch cum optimized batch CFD-8 was prepared at X1= +1
and X2=0 levels. Dependent parameters were determined and compared with predicted
values as shown in Table 4.15.

CHAPTER 4 RESULTS AND DISCUSSION
127
TABLE 4.15: Composition of checkpoint batch cum optimized batch of CCNS
Amount of Candesartan Cilexetil (mg)
(X1)
Solvent: Antisolvent Volume Ratio
(X2)
Coded value Decoded value Coded value Decoded value
+1 20 mg 0 1:15
TABLE 4.16: Comparison of calculated data with experimental data of CCNS
Response Predicted Observed % Bias
Mean Particle Size (Y1) 246.66 nm 242.9 nm - 1.52%
Saturation Solubility (Y2) 113.50 µg/ml 109.8 µg/ml - 3.26%
When the batch CFD-8 was prepared using defined level of the amount of candesartan
cilexetil and solvent: antisolvent volume ratio using Minitab17 (Minitab Inc., USA), the
results obtained with checkpoint cum optimized batch (CFD-8) were close to predicted
values. Thus, it can be concluded that the statistical model is mathematically valid.
4A.14 Evaluation of optimized batch of candesartan cilexetil nanosuspension
4A.14.1 Particle size and PDI
Particle size distribution of the optimized batch is shown in Figure 4.12. The mean particle
size of the optimized batch was 242.9 ± 10.0 nm and PDI was 0.343. Candesartan cilexetil
nanosuspension based final formulation was intended for oral administration for which
PDI and particle size above 5µm is not critical. The mean particle size of a nanosuspension
is around 200-1000 nm. [80] From the Table 4.9, it was found that mean particle sizes of
all formulations were in the nanometer range. It indicated that all formulations fulfill the
requirements of a nanosuspension.

CHAPTER 4 RESULTS AND DISCUSSION
128
Figure 4.12: Particle size graph for CCNS
4A.14.2 Zeta potential
PVP K-30 is a well-known efficient polymeric stabilizer forming adsorption layers of drug
nanoparticles. [165] In general, zeta potential value of ± 30mV is sufficient for the stability
of nanosuspension. [171] Zeta potential of optimized formulation was observed 25.98 ±
1.85mV which complies with the requirement of zeta potential.
4A.14.3 Drug content
An aliquot (1 ml) of the prepared nanosuspension was diluted in methanol and filtered with
a 0.2 μm filter. Total drug content was determined by UV-Visible spectrophotometer at
254 nm and was found to be 101.01 %w/w of the candesartan cilexetil.
4A.14.4 Saturation solubility
Saturation solubility of an optimized batch of candesartan cilexetil nanosuspension and the
pure drug was found to be 109.8 µg/ml and 1.192 µg/ml respectively it indicates that
saturation solubility of nanosuspension was 100 times than that of pure drug. This drastic
increase in saturation solubility was a result of a reduction in particle size and subsequent
increase in surface area. So, it can be assumed that this increase in saturation solubility
may increase bioavailability.

CHAPTER 4 RESULTS AND DISCUSSION
129
4A.14.5 In-vitro dissolution study
The dissolution profile of nanosuspension, un-milled (pure drug) suspension and marketed
formulation (ATACAND® Tablet) are presented in Figure 4.13. In nanosuspension, more
than 97.13% drug was released within 2 mins, while cumulative percentage release of un-
milled suspension and marketed formulation showed 34.63% and 75.97% at 60 min
respectively. So, nanosuspension enhanced the rate of dissolution of candesartan cilexetil
to a great extent.
FIGURE 4.13: Comparison of in-vitro dissolution of candesartan cilexetil
nanosuspension with marketed formulation
TABLE 4.17: Evaluation parameters of an optimized batch of CCNS
Evaluation Parameters Results
Mean Particle Size 242.9 nm
PDI 0.343
Zeta Potential 25.98 mV
Drug Content 101.01 % w/w
Saturation Solubility 109.8 µg/ml
CPR at 2 mins 97.13 % w/w
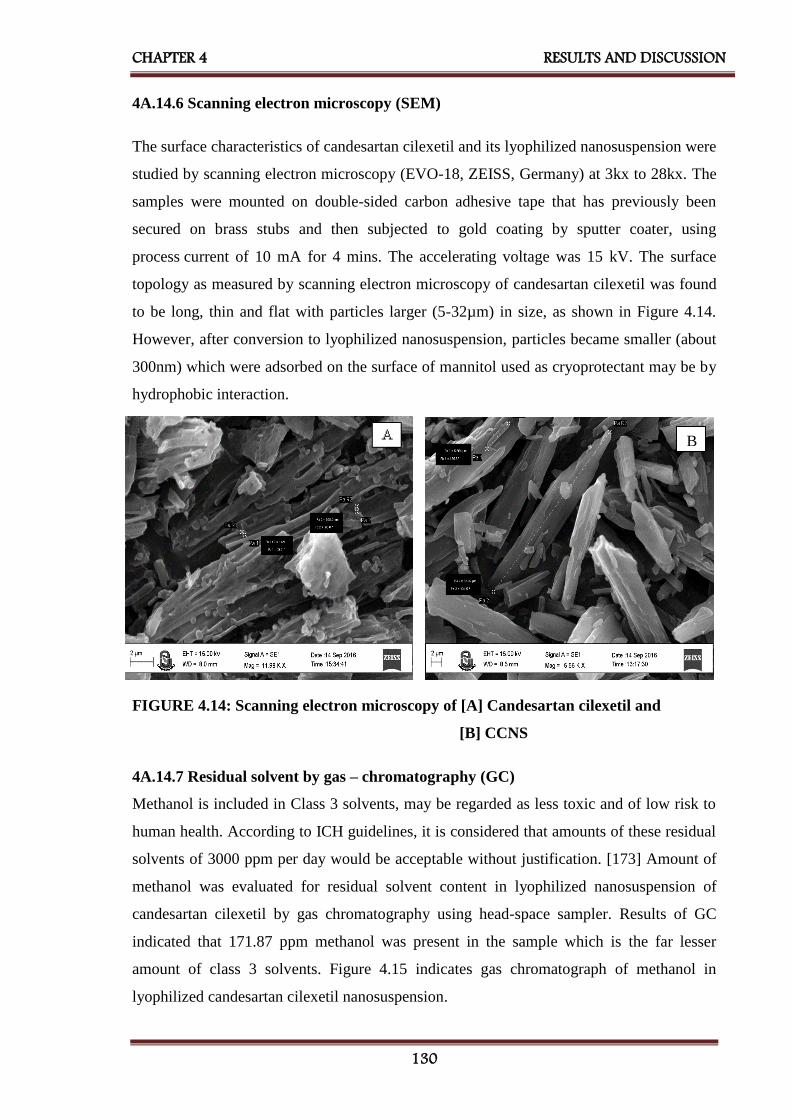
CHAPTER 4 RESULTS AND DISCUSSION
130
B
4A.14.6 Scanning electron microscopy (SEM)
The surface characteristics of candesartan cilexetil and its lyophilized nanosuspension were
studied by scanning electron microscopy (EVO-18, ZEISS, Germany) at 3kx to 28kx. The
samples were mounted on double-sided carbon adhesive tape that has previously been
secured on brass stubs and then subjected to gold coating by sputter coater, using
process current of 10 mA for 4 mins. The accelerating voltage was 15 kV. The surface
topology as measured by scanning electron microscopy of candesartan cilexetil was found
to be long, thin and flat with particles larger (5-32µm) in size, as shown in Figure 4.14.
However, after conversion to lyophilized nanosuspension, particles became smaller (about
300nm) which were adsorbed on the surface of mannitol used as cryoprotectant may be by
hydrophobic interaction.
FIGURE 4.14: Scanning electron microscopy of [A] Candesartan cilexetil and
[B] CCNS
4A.14.7 Residual solvent by gas – chromatography (GC)
Methanol is included in Class 3 solvents, may be regarded as less toxic and of low risk to
human health. According to ICH guidelines, it is considered that amounts of these residual
solvents of 3000 ppm per day would be acceptable without justification. [173] Amount of
methanol was evaluated for residual solvent content in lyophilized nanosuspension of
candesartan cilexetil by gas chromatography using head-space sampler. Results of GC
indicated that 171.87 ppm methanol was present in the sample which is the far lesser
amount of class 3 solvents. Figure 4.15 indicates gas chromatograph of methanol in
lyophilized candesartan cilexetil nanosuspension.

CHAPTER 4 RESULTS AND DISCUSSION
131
FIGURE 4.15: Gas-chromatograph of methanol in the lyophilized candesartan
cilexetil nanosuspension
4A.14.8 Accelerated stability study
The accelerated stability study indicated that lyophilized candesartan cilexetil
nanosuspension was physically and chemically stable when stored at the 25 ± 2°C and
60 ± 5 % RH for a period of 6 months. [176] Table 4.18 shows results of mean particle
size, saturation solubility, cumulative percentage release at 2 mins and %w/w of drug
content indicated that there was a slight change in all parameters which had < ±5 % bias
which was insignificant. The negligible difference was observed in results obtained from
the optimized batch before and after the stability study according to ICH guideline.
TABLE 4.18: Results of accelerated stability study of CCNS
Sr.
No.
Storage
condition
for
stability
study
Time
Period
(months)
Evaluation Parameters
Mean
Particle Size
(nm)
(Mean ± SD)*
Saturation
Solubility
(µg/ml)
(Mean ± SD)*
CPR at
2mins
(%w/w)
(Mean ± SD)*
Drug
Content
(%w/w)
(Mean ± SD)*
1 25°C ± 2°C
and
60% ± 5%
RH
0 242.7± 4.5 111.85 ± 1.5 97.13 ± 0.61 101.01±0.35
2 1 259.1 ± 5.1 110.52 ± 0.9 96.85 ± 2.95 100.85±0.52
3 3 265.1 ± 8.1 109.82 ± 0.8 95.92 ± 1.12 99.87±0.47
4 6 281.2 ±7.9 109.05 ± 1.9 95.14 ± 1.81 97.17±0.89
*Indicates average of three determinations
4A.15 Bioavailability Study
For bioavailability study, each Wistar rat was treated with oral nanosuspension of
candesartan cilexetil at a dose of 1.65 mg/kg in a single dose. Blood samples were
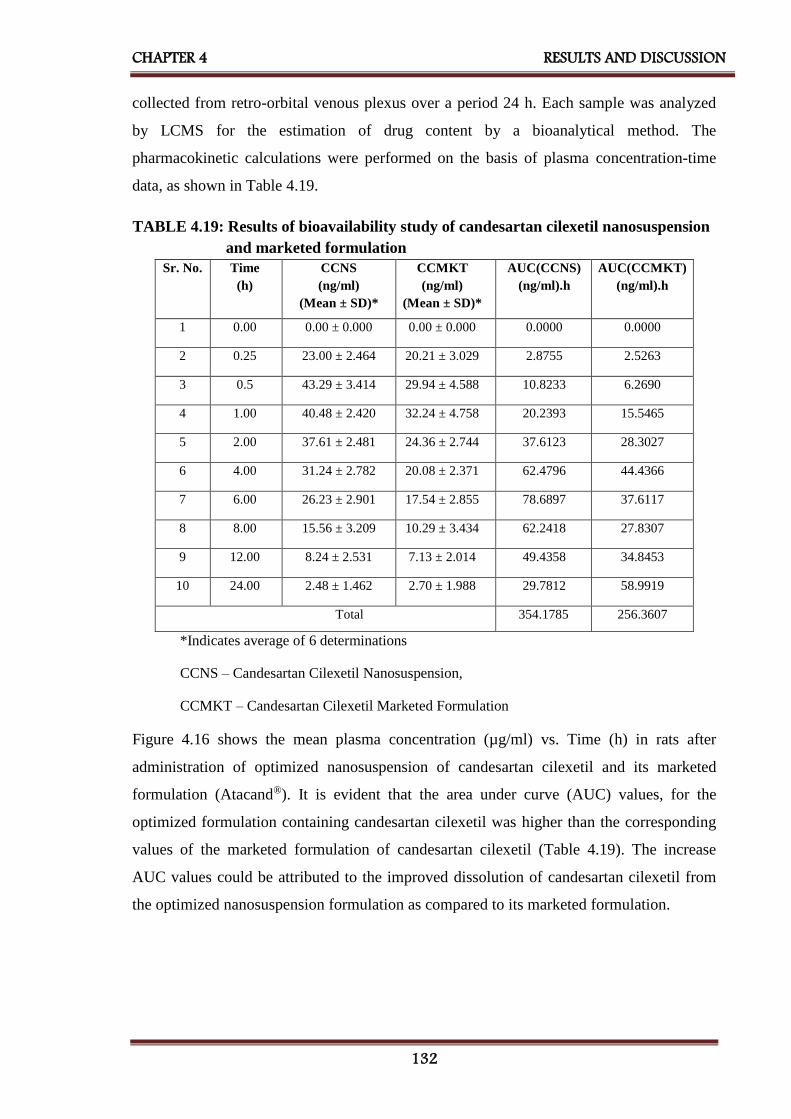
CHAPTER 4 RESULTS AND DISCUSSION
132
collected from retro-orbital venous plexus over a period 24 h. Each sample was analyzed
by LCMS for the estimation of drug content by a bioanalytical method. The
pharmacokinetic calculations were performed on the basis of plasma concentration-time
data, as shown in Table 4.19.
TABLE 4.19: Results of bioavailability study of candesartan cilexetil nanosuspension
and marketed formulation
Sr. No. Time
(h)
CCNS
(ng/ml)
(Mean ± SD)*
CCMKT
(ng/ml)
(Mean ± SD)*
AUC(CCNS)
(ng/ml).h
AUC(CCMKT)
(ng/ml).h
1 0.00 0.00 ± 0.000 0.00 ± 0.000 0.0000 0.0000
2 0.25 23.00 ± 2.464 20.21 ± 3.029 2.8755 2.5263
3 0.5 43.29 ± 3.414 29.94 ± 4.588 10.8233 6.2690
4 1.00 40.48 ± 2.420 32.24 ± 4.758 20.2393 15.5465
5 2.00 37.61 ± 2.481 24.36 ± 2.744 37.6123 28.3027
6 4.00 31.24 ± 2.782 20.08 ± 2.371 62.4796 44.4366
7 6.00 26.23 ± 2.901 17.54 ± 2.855 78.6897 37.6117
8 8.00 15.56 ± 3.209 10.29 ± 3.434 62.2418 27.8307
9 12.00 8.24 ± 2.531 7.13 ± 2.014 49.4358 34.8453
10 24.00 2.48 ± 1.462 2.70 ± 1.988 29.7812 58.9919
Total
354.1785
256.3607
*Indicates average of 6 determinations
CCNS – Candesartan Cilexetil Nanosuspension,
CCMKT – Candesartan Cilexetil Marketed Formulation
Figure 4.16 shows the mean plasma concentration (µg/ml) vs. Time (h) in rats after
administration of optimized nanosuspension of candesartan cilexetil and its marketed
formulation (Atacand®). It is evident that the area under curve (AUC) values, for the
optimized formulation containing candesartan cilexetil was higher than the corresponding
values of the marketed formulation of candesartan cilexetil (Table 4.19). The increase
AUC values could be attributed to the improved dissolution of candesartan cilexetil from
the optimized nanosuspension formulation as compared to its marketed formulation.

CHAPTER 4 RESULTS AND DISCUSSION
133
FIGURE 4.16: Plasma concentration vs. time profile of candesartan cilexetil
nanosuspension and marketed formulation
The values of all major pharmacokinetic parameters like maximum plasma concentration
(Cmax), the time required for maximum plasma concentration (Tmax), the area under the
curve (AUC0→24), terminal half-life (T1/2), elimination rate constant (KE) and absorption
rate constant (Ka) have been summarized in Table 4.20.
TABLE 4.20: Results of pharmacokinetic parameters of candesartan cilexetil
nanosuspension and marketed formulation
Pharmacokinetic
Parameters
Candesartan Cilexetil
Nanosuspension
(CCNS)
Candesartan Cilexetil
Marketed Formulation
(CCMKT)
Cmax (ng/ml) 43.29 32.24
Tmax (h) 0.5 1.0
AUC0-24 (ng/ml)*h 354.18 256.36
t 1/2E (h) 7.689 8.431
KE (h-1) 0.090 0.082
Ka (h-1) 0.281 0.169

CHAPTER 4 RESULTS AND DISCUSSION
134
The calculation was performed for the equivalent dose of test product (CCNS)
required attaining same Cmax as of marketed product. [194]
F-Ratio was calculated from the following equation,
Eq...(4.3)
Where, Fr = Relative bioavailability (F-Ratio)
[AUC]test = AUC of candesartan cilexetil nanosuspension
[AUC]std = AUC of candesartan cilexetil marketed formulation
[D]test = Dose of candesartan cilexetil nanosuspension
[D]std = Dose of candesartan cilexetil marketed formulation
Using above equation, bioavailability fraction obtained from candesartan cilexetil
nanosuspension was 1.39.
Volume of distribution was calculated by following equation,
Eq...(4.4)
Where, Vd = Volume of distribution
F = F-Ratio
D = Dose of the product
Cmax = Maximum plasma concentration
Using above equation, the volume of distribution obtained from candesartan cilexetil
nanosuspension was 26.136 lit.
From the following equation amount of candesartan cilexetil to be administered to attain
the same plasma concentration of marketed product was calculated
Eq...(4.5)
Where C = Cmax of candesartan cilexetil marketed formulation
Ka = Absorption rate constant of candesartan cilexetil nanosuspension
F = F- Ratio
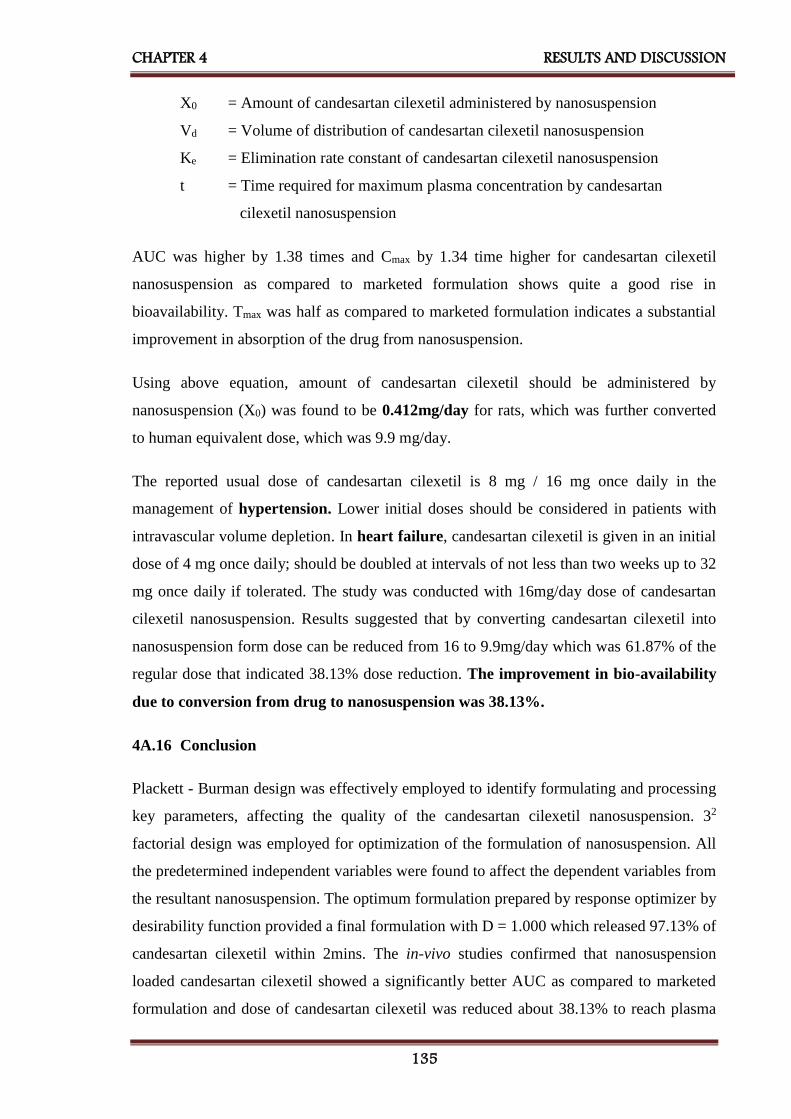
CHAPTER 4 RESULTS AND DISCUSSION
135
X0 = Amount of candesartan cilexetil administered by nanosuspension
Vd = Volume of distribution of candesartan cilexetil nanosuspension
Ke = Elimination rate constant of candesartan cilexetil nanosuspension
t = Time required for maximum plasma concentration by candesartan
cilexetil nanosuspension
AUC was higher by 1.38 times and Cmax by 1.34 time higher for candesartan cilexetil
nanosuspension as compared to marketed formulation shows quite a good rise in
bioavailability. Tmax was half as compared to marketed formulation indicates a substantial
improvement in absorption of the drug from nanosuspension.
Using above equation, amount of candesartan cilexetil should be administered by
nanosuspension (X0) was found to be 0.412mg/day for rats, which was further converted
to human equivalent dose, which was 9.9 mg/day.
The reported usual dose of candesartan cilexetil is 8 mg / 16 mg once daily in the
management of hypertension. Lower initial doses should be considered in patients with
intravascular volume depletion. In heart failure, candesartan cilexetil is given in an initial
dose of 4 mg once daily; should be doubled at intervals of not less than two weeks up to 32
mg once daily if tolerated. The study was conducted with 16mg/day dose of candesartan
cilexetil nanosuspension. Results suggested that by converting candesartan cilexetil into
nanosuspension form dose can be reduced from 16 to 9.9mg/day which was 61.87% of the
regular dose that indicated 38.13% dose reduction. The improvement in bio-availability
due to conversion from drug to nanosuspension was 38.13%.
4A.16 Conclusion
Plackett - Burman design was effectively employed to identify formulating and processing
key parameters, affecting the quality of the candesartan cilexetil nanosuspension. 32
factorial design was employed for optimization of the formulation of nanosuspension. All
the predetermined independent variables were found to affect the dependent variables from
the resultant nanosuspension. The optimum formulation prepared by response optimizer by
desirability function provided a final formulation with D = 1.000 which released 97.13% of
candesartan cilexetil within 2mins. The in-vivo studies confirmed that nanosuspension
loaded candesartan cilexetil showed a significantly better AUC as compared to marketed
formulation and dose of candesartan cilexetil was reduced about 38.13% to reach plasma

CHAPTER 4 RESULTS AND DISCUSSION
136
concentration of marketed formulation. The improved formulation could offer improved
drug delivery strategy which might allow concomitant use of candesartan cilexetil in
nanosuspension form. The nanosuspension of candesartan cilexetil exhibited 38.13%
improvement in bio-availability.
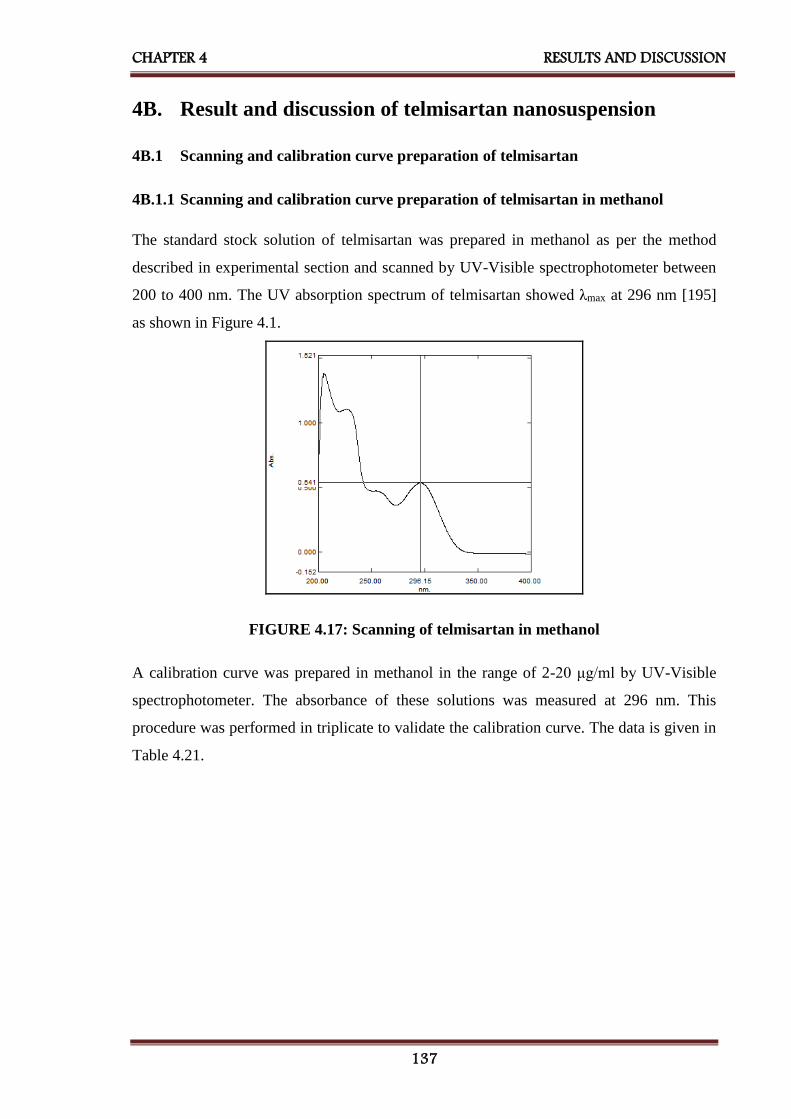
CHAPTER 4 RESULTS AND DISCUSSION
137
4B. Result and discussion of telmisartan nanosuspension
4B.1 Scanning and calibration curve preparation of telmisartan
4B.1.1 Scanning and calibration curve preparation of telmisartan in methanol
The standard stock solution of telmisartan was prepared in methanol as per the method
described in experimental section and scanned by UV-Visible spectrophotometer between
200 to 400 nm. The UV absorption spectrum of telmisartan showed λmax at 296 nm [195]
as shown in Figure 4.1.
FIGURE 4.17: Scanning of telmisartan in methanol
A calibration curve was prepared in methanol in the range of 2-20 μg/ml by UV-Visible
spectrophotometer. The absorbance of these solutions was measured at 296 nm. This
procedure was performed in triplicate to validate the calibration curve. The data is given in
Table 4.21.

CHAPTER 4 RESULTS AND DISCUSSION
138
TABLE 4.21: Calibration curve data of telmisartan in methanol
Sr.
No.
Concentration
(µg/ml)
Absorbance at 296nm*
(Mean ± SD)
1 0 0.000 ± 0.000
2 2 0.117 ± 0.008
3 4 0.221 ± 0.008
4 6 0.327 ± 0.009
5 8 0.440 ± 0.018
6 10 0.532 ± 0.013
7 12 0.625 ± 0.015
8 14 0.724 ± 0.010
9 16 0.842 ± 0.017
10 18 0.939 ± 0.009
11 20 1.050 ± 0.015
*Indicates average of three determinations
A calibration curve was constructed by plotting absorbance vs. concentration in µg/ml as
shown in Figure 4.18 and regression equation was found to be Y = 0.051X + 0.011 with
regression coefficient 0.999.
FIGURE 4.18: Calibration curve of telmisartan in methanol

CHAPTER 4 RESULTS AND DISCUSSION
139
4.1B.2 Scanning and calibration curve preparation of telmisartan in phosphate
buffer, pH 7.5.
The standard stock solution of telmisartan (10 µg/ml) was prepared in phosphate buffer,
pH 7.5, scanned by UV-Visible spectrophotometer between 200 to 400 nm. The UV
absorption spectrum of telmisartan showed λmax at 296 nm [196] as shown in Figure 4.19.
FIGURE 4.19: Scanning of telmisartan in phosphate buffer, pH 7.5
A calibration curve was prepared in phosphate buffer, pH 7.5 [172] in the range of 2-20
μg/ml by UV-Visible spectrophotometer. The absorbance of these solutions was measured
at 296 nm. This procedure was performed in triplicate to validate the calibration curve.
The data is given in Table 4.22.

CHAPTER 4 RESULTS AND DISCUSSION
140
TABLE 4.22: Calibration curve data of telmisartan in phosphate buffer, pH 7.5
Sr.
No.
Concentration
(µg/ml)
Absorbance at 296nm*
(Mean ± SD)
1 0 0.000 ± 0.000
2 2 0.079 ± 0.004
3 4 0.167 ± 0.011
4 6 0.242 ± 0.012
5 8 0.348 ± 0.009
6 10 0.420 ± 0.009
7 12 0.494 ± 0.008
8 14 0.582 ± 0.012
9 16 0.664 ± 0.012
10 18 0.755 ± 0.015
11 20 0.854 ± 0.0100
*Indicates average of three determinations
A calibration curve was prepared in phosphate buffer, pH 7.5 in the range of 2-20 μg/ml as
shown in Figure 4.20 and regression equation was found to be Y = 0.042X - 0.003 with
regression coefficient 0.999.
FIGURE 4.20: Calibration curve of telmisartan in phosphate buffer, pH 7.5
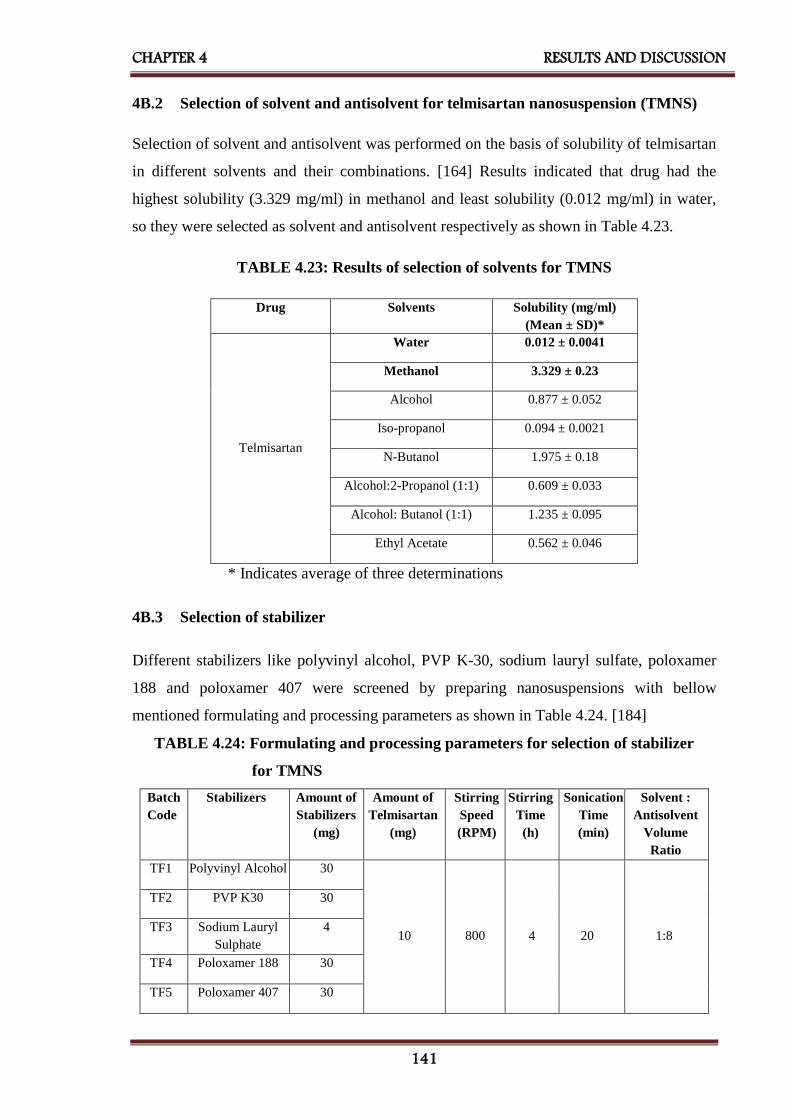
CHAPTER 4 RESULTS AND DISCUSSION
141
4B.2 Selection of solvent and antisolvent for telmisartan nanosuspension (TMNS)
Selection of solvent and antisolvent was performed on the basis of solubility of telmisartan
in different solvents and their combinations. [164] Results indicated that drug had the
highest solubility (3.329 mg/ml) in methanol and least solubility (0.012 mg/ml) in water,
so they were selected as solvent and antisolvent respectively as shown in Table 4.23.
TABLE 4.23: Results of selection of solvents for TMNS
Drug Solvents Solubility (mg/ml)
(Mean ± SD)*
Telmisartan
Water 0.012 ± 0.0041
Methanol 3.329 ± 0.23
Alcohol 0.877 ± 0.052
Iso-propanol 0.094 ± 0.0021
N-Butanol 1.975 ± 0.18
Alcohol:2-Propanol (1:1) 0.609 ± 0.033
Alcohol: Butanol (1:1) 1.235 ± 0.095
Ethyl Acetate 0.562 ± 0.046
* Indicates average of three determinations
4B.3 Selection of stabilizer
Different stabilizers like polyvinyl alcohol, PVP K-30, sodium lauryl sulfate, poloxamer
188 and poloxamer 407 were screened by preparing nanosuspensions with bellow
mentioned formulating and processing parameters as shown in Table 4.24. [184]
TABLE 4.24: Formulating and processing parameters for selection of stabilizer
for TMNS
Batch
Code
Stabilizers Amount of
Stabilizers
(mg)
Amount of
Telmisartan
(mg)
Stirring
Speed
(RPM)
Stirring
Time
(h)
Sonication
Time
(min)
Solvent :
Antisolvent
Volume
Ratio
TF1 Polyvinyl Alcohol 30
10 800 4 20 1:8
TF2 PVP K30 30
TF3 Sodium Lauryl
Sulphate
4
TF4 Poloxamer 188 30
TF5 Poloxamer 407 30

CHAPTER 4 RESULTS AND DISCUSSION
142
The prepared nanosuspensions (TF1 to TF5) were evaluated by measuring their saturation
solubility, mean particle size, polydispersity index (PDI) and zeta potential for selection of
the best stabilizer which can be utilized for further research work, as shown in Table 4.25.
TABLE 4.25: Results for selection of stabilizer for TMNS
Batch
Code
Stabilizer
Used
Saturation
Solubility
(µg/ml)
(Mean ± SD)*
Mean
Particle
Size
(nm)
(Mean ± SD)*
PDI
(Mean ± SD)*
Zeta
Potential
(mV)
(Mean ± SD)*
TF1 Polyvinyl Alcohol 58.46 ± 2.55 214.8 ± 5.1 0.742 ± 0.21 17.60 ± 1.25
TF2 PVP K-30 39.51 ± 1.47 360.0 ± 3.8 1.077 ± 0.14 19.85 ± 1.38
TF3 Sodium Lauryl
Sulphate
36.09 ± 0.84 85.60 ± 4.8 1.255 ± 0.34 -16.68 ± 1.41
TF4 Poloxamer 188 48.61 ± 0.97 380.0 ± 6.4 1.423 ± 0.41 -15.34 ± 0.97
TF5 Poloxamer 407 76.38 ± 1.02 276.5 ± 5.1 0.673 ± 0.11 -22.82 ± 1.02
* Indicates average of three determinations
Table 4.25 indicated that poloxamer 407 showing highest saturation solubility. It also
showed minimum PDI showing uniformity in particle size of nanosuspension and highest
zeta potential indicating greater stability, so poloxamer 407 was selected as a stabilizer for
further studies.
4B.4 Drug-excipient compatibility study
Studies of drug-excipient compatibility represent an important phase in the preformulation
stage of the development of all dosage forms. The potential physical and chemical
interactions between drugs and excipients can affect the chemical, physical, therapeutical
properties and stability of the dosage form. Fourier transformed infrared (FTIR)
spectroscopy and differential scanning calorimetry (DSC) were selected for checking of
drug-excipient compatibility. [197]
4B.4.1 Fourier transformed infrared (FTIR) spectroscopy
FTIR spectroscopy was conducted using a Shimadzu FTIR 8400 spectrophotometer
(Shimadzu, Tokyo, Japan) and the spectrum was recorded in the wavelength region of
4000–400 cm-1 as shown in Figure 4.21 [A, B, C].

CHAPTER 4 RESULTS AND DISCUSSION
143
400600800120016002000240028003200360040001/cm
25
30
35
40
45
50
55
60
65
70
75
80
85
90
95
100%T
3743
.96
3059
.20
2960
.83 2870
.17
2470
.90
1930
.81
1695
.4916
04.83
1518
.0314
58.23 13
03.92
1269
.20
1128
.39 1010
.73 918.1
586
2.21 80
6.27
750.3
365
3.89
576.7
453
4.30
T
FIGURE 4.21 [A]: FT-IR spectra of telmisartan
400600800120016002000240028003200360040001/cm
-20
-10
0
10
20
30
40
50
60
70
80
90
100%T
3524
.0634
81.63
2970
.4828
85.60
2739
.01 2694
.65
2360
.95
2235
.5721
64.20
1963
.60
1649
.19
1465
.95
1344
.4312
80.78 12
38.34
1114
.89 962.5
1
842.9
2
663.5
356
9.02
528.5
143
7.86
2
FIGURE 4.21 [B]: FT-IR spectra of poloxamer 407
400800120016002000240028003200360040001/cm
7.5
15
22.5
30
37.5
45
52.5
60
67.5
75
82.5
90
97.5
105%T
3838
.4737
78.68
3655
.23
2881
.75
1691
.63
1537
.3214
62.09 13
42.50
1276
.92 1238
.3411
09.11
960.5
8
840.9
976
5.77
592.1
748
4.15
432.0
7
FIGURE 4.21 [C]: FT-IR spectra of a physical mixture of telmisartan and
poloxamer 407
Telmisartan, poloxamer 407 and its physical mixture were subjected to FTIR studies and
characteristic bands were identified and given in Table 4.26.

CHAPTER 4 RESULTS AND DISCUSSION
144
TABLE 4.26: Comparison of characteristic bands between telmisartan and its
physical mixture
Characteristic bands
[187,188]
Peak Value, cm-1
Telmisartan Physical Mixture
-OH stretching of –COOH 1518.03 1517.32
-COOH stretching 1695.49 1691.63
Aliphatic C-H stretching 2880.17 2881.75
Table 4.26 indicates that the bands were similar for both pure drug and physical mixture
and therefore there was no incompatibility between telmisartan and poloxamer 407.
4B.4.2 Differential scanning calorimetry (DSC)
DSC was performed using DSC-60 (Shimadzu, Tokyo, Japan) calorimeter to study the
thermal behavior of samples (telmisartan, poloxamer 407, physical mixture and
lyophilized nanosuspension). Information of thermal analysis by DSC can be seen in
Figure 4.22.

CHAPTER 4 RESULTS AND DISCUSSION
145
FIGURE 4.22: DSC thermograms of [A] Telmisartan [B] Poloxamer 407
[C] Physical mixture of telmisartan and poloxamer 407
[D] Lyophilized nanosuspension of telmisartan
In DSC measurements, telmisartan showed the melting endotherm at 262.62°C, while the
melting endotherm of the physical mixture was observed at 261.59°C. However, no
endotherm was observed in the DSC curve for lyophilized nanosuspension. This result
indicated that telmisartan no longer presents as a crystalline form when processed by
antisolvent precipitation followed by ultrasonication, but exists in the amorphous state.
4B.5 Plackett - Burman Design (PB)
Most common screening design is Plackett–Burman (PB) design that screens a large
number of factors and identifies critical one in a minimal number of running with a good
degree of accuracy. Generally, a number of runs needed to investigate the main effects are
multiple of 4 in PB designs.[189,190] It is used during the initial phase of the study.
D

CHAPTER 4 RESULTS AND DISCUSSION
146
Provided the interaction effects are nil or negligible, the Plackett-Burman design is
effective for measuring main effects. As shown in Table 4.27, the selected response
parameters showed a wide variation suggesting that the independent variables had a
significant effect on the response parameters chosen.
TABLE 4.27: Layout and observed responses of Plackett - Burman design
batches for TMNS (Preliminary Screening Formulations)
Batch
Code
Amount
of
Telmisartan
(mg)
X1
Amount
of
Poloxamer
407
(mg)
X2
Solvent :
Antisolvent
Volume
Ratio
X3
Stirring
Speed
(RPM)
X4
Sonication
Time
(Min)
X5
Saturation
Solubility
(μg/ml)
(Mean ± SD)*
Y1
Mean
Particle Size
(nm)
(Mean ± SD)*
Y2
TF6 20 50 1:8 800 30 70.21 ± 2.14 373.3 ± 9.8
TF7 10 50 1:8 1200 10 84.50 ± 1.98 130.1 ± 6.4
TF8 10 30 1:8 1200 30 78.19 ± 2.05 215.5 ± 6.8
TF9 20 30 1:5 1200 30 87.48 ± 1.14 112.8 ± 5.1
TF10 10 50 1:5 800 30 86.29 ± 0.97 123.8 ± 5.7
TF11 20 30 1:8 800 10 86.88 ± 1.85 125.0 ± 4.2
TF12 20 50 1:5 1200 10 84.26 ± 2.51 132.5 ± 4.5
TF13 10 30 1:5 800 10 60.69 ± 1.21 389.2 ± 7.1
* Indicates average of three determinations
Figure 4.23 and Figure 4.24 indicated stirring speed and amount of telmisartan had
maximum effect on mean particle size and saturation solubility as compared to other
parameters like amount of poloxamer 407, the solvent to antisolvent volume ratio and
sonication time.
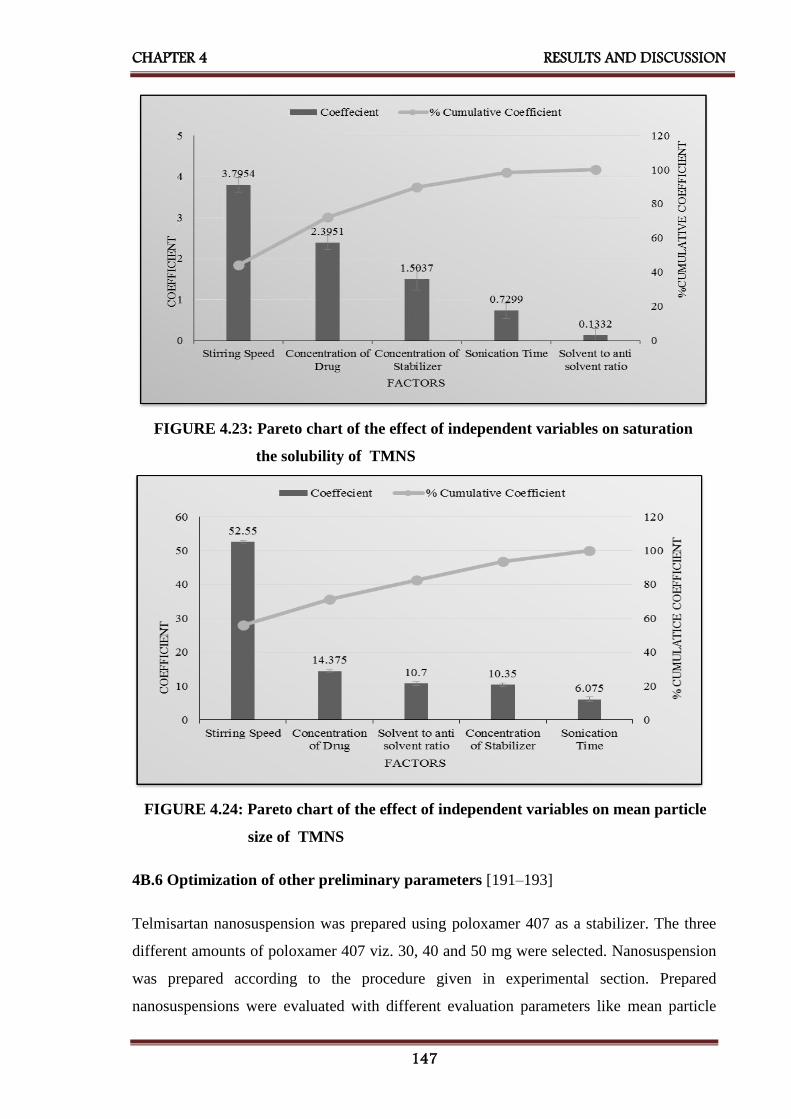
CHAPTER 4 RESULTS AND DISCUSSION
147
FIGURE 4.23: Pareto chart of the effect of independent variables on saturation
the solubility of TMNS
FIGURE 4.24: Pareto chart of the effect of independent variables on mean particle
size of TMNS
4B.6 Optimization of other preliminary parameters [191–193]
Telmisartan nanosuspension was prepared using poloxamer 407 as a stabilizer. The three
different amounts of poloxamer 407 viz. 30, 40 and 50 mg were selected. Nanosuspension
was prepared according to the procedure given in experimental section. Prepared
nanosuspensions were evaluated with different evaluation parameters like mean particle

CHAPTER 4 RESULTS AND DISCUSSION
148
size and saturation solubility to select amount of poloxamer 407 for further formulation
work. As shown in Table 4.28, 50mg poloxamer 407 was selected which was showing
minimum mean particle size and maximum saturation solubility.
Solvent: antisolvent volume ratio is important formulation parameter for preparation of
nanosuspension. For the optimization of solvent: antisolvent volume ratio 1:4, 1:6 and 1:8
were selected. Nanosuspensions were prepared according to the procedure given in
experimental section. Prepared nanosuspensions were evaluated with different evaluation
parameters like mean particle size and saturation solubility to select solvent: antisolvent
volume ratio for further formulation work, as shown in Table 4.28, 1:8 solvent: antisolvent
volume ratio was selected which was showing minimum mean particle size and maximum
saturation solubility.
Once the precipitation of drug particle had occurred in suspension, to convert into the
uniform nanosized particles probe sonicator was used. 10 mins, 20 mins, and 30 mins
period were selected for sonication. Nanosuspension was prepared according to the
procedure given before. Prepared nanosuspensions were evaluated with different
evaluation parameters like mean particle size and saturation solubility to select the
optimized time period of sonication for further formulation work. As shown in Table 4.28,
30 mins sonication time was selected which was showing minimum mean particle size and
maximum saturation solubility.
TABLE 4.28: Results of optimization of other preliminary parameters for TMNS
Batch
Code
Preliminary
Parameters
Mean
Particle Size
(nm)
(Mean ± SD)*
Saturation
Solubility
(µg/ml)
(Mean ± SD)*
TF14 Amount of
Poloxamer 407
(mg)
30 304.5 ± 5.2 64.36 ± 1.15
TF15 40 228.0 ± 9.2 77.22 ± 1.52
TF16 50 152.4 ± 7.4 82.17 ± 1.29
TF17 Solvent to
Antisolvent
Volume Ratio
1:4 312.0 ± 3.9 79.71 ± 1.21
TF18 1:6 289.8 ± 8.4 77.24 ± 1.32
TF19 1:8 254.2 ± 11.2 91.3 ± 1.51
TF20 Sonication
Time
(min)
10 365.5 ± 9.0 62.27 ± 1.09
TF21 20 222.3 ± 6.7 69.22 ± 1.26
TF22 30 180.2 ± 5.8 83.31 ± 1.35
* Indicates average of three determinations
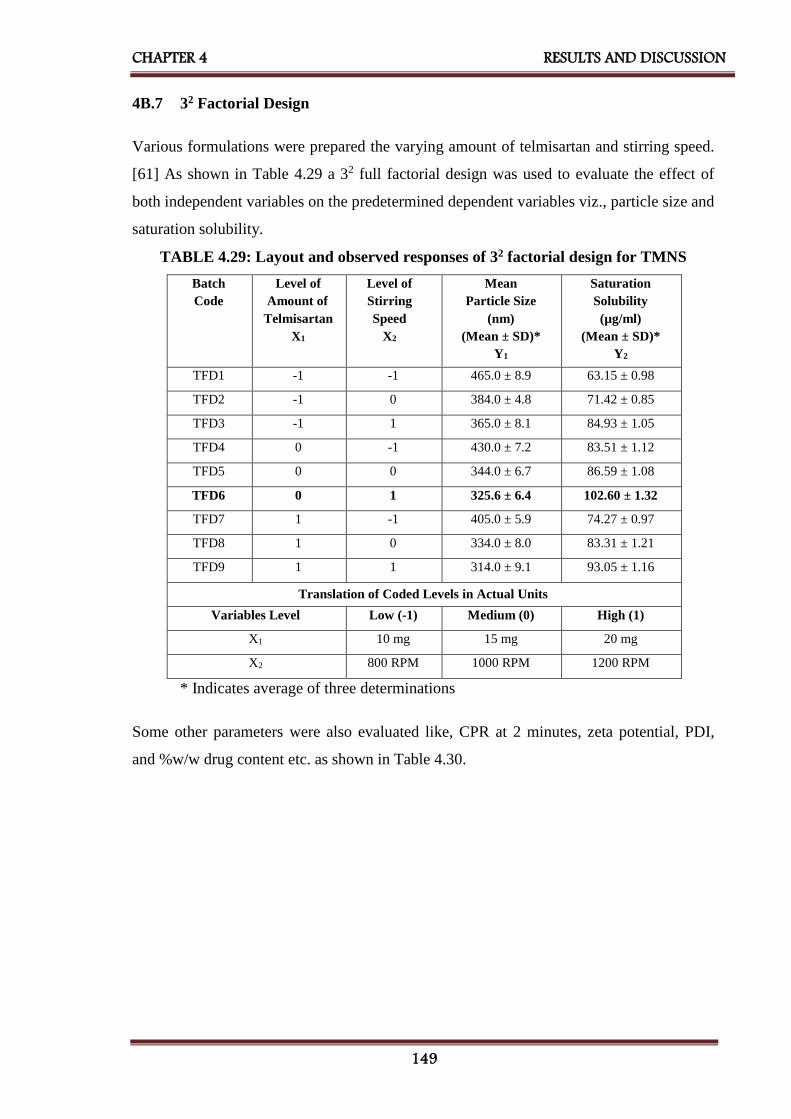
CHAPTER 4 RESULTS AND DISCUSSION
149
4B.7 32 Factorial Design
Various formulations were prepared the varying amount of telmisartan and stirring speed.
[61] As shown in Table 4.29 a 32 full factorial design was used to evaluate the effect of
both independent variables on the predetermined dependent variables viz., particle size and
saturation solubility.
TABLE 4.29: Layout and observed responses of 32 factorial design for TMNS
Batch
Code
Level of
Amount of
Telmisartan
X1
Level of
Stirring
Speed
X2
Mean
Particle Size
(nm)
(Mean ± SD)*
Y1
Saturation
Solubility
(µg/ml)
(Mean ± SD)*
Y2
TFD1 -1 -1 465.0 ± 8.9 63.15 ± 0.98
TFD2 -1 0 384.0 ± 4.8 71.42 ± 0.85
TFD3 -1 1 365.0 ± 8.1 84.93 ± 1.05
TFD4 0 -1 430.0 ± 7.2 83.51 ± 1.12
TFD5 0 0 344.0 ± 6.7 86.59 ± 1.08
TFD6 0 1 325.6 ± 6.4 102.60 ± 1.32
TFD7 1 -1 405.0 ± 5.9 74.27 ± 0.97
TFD8 1 0 334.0 ± 8.0 83.31 ± 1.21
TFD9 1 1 314.0 ± 9.1 93.05 ± 1.16
Translation of Coded Levels in Actual Units
Variables Level Low (-1) Medium (0) High (1)
X1 10 mg 15 mg 20 mg
X2 800 RPM 1000 RPM 1200 RPM
* Indicates average of three determinations
Some other parameters were also evaluated like, CPR at 2 minutes, zeta potential, PDI,
and %w/w drug content etc. as shown in Table 4.30.

CHAPTER 4 RESULTS AND DISCUSSION
150
Table 4.30: Other evaluation parameters of factorial batches of TMNS
Batch
Code
CPR at 2mins
(% w/w)
(Mean ± SD)*
PDI
(Mean ± SD)*
Zeta Potential
(mV)
(Mean ± SD)*
Drug Content
(%w/w)
(Mean ± SD)*
TFD1 92.17 ± 1.84 0.529 ± 0.049 17.38 ± 1.82 95.24 ± 1.02
TFD2 101.27 ± 2.25 0.919 ± 0.112 -28.10 ± 2.06 97.52 ± 1.11
TFD3 88.64 ± 1.56 0.784 ± 0.082 -15.33 ± 1.48 100.95 ± 1.84
TFD4 97.92 ± 1.91 0.963 ± 0.101 -18.08 ± 1.09 99.81 ± 0.54
TFD5 93.32 ± 1.42 0.845 ± 0.062 27.76 ± 2.15 96.00 ± 0.29
TFD6 98.24 ± 1.38 0.459 ± 0.038 -29.96 ± 1.87 99.54 ± 0.81
TFD7 96.25 ± 2.05 0.419 ± 0.051 -18.22 ± 1.55 94.00 ± 0.73
TFD8 93.28 ± 1.09 0.716 ± 0.068 -19.04 ± 1.61 92.10 ± 0.58
TFD9 91.27 ±1 .19 0.645 ± 0.043 19.27 ± 1.72 93.24 ± 0.69
* Indicates average of three determinations
4B.8 Statistical analysis
A full model was derived after putting the values of regression coefficients in the equation
(3.8). Regression analysis was carried out using Microsoft Excel® version 2013 (Microsoft
Corporation, Washington, USA); the fitted results are shown in Table 4.31, Table 4.32,
equation (4.6) and (4.7).
TABLE 4.31: Results of regression analysis of mean particle size for TMNS
Mean Particle Size (nm) (Y1)
Coefficient Std. Error P- value
b0 346.3333 3.115572 1.605E-06
b1 -26.8333 1.706469 0.000559056
b2 -49.3333 1.706469 9.08819E-05
b11 11.5 2.955691 0.030105281
b22 30 2.955691 0.00203757
b12 2.25 2.089989 0.360540266
R2 = 0.997511
For mean particle size (nm) (Y1)
Y1 = 346.33 – 26.83X1 - 49.33X2 – 11.5X12 + 30X2
2 + 2.25X1X2 Eq...(4.6)

CHAPTER 4 RESULTS AND DISCUSSION
151
TABLE 4.32: Results of regression analysis of saturation solubility for TMNS
Saturation Solubility (µg/ml) (Y2)
Coefficient Std. Error P- value
b0 90.47 0.853323206 1.84994E-06
b1 5.188333333 0.467384369 0.001566266
b2 9.941666667 0.467384369 0.000227337
b11 -13.545 0.809533473 0.000464816
b22 2.145 0.809533473 0.077015288
b12 -0.75 0.572426609 0.281413408
R2 = 0.996541
For saturation solubility (µg/ml) (Y2)
Y2 = 90.47 + 5.1883X1 + 9.941X2 – 13.545X12 + 2.145X2
2 – 0.75X1X2 Eq...(4.7)
The coefficients in Table 4.31 and Table 4.32 represent the respective quantitative effect
of independent variables (X1 and X2) and their interactions on the various responses. It was
seen that all the independent variables had a significant effect on the response (p<0.05).
The negative sign of the coefficient indicated that increase in the value of independent
variable decreases the value of response and vice versa. The absolute value of the
coefficient indicates the magnitude of the effect of the independent variable on the
response; higher the value higher the magnitude.
TABLE 4.33: ANOVA for a full model for TMNS
Source of
variation
DF SS MS F F significant
Mean Particle Size (nm)
Regression 5 21007.58333 4201.516667 240.4683625 0.000420651
Residual 3 52.41666667 17.47222222 - -
Total 8 21060 - - -
Saturation Solubility (µg/ml)
Regression 5 1132.919333 226.5838667 172.8738746 0.000688496
Residual 3 3.932066667 1.310688889 - -
Total 8 1136.8514 - - -

CHAPTER 4 RESULTS AND DISCUSSION
152
The results of ANOVA for full model suggested that Fcal value for mean particle size was
240.46. Ftab value at (5, 3) was 9.0 for Y1. So, Fcal value for Y1 was higher than Ftab.
The results of ANOVA for full model suggested that Fcal value for saturation solubility was
172.87. Ftab value at (5, 3) was 9.0 for Y2. So, Fcal value for Y2 was higher than Ftab.
All dependent variables were found Fcal value significantly higher than Ftab. Therefore,
selected factors have a significant effect on all three dependent variables.
All the determination coefficients R2 are larger than 0.99, indicating that over 99% of the
variation in the response could be explained by the model and the goodness of fit of the
model was confirmed. The F-ratio was found to be far greater than the theoretical value
with a very low probability of less than 0.0001 for each regression model, indicating that
the regression model is significant with a confidence level of 95%. The observed responses
showed a wide variation suggesting that the selected both independent variables had a
significant effect on resultant particle size and saturation solubility.
4B.9 Contour plots
Two-dimensional contour plots were established using statistical software Minitab 17
(Minitab Inc., USA) to examine the relationship between independent and dependent
variables as shown in the figure.
Figure 4.25 [A] shows contour plot for particle size (nm) at prefixed values between 330 to
450 nm. The contour plot was found to be non-linear. So the relationship between
independent variables and particle size is not linear. The minimum (Light Green part) is
clearly evidence from contour plot which specifies the stirring speed and amount of
telmisartan for lowest particle size. Their respective values are approx. 1200rpm (coded
value +1) stirring speed and 15 mg (coded value 0) amount of telmisartan.
Figure 4.25 [B] shows contour plot for saturation solubility (µg/ml) at prefixed values
between 70 to 100 µg/ml. The contour plot was found to be non-linear. So the relationship
between independent variables and dependent variables were not linear. The maximum
(Dark Green part) is clearly evidence from contour plot which specifies the stirring speed
and amount of telmisartan for maximum saturation solubility. Their respective values are
approx. 1200rpm (coded value +1) stirring speed and 15 mg (coded value 0) amount of
telmisartan.

CHAPTER 4 RESULTS AND DISCUSSION
153
The maxima of saturation solubility and minima of particle size are seemed to be
overlapping. So, there exists a direct relation between saturation solubility and particle
size. The batch showing lowest particle size is also having highest saturation solubility.
Amount of Telmisartan
Stir
rin
g S
peed
1.00.50.0-0.5-1.0
1.0
0.5
0.0
-0.5
-1.0
>
–
–
–
–
< 330
330 360
360 390
390 420
420 450
450
Size(nm)
Particle
Contour Plot of Particle Size(nm) Vs Stirring Speed, Amount of Telmisartan
Amount of Telmisartan
Stir
rin
g S
peed
1.00.50.0-0.5-1.0
1.0
0.5
0.0
-0.5
-1.0
>
–
–
–
< 70
70 80
80 90
90 100
100
(ug/ml)
Solubility
Saturation
Contour Plot of Saturation Solubility(ug/ml) Vs Stirring Speed, Amount of Telmisartan
FIGURE 4.25 : Contour plot of TMNS for effect on [A] Mean Particle Size and
[B] Saturation Solubility
FIGURE 4.25: Contour plot of TMNS for effect on [A] Mean particle size and
[B] Saturation solubility
4B.10 Surface plots
To find out main and interaction effect of the independent variables, response surface plots
are very helpful.
Figure 4.26 [A] shows the response surface plot of particle size as a function of stirring
speed and drug concentration using statistical software Minitab 17 (Minitab Inc., USA).
Particle size decreases as the plot comes toward central part. The center of the plot
indicates the minimum particle size which was obtained by highest stirring speed and an
intermediate amount of telmisartan.
Figure 4.26 [B] shows the response surface plot of saturation solubility respectively as a
function of stirring speed and drug concentration using statistical software Minitab 17
(Minitab Inc., USA). Saturation solubility increases as the plot come toward central part.
The center of the plot indicates the highest saturation solubility which was obtained by
highest stirring speed and an intermediate amount of telmisartan.
A
B
A

CHAPTER 4 RESULTS AND DISCUSSION
154
450
10
-1
45
004
53 0
50
1
0
-1
03 0
e Size(nm)lcitraP
deepS gnirritS
T fo tnuoA elmisartanm
urS ace Plot of Particle Size(nm) Vs f tirring Speed, Amount of TelmisartanS
-1
0
70
08
90
1-1
0
1
90
100
libulo ity S noitarutaS
nirrit d SpeeS g
T foA tnuom elmisartan
urface Plot of Saturation Solubility(ug/ml) Vs Stirring Speed, Amount of TeS misartanl
FIGURE 4.26: Response surface plot of TMNS for effect on [A] Mean particle size
and [B] Saturation solubility
4B.11 Optimization of nanosuspension by desirability function of Minitab17.0
The optimum formulation was selected based on the criteria of attaining the minimum
mean particle size (Y1) and the maximum saturation solubility (Y2). An overall desirability
function dependent on all investigated formulation variables was used to predict the ranges
of the variable where the optimum formulation might occur. The desirable ranges are from
zero to one (least to most desirable, respectively). The optimized batch composition is
presented in below Figure 4.27.
FIGURE 4.27: Optimized plot of factorial design form Minitab 17 for TMNS
B A

CHAPTER 4 RESULTS AND DISCUSSION
155
4B.12 Checkpoint cum optimized batch analysis
From the above Minitab data optimized batch was TFD-6. The desirability of the
optimized batch was 0.9629. Formulation and process parameters for the optimized batch
are shown in Table 4.34. The optimized lyophilized formulation was filled in hard gelatin
capsules and kept in the tightly closed container.
TABLE 4.34: Formulation and process parameters for an optimized batch of TMNS
Amount of Telmisartan 15 mg
Amount of Poloxamer 407 50 mg
Solvent: Antisolvent Volume Ratio 1:8
Stirring Speed 1200 RPM
Stirring Time 4 h
Sonication Time 30 mins
Amount of lyophilizer
(1:1, Total Solid: Mannitol)
65 mg
4B.13 Checkpoint batch cum optimized batch validation
To evaluate model a checkpoint batch cum optimized batch TFD-6 was prepared at X1 = 0
and X2 = +1 levels. Dependent parameters were determined and compared with predicted
values as shown in Table 4.35.
TABLE 4.35: Composition of checkpoint batch cum optimized batch of TMNS
Amount of Drug (X1) Solvent-Antisolvent Volume Ratio (X2)
Coded value Decoded value Coded value Decoded value
0 15 mg +1 1:8
TABLE 4.36: Comparison of calculated data with experimental data of TMNS
Response Predicted Observed % Bias
Mean Particle Size (Y1) 327.0 nm 328.0 nm + 0.305%
Saturation Solubility (Y2) 102.55 µg/ml 100.16 µg/ml - 2.330%
When the batch TFD-6 was prepared using defined level of the amount of telmisartan and
stirring speed using Minitab17 (Minitab Inc., USA), the results obtained with checkpoint
cum optimized batch (TFD-6) were close to predicted values. Thus, it can be concluded
that the statistical model is mathematically valid.

CHAPTER 4 RESULTS AND DISCUSSION
156
4B.14 Evaluation of optimized batch of telmisartan nanosuspension
4B.14.1 Particle size and PDI
Particle size distribution of the optimized batch is shown in Figure 4.28. The mean particle
size of the optimized batch is 328.0±9.6 nm. Telmisartan nanosuspension based final
formulation was intended for oral administration for which PDI and particle size above
5µm is not critical. The particle size of a nanosuspension is around 200-1000 nm. [80]
From the Table 4.29, it was found that mean particle sizes of all formulations were in the
nanometer range. It shows that all formulations fulfill the requirements of a
nanosuspension.
Figure 4.28: Particle size graph for TMNS
4B.14.2 Zeta potential
Poloxamer 407 is a well-known efficient polymeric stabilizer forming a substantial
mechanical and thermodynamic barrier at the interface of drug nanoparticles. [198] In
general, zeta potential value of ± 30mV is sufficient for the stability of nanosuspension.
[171] Zeta potential of optimized formulation was observed -30.36 ± 2.51mV which
complies with the requirement of zeta potential.
4B.14.3 Drug content
An aliquot (1 ml) of the prepared nanosuspension was diluted in methanol and filtered with
a 0.2 μm filter. Total drug content was determined by UV-Visible spectrophotometer at
296 nm and was found to be 99.54% w/w of the telmisartan.

CHAPTER 4 RESULTS AND DISCUSSION
157
4B.14.4 Saturation solubility
Saturation solubility of an optimized batch of telmisartan nanosuspension and the pure
drug was found to be 100.16 µg/ml and 3.51 µg/ml respectively. It indicates that saturation
solubility of nanosuspension was 30-35 times than that of pure drug. This drastic increase
in saturation solubility is as a result of a reduction in particle size and subsequent increase
in surface area. So, it can be assumed that this increase in saturation solubility may
increase bioavailability.
4B.14.5 In-vitro dissolution study
The dissolution profile of nanosuspension, un-milled (pure drug) suspension and marketed
formulation (Inditel 40 Tablet) are presented in Figure 4.29. In nanosuspension, more than
102.60 % drug was released within 2 mins, while cumulative percentage drug release of
un-milled suspension, marketed formulated showed 16.41% and 77.08% at 60 mins
respectively. So, nanosuspension enhanced the rate of dissolution of telmisartan to great
extent.
0.00
20.00
40.00
60.00
80.00
100.00
120.00
0 50 100 150 200 250
Cu
mm
ula
tive
P
erce
nta
ge
Dru
g R
elea
se
Time (Min)
TMNS
TM- MKT
TM
FIGURE 4.29: Comparison of in-vitro dissolution of telmisartan nanosuspension
with marketed formulation

CHAPTER 4 RESULTS AND DISCUSSION
158
TABLE 4.37: Evaluation parameters of an optimized batch of TMNS
Evaluation Parameters Results
Mean Particle Size 328.0 nm
PDI 0.477
Zeta Potential -30.36 mV
Drug Content 99.54 %w/w
Saturation Solubility 100.16 µg/ml
CPR at 2 mins 102.60 % w/w
4B.14.6 Scanning electron microscopy (SEM)
The surface characteristics of telmisartan and its lyophilized nanosuspension were studied
by scanning electron microscopy (EVO-18, ZEISS, Germany) at 13kx to 28kx. The
samples were mounted on double-sided carbon adhesive tape that has previously been
secured on brass stubs and then subjected to gold coating by sputter coater, using
process current of 10 mA for 4 mins. The accelerating voltage was 15 kV. The surface
topology as measured by scanning electron microscopy of telmisartan was found to be
long, thin and flat with particles larger (1-20 µm) in size, as shown in Figure 4.30.
However, after conversion to lyophilized nanosuspension, particles became smaller (about
200-390 nm) which were adsorbed on the surface of mannitol used as cryoprotectant may
be by hydrophobic interaction.
FIGURE 4.30: Scanning electron microscopy of [a] telmisartan [B] TMNS

CHAPTER 4 RESULTS AND DISCUSSION
159
4B.14.7 Residual solvent by gas – chromatography (GC)
Methanol is included in Class 3 solvent, may be regarded as less toxic and of low risk to
human health. According to ICH guidelines, it is considered that amount of these residual
solvents of 3000 ppm per day would be acceptable without justification. [173] Amount of
methanol was evaluated for residual solvent content in lyophilized nanosuspension of
telmisartan by gas chromatography using head-space sampler. Results of GC indicated that
192.27 ppm methanol was present in the sample which is the far lesser amount of class 3
solvents. Figure 4.31 indicates gas chromatograph of methanol in lyophilized telmisartan
nanosuspension.
FIGURE 4.31: Gas chromatograph of methanol in the lyophilized telmisartan
nanosuspension
4B.14.8 Accelerated stability study
The accelerated stability study indicated that lyophilized telmisartan nanosuspension was
physically and chemically stable when stored at the 25 ± 2°C and 60 ± 5 % RH for a period
of 6 months. [176] Table 4.38 shows results of mean particle size, saturation solubility,
cumulative percentage release at 2 mins and %w/w of drug content indicated that there was
a slight change in all parameters which had < ±5 % bias which was insignificant. The
negligible difference was observed in results obtained from the optimized batch before and
after the stability study according to ICH guideline.

CHAPTER 4 RESULTS AND DISCUSSION
160
TABLE 4.38: Results of accelerated stability study of TMNS
Sr.
No.
Storage
condition
for
stability
study
Time
Period
(months)
Evaluation Parameters
Mean
Particle Size
(nm)
(Mean ± SD)*
Saturation
Solubility
(µg/ml)
(Mean ± SD)*
CPR at
2mins
(%w/w)
(Mean ± SD)*
Drug
Content
(%w/w)
(Mean ± SD)*
1
25°C ± 2°C
and
60% ± 5%
RH
0 328.0 ± 5.4 100.16 ± 2.1 98.24 ± 0.85 99.54 ± 0.53
2 1 339.1 ± 4.8 99.27 ± 1.80 97.98 ± 0.79 98.85 ± 0.52
3 3 356.1 ± 8.2 98.76 ± 1.65 97.12 ± 0.87 97.67 ± 0.47
4 6 385.2 ± 9.7 98.15 ± 1.71 96.54 ± 0.46 96.97 ± 0.89
* Indicates average of three determinations
4B.15 Bioavailability study
For bioavailability study, each rat was treated with oral nanosuspension of telmisartan at a
dose of 4.11 mg/kg in a single dose. Blood samples were collected from retro-orbital
venous plexus over a period 24 h. Each sample was analyzed by HPLC for the estimation
of drug content by a bioanalytical method. The pharmacokinetic calculations were
performed on the basis of plasma concentration-time data, as shown in Table 4.39.
TABLE 4.39: Results of bioavailability study of telmisartan nanosuspension and
marketed formulation
Sr. No. Time
(h)
TMNS
(ng/ml)*
(Mean ± SD)
TMMKT
(ng/ml)*
(Mean ± SD)
AUC(TMNS)
(ng/ml).h
AUC(TMMKT)
(ng/ml).h
1 0.00 0.00 ± 0.00 0.00 ± 0.00 0.0000 0.0000
2 0.25 294.42 ± 37.23 175.25 ± 30.78 36.8025 21.9063
3 0.5 370.24 ± 20.08 312.37 ± 36.14 83.0825 60.9525
4 1.00 437.59 ± 55.75 401.84 ± 37.28 201.9575 178.5525
5 2.00 512.51 ± 22.07 453.19 ± 39.93 475.0500 427.5150
6 4.00 422.36 ± 39.10 380.22 ± 47.65 934.8700 833.4100
7 6.00 385.47 ± 31.75 351.78 ± 38.60 807.8300 732.0000
8 8.00 363.42 ± 33.27 325.54 ± 21.68 748.8900 677.3200
9 12.00 309.34 ± 37.05 246.89 ± 36.02 1345.5200 1144.8600
10 24.00 215.62 ± 35.15 169.12 ± 17.72 3149.7600 2496.0600
Total 7783.7625 6572.5763
*Indicates average of 6 determinations

CHAPTER 4 RESULTS AND DISCUSSION
161
TMNS – Telmisartan Nanosuspension,
TMMKT – Telmisartan Marketed Formulation
Figure 4.32 shows the mean plasma concentration (µg/ml) vs. Time (h) in rats after
administration of optimized nanosuspension of telmisartan and its marketed formulation
(Inditel 40 Tablet). It is evident that the area under curve (AUC) values for the optimized
formulation containing telmisartan was higher than the corresponding values of the
marketed formulation of telmisartan (Table 4.39). The increase AUC values could be
attributed to the improved dissolution of telmisartan from the optimized nanosuspension
formulation as compared to its marketed formulation.
FIGURE 4.32: Plasma concentration vs. time profile of telmisartan nanosuspension
and marketed formulation
The values of all major pharmacokinetic parameters like maximum plasma concentration
(Cmax), the time required for maximum plasma concentration (Tmax), the area under the
curve (AUC0→24), terminal half-life (T1/2), elimination rate constant (KE) and absorption
rate constant (Ka) have been summarized in Table 4.40.

CHAPTER 4 RESULTS AND DISCUSSION
162
TABLE 4.40: Results of pharmacokinetic parameters of telmisartan nanosuspension
and marketed formulation
Pharmacokinetic
Parameters
Telmisartan
Nanosuspension
(TMNS)
Telmisartan Cilexetil
Marketed Formulation
(TMMKT)
Cmax (ng/ml) 542.51 453.19
Tmax (h) 1.0 2.0
AUC0-24(ng/ml)*h 7783.763 6572.576
t 1/2E (h) 23.526 20.684
KE (h-1) 0.029 0.034
Ka (h-1) 0.387 0.127
The calculation was performed for the equivalent dose of test product (TMNS)
required attaining same Cmax of the marketed product. [194]
F-Ratio was calculated from the following equation,
Eq...(4.3)
Where, Fr = Relative bioavailability (F-Ratio)
[AUC]test = AUC of telmisartan nanosuspension
[AUC]std = AUC of telmisartan marketed formulation
[D]test = Dose of telmisartan nanosuspension
[D]std = Dose of telmisartan marketed formulation
Using above equation, bioavailability fraction obtained from telmisartan nanosuspension
was 1.184.
Volume of distribution was calculated by following equation,
Eq...(4.4)
Where, Vd = Volume of distribution
F = F-Ratio
D = Dose of the product
Cmax = Maximum plasma concentration

CHAPTER 4 RESULTS AND DISCUSSION
163
Using above equation, the volume of distribution obtained from telmisartan
nanosuspension was 1.898 lit.
From the following equation amount of drug to be administered to attain the same plasma
concentration of marketed product was calculated
Eq...(4.5)
Where, C = Cmax of telmisartan marketed formulation
Ka = Absorption rate constant of telmisartan nanosuspension
F = F-Ratio
X0 = Amount of telmisartan administered by nanosuspension
Vd = Volume of distribution of telmisartan nanosuspension
Ke = Elimination rate constant of telmisartan nanosuspension
t = Time required for maximum plasma concentration by telmisartan
nanosuspension
AUC was higher by 1.184 times and Cmax by 1.197 times higher for telmisartan
nanosuspension as compared to marketed formulation shows quite a good rise in bio-
availability. Tmax was half as compared to marketed formulation indicates a substantial
improvement in absorption of the drug from nanosuspension.
Using above equation, amount of telmisartan should be administered by nanosuspension
(X0) was found to be 0.672 mg/day for rats, which was further converted to human
equivalent dose, which was 32.7 mg/day.
The reported usual dose of telmisartan is 40 mg / 80 mg once daily in the management of
hypertension. Lower initial doses should be considered in patients with hepatic or renal
impairment. The study was conducted with 40 mg/day dose of telmisartan nanosuspension.
Results suggested that by converting telmisartan into nanosuspension form dose can be
reduced from 40 to 32.7 mg/day which was 81.75% of the regular dose that indicated
18.25% dose reduction. The improvement in bioavailability due to conversion from drug
to nanosuspension was 18.25%.

CHAPTER 4 RESULTS AND DISCUSSION
164
4B.16 Conclusion
Plackett - Burman design was effectively employed to identify formulating and processing
key parameters that are affecting the quality of the telmisartan nanosuspension. 32 factorial
design was employed for optimization of the formulation of nanosuspension. All the
predetermined independent variables were found to affect the dependent variables from the
resultant nanosuspension. The optimum formulation prepared by response optimizer by
desirability function provided a final formulation with D = 0.9629 which released 102.60%
of telmisartan within 2 mins. The in-vivo studies confirmed that nanosuspension loaded
telmisartan showed a significantly better AUC as compared to marketed formulation and
dose of telmisartan was reduced about 18.25% to reach plasma concentration of marketed
formulation. The improved formulation could offer improved drug delivery strategy which
might allow concomitant use of telmisartan in nanosuspension form. The nanosuspension
of drug exhibited 18.25% improvement in bioavailability.

CHAPTER 4 RESULTS AND DISCUSSION
165
4C. Result and discussion of ziprasidone hydrochloride
nanosuspension
4C.1 Scanning and calibration curve preparation of ziprasidone hydrochloride
4C.1.1 Scanning and calibration curve preparation of ziprasidone hydrochloride in
methanol
The standard stock solution of ziprasidone hydrochloride was prepared in methanol as per
the method described in experimental section and scanned by UV-Visible
spectrophotometer between 200 to 400 nm. The UV absorption spectrum of ziprasidone
hydrochloride showed λmax at 315 nm [199] as shown in Figure 4.33.
FIGURE 4.33: Scanning of ziprasidone hydrochloride in methanol
A calibration curve was prepared in methanol in the range of 10-60 μg/ml by UV-Visible
spectrophotometer. The absorbance of these solutions was measured at 315 nm. This
procedure was performed in triplicate to validate the calibration curve. The data is given in
Table 4.41.

CHAPTER 4 RESULTS AND DISCUSSION
166
TABLE 4.41: Calibration curve data of ziprasidone hydrochloride in methanol
Sr.
No.
Concentration
(µg/ml)
Absorbance at 315nm*
(Mean ± SD)*
1 0 0.000 ± 0.000
2 10 0.178 ± 0.007
3 20 0.31 ± 0.008
4 30 0.465 ± 0.006
5 40 0.612 ± 0.012
6 50 0.753 ± 0.001
7 60 0.909 ± 0.011
*Indicates average of three determinations
A calibration curve was constructed by plotting absorbance vs. concentration in µg/ml as
shown in Figure 4.34 and regression equation was found to be Y = 0.0149X + 0.0133 with
regression coefficient 0.999.
FIGURE 4.34: Calibration curve of ziprasidone hydrochloride in methanol

CHAPTER 4 RESULTS AND DISCUSSION
167
4C.1.2 Scanning and calibration curve preparation of ziprasidone hydrochloride in
0.05M sodium phosphate buffer, pH 7.5 containing 2% w/w SDS
The standard stock solution of ziprasidone hydrochloride (10 µg/ml) was prepared in
0.05M sodium phosphate buffer, pH 7.5 containing 2% w/w SDS and scanned by UV-
Visible spectrophotometer between 200 to 400 nm. The UV absorption spectrum of
ziprasidone hydrochloride showed λmax at 318 nm [200] as shown in Figure 4.35.
Figure 4.35: Scanning of ziprasidone hydrochloride in 0.05M sodium phosphate
buffer, pH 7.5 containing 2% SDS
A calibration curve was prepared in 0.05 M sodium phosphate buffer, pH 7.5 containing
2 %w/w SDS in the range of 10-60 μg/ml by UV-Visible spectrophotometer. The
absorbance of these solutions was measured at 318 nm. This procedure was performed in
triplicate to validate the calibration curve. The data is given in Table 4.42.
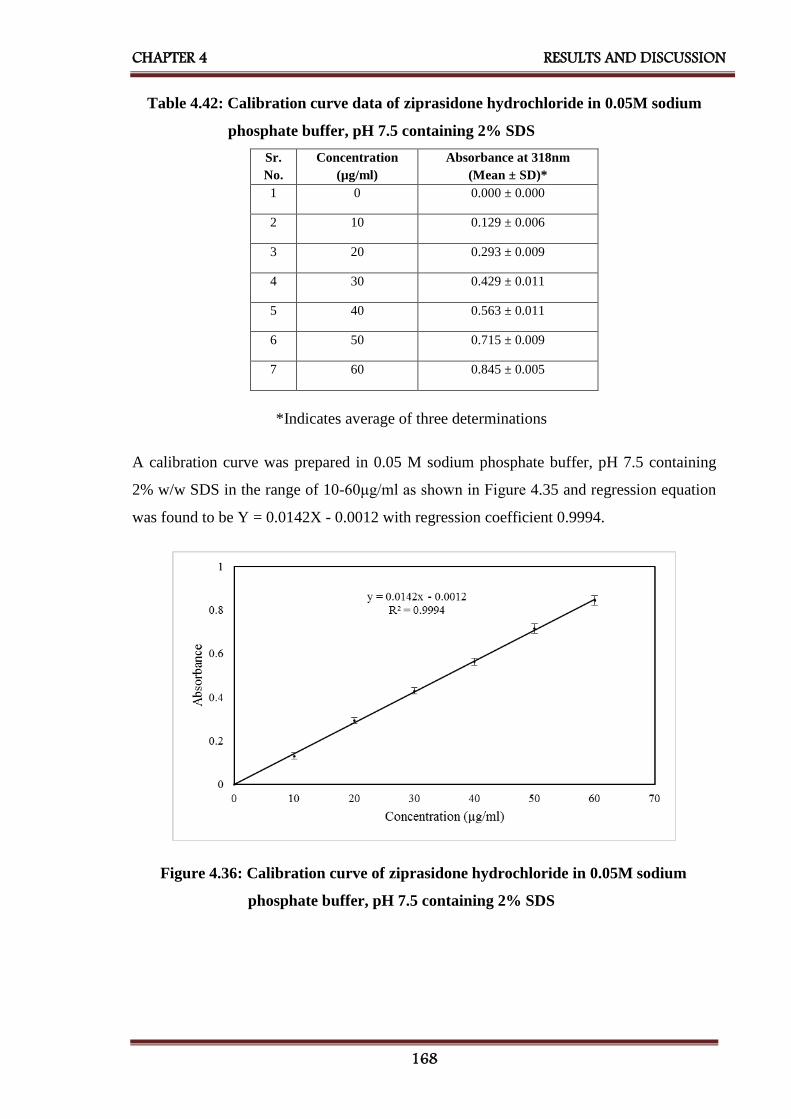
CHAPTER 4 RESULTS AND DISCUSSION
168
Table 4.42: Calibration curve data of ziprasidone hydrochloride in 0.05M sodium
phosphate buffer, pH 7.5 containing 2% SDS
*Indicates average of three determinations
A calibration curve was prepared in 0.05 M sodium phosphate buffer, pH 7.5 containing
2% w/w SDS in the range of 10-60μg/ml as shown in Figure 4.35 and regression equation
was found to be Y = 0.0142X - 0.0012 with regression coefficient 0.9994.
Figure 4.36: Calibration curve of ziprasidone hydrochloride in 0.05M sodium
phosphate buffer, pH 7.5 containing 2% SDS
Sr.
No.
Concentration
(µg/ml)
Absorbance at 318nm
(Mean ± SD)*
1 0 0.000 ± 0.000
2 10 0.129 ± 0.006
3 20 0.293 ± 0.009
4 30 0.429 ± 0.011
5 40 0.563 ± 0.011
6 50 0.715 ± 0.009
7 60 0.845 ± 0.005

CHAPTER 4 RESULTS AND DISCUSSION
169
4C.2 Selection of solvent and antisolvent for ziprasidone hydrochloride
nanosuspension (ZHNS)
Selection of solvent and antisolvent was performed on the basis of solubility of ziprasidone
hydrochloride in different solvents and their combinations. [163] Results showed that drug
had the highest solubility (2.443mg/ml) in methanol and least solubility (0.022 mg/ml) in
water, so they were selected as solvent and antisolvent respectively as shown in Table
4.43.
TABLE 4.43: Results of selection of solvents for ZHNS
Drug Solvents Solubility
(mg/ml)
(Mean ± SD)*
Ziprasidone
Hydrochloride
Water 0.022 ± 0.0013
Methanol 2.443 ± 0.052
Alcohol 0.375 ± 0.033
Iso-propanol 0.82 ± 0.0023
N-Butanol 0.120 ± 0.010
Alcohol:2-Propanol (1:1) 0.138 ± 0.025
Alcohol: Butanol (1:1) 0.158 ± 0.034
Ethyl Acetate 0.044 ± 0.018
* Indicates average of three determinations
4C.3 Selection of stabilizer
Different stabilizers like polyvinyl alcohol, PVP K-30, sodium lauryl sulfate, poloxamer
188 and poloxamer 407 were screened by preparing nanosuspensions with bellow
mentioned formulating and processing parameters as shown in Table 4.44 [184]

CHAPTER 4 RESULTS AND DISCUSSION
170
TABLE 4.44: Formulating and processing parameters for selection of stabilizer
for ZHNS
Batch
Code
Stabilizers Amount of
Stabilizers
(mg)
Amount of
Ziprasidone
Hydrochloride*
(mg)
Stirring
Speed
(RPM)
Stirring
Time
(h)
Sonication
Time
(min)
Solvent :
Antisolve
nt
Volume
Ratio
ZF1 Polyvinyl Alcohol 30
11.3 1000 5 20 1:8
ZF2 PVP K30 30
ZF3 Sodium Lauryl
Sulphate
4
ZF4 Poloxamer 188 30
ZF5 Poloxamer 407 30
* 11.3 mg of Ziprasidone Hydrochloride is equivalent to 10 mg of Ziprasidone Base [106]
The prepared nanosuspensions (ZF1 to ZF5) were evaluated by measuring their saturation
solubility, mean particle size, polydispersity index (PDI) and zeta potential for selection of
the best stabilizer which can be utilized for further research work, as shown in Table 4.45.
TABLE 4.45: Results for selection of stabilizer for ZHNS
Batch
Code
Stabilizer
Used
Saturation
Solubility
(µg/ml)
(Mean ± SD)*
Mean
Particle
Size
(nm)
(Mean ± SD)*
PDI
(Mean ± SD)*
Zeta
Potential
(mV)
(Mean ± SD)*
ZF1 Polyvinyl Alcohol 29.64 ± 2.78 336.8 ± 5.1 1.27 ± 0.15 -21.56 ± 1.12
ZF2 PVP K-30 42.49 ± 1.08 234.0 ± 4.7 0.84 ± 0.11 27.85 ± 0.32
ZF3 Sodium Lauryl
Sulphate
34.03 ± 0.81 333.5 ± 7.3 1.09 ± 0.05 -29.11 ± 0. 72
ZF4 Poloxamer 188 31.27 ± 1.74 318.0 ± 6.8 0.75 ± 0.06 -31.41 ± 1.15
ZF5 Poloxamer 407 45.58 ± 1.62 210.4 ± 5.9 0.40 ±0.03 32.53 ± 0.90
*Indicates average of three determinations
Table 4.45 indicated that poloxamer 407 showing highest saturation solubility and lowest
mean particle size. It also showed minimum PDI showing uniformity in particle size of
nanosuspension and highest zeta potential indicating greater stability, so poloxamer 407
was selected as a stabilizer for further studies.
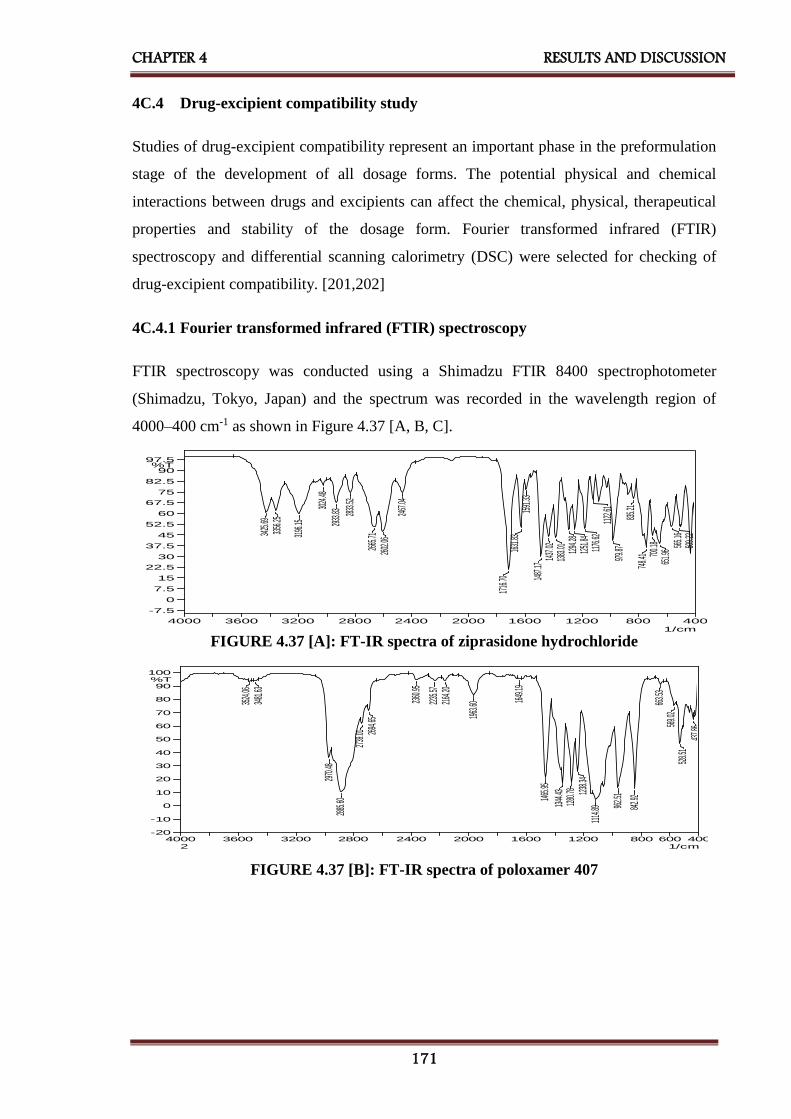
CHAPTER 4 RESULTS AND DISCUSSION
171
4C.4 Drug-excipient compatibility study
Studies of drug-excipient compatibility represent an important phase in the preformulation
stage of the development of all dosage forms. The potential physical and chemical
interactions between drugs and excipients can affect the chemical, physical, therapeutical
properties and stability of the dosage form. Fourier transformed infrared (FTIR)
spectroscopy and differential scanning calorimetry (DSC) were selected for checking of
drug-excipient compatibility. [201,202]
4C.4.1 Fourier transformed infrared (FTIR) spectroscopy
FTIR spectroscopy was conducted using a Shimadzu FTIR 8400 spectrophotometer
(Shimadzu, Tokyo, Japan) and the spectrum was recorded in the wavelength region of
4000–400 cm-1 as shown in Figure 4.37 [A, B, C].
FIGURE 4.37 [A]: FT-IR spectra of ziprasidone hydrochloride
400600800120016002000240028003200360040001/cm
-20
-10
0
10
20
30
40
50
60
70
80
90
100%T
3524
.0634
81.63
2970
.4828
85.60
2739
.01 2694
.65
2360
.95
2235
.5721
64.20
1963
.60 1649
.19
1465
.95
1344
.4312
80.78 12
38.34
1114
.89 962.5
1
842.9
2
663.5
356
9.02
528.5
143
7.86
2
FIGURE 4.37 [B]: FT-IR spectra of poloxamer 407
400800120016002000240028003200360040001/cm
-7.5
0
7.5
15
22.5
30
37.5
45
52.5
60
67.5
75
82.5
90
97.5%T
3425
.6933
56.25
3196
.15
3024
.48
2933
.83 2833
.52
2665
.7126
02.06
2467
.04
1716
.7016
31.83
1591
.3314
87.17
1437
.0213
83.01 1294
.2812
51.84
1176
.6211
22.61
979.8
783
5.21
748.4
1 700.1
865
1.96 56
5.16
509.2
2

CHAPTER 4 RESULTS AND DISCUSSION
172
FIGURE 4.37 [C]: FT-IR spectra of a physical mixture of ziprasidone hydrochloride
and poloxamer 407
Ziprasidone hydrochloride, poloxamer 407 and its physical mixture were subjected to
FTIR studies and characteristic bands were identified and given in Table 4.46.
TABLE 4.46: Comparison of characteristic bands between ziprasidone
hydrochloride and its physical mixture.
Characteristic bands
[187,188]
Peak Value, cm-1
Ziprasidone
Hydrochloride
Physical Mixture
Piperazinyl-N-H stretching 3356.25
3425.69
3354.21
3415.93
Aromatic –C-H stretching 3196.15 3194.12
Aliphatic –C-H stretching 2883.52 2885.51
-C-H Stretching 1631.83 1631.78
-CH bending of -CH2 1487.17 1492.90
-C-Cl stretching 651.96 651.94
Table 4.46 indicates that the bands were similar for both pure drug and physical mixture
and therefore there was no incompatibility between ziprasidone hydrochloride and
poloxamer 407.
4C.4.2 Differential scanning calorimetry (DSC)
DSC was performed using DSC-60 (Shimadzu, Tokyo, Japan) calorimeter to study the
thermal behavior of the sample (ziprasidone hydrochloride, poloxamer 407, physical
mixture and lyophilized nanosuspension). Information of thermal analysis by DSC can be
seen in Figure 4.38.
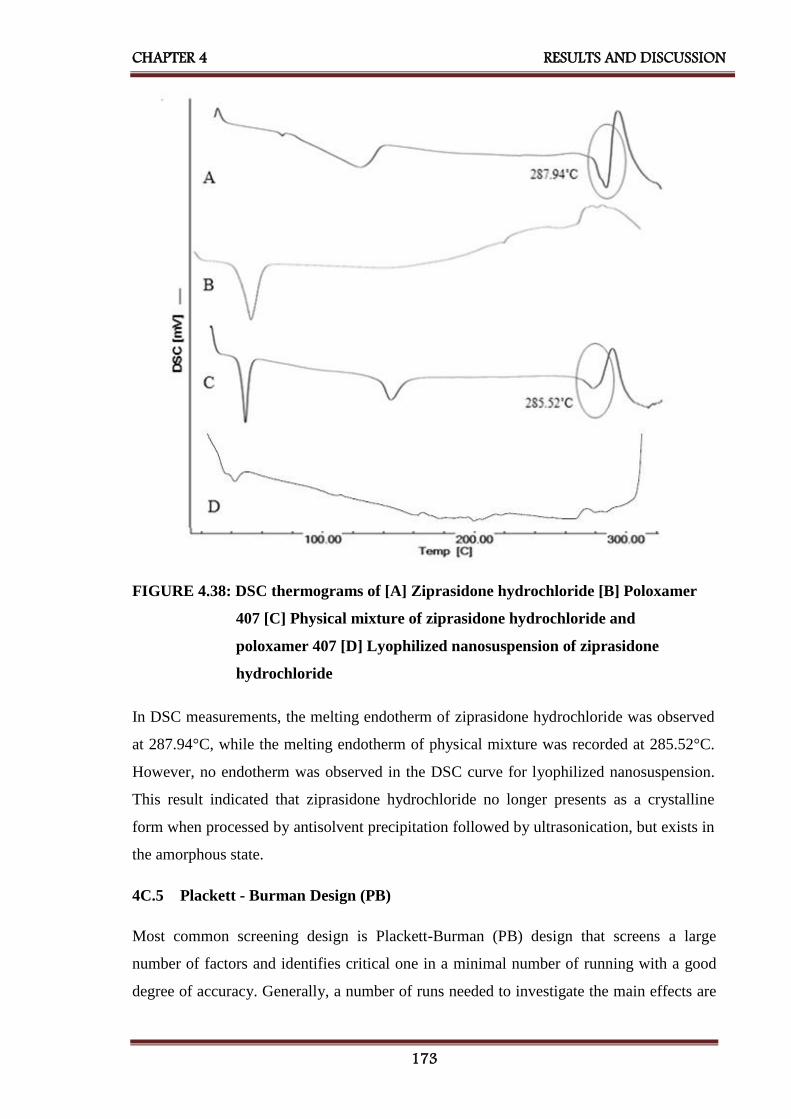
CHAPTER 4 RESULTS AND DISCUSSION
173
FIGURE 4.38: DSC thermograms of [A] Ziprasidone hydrochloride [B] Poloxamer
407 [C] Physical mixture of ziprasidone hydrochloride and
poloxamer 407 [D] Lyophilized nanosuspension of ziprasidone
hydrochloride
In DSC measurements, the melting endotherm of ziprasidone hydrochloride was observed
at 287.94°C, while the melting endotherm of physical mixture was recorded at 285.52°C.
However, no endotherm was observed in the DSC curve for lyophilized nanosuspension.
This result indicated that ziprasidone hydrochloride no longer presents as a crystalline
form when processed by antisolvent precipitation followed by ultrasonication, but exists in
the amorphous state.
4C.5 Plackett - Burman Design (PB)
Most common screening design is Plackett-Burman (PB) design that screens a large
number of factors and identifies critical one in a minimal number of running with a good
degree of accuracy. Generally, a number of runs needed to investigate the main effects are

CHAPTER 4 RESULTS AND DISCUSSION
174
multiple of 4 in PB designs. [189,190] It is used during the initial phase of the study.
Provided the interaction effects are nil or negligible, the Plackett-Burman design is
effective for measuring main effects. As shown in Table 4.47 the selected response
parameters showed a wide variation suggesting that the independent variables had a
significant effect on the response parameters chosen.
TABLE 4.47: Layout and observed responses of Plackett - Burman design
batches for ZHNS (Preliminary Screening Formulations)
Batch
Code
Amount
of
Ziprasidone
HCl
(mg)
X1**
Amount
of
Poloxamer
407
(mg)
X2
Solvent :
Anti-
solvent
Volume
Ratio
X3
Stirring
Speed
(RPM)
X4
Sonication
Time
(Min)
X5
Saturation
Solubility
(μg/ml)
(Mean ± SD)*
Y1
Mean
Particle Size
(nm)
(Mean ± SD)*
Y2
ZF6 22.6 50 1:8 800 30 89.46 ± 1.8 325.5 ± 4.6
ZF7 11.3 50 1:8 1200 10 45.01 ± 1.0 395.2 ± 6.1
ZF8 11.3 30 1:8 1200 30 95.74 ± 2.4 318 ± 7.2
ZF9 22.6 30 1:5 1200 30 82.69 ± 2.1 348.7 ± 6.9
ZF10 11.3 50 1:5 800 30 63.92 ± 0.97 378.3 ± 5.3
ZF11 22.6 30 1:8 800 10 78.33 ± 1.7 354.9 ± 7.8
ZF12 22.6 50 1:5 1200 10 120.11 ± 2.2 298.4 ± 5.1
ZF13 11.3 30 1:5 800 10 40.28 ± 2.1 410.5 ± 4.8
* Indicates average of three determinations
** 11.3 mg of Ziprasidone Hydrochloride is equivalent to 10 mg of Ziprasidone Base[106]
Figure 4.39 and Figure 4.40 indicates the amount of ziprasidone hydrochloride and stirring
speed had maximum effect on mean particle size and saturation solubility as compared to
other parameters like solvent: antisolvent volume ratio, amount of poloxamer 407 and
sonication time.

CHAPTER 4 RESULTS AND DISCUSSION
175
FIGURE 4.39: Pareto chart of the effect of independent variables on saturation
the solubility of ZHNS
FIGURE 4.40: Pareto chart of the effect of independent variables on mean particle
size of ZHNS

CHAPTER 4 RESULTS AND DISCUSSION
176
4C.6 Optimization of other preliminary parameters [191–193]
Ziprasidone hydrochloride nanosuspension was prepared using Poloxamer 407 as a
stabilizer. The three different amounts of poloxamer 407 viz. 30 mg, 40 mg, and 50 mg
were selected. Nanosuspension was prepared according to the procedure given in
experimental section. Prepared nanosuspensions were evaluated with different evaluation
parameters like mean particle size and saturation solubility to select amount of poloxamer
407 for further formulation work. As shown in Table 4.48, 50 mg poloxamer 407 was
selected which was showing minimum mean particle size and maximum saturation
solubility.
Solvent: antisolvent volume ratio is important formulation parameter for preparation of
nanosuspension. For the optimization of solvent: antisolvent volume ratio 1:4, 1:6 and 1:8
were selected. Nanosuspensions were prepared according to the procedure given in
experimental section. Prepared nanosuspensions were evaluated with different evaluation
parameters like mean particle size and saturation solubility to select solvent: antisolvent
volume ratio for further formulation work, as shown in Table 4.48, 1:8 solvent: antisolvent
volume ratio was selected which was showing minimum mean particle size and maximum
saturation solubility.
Once the precipitation of drug particle had occurred in suspension, to convert into the
uniform nanosized particles probe sonicator was used. 10 mins, 20 mins, and 30 mins
period were selected for sonication. Nanosuspension was prepared according to the
procedure given before. Prepared nanosuspensions were evaluated with different
evaluation parameters like mean particle size and saturation solubility to select the
optimized time period of sonication for further formulation work. As shown in Table 4.48,
30 mins sonication time was selected which was showing minimum mean particle size and
maximum saturation solubility.

CHAPTER 4 RESULTS AND DISCUSSION
177
TABLE 4.48: Results of optimization of other preliminary parameters for ZHNS
Batch
Code
Preliminary
Parameters
Mean
Particle Size
(nm)
(Mean ± SD)*
Saturation
Solubility
(µg/ml)
(Mean ± SD)*
ZF14 Amount of
Poloxamer 407
(mg)
30 361.6 ± 6.5 49.21 ± 0.95
ZF15 40 342.0 ± 7.1 57.15 ± 1.02
ZF16 50 231.7 ± 5.8 62.78 ± 1.22
ZF17 Solvent to
Antisolvent
Volume Ratio
1:4 355.8 ± 6.8 41.52 ± 0.59
ZF18 1:6 321.0 ± 4.6 49.22 ± 1.28
ZF19 1:8 250.6 ± 5.1 62.50 ± 1.72
ZF20 Sonication
Time
(min)
10 346.5 ± 7.8 47.72 ± 0.79
ZF21 20 320.0 ± 5.9 59.33 ± 1.11
ZF22 30 252.0 ± 8.2 65.23 ± 1.53
*Indicates average of three determinations
4C.7 32 Factorial Design
Various formulations were prepared the varying amount of ziprasidone hydrochloride and
stirring speed. [61] As shown in Table 4.49 a 32 full factorial design was used to evaluate
the effect of both independent variables on the predetermined dependent variables viz.,
particle size and saturation solubility and cumulative percentage release (CPR) at 15 mins.

CHAPTER 4 RESULTS AND DISCUSSION
178
TABLE 4.49: Layout and observed responses of 32 factorial design for ZHNS
Batch
Code
Level of
Amount of
Ziprasidone
Hydrochloride
X1
Level of
Stirring
Speed
X2
Mean
Particle Size
(nm)
(Mean ± SD)*
Y1
Saturation
Solubility
(µg/ml)
(Mean ± SD)*
Y2
CPR
at 15 mins
(%w/w)
(Mean ± SD)*
Y3
ZFD1 -1 -1 421.2 ± 5.8 45.32 ± 0.59 71.25 ± 1.65
ZFD2 -1 0 296.4 ± 6.4 64.84 ± 0.84 77.62 ± 2.14
ZFD3 -1 1 219.8 ± 8.1 59.68 ± 1.05 86.6 ± 1.89
ZFD4 0 -1 418.2 ± 9.5 69.94 ± 1.24 83.51± 3.14
ZFD5 0 0 302.5 ± 6.9 81.74 ± 0.68 88.15 ± 2.11
ZFD6 0 1 220.0 ± 4.8 72.99 ± 1.84 95.33 ± 0.99
ZFD7 1 -1 408.3 ± 8.5 57.75 ± 1.22 83.61 ± 1.24
ZFD8 1 0 286.5 ± 4.1 66.41 ± 1.06 84.65 ± 1.89
ZFD9 1 1 214.0 ± 6.2 52.07 ± 0.87 91.34 ± 2.31
Translation of Coded Levels in Actual Units
Variables Level Low (-1) Medium (0) High (1)
X1** 11.3 mg 16.95 mg 22.6 mg
X2 800 RPM 1000 RPM 1200 RPM
*Indicates average of three determinations
** 11.3 mg of Ziprasidone Hydrochloride is equivalent to 10 mg of Ziprasidone Base[106]
Some other parameters were also evaluated for zeta potential, PDI and % w/w drug
content etc. as shown in Table 4.50.
Table 4.50: Other evaluation parameters of factorial batches of ZHNS
Batch
Code
PDI
(Mean ± SD)*
Zeta Potential
(mV)
(Mean ± SD)*
Drug Content
(%w/w)
(Mean ± SD)*
ZFD1 0.530 ± 0.072 20.5 ± 2.51 95.49 ± 2.01
ZFD2 0.819 ± 0.056 -19.8 ± 1.21 99.52 ± 1.51
ZFD3 0.752 ± 0.062 -29.4 ± 1.68 96.93 ± 0.87
ZFD4 0.652 ± 0.049 17.5 ± 1.53 97.73 ± 1.85
ZFD5 0.591 ± 0.034 -18.5 ± 2.95 96.95 ± 0.64
ZFD6 0.425 ± 0.051 -31.4 ± 1.45 99.12 ± 1.24
ZFD7 0.694 ± 0.039 25.3 ± 2.11 96.34 ± 1.33
ZFD8 0.561 ± 0.043 27.0 ± 2.60 95.53 ± 0.95
ZFD9 0.489 ± 0.052 -23.9 ± 2.15 97.38 ± 0.95
*Indicates average of three determinations
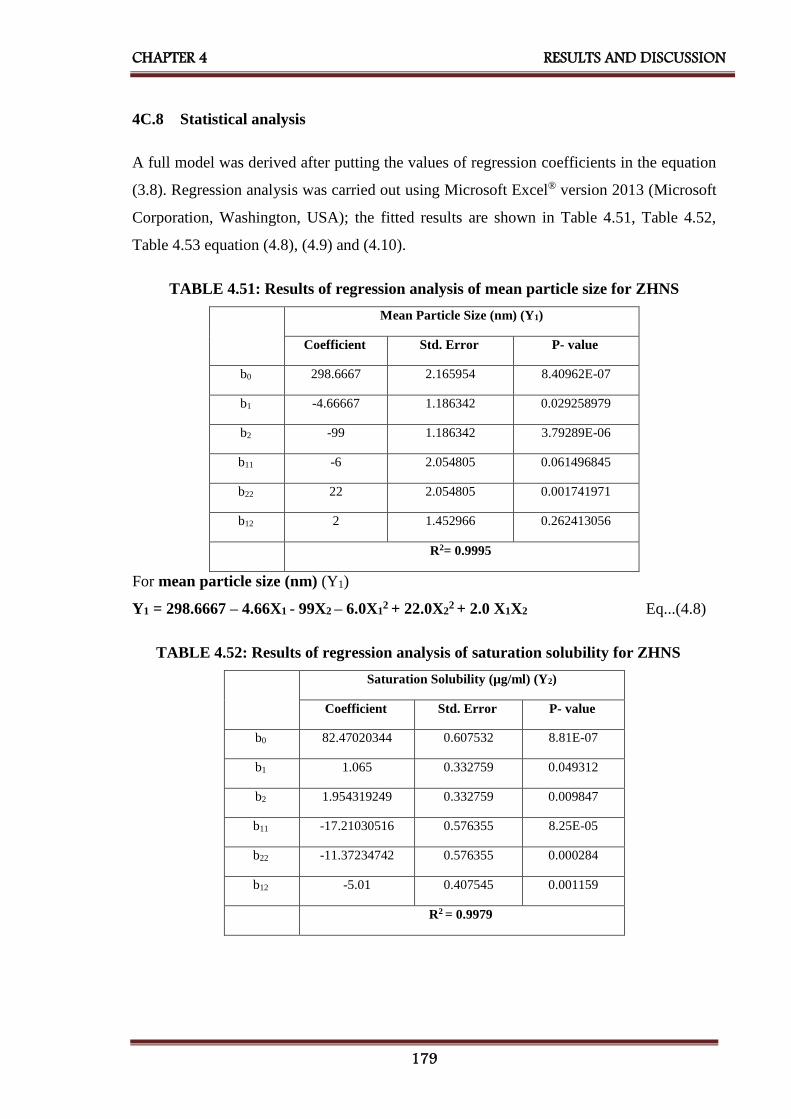
CHAPTER 4 RESULTS AND DISCUSSION
179
4C.8 Statistical analysis
A full model was derived after putting the values of regression coefficients in the equation
(3.8). Regression analysis was carried out using Microsoft Excel® version 2013 (Microsoft
Corporation, Washington, USA); the fitted results are shown in Table 4.51, Table 4.52,
Table 4.53 equation (4.8), (4.9) and (4.10).
TABLE 4.51: Results of regression analysis of mean particle size for ZHNS
Mean Particle Size (nm) (Y1)
Coefficient Std. Error P- value
b0 298.6667 2.165954 8.40962E-07
b1 -4.66667 1.186342 0.029258979
b2 -99 1.186342 3.79289E-06
b11 -6 2.054805 0.061496845
b22 22 2.054805 0.001741971
b12 2 1.452966 0.262413056
R2= 0.9995
For mean particle size (nm) (Y1)
Y1 = 298.6667 – 4.66X1 - 99X2 – 6.0X12 + 22.0X2
2 + 2.0 X1X2 Eq...(4.8)
TABLE 4.52: Results of regression analysis of saturation solubility for ZHNS
Saturation Solubility (µg/ml) (Y2)
Coefficient Std. Error P- value
b0 82.47020344 0.607532 8.81E-07
b1 1.065 0.332759 0.049312
b2 1.954319249 0.332759 0.009847
b11 -17.21030516 0.576355 8.25E-05
b22 -11.37234742 0.576355 0.000284
b12 -5.01 0.407545 0.001159
R2 = 0.9979
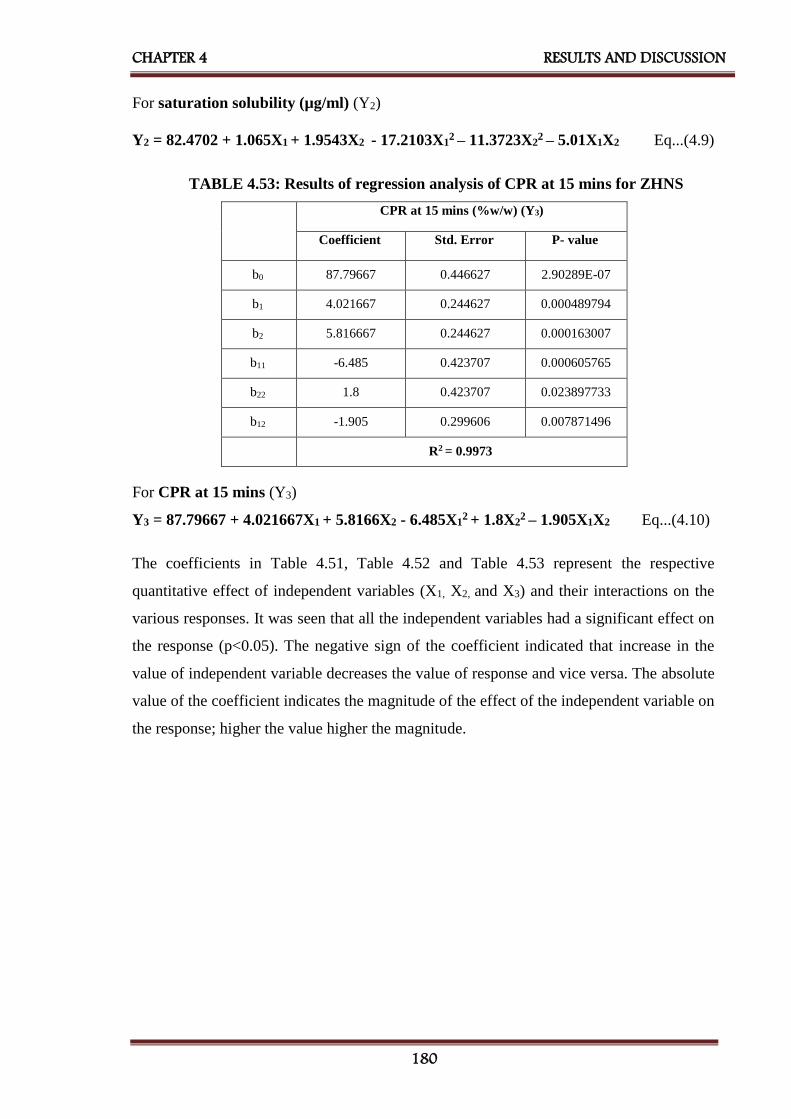
CHAPTER 4 RESULTS AND DISCUSSION
180
For saturation solubility (µg/ml) (Y2)
Y2 = 82.4702 + 1.065X1 + 1.9543X2 - 17.2103X12 – 11.3723X2
2 – 5.01X1X2 Eq...(4.9)
TABLE 4.53: Results of regression analysis of CPR at 15 mins for ZHNS
CPR at 15 mins (%w/w) (Y3)
Coefficient Std. Error P- value
b0 87.79667 0.446627 2.90289E-07
b1 4.021667 0.244627 0.000489794
b2 5.816667 0.244627 0.000163007
b11 -6.485 0.423707 0.000605765
b22 1.8 0.423707 0.023897733
b12 -1.905 0.299606 0.007871496
R2 = 0.9973
For CPR at 15 mins (Y3)
Y3 = 87.79667 + 4.021667X1 + 5.8166X2 - 6.485X12 + 1.8X2
2 – 1.905X1X2 Eq...(4.10)
The coefficients in Table 4.51, Table 4.52 and Table 4.53 represent the respective
quantitative effect of independent variables (X1, X2, and X3) and their interactions on the
various responses. It was seen that all the independent variables had a significant effect on
the response (p<0.05). The negative sign of the coefficient indicated that increase in the
value of independent variable decreases the value of response and vice versa. The absolute
value of the coefficient indicates the magnitude of the effect of the independent variable on
the response; higher the value higher the magnitude.

CHAPTER 4 RESULTS AND DISCUSSION
181
TABLE 4.54: ANOVA for a full model for ZHNS
Source of
variation
DF SS MS F F significant
Mean Particle Size (nm)
Regression 5 59992.66667 11998.53333 1420.878947 2.94327E-05
Residual 3 25.33333333 8.444444444 - -
Total 8 60018 - - -
Saturation Solubility (µg/ml)
Regression 5 981.1717116 196.2343423 295.3688168 0.000309346
Residual 3 1.99311164 0.664370547 - -
Total 8 983.1648233 - - -
CPR at 15 mins (%w/w)
Regression 5 405.1510333 81.03020667 225.6759585 0.000462499
Residual 3 1.077166667 0.359055556 - -
Total 8 406.2282 - - -
The results of ANOVA for full model suggested that Fcal value for mean particle size was
1420.87. Ftab value at (5, 3) was 9.0 for Y1. So, Fcal value for Y1 was higher than Ftab.
The results of ANOVA for full model suggested that Fcal value for saturation solubility was
295.36. Ftab value at (5, 3) was 9.0 for Y2. So, Fcal value for Y2 was higher than Ftab.
The results of ANOVA for full model suggested that Fcal value for CPR at 15 mins was
225.67. Ftab value at (5, 3) was 9.0 for Y3. So, Fcal value for Y3 was higher than Ftab.
All dependent variables were found Fcal value significantly higher than Ftab. Therefore,
selected factors have a significant effect on all three dependent variables.
All the determination coefficients R2 are larger than 0.99, indicating that over 99% of the
variation in the response could be explained by the model and the goodness of fit of the
model was confirmed. The F-ratio was found to be far greater than the theoretical value
with a very low probability of less than 0.0001 for each regression model, indicating that
the regression model is significant with a confidence level of 95%. The observed responses
showed a wide variation suggesting that the selected both independent variables had a
significant effect on resultant mean particle size, saturation solubility and CPR at 15 mins.

CHAPTER 4 RESULTS AND DISCUSSION
182
4C.9 Contour plots
Two-dimensional contour plots were established using statistical software Minitab 17
(Minitab Inc., USA) to examine the relationship between independent and dependent
variables as shown in figure 4.41.
Figure 4.41 [A] indicates contour plot for mean particle size (nm) at prefixed values
between 250 to 400 nm. The contour plot was found to be non-linear. So the relationship
between independent variables and mean particle size is not linear. The minimum (Light
Green part) is clearly evidence from contour plot which specifies the stirring speed and
amount of ziprasidone hydrochloride for lowest mean particle size. Their respective values
are approx. 1200 RPM (coded value +1) stirring speed and 16.95 mg (coded value 0)
amount of ziprasidone hydrochloride.
Figure 4.41 [B] and [C] shows contour plot for saturation solubility (µg/ml) and
cumulative percentage release (CPR) at 15 mins at prefixed values between 50 to 80 µg/ml
and 75 to 95 respectively. The contour plot was found to be non-linear. So the relationship
between independent variables and dependent variables were not linear. The maximum
(Dark Green part) is clearly evidence from contour plot which specifies the stirring speed
and amount of ziprasidone hydrochloride for maximum saturation solubility and
cumulative percentage release (CPR) at 15 mins. Their respective values are approx. 1200
RPM (coded value +1) stirring speed and 16.95 mg (coded value 0) amount of ziprasidone
hydrochloride.
The maxima of saturation solubility and minima of mean particle size are seemed to be
overlapping. So, there exists a direct relation between saturation solubility and mean
particle size. The batch showing lowest mean particle size is also having highest saturation
solubility and cumulative percentage release (CPR) at15 mins.

CHAPTER 4 RESULTS AND DISCUSSION
183
Amount of Ziprasidone Hydrochloride (ZH)
Stir
rin
g S
peed
1.00.50.0-0.5-1.0
1.0
0.5
0.0
-0.5
-1.0
>
–
–
–
–
–
–
< 50
50 55
55 60
60 65
65 70
70 75
75 80
80
Solubility(ug/ml)
Saturation
Contour Plot of Saturation Solubility(ug/ml) Vs Stirring Speed, Amount of ZH
Amount of Ziprasidone Hydrochloride (ZH)
Stir
rin
g S
peed
1.00.50.0-0.5-1.0
1.0
0.5
0.0
-0.5
-1.0
>
–
–
–
< 250
250 300
300 350
350 400
400
Size(nm)
Particle
Contour Plot of Particle Size(nm) Vs Stirring Speed, Amount of ZH
Amount of Ziprasidone Hydrochloride (ZH)
Stir
rin
g S
peed
1.00.50.0-0.5-1.0
1.0
0.5
0.0
-0.5
-1.0
>
–
–
–
–
< 75
75 80
80 85
85 90
90 95
95
15min
CPR at
Contour Plot of CPR at 15min Vs Stirring Speed, Amount of ZH
C
B
FIGURE 4.41: Contour plot of ZHNS for effect on [A] Mean particle size,
[B] Saturation solubility and [C] CPR at 15 mins
4C.10 Surface plots
To find out main and interaction effect of the independent variables, response surface plots
are very helpful.
Figure 4.42[A] shows the response surface plot of mean particle size as a function of
independent variables. Mean particle size decreases as the plot comes toward central part.
The center of the plot indicates the minimum particle size which was obtained by highest
stirring speed and an intermediate amount of ziprasidone hydrochloride.
Figure 4.42[B] and [C] shows the response surface plot of saturation solubility (µg/ml) and
cumulative percentage release (CPR) at 15 mins respectively as a function of stirring speed
and amount of ziprasidone hydrochloride using Minitab 17 (Minitab Inc., USA) software.
A
B

CHAPTER 4 RESULTS AND DISCUSSION
184
Saturation solubility (µg/ml) and cumulative percentage release (CPR) at 15 mins increases
as the plot comes toward central part. The center of the plot indicates the highest
saturation solubility (µg/ml) and cumulative percentage release (CPR) at 15 mins which
were obtained by highest stirring speed and an intermediate amount of ziprasidone
hydrochloride.
-1
-1
1
0
01
004
503
300
2 05
0004
ide (r H)olA hcordyH ZnodisarpiZ fo tnuom e
i deepS gnirrtS
artP )mn(eziS elci
urface PlotS of Particle Size(nm) Vs Stirring Speed, Amount of ZH
1-
0
05
60
70
-1
1
0
1
80
itarut on SolubilityaS
nirrit S S peedg
nodisarpiZ fo tnuom A Hydrochloride (ZH)e
urface Plot of Saturation Solubility Vs StirrinS Speed, Amount of ZHg
-1
0
70
80
1-1
0
1
90
t 15mina RPC
nirritS S deep g
tA nuom of Ziprasidon l Hydroch oride (ZH)e
urface Plot of CPR at 15min V , Stirring SpeedS Amount of ZHs
C
FIGURE 4.42: Response surface plot of ZHNS for effect on [A] Mean particle size,
[B] Saturation solubility and [C] CPR at 15 mins.
4C.11 Optimization of nanosuspension by desirability function of Minitab17.0
The optimum formulation was selected based on the criteria of attaining the minimum
mean particle size (Y1), the maximum saturation solubility (Y2) and maximum cumulative
percentage release (Y3). An overall desirability function dependent on all investigated
formulation variables was used to predict the ranges of the variable where the optimum
B A

CHAPTER 4 RESULTS AND DISCUSSION
185
formulation might occur. The desirable ranges are from zero to one (least to most
desirable, respectively). The optimized batch composition is presented in below Figure
4.43.
FIGURE 4.43: Optimized plot of factorial design form Minitab 17 for ZHNS
4C.12 Checkpoint cum optimized batch analysis
From the above Minitab data optimized batch was ZFD-6. The desirability of the
optimized batch was 0.9035. Formulation and process parameters for the optimized batch
are shown in Table 4.55. The optimized lyophilized formulation was filled in hard gelatin
capsules and kept in the tightly closed container.
TABLE 4.55: Formulation and process parameters for an optimized batch of ZHNS
Amount of Ziprasidone Hydrochloride
(Equivalent to 15 mg of Ziprasidone Base)
16.95 mg
Amount of Poloxamer 407 50 mg
Solvent: Antisolvent Volume Ratio 1:8
Stirring Speed 1200 RPM
Stirring Time 5 h
Sonication Time 30 mins
Amount of lyophilizer
(1:1, Total Solid: Mannitol)
66.95 mg
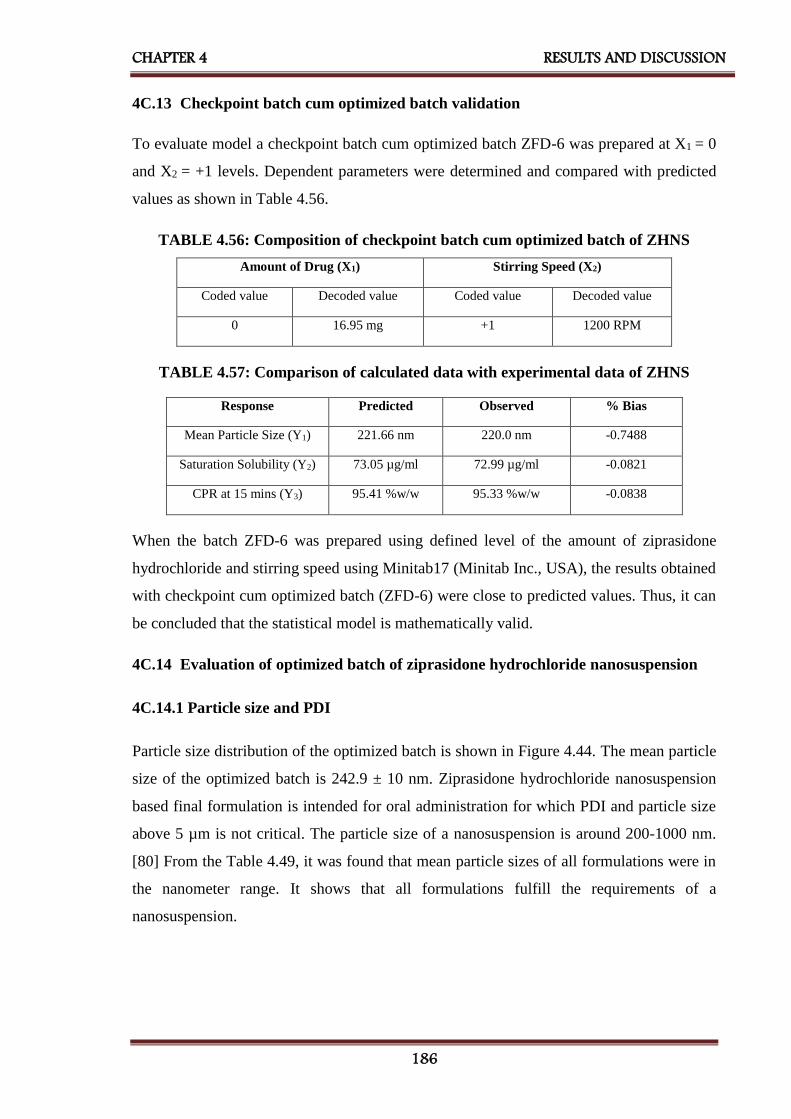
CHAPTER 4 RESULTS AND DISCUSSION
186
4C.13 Checkpoint batch cum optimized batch validation
To evaluate model a checkpoint batch cum optimized batch ZFD-6 was prepared at X1 = 0
and X2 = +1 levels. Dependent parameters were determined and compared with predicted
values as shown in Table 4.56.
TABLE 4.56: Composition of checkpoint batch cum optimized batch of ZHNS
Amount of Drug (X1) Stirring Speed (X2)
Coded value Decoded value Coded value Decoded value
0 16.95 mg +1 1200 RPM
TABLE 4.57: Comparison of calculated data with experimental data of ZHNS
Response Predicted Observed % Bias
Mean Particle Size (Y1) 221.66 nm 220.0 nm -0.7488
Saturation Solubility (Y2) 73.05 µg/ml 72.99 µg/ml -0.0821
CPR at 15 mins (Y3) 95.41 %w/w 95.33 %w/w -0.0838
When the batch ZFD-6 was prepared using defined level of the amount of ziprasidone
hydrochloride and stirring speed using Minitab17 (Minitab Inc., USA), the results obtained
with checkpoint cum optimized batch (ZFD-6) were close to predicted values. Thus, it can
be concluded that the statistical model is mathematically valid.
4C.14 Evaluation of optimized batch of ziprasidone hydrochloride nanosuspension
4C.14.1 Particle size and PDI
Particle size distribution of the optimized batch is shown in Figure 4.44. The mean particle
size of the optimized batch is 242.9 ± 10 nm. Ziprasidone hydrochloride nanosuspension
based final formulation is intended for oral administration for which PDI and particle size
above 5 µm is not critical. The particle size of a nanosuspension is around 200-1000 nm.
[80] From the Table 4.49, it was found that mean particle sizes of all formulations were in
the nanometer range. It shows that all formulations fulfill the requirements of a
nanosuspension.

CHAPTER 4 RESULTS AND DISCUSSION
187
Figure 4.44: Particle size graph for ZHNS
4C.14.2 Zeta potential
Poloxamer 407 is a well-known efficient polymeric stabilizer forming a substantial
mechanical and thermodynamic barrier at the interface of drug nanoparticles. [198] In
general, zeta potential value of ± 30 mV is sufficient for the stability of nanosuspension.
[171] Zeta potential of optimized formulation was observed -32.1±3.18 mV, which
complies with the requirement of zeta potential.
4C.14.3 Drug content
An aliquot (1ml) of the prepared nanosuspension was diluted in methanol and filtered with
a 0.2μm filter. Total drug content was determined by UV-Visible spectrophotometer at 315
nm and was found to be 100.46 %w/w of the ziprasidone hydrochloride.
4C.14.4 Saturation solubility
Saturation solubility of an optimized batch of ziprasidone hydrochloride nanosuspension
and the pure drug was found to be 76.25 µg/ml and 7.18 µg/ml respectively. It indicates
that saturation solubility of nanosuspension was 10 times than that of pure drug. This
drastic increase in saturation solubility is as a result of a reduction in particle size and
subsequent increase in surface area. So, it can be assumed that this increase in saturation
solubility may increase bioavailability.

CHAPTER 4 RESULTS AND DISCUSSION
188
4C.14.5 In-vitro dissolution
The dissolution profile of nanosuspension, un-milled (pure drug) suspension and marketed
formulation (Zipsydon® 20 Capsule) are presented in Figure 4.45. In nanosuspension, more
than 96.61 % drug was released within 15 mins, while cumulative percentage drug release
of un-milled suspension, marketed formulated showed 44.93% and 74.80% at 60 mins
respectively. So, nanosuspension enhanced the rate of dissolution of ziprasidone
hydrochloride to great extent.
0.00
20.00
40.00
60.00
80.00
100.00
120.00
0 50 100 150 200 250
Cu
mm
ula
tive
P
ercen
tag
e D
ru
g R
ele
ase
Time (MIn)
ZHNS
ZHMKT
ZH
FIGURE 4.45: Comparison of in-vitro dissolution of ziprasidone hydrochloride
nanosuspension with marketed formulation
TABLE 4.58: Evaluation parameters of an optimized batch of ZHNS
Evaluation Parameters Results
Mean Particle Size 218.0 nm
PDI 0.456
Zeta Potential −32.1 mV
Drug Content 100.46 %w/w
Saturation Solubility 76.25 µg/ml
CPR at 15 mins 96.61 %w/w
4C.14.6 Scanning electron microscopy (SEM)
The surface characteristics of ziprasidone hydrochloride and its lyophilized
nanosuspension were studied by scanning electron microscopy (EVO-18, ZEISS,
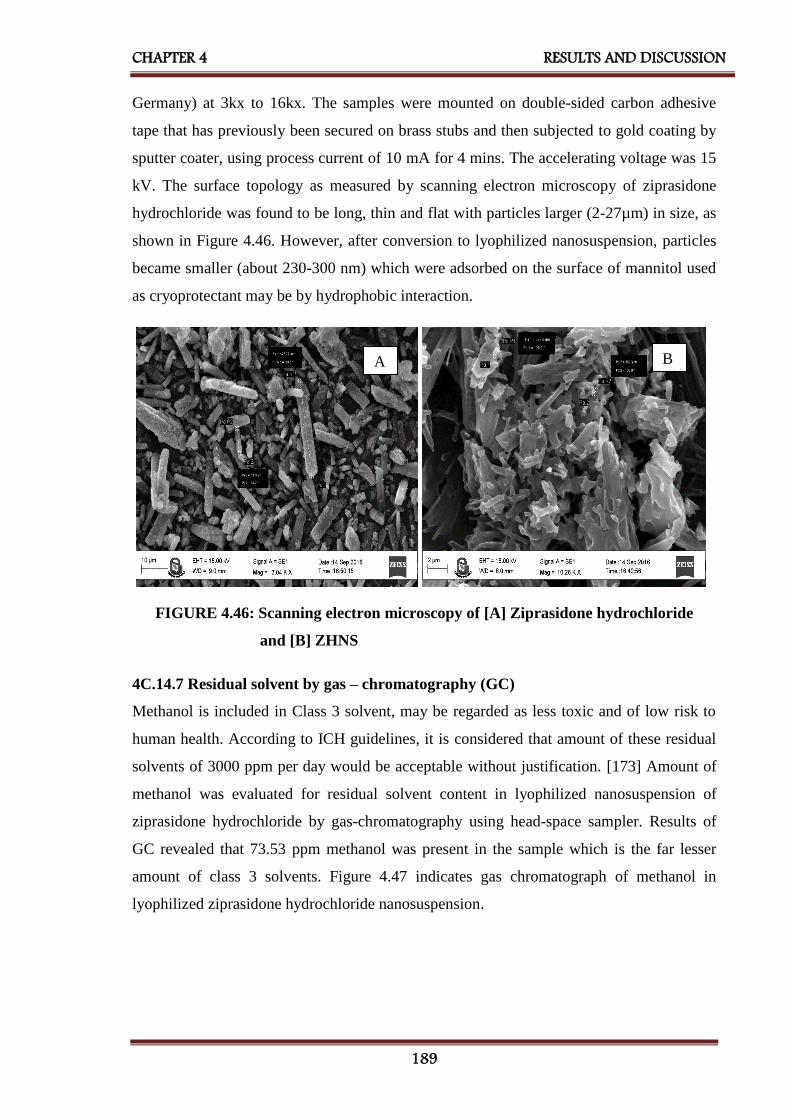
CHAPTER 4 RESULTS AND DISCUSSION
189
Germany) at 3kx to 16kx. The samples were mounted on double-sided carbon adhesive
tape that has previously been secured on brass stubs and then subjected to gold coating by
sputter coater, using process current of 10 mA for 4 mins. The accelerating voltage was 15
kV. The surface topology as measured by scanning electron microscopy of ziprasidone
hydrochloride was found to be long, thin and flat with particles larger (2-27µm) in size, as
shown in Figure 4.46. However, after conversion to lyophilized nanosuspension, particles
became smaller (about 230-300 nm) which were adsorbed on the surface of mannitol used
as cryoprotectant may be by hydrophobic interaction.
FIGURE 4.46: Scanning electron microscopy of [A] Ziprasidone hydrochloride
and [B] ZHNS
4C.14.7 Residual solvent by gas – chromatography (GC)
Methanol is included in Class 3 solvent, may be regarded as less toxic and of low risk to
human health. According to ICH guidelines, it is considered that amount of these residual
solvents of 3000 ppm per day would be acceptable without justification. [173] Amount of
methanol was evaluated for residual solvent content in lyophilized nanosuspension of
ziprasidone hydrochloride by gas-chromatography using head-space sampler. Results of
GC revealed that 73.53 ppm methanol was present in the sample which is the far lesser
amount of class 3 solvents. Figure 4.47 indicates gas chromatograph of methanol in
lyophilized ziprasidone hydrochloride nanosuspension.
A B

CHAPTER 4 RESULTS AND DISCUSSION
190
FIGURE 4.47: Gas chromatograph of methanol in lyophilized ziprasidone
hydrochloride nanosuspension
4C.14.8 Accelerated stability study
The accelerated stability study indicated that lyophilized ziprasidone hydrochloride
nanosuspension was physically and chemically stable when stored at the 25 ± 2°C and 60 ±
5 % RH for a period of 6 months. [176] Table 4.59 shows results of mean particle size,
saturation solubility, cumulative percentage drug release at 15 mins and % w/w of drug
content indicated that there was a slight change in all parameters which had < ±5 % bias
which was insignificant. The negligible difference was observed in results obtained from
the optimized batch before and after the stability study according to ICH guideline.
TABLE 4.59: Results of accelerated stability study of ZHNS
Sr.
No.
Storage
condition
for stability
study
Time
Period
(months)
Evaluation Parameters
Mean
Particle Size
(nm)
(Mean ± SD)*
Saturation
Solubility
(µg/ml)
(Mean ± SD)*
CPR at
15 mins
(%w/w)
(Mean ± SD)*
Drug
Content
(%w/w)
(Mean ± SD)*
1
25°C ± 2°C
and
60% ± 5% RH
0 218.0 ± 5.4 76.25 ± 1.5 96.61 ± 0.85 100.46 ± 1.7
2 1 245.2 ± 8.1 76.07 ± 0.7 96.06 ± 0.75 99.49 ± 0.82
3 3 292.1 ± 6.4 75.59 ± 0.6 95.86 ± 0.77 98.91 ± 0.34
4 6 310.2 ± 7.5 74.71 ± 0.9 95.44 ± 0.61 98.17 ± 0.91
*Indicates average of three determinations
4C.15 Bioavailability study
For bioavailability study, each rat was treated with oral nanosuspension of ziprasidone
hydrochloride at a dose of 2.31 mg/kg in a single dose. Blood samples were collected from
retro-orbital venous plexus over a period 12 h. Each sample was analyzed by HPLC for the

CHAPTER 4 RESULTS AND DISCUSSION
191
estimation of drug content by a bioanalytical method. The pharmacokinetic calculations
were performed on the basis of serum concentration-time data, as shown in Table 4.60.
TABLE 4.60: Results of bioavailability study of ziprasidone hydrochloride
nanosuspension and marketed formulation
Sr.
No.
Time
(h)
ZHNS
(ng/ml)
(Mean ± SD)*
ZHMKT
(ng/ml)
(Mean ± SD)*
AUC(ZHNS)
(ng/ml).h
AUC(ZHMKT)
(ng/ml).h
1 0.00 0.00 ± 0.00 0.00 ± 0.00 0.0000 0.0000
2 0.25 59.08 ± 18.054 48.22 ± 10.556 7.3850 6.0275
3 0.5 128.44 ± 20.617 109.53 ± 17.921 32.1100 19.7188
4 1.00 173.55 ± 13.018 162.78 ± 19.870 86.7750 68.0775
5 2.00 249.71 ± 31.965 205.54 ± 22.768 249.7100 184.1600
6 4.00 192.85 ± 16.424 163.80 ± 20.122 385.7000 369.3400
7 6.00 158.43 ± 35.978 115.91 ± 27.195 475.2900 279.7100
8 8.00 99.61 ± 23.414 90.73 ± 34.177 398.4400 206.6400
9 12.00 44.82 ± 15.239 34.34 ± 11.085 268.9200 250.1400
Total 1904.3300 1383.8138
*Indicates average of 6 determinations
ZHNS – Ziprasidone Hydrochloride Nanosuspension,
ZHMKT – Ziprasidone Hydrochloride Marketed Formulation
Figure 4.48 shows the mean serum concentration (µg/ml) vs. Time (h) in rats after
administration of optimized nanosuspension of ziprasidone hydrochloride and its marketed
formulation (Zipsydon® 20 Capsule). It is evident that the area under curve (AUC) values,
for the optimized formulation containing ziprasidone hydrochloride was higher than the
corresponding values of the marketed formulation of ziprasidone hydrochloride (Table
4.60). The increase AUC values could be attributed to the improved dissolution of
ziprasidone hydrochloride from the optimized nanosuspension formulation as compared to
its marketed formulation.

CHAPTER 4 RESULTS AND DISCUSSION
192
FIGURE 4.48: Serum concentration vs. time profile of ziprasidone hydrochloride
nanosuspension and marketed formulation
The values of all major pharmacokinetic parameters like maximum serum concentration
(Cmax), the time required for maximum serum concentration (Tmax), the area under the
curve (AUC0→12), terminal half-life (T1/2), elimination rate constant (KE) and absorption
rate constant (Ka) have been summarized in Table 4.61.
TABLE 4.61: Results of pharmacokinetic parameters of ziprasidone hydrochloride
nanosuspension and marketed formulation
Pharmacokinetic
Parameters
Ziprasidone Hydrochloride
Nanosuspension
(ZHNS)
Ziprasidone Hydrochloride
Marketed Formulation
(ZHMKT)
Cmax (ng/ml) 249.71 205.54
Tmax (h) 2.0 2.0
AUC0-12(ng/ml)*h 1904.33 1383.81
t 1/2E (h) 7.049 7.226
KE (h-1) 0.098 0.096
Ka (h-1) 0.622 0.409

CHAPTER 4 RESULTS AND DISCUSSION
193
The calculation was performed for the equivalent dose of test product (ZHNS)
required attaining same Cmax of the marketed product. [194]
F-Ratio was calculated from following equation,
Eq...(4.3)
Where, Fr = Relative Bioavailability (F-Ratio)
[AUC]test = AUC of ziprasidone hydrochloride nanosuspension
[AUC]std = AUC of ziprasidone hydrochloride marketed formulation
[D]test = Dose of ziprasidone hydrochloride nanosuspension
[D]std = Dose of ziprasidone hydrochloride marketed formulation
Using above equation, bioavailability fraction obtained from ziprasidone hydrochloride
nanosuspension was 1.38
The volume of distribution was calculated by the following equation,
Eq...(4.4)
Where, Vd = Volume of distribution
F = F-Ratio
D = Dose of the product
Cmax = Maximum plasma concentration
Using above equation, the volume of distribution obtained from ziprasidone hydrochloride
nanosuspension was 2.54 lit.
From the following equation amount of drug to be administered to attain the same plasma
concentration of marketed product was calculated
Eq...(4.5)
Where,
C = Cmax of ziprasidone hydrochloride marketed formulation
Ka = Absorption rate constant of ziprasidone hydrochloride nanosuspension

CHAPTER 4 RESULTS AND DISCUSSION
194
F = F-Ratio
X0 = Amount of ziprasidone hydrochloride administered by nanosuspension
Vd = Volume of distribution of ziprasidone hydrochloride nanosuspension
Ke = Elimination rate constant of ziprasidone hydrochloride nanosuspension
t = Time required for maximum plasma concentration by ziprasidone
hydrochloride nanosuspension
AUC was higher by 1.38 time and Cmax by 1.21 time higher for ziprasidone hydrochloride
nanosuspension as compared to marketed formulation indicates a substantial improvement
in absorption of the drug from nanosuspension.
Using above equation, amount of ziprasidone hydrochloride should be administered by
nanosuspension (X0) was found to be 0.31 mg/twice a day for rats, which was further
converted to human equivalent dose, which was 15.16 mg/ twice a day.
The reported usual dose of ziprasidone is 20 mg / 40 mg twice a day (Equivalent to 22.6mg
/ 45.2 mg twice a day dose of ziprasidone hydrochloride) in management schizophrenia
with food. Doses may be increased if necessary at intervals of not less than 2 days up to 80
mg twice daily. For maintenance, doses as low as 20 mg twice daily may be effective. The
study was conducted with 22.6 mg/ twice a day dose of ziprasidone hydrochloride
nanosuspension (Equivalent to 20mg/twice a day dose of ziprasidone base)[106].
Results suggested that by converting ziprasidone hydrochloride into nanosuspension form
dose can be reduced from 22.6 to 15.16 mg/ twice a day which was 67.0% of the regular
dose that indicated 33.0% dose reduction. The improvement in bioavailability due to the
conversion of drug nanosuspension was 33.0%.
4C.16 Conclusion
Plackett - Burman Design was effectively employed to identify formulating and processing
key parameters that are affecting the quality of the ziprasidone hydrochloride
nanosuspension. 32 factorial design was employed for optimization of the formulation of
nanosuspension. All the predetermined independent variables were found to affect the
dependent variables from the resultant nanosuspension. The optimum formulation prepared
by response optimizer by desirability function provided a final formulation with D =
0.9035 which released 96.61% of ziprasidone hydrochloride within 15 mins. The in-vivo
studies confirmed that nanosuspension loaded ziprasidone hydrochloride showed a

CHAPTER 4 RESULTS AND DISCUSSION
195
significantly better AUC as compared to marketed formulation and dose of ziprasidone
hydrochloride was reduced about 33.0 % to reach plasma concentration of marketed
formulation. The improved formulation could offer improved drug delivery strategy which
might allow concomitant use of ziprasidone hydrochloride in nanosuspension form. The
nanosuspension of drug exhibited 33% improvement in bioavailability.
4C.17 References
182. Pradhan KK, Mishra US, Pattnaik S, Panda CK, and Sahu KC, 2011, Development
and validation of a stability-indicating UV Spectroscopic method for Candesartan
in bulk and formulations, Indian Journal of Pharmaceutical Sciences, 73(6), 693–
696, ISSN: 0250-474X.
183. Muszalska I, Sobczak A, Dołhan A and Jelinska A, 2014, Analysis of Sartans: A
Review, Journal of Pharmaceutical Sciences, 103(1), 2–28, ISSN: 1520-6017.
184. Pandya VM, Patel JK, and Patel DJ, 2010, Effect of different stabilizer on the
formulation of Simvastatin Nanosuspension prepared by nanoprecipitation
technique, Research Journal of Pharmaceutical, Biological, and Chemical Sciences,
1(4), 910 -917, ISSN: 0975-8585.
185. Kamalakkannan V, Puratchikody A, and Ramanathan L, 2013, Development and
characterization of controlled release polar lipid microparticles of Candesartan
Cilexetil by solid dispersion, 8(2), 125–136, ISSN: 1735-9414.
186. Anonymous (2016) Infrared Reference Spectra – Candesartan Cilexetil. In: The
Japanese Pharmacopoeia, 17th Edition, The Ministry of Health, Labour and
Welfare, Japan, pp. 1804.
187. Silverstein RM and Webster FX (2010) Infrared Spectroscopy. In: Spectrometric
identification of an organic compound, 6th Edition, John Wiley and Sons Inc, New
Delhi, pp. 71-143.
188. Kamp W. (1991) Infrared Spectroscopy. In: Organic Spectroscopy, 3rd Edition,
Macmillan Press Ltd., London, pp. 19-100.
189. Shah SR, Parikh RH, Chavda JR and Sheth NR, 2013, Application of Plackett–
Burman screening design for preparing glibenclamide nanoparticles for dissolution
enhancement, Powder Technology, 235, 405–411, ISSN: 0032-5910.
190. Rahman Z, Zidan A, Habib MJ and Khan MA, 2010, Understanding the quality of
protein loaded PLGA nanoparticles variability by Plackett–Burman design,
International Journal of Pharmaceutics, 389(1-2), 186–194, ISSN: 0378-5173.

CHAPTER 4 RESULTS AND DISCUSSION
196
191. Patel DJ and Patel JK, 2010, Optimization of formulation parameters on famotidine
nanosuspension using factorial design and the desirability function, International
Journal of PharmTech Research, 2(1), 155-161, ISSN: 0974-4304.
192. Raval AJ and Patel MM, 2011, Preparation and characterization of nanoparticles
for solubility and dissolution rate enhancement of Meloxicam, International
Research Journal of Pharmaceuticals, 1(2), 42-49, ISSN: 2048-4143.
193. Patel DJ, Patel JK, Pandya VM and Jivani RR, 2010, Effect of Formulation
variables on Nanosuspension containing Famotidine prepared by Solvent
Evaporation Technique, International Journal of Pharmaceutical Sciences and
Nanotechnology, 2(4), 707-713, ISSN: 0974-3278.
194. Moschwitzer J, Achleitner G, Pomper H and Muller RH, 2004, Development of an
intravenously injectable chemically stable aqueous Omeprazole formulation using
nanosuspension technology, European Journal of Pharmaceutics and
Biopharmaceutics, 58(3), 615–9, ISSN: 0939-641.
195. Wagner JG (1993) Pharmacokinetics for Pharmaceutical Scientist. Technomic
Publishing Co. Inc., Lancaster.
196. Patel K, Patel A, Dave J and Patel C, 2012, Absorbance correction method for
estimation of Telmisartan and Metoprolol succinate in combined tablet dosage
form, Pharmaceutical Methods, 3(2), 106–111, ISSN: 2229-4716.
197. Patel PA and Patravale VB, 2010, Commercial Telmisartan Tablets: A
Comparative evaluation with Innovator Brand Micardis, International Journal of
Pharma Sciences and Research, 1(8), 282-292, ISSN: 0975-9492.
198. Patel B, Parikh RH, and Swarnkar D, 2012, Enhancement of dissolution of
Telmisartan through use of solid dispersion technique - surface solid dispersion,
Journal of Pharmacy and Bioallied Sciences, 4 (Suppl 1), S64–S68, ISSN: 0975-
7406.
199. Thakkar HP, Patel BV, and Thakkar SP, 2011, Development and characterization
of nanosuspensions of Olmesartan Medoxomil for bioavailability enhancement,
Journal of Pharmacy and Bioallied Sciences, 3(3), 426–434, ISSN: 0975-7406.
200. H. Ramanathan, 2011, USP Pending Monograph Draft 1 — For Public Comment
USP,
www.usp.org/sites/default/files/usp_pdf/EN/USPNF/../m5431draft_ziprasidone.pdf
201. Anandkumar Y, Anitha M, Hemanth A and Srinivas S, 2010, Development of
rapid UV Spectrophotometric method for the estimation of Ziprasidone

CHAPTER 4 RESULTS AND DISCUSSION
197
hydrochloride in bulk and formulations, Digest Journal of Nanomaterials and
Biostructures, 5(1), 279 – 283, ISSN: 1842-3582.
202. Latha MM, Sundar VD, Nandhakumar S, and Dhana Raju MD, 2014, Design and
evaluation of sustained release tablets containing a solid dispersion of Ziprasidone
Hydrochloride, International Journal of PharmTech Research, 6(3), 959-968, ISSN:
0974-4304.
203. Jadhav KS and Erande KB, 2016, Solubility enhancement and formulation of fast
dissolving tablet of Ziprasidone Hydrochloride, International Journal of Research
in Pharmacy and Chemistry, 6(4), 675-683, ISSN: 22312781.
.

SUMMARY
AND
CONCLUSION

CHAPTER 5 SUMMARY AND CONCLUSION
199
CHAPTER – 5
Summary and Conclusion
Bioavailability enhancement is nowadays a great challenge to the pharmaceutical
industries. The drug specifically from BCS class II and IV are always considered to have a
dissolution rate limited bioavailability. Various approaches have been used to enhance the
rate of dissolution of such types of drugs in order to get better bioavailability.
Nanosuspension is one of those approaches which can tremendously enhance the effective
surface area of drug particles as well as also shows vapor pressure effect and thereby
increases the rate of dissolution and hence bioavailability. Telmisartan and candesartan
cilexetil, antihypertensive agents - angiotensin II inhibitors as well as ziprasidone
hydrochloride, an atypical antipsychotic drug are BCS class II drugs which are poorly
soluble in water. Hence, dissolution is a rate-limiting step for enhancement of
bioavailability of selected drugs.
The first part of the research work included the formulation of candesartan cilexetil
nanosuspension by antisolvent precipitation followed by ultrasonication technique for
improvement of oral bioavailability. PVP K-30 was found to be the most suitable stabilizer
of candesartan cilexetil. Compatibility study was carried out using FTIR and DSC studies
and showed drug- excipient compatibility. Plackett - Burman Design was effectively
employed to identify formulating and processing key parameters that are affecting the
quality of the candesartan cilexetil nanosuspension. 32 factorial design was employed to

CHAPTER 5 SUMMARY AND CONCLUSION
200
optimize and evaluate the main effects, interaction effects and quadratic effects on the
formulation of nanosuspension. The optimum formulation prepared by response optimizer
by desirability function provided a final formulation with D = 1.000 which released
97.13% of candesartan cilexetil within 2 mins. The in-vivo studies confirmed that
nanosuspension loaded candesartan cilexetil showed a significantly better AUC as
compared to marketed formulation exhibiting improved bioavailability and dose of
candesartan cilexetil was reduced about 38.13.0% to reach peak plasma concentration of
marketed formulation.
The second part of the research work included the formulation of telmisartan
nanosuspension for improvement of oral bioavailability. Poloxamer 407 was found to be
the most suitable stabilizer of telmisartan. Preliminary and compatibility study was carried
out using FTIR and DSC studies and showed drug- excipient compatibility. Plackett -
Burman Design was effectively employed to identify formulating and processing key
parameters that are affecting the quality of the telmisartan nanosuspension. 32 factorial
design was employed to optimize and evaluate the main effects, interaction effects and
quadratic effects on the formulation of nanosuspension. The optimum formulation
prepared by response optimizer by desirability function provided a final formulation with
D = 0.9629 which released 102.60% of telmisartan within 2 mins. The in-vivo studies
confirmed that nanosuspension loaded telmisartan showed a significantly better AUC as
compared to marketed formulation exhibiting improved bioavailability and dose of
telmisartan was reduced about 18.25% to reach peak plasma concentration of marketed
formulation.
If the case of a salt of a weak acid like candesartan cilexetil (pKa – 4.45) is considered, at
any given pH of the bulk of the solution, the pH of the diffusion layer of the salt form of a
weak acid will be higher than the observable with the free acid form of telmisartan (pKa –
6). Owing to the increased pH of the diffusion layer, the solubility, and dissolution rate of a
weak acid salt form is promoted, which may reflect in bioavailability too. It was supported
by the results of bioavailability of both the drugs. Bioavailability improvement in
candesartan cilexetil was 38.13% whereas that of telmisartan was found to 18.25%.
The third part of the research work included the formulation of ziprasidone hydrochloride
nanosuspension for improvement of oral bioavailability. Poloxamer 407 was found to be
the most suitable stabilizer of ziprasidone hydrochloride. Preliminary and compatibility

CHAPTER 5 SUMMARY AND CONCLUSION
201
study was carried out using FTIR and DSC studies and showed drug- excipient
compatibility. Plackett - Burman Design was effectively employed to identify formulating
and processing key parameters that are affecting the quality of the ziprasidone
hydrochloride nanosuspension. 32 factorial design was employed to optimize and evaluate
the main effects, interaction effects and quadratic effects on the formulation of
nanosuspension. The optimum formulation prepared by response optimizer by desirability
function provided a final formulation with D = 0.9035 which released 96.61% of
ziprasidone hydrochloride within 15 mins. The in-vivo studies confirmed that
nanosuspension loaded ziprasidone hydrochloride showed a significantly better AUC as
compared to marketed formulation exhibiting improved bioavailability and dose of
ziprasidone hydrochloride was reduced about 33.0 % to reach peak serum concentration of
marketed formulation.

BIBLIOGRAPHY

BIBLIOGRAPHY
203
BIBLIOGRAPHY
Chingunpitak J, Puttipipatkhachorn S, Chavalitshewinkoon-Petmitr P, Tozuka Y,
Moribe K and Yamamoto K, 2008, Formation, Physical stability and in-vitro
antimalarial activity of dihydro-artemisinin nanosuspensions obtained by the co-
grinding method, Drug Development, and Industrial Pharmacy, 34(3), 31422, ISSN:
1520-5762.
Sutradhar KB, Khatun S and Luna IP, 2013, Increasing Possibilities of
Nanosuspension, Journal of Nanotechnology, Volume 2013 (2013), 1-12, ISSN: 1687-
9511.
Samar AA, Maha AH, Ali SA and Kadria AE, 2015, Nanosuspension: An Emerging
Trend for Bioavailability Enhancement of Etodolac, International Journal of Polymer
Science, Volume 2015 (2015), 1-16, ISSN: 1687-9430.
Peters K, Muller RH, and Craig DQM, 1999, An investigation into the distribution of
lecithins in nanosuspension systems using low-frequency dielectric spectroscopy,
International Journal of Pharmaceutics, 184, 53–61, ISSN: 0378-5173.
Komasaka T, Fujimura H, Tagawa T, Sugiyama A and Kitano Y, 2014, Practical
method for preparing nanosuspension formulations for toxicology studies in the
discovery stage: formulation optimization and in vitro/in vivo evaluation of nanosized
poorly water-soluble compounds, Chemical and Pharmaceutical Bulletin, 62(11),
1073-1082, ISSN: 1347-5223.
Talat M, Upadhyay P, Omray P, Koteshwara KB and Srivastava ON, 2014,
Preparation and Characterization of Nanosuspension of Tamoxifen Citrate for Intra-
Venous Administration in Drug-Resistant Breast Cancer Cells, Advanced Science
Letters, 20(7-9), 1483-1489, ISSN: 1936-7317.
Muthu MS and Singh S, 2009, Poly (D, L-Lactide) Nanosuspensions of Risperidone
for Parenteral Delivery: Formulation and In-Vitro Evaluation, Current Drug Delivery,
6, 62-68, ISSN: 1875-5704.
Shakeel F, Ramadan W and Shafiq S, 2009, Solubility and Dissolution Improvement
of Aceclofenac using Different Nanocarriers, Journal of Bioequivalence and
Bioavailability, 1(2), 39-43, ISSN:0975-0851.
Nakarani M, Misra AK, Patel JK and Vaghani SS, 2010, Itraconazole nanosuspension
for oral delivery: Formulation, characterization and in vitro comparison with the

BIBLIOGRAPHY
204
marketed formulation, DARU Journal of Pharmaceutical Sciences, 18(2), 84-90, ISSN:
2008-2231.
Pandya VM, Patel JK and Patel DJ, 2011, Formulation and Optimization of
Nanosuspensions for Enhancing Simvastatin Dissolution Using Central Composite
Design, Dissolution Technologies, 18(3), 40-45, ISSN: 1521-298X.
Kumar A, Sahoo SK, Padhee K, Singh Kochar PP, Satapathy A and Pathak N, 2011,
Review on solubility enhancement techniques for hydrophobic drugs, Pharmacie
Globale International Journal of Comprehensive Pharmacy, 3(3), 1-7, ISSN 0976-
8157.
Lee J, Lee SJ, Choi JY, Yoo JY, Ahn CH, 2005, Amphiphilic amino acid copolymers
as stabilizers for the preparation of nanocrystal dispersion, European Journal of
Pharmaceutical Sciences, 24 (5) 441–449, ISSN: 0928-0987.
Eerdenbrugh BV, Froyen L, Humbeeck JV, Martens JA, Augustijns P, Mooter GV,
2008, Drying of crystalline drug nanosuspensions—The importance of surface
hydrophobicity on dissolution behavior upon redispersion, European Journal of
Pharmaceutical Sciences, 35(2), 127–135, ISSN: 0928-0987.
Savjani KT, Gajjar AK, and Savjani JK, 2012, Drug Solubility: Importance and
Enhancement Techniques, International Scholarly Research Network Pharmaceutics,
Volume 2012, 1-10, ISSN: 2356-7872.
Chaudhary A, Nagaich U, Gulati N, Sharma VK and Khosa RL, 2012, Enhancement of
solubilization and bioavailability of poorly soluble drugs by physical and chemical
modifications: A recent review, Journal of Advanced Pharmacy Education and
Research, 2(1), 32-67, ISSN 2249-3379.
Liu P (2013) Nanocrystal formulation of poorly soluble drugs. Ph.D. Thesis. Division
of Pharmaceutical Technology, Faculty of Pharmacy, University of Helsinki, Finland.
Modesto-Lopez LB and Biswas P, 2010, Role of the effective electrical conductivity of
nanosuspensions in the generation of TiO2 agglomerates with electrospray, Journal of
Aerosol Science, 41(8), 790–804, ISSN: 0021-8502.
Verma S, Lan Y, Gokhale R, Burgess DJ, 2009, Quality by design approach to
understand the process of nanosuspension preparation, International Journal of
Pharmaceutics, 377(1-2), 185–198, ISSN: 0378-5173.

BIBLIOGRAPHY
205
Ali HSM, York P, and Blagden N, 2009, Preparation of hydrocortisone
nanosuspension through a bottom-up nanoprecipitation technique using microfluidic
reactors, International Journal of Pharmaceutics, 375(1-2), 107–113, ISSN: 0378-5173.
Gao L, Liu G, Wang X, Liu F, Xu Y and Ma J, 2011, Preparation of a chemically
stable quercetin formulation using nanosuspension technology, International Journal of
Pharmaceutics, 404(1-2), 231–237, ISSN: 0378-5173.
Bajaj S, Singla D and Sakhuja N, 2012, Stability Testing of Pharmaceutical Products,
Journal of Applied Pharmaceutical Science, 2(3), 129-138, ISSN: 2231-3354.

APPENDICES

APPENDICES
207
Appendix A - IAEC Approval letter

APPENDICES
208
Appendix B - GUJCOST Minor Research Project Sanction Letter

APPENDICES
209
Appendix C - List of Publications
Paun JS and Tank HM, 2012, Nanosuspension: An Emerging Trend for
Bioavailability Enhancement of Poorly Soluble Drugs, Asian Journal of Pharmacy
and Technology, 2(4), 158-169, ISSN: 2231–5705.
Paun JS and Tank HM, 2016, Screening of Formulating and Processing Parameters
on Candesartan Cilexetil Nanosuspension Prepared by Nanoprecipitation-
Ultrasonication Technique, International Journal of Pharmaceutical Research, 8(4),
8-13, ISSN 0975-2366.
Paun JS and Tank HM, 2016, Screening of formulating and processing parameters
for Ziprasidone Hydrochloride nanosuspension prepared by nanoprecipitation-
ultrasonication technique, Journal of Pharmaceutical Science and Bioscientific
Research, 6(6), 766-772, ISSN 2277-3681.
APPENDICES
210

APPENDICES
211
APPENDICES
212
APPENDICES
213
Appendix D - Poster Presentation of Research Work in National Level Seminar
Jalpa S. Paun, Hemraj M. Tank, Application of Plackett-Burman screening design for
optimizing formulating and processing parameters of Ziprasidone Hydrochloride
Nanosuspension, poster presented in SERB sponsored Two Days National Seminar on
Bioavailability Enhancement: An Industry Desire and Regulatory Constraints at
Department of Pharmaceutical Sciences, Saurashtra University, Rajkot, 30th – 31st July
2016.
APPENDICES
214
APPENDICES
215