design, development and validation of the workplace ... · includes two constructs that can inform...
TRANSCRIPT

Loughborough UniversityInstitutional Repository
Design, development andvalidation of the workplace
cyberbullying measure(WCM)
This item was submitted to Loughborough University's Institutional Repositoryby the/an author.
Citation: FARLEY, S. ...et al., 2016. Design, development and validation ofthe workplace cyberbullying measure (WCM). Work and Stress, 30(4), pp.293-317.
Additional Information:
• This is an Accepted Manuscript of an article published by Taylor& Francis in Work and Stress on 22 Nov 2016, available online:http://www.tandfonline.com/10.1080/02678373.2016.1255998
Metadata Record: https://dspace.lboro.ac.uk/2134/22114
Version: Accepted for publication
Publisher: c© Taylor & Francis
Rights: This work is made available according to the conditions of the Cre-ative Commons Attribution-NonCommercial-NoDerivatives 4.0 International(CC BY-NC-ND 4.0) licence. Full details of this licence are available at:https://creativecommons.org/licenses/by-nc-nd/4.0/
Please cite the published version.
DEVELOPMENT OF A WORKPLACE CYBERBULLYING MEASURE
1
Design, development and validation of a workplace cyberbullying measure (WCM)
Samuel Farley1, Iain Coyne2, Carolyn Axtell1 and Christine Sprigg1
Author Note
1Institute of Work Psychology, University of Sheffield Management School
2School of Business and Economics, University of Loughborough
Keywords: Cyberbullying, workplace bullying, measure development, bullying behaviours
Correspondence concerning this article should be sent to Samuel Farley, Room 2-22,
Department of Psychology, Western Bank, Sheffield, S10 2TP (email:

DEVELOPMENT OF A WORKPLACE CYBERBULLYING MEASURE
2
Abstract
Cyberbullying research is beginning to expand from its roots in the youth context into
the organisational realm. However, a lack of psychometrically sound scales that capture the
diverse features of technological communication has hindered workplace cyberbullying
research. The purpose of this study was to develop a valid and reliable measure to assess
cyberbullying across disparate working populations. Three separate studies involving a total
of 944 respondents from different work settings were conducted to establish a 17-item
workplace cyberbullying measure (WCM). Further validation of the WCM was established
by assessing correlations with a wide range of variables. Regression analysis demonstrated
that the measure explained significant incremental variance in emotional exhaustion over and
above existing harassment constructs. Justification for developing the WCM is presented,
along with implications for research and practise.

DEVELOPMENT OF A WORKPLACE CYBERBULLYING MEASURE
3
Introduction
Cyberbullying propagated by children and adolescents has been the focus of research
attention since the early 2000s. However, while researchers know an increasing amount about
traditional workplace bullying, the extant literature on workplace cyberbullying is limited.
Evidence exists that cyberbullying occurs within organisational environments (Baruch, 2005;
Farley et al, 2015; Privitera & Campbell, 2009) and has negative implications for those who
experience it (D’Cruz & Noronha, 2013; Snyman & Loh, 2015). Some authors argue that
cyberbullying may have more severe outcomes than traditional bullying (Coyne et al, 2016;
Dooley, Pyzalski, & Cross, 2009) because certain features of cyberbullying (e.g. physical
separation of perpetrator and target, perpetrator anonymity) increase fear and uncertainty
(Ford, 2013). These features have led human resources professionals to recognise
cyberbullying as a workplace stressor, although they are grappling with the complexities of
cases that occur outside of working hours (West et al, 2014).
Before systematic research can adequately address cyberbullying, validated
measurement tools need to be developed (Tokunaga, 2010). Despite growing awareness of
workplace cyberbullying, the current measurement of the phenomenon is limited. Research is
either restricted by its focus solely on email harassment (Baruch, 2005) or on related, yet
conceptually different concepts (e.g. cyber incivility, Giumetti, et al. 2012). The current
research attempts to fulfil the measurement need by detailing the development of a workplace
cyberbullying measure.
Understanding and Defining Workplace Cyberbullying
Within the child/adolescent research context a multitude of cyberbullying definitions
have been proposed (Kowalski, Giumetti, Schroeder & Lattanner, 2014). Common aspects of

DEVELOPMENT OF A WORKPLACE CYBERBULLYING MEASURE
4
these definitions include using technology as the vehicle for harassment, intent to harm,
repetition and a power imbalance between the perpetrator and victim (Smith et al, 2008).
Less research has addressed work-related cyber harassment, yet this body of literature
includes two constructs that can inform our understanding of workplace cyberbullying: cyber
incivility and cyberaggression. Cyber incivility has been defined as “communicative
behaviour exhibited in computer-mediated interactions that violate workplace norms of
mutual respect” (Lim & Teo, 2009, p.419). Cyber incivility closely mirrors the concept of
face-to-face incivility which refers to low intensity deviant acts enacted towards others with
ambiguous intent to harm (Anderson & Pearson, 1999). Conceptually, cyber incivility differs
from cyberbullying because it can refer to a single act, the acts involved are less severe than
those which reflect cyberbullying and there is no requirement for a power disparity between
perpetrator and target for cyber incivility to occur.
Weatherbee and Kelloway (2006) define Cyberaggression as “aggression expressed in
a communication between two or more people using ICTs, wherein at least one person in the
communication aggresses against another in order to effect harm.” (p.461). Research on
traditional forms of aggression and bullying has outlined how they differ (Schat & Kelloway,
2005). Firstly, bullying involves repeated acts, whereas aggression can refer to a single act.
Secondly, bullying involves a power disparity between perpetrator and victim, which is not a
prerequisite of aggression. Finally, aggression is enacted intentionally, but this is not a
defining aspect of many workplace bullying definitions (Einarsen, 2000; Einarsen, Hoel, Zapf
& Cooper, 2011; Matthiesen & Einarsen, 2007).
As noted by Spector (2014) before empirical work can address a construct, it must be
theoretically conceptualised and differentiated from related constructs. Therefore
distinguishing cyberbullying from related cyber harassment constructs can facilitate
DEVELOPMENT OF A WORKPLACE CYBERBULLYING MEASURE
5
understanding of how conceptual differences affect antecedents, outcomes and coping
strategies. However, even though researchers have developed cyber constructs to represent
online versions of aggression and incivility, a relevant question concerns whether workplace
cyberbullying needs to be investigated as a separate form of bullying. This is an especially
pertinent question in the field of workplace harassment as the development of multiple
constructs may not be yielding new insights or adding value to the research field (Hershcovis,
2011).
Similar to cyber incivility and cyberaggression, cyberbullying shares the same
definitional criteria as its offline equivalent, including repeatedly experiencing behaviours
described as inappropriate, negative and hostile (D’Cruz & Noronha, 2013) and a power
imbalance between perpetrator and victim (Pivitera & Campbell, 2009; Zhang & Leidner,
2014). Accordingly, workplace cyberbullying has been conceptualised simply as ‘bullying
via technology’ (Coyne et al, 2016). However, researchers have noted that cyberbullying
possesses unique characteristics which may facilitate a different bullying experience for those
involved (Kowalski et al, 2014).
Cyberbullying is enacted through technologies, which can span time and space
boundaries allowing perpetrators greater access to victims (Smith, 2012). Traditionally,
workplace bullying has occurred “at work” but perpetrators and targets do not need to be
physically co-located for cyberbullying to occur. This allows perpetrators to send
communications whenever they please and it can facilitate anonymity which is the extent that
a perpetrator’s identity is concealed (Ford, 2013). Anonymous cyberbullying can occur
within the working context as employees can create fake email accounts or use pseudonyms
to disguise their identity (D’Cruz & Noronha, 2013).
DEVELOPMENT OF A WORKPLACE CYBERBULLYING MEASURE
6
A further difference concerns the permanence of certain cyberbullying acts, which
distinguishes them from the transience of most traditional bullying behaviours. Website
blogs, emails and social media postings are permanently accessible once published, they can
therefore be repeatedly viewed and seen by a much larger audience. Although some
traditional bullying behaviours (e.g. physical isolation) may represent a permanent change
which is observable to bystanders, the permanence associated with cyberbullying refers to the
permanent record of the original act.
Finally, the audience range can be much greater when cyberbullying occurs. Online
communications can transcend the barriers of a work group such that private conflicts can be
observed by all organisational members and even members of the public. For example,
D’Cruz and Noronha (2013, p.335) described a situation where employees from the Indian
I.T sector used a social networking website to air grievances about their managers. The
employees posted comments about managers working styles, individual characteristics and
personal relationships. Each post triggered additional comments from bystanders who were
often unknown to the person being discussed.
Although the existence of these features may produce experiential differences
between workplace cyberbullying and traditional workplace bullying, we contend that
workplace cyberbullying and traditional workplace bullying are conceptually similar. The
way that power and repetition are exercised through technology may be different to the face-
to-face context (for example anonymity may represent a power disparity) yet cyberbullying is
still characterised by repetition and power imbalance. We therefore define workplace
cyberbullying as: a situation where over time, an individual is repeatedly subjected to
perceived negative acts conducted through technology (e.g. phone, email, web sites, social
media) which are related to their work context. In this situation the target of workplace
cyberbullying has difficulty defending him or herself against these actions.

DEVELOPMENT OF A WORKPLACE CYBERBULLYING MEASURE
7
Similar to many traditional workplace bullying definitions, intent to harm has not
been included as a defining criterion. It has been argued that intent should not be used to
operationalise bullying in the workplace because of the complexities surrounding how to
establish a perpetrator’s real intentions (Einarsen et al, 2011). Establishing intent is even
more difficult during online communication because ICTs do not transmit the full range of
communication cues (Daft & Lengel, 1986). Additionally, because cyberbullying acts
sometimes leave a digital footprint, perpetrators may be even more careful to disguise
behaviours to prevent being reported.
Conceptualising cyberbullying in the same manner as traditional bullying prompts the
question of whether new measurement tools are actually needed. As commentators argue that
different types of bullying behaviour should be investigated and evaluated differently (Hoel,
Faragher & Cooper, 2004; Escartin et al, 2010) we contend that tailored methods are
necessary. It has also been argued that multiple measures are needed for each form of abuse
because this facilitates greater understanding of the construct (Bowling, Camus & Blackman,
2015). Existing cyber harassment measures are reviewed in the following section.
Measurement
Cyber Specific Measures
Behavioural measures have been developed to assess cyber incivility (Lim & Teo,
2009), cyberaggression (Weatherbee, 2007) and cyberbullying (Coyne et al, 2016; Hong et al,
2014). Yet the cyber incivility and cyberaggression scales are not suitable for cyberbullying
research because both scales only measure email and instant messaging behaviours. In order
to fully appraise cyberbullying, a scale would need to consider a broader spectrum of ICTs.
Indeed, a limitation of measures that reference the media used to channel an act is that they
may become outdated when the media becomes obsolete. Furthermore, neither measure
DEVELOPMENT OF A WORKPLACE CYBERBULLYING MEASURE
8
captures the cyberbullying criterion of power disparity between perpetrator(s) and victim,
thus they lack construct validity.
One measure developed to assess cyberbullying was published by Hong et al. (2014)
however there are a number of potential drawbacks to this scale. Firstly, it is not reported
whether a measure development methodology was used to validate the instrument. Secondly,
it is unclear how the scale assesses power imbalance. Finally, the measure was developed in
the Taiwanese context, therefore the terminology and phrasing of items may be difficult for
Western employees to understand.
A dedicated cyberbullying instrument was also used by Snyman and Loh (2015) who
investigated workplace cyberbullying among white collar employees using the 21 item
cyberbullying experience survey (Doane, Kelley, Chiang & Padilla, 2013). This measure
contains a number of cyber specific items, including ‘Has someone posted an embarrassing
picture of you electronically where other people could see it’. However, the measure does not
include any items related to the work context as it was developed to assess cyberbullying
among college students.
The Cyber NAQ
A popular approach has been to adapt the well-known negative acts questionnaire
(NAQ; Einarsen, Hoel & Notelaers, 2009) to assess workplace cyberbullying (Coyne et al,
2016; Farley et al, 2015). The cyber version of the NAQ has strong construct validity,
capturing both repetition and power imbalance (if a global self-report item is included). Yet,
adapting the NAQ may not adequately capture the full workplace cyberbullying domain as it
was originally developed to assess traditional bullying. Accordingly, unique cyberbullying
behaviours are not included in the scale (e.g. carbon copying, having personal information
shared online) which means the cyber NAQ lacks content validity.

DEVELOPMENT OF A WORKPLACE CYBERBULLYING MEASURE
9
The development of a workplace cyberbullying construct therefore broadens the scope
of behaviours that can occur within the workplace bullying framework. To promote
systematic research efforts on workplace cyberbullying these behaviours initially need to be
identified. After identification a tailored scale should be developed to assess workplace
cyberbullying rather than simply adding behavioural items to existing scales. Researchers
have added cyberbullying items to traditional bullying measures to account for cyber-specific
behaviours (Fox & Cowan, 2015). However adding items to existing scales can change how a
measure relates to other variables (Keller & Dansereau, 2001) which has implications for
meta-analysis because the nature of the same scale changes over time. Keller and Dansereau
(2001) therefore suggested that “one might be better off starting with a new scale rather than
enhancing the old scale” (p.139). Given these arguments, the aim of this study was to
develop a valid and reliable workplace cyberbullying measure.
The Current Study
Three multiphase studies, guided by Hinkin’s (1998) measure development
methodology were conducted to develop the WCM. Two criteria were considered during
these studies. Firstly, the measure should be applicable to employees from different industries
and working sectors. This facilitates future research by enabling researchers to investigate the
phenomenon in different settings, as well as enabling comparisons across samples (Einarsen
et al, 2009). Secondly, to counter the criticism of the limited scope of current measures, the
scale should assess behaviours perpetrated through a broad spectrum of communication
technologies.
Study One: Instrument Development
Study One involved two separate phases: (1) collecting descriptions of workplace
cyberbullying behaviours and converting them into measurement items; followed by (2)
assessing face validity.

DEVELOPMENT OF A WORKPLACE CYBERBULLYING MEASURE
10
Phase One: Item Generation
Both inductive and deductive methods were used to generate items (Day, Paquet,
Scott & Hambley, 2012). Initially a deductive process was followed as the researchers
independently identified 13 workplace cyberbullying behaviours by searching the cyber
harassment literature. Data were then gathered using a more inductive process that involved
obtaining behavioural descriptions from the working population.
Behavioural descriptions were generated using an online survey. Respondents were
recruited from five data collection streams: (1) Three UK teaching unions and a marketing
organisation sent the survey to their members. (2) An email was distributed on a UK
Academic Mailing List Service called JISC Mail. JISC mail is a website that facilitates
communication on educational and research interests, members tend to be from research
communities although private sector employees also subscribe. Members sign up to different
mailing lists which distribute information on a particular interest via email. (3) Posts to the
survey were distributed through the social media websites LinkedIn and Twitter. (4) Data
were collected in the Australian Public Sector (APS) through collaboration with researchers
based in Australia. (5) Data were collected at a workshop attended by 14 individuals from
academia and industry.
Respondents were asked to describe up to three behaviours they felt constituted
workplace cyberbullying based on the following definition “persistent, repeated negative
behaviour enacted through communication technologies (e.g. phone calls, emails, text
messages, social networking websites) by individuals or groups, which creates a hostile work
environment. Over time, this impacts negatively on the person facing the behaviour and
places them in an increasingly inferior position”. Questionnaire instructions stated that the
behaviours did not necessarily have to be experienced during work hours and that
DEVELOPMENT OF A WORKPLACE CYBERBULLYING MEASURE
11
cyberbullying could occur through various media, including email, telephone calls, text
messages, social networking websites, regular websites, instant messaging, chat rooms and
video conferencing.
In total, 248 completed surveys were returned which generated 604 behavioural
descriptions. Analysis revealed that the majority of respondents (71.1%) were female and
their ages ranged from 23 to 68 with a mean age of 45 years (SD = 11.24). They held job
roles including teacher, marketing executive and auditor. An inductive method was used to
sort the behavioural descriptions into categories. Hinkin (1998) notes that once descriptions
have been generated, they should be classified into categories or sorted using content analysis
of key words or themes. Behavioural descriptions were coded and organised into categories
under a heading that best described the text content. After analysing all the descriptions, 32
categories were developed, examples include gossip, exclusion, unreasonable work demands,
emails at unsociable hours, photos and jokes.
Sorting the descriptions into categories enabled the removal of identical behavioural
descriptions, while behaviours that were too specific to a single working context were also
removed. After eliminating redundant descriptions, 95 workplace cyberbullying behaviours
remained. These descriptions were combined with the behaviours identified during the
deductive search of the literature (n = 13), leaving 108 behavioural descriptions available for
item writing procedures.
Recommendations were followed to convert behavioural descriptions into items
(Hinkin, 1998). A total of 40 behavioural descriptions were discarded during the item writing
process. Items considered ambiguous or particularly unlikely to occur in a working context
were removed from the item pool. Additionally, items that referenced a specific
The full list of categories is available from the first author.

DEVELOPMENT OF A WORKPLACE CYBERBULLYING MEASURE
12
communication method (e.g. email, text, social media) were excluded as the evolution of
technology can quickly render medium specific acts as obsolete (Menesini et al, 2011).
To ensure that all items were cyber specific the following pre-item instructions were
developed: “The following questions refer to acts conducted through technology that are
related to your work context. These technologies can include: Text messaging;
pictures/photos/video clips; phone calls; email; instant messaging; social networking
websites; video software and general websites. Please rate how often over the last six
months, you have been subjected to the following negative work-related acts through
technology. Please note: these questions do NOT refer to face-to-face behaviours.” To
account for new ICT developments, these instructions can be adapted when the referenced
media become outdated and when new forms of technology-mediated communication
emerge. To further tailor the measure to the cyber context, items were worded in a manner
that reflected the online context, as we used terms including “messages”, “communications”,
“copy” and “share” which capture common aspects of cyber communication.
Content validity was established during the item writing phase as behaviours from the
different categories were converted into items, which produced a broad item pool comprising
68 items. A comprehensive item pool facilitates content validity because the fundamental
goal of item generation is to include all possible contents that might comprise the construct
(Loevinger, 1957).
Phase Two: Face Validity Assessment
Hardesty and Bearden (2004) note that content validity refers to the spread of items
and whether they represent the full proportion of a construct, whereas items are face valid if
they represent the intended construct, but their spread is not considered. A common method
DEVELOPMENT OF A WORKPLACE CYBERBULLYING MEASURE
13
of assessing face validity involves employing subject matter experts (SMEs) who judge items
according to the extent that they represent the given construct (Hardesty & Bearden, 2004).
Sample & Procedure
Eight SMEs were asked to rate (on a scale of 1 = strongly disagree to 7 = strongly
agree) all 68 items according to the extent that they felt items were consistent with the
workplace cyberbullying definition. Six SMEs were experts in workplace harassment, one
was an expert in computer-mediated communication and the other was a youth cyberbullying
expert. A text box was also provided after each item which enabled SMEs to make notes on
the clarity, consistency and wording of the items.
Feedback from two SMEs stated that workplace cyberbullying should be defined
without assuming that it creates a ‘hostile work environment’. Instead the relationship
between workplace cyberbullying and outcomes should be examined empirically using
appropriate research methods. We therefore changed the workplace cyberbullying definition
to: a situation where over time, an individual is repeatedly subjected to perceived negative
acts conducted through technology (e.g. phone, email, web sites, social media) which are
related to their work context. In this situation the target of workplace cyberbullying has
difficulty defending him or herself against these actions. Due to this definitional change, all
the behavioural descriptions produced during phase one of the study were re-examined to
ensure they were still consistent with the adapted definition. No items were removed as a
result of this examination.
Several methods were used to guide item retention (Hardesty & Bearden, 2004).
Firstly, the ‘sumscore’ rule (Lichtenstein, Netemeyer & Burton, 1990) was used to evaluate
the representativeness of the items, which is the total score for an item across all SME
ratings. A guide to item retention was to remove items that received a mean rating of 2.4 and
lower, indicating clear disagreement on face validity. Items that received a mean score of
DEVELOPMENT OF A WORKPLACE CYBERBULLYING MEASURE
14
between 2.5 and 4.4 would be examined to either re-write or delete, while items that received
a mean score of 4.5 and above would generally be retained. However, Hinkin (1998) notes
that scale development involves “a bit of art as well as a lot of science” (p. 118). Therefore
items scores were not examined in isolation.
Once the mean score for each item had been calculated, a document was produced
which contained the item, its mean face validity rating and any comments the SMEs had
offered regarding wording or clarity. This document was reviewed at a meeting where the
research team discussed each item based upon different criteria, including ease of
understanding, number of similar items retained and how commonly it had been referenced
by participants.
A total of 34 items were retained. Only one item was removed due to receiving a
mean rating below 2.4 (Had a colleague use technology-mediated communications to deliver
bad news). In total, 31 items were rated between 2.5 and 4.4 (21 were discarded and 10 were
rewritten and retained). Furthermore, 36 items received ratings higher than 4.5 (12 were
removed, 14 were rewritten and retained and 10 were accepted outright). A severity
assessment was then performed to ensure that the 34 retained items were perceived as
sufficiently negative, rather than low-intensity behaviours which may better reflect cyber
incivility. A sample of six new SMEs and 11 employees from a large public sector
organisation were asked to rate the severity of each item on a scale, whereby 1 = no
harassment and 10 = maximum severity. The assessment confirmed that the items were
perceived as sufficiently negative as 32 (94.12%) items received a mean severity rating
greater than 5.00, whereas just two (5.88%) received a mean rating lower than 5.00 (rated
4.82 and 4.12 respectively).
Study One Summary

DEVELOPMENT OF A WORKPLACE CYBERBULLYING MEASURE
15
During Study One a 34-item workplace cyberbullying scale was established. In the
first phase, inductive and deductive methods were used to create an item pool (n=68). In the
second phase, each item’s face validity was assessed which resulted in the removal of 34
items. These processes produced a 34-item workplace cyberbullying measure that could be
distributed to employees.
Study Two: Initial measure validation
Study Two was conducted to validate the 34-item measure on a new sample of
employees. The study had three main aims: (1) to identify the underlying factor structure (2)
to assess reliability and validity and (3) to refine the scale by removing unreliable and
unrepresentative items.
Sample & Procedure
The 34-item workplace cyberbullying measure (WCM) was distributed across five
data collection streams. They comprised 79 (18.6%) individuals from the researcher’s
network; ten (2.4%) employees from a large multinational leadership and talent consultancy
firm; six (1.4%) volunteers at a UK mental health charity; 194 (45.8%) individuals from JISC
mail distribution lists that were different from those used in the Study One and 135 (31.8%)
employees from a large city council. An online survey was distributed via email to each of
the data collection streams with the exception of the city council who posted information
regarding the study on their intranet. This methodology allowed direct access to people who
used at least one form of technology in relation to their work, although due to the nature of
the method response rates cannot be calculated.
Participants comprised 424 employees aged between 19 and 69 years (M = 41 years,
SD = 11.90); 55.3% of participants were female. All three sectors were represented within the

DEVELOPMENT OF A WORKPLACE CYBERBULLYING MEASURE
16
sample and job roles included IT manager, consultant and social worker. Most respondents
worked 35 hours or more per week (79%), and they had a mean tenure of 20 years (SD =
11.96).
Respondents were asked how often over the last six months they had experienced
each cyberbullying item through technology in relation to their work context. The response
options were ‘never’, ‘now and then’, ‘at least monthly’, ‘at least weekly’ and ‘daily’. After
completing the cyberbullying items, respondents were presented with the refined workplace
cyberbullying definition. They were then asked ‘Using this above definition, please state
whether you have been cyberbullied at work over the last six months?’ The response
categories were ‘No’, ‘Yes, now and then’, ‘Yes, monthly’, ‘Yes, weekly’ and ‘Yes, almost
daily’. A combination of behavioural items with a self-report definition question is
recommended as this allows analysis of respondents who self-label as victims, as well as
exposure to bullying behaviours (Nielsen, et al., 2010). Furthermore, a self-labelling
definition item should be included after behavioural items to ensure that the power imbalance
criterion has been met. In the above definition this refers to the targets inability to defend
themselves, which could arise from formal and informal power differences (Branch, Ramsay
& Barker, 2013).
Analysis of the self-report item revealed that only two respondents (0.5%) felt they
were cyberbullying victims on a daily basis, while six (1.4%) felt victimised on a weekly
basis. The self-report item was strongly correlated with the 34-item scale (r = .55, p<.001)
which suggests that individuals who experience more cyberbullying behaviours more
regularly, also tend to perceive a power imbalance between themselves and the perpetrator(s)
victims. Spearman’s correlation was used for this analysis given the ordinal level response
options to the self-report item.

DEVELOPMENT OF A WORKPLACE CYBERBULLYING MEASURE
17
It is important to establish that a strong correlation exists between the self-report item
and the behavioural scale if researchers intend to use the scale as a cyberbullying measure.
This is because the self-report item measures the power disparity element of the construct
which is not captured by the behavioural scale. The self-report item was not used for any
further analysis as the aim of this study was to determine the factor structure and reliability of
the behavioural items.
Data were assessed for missing values, outliers and normality. The distribution of the
cyberbullying scale (M = 1.45, SD = .37) was non-normally distributed, with a positive skew
of 1.49 (SE = .12) and a kurtosis of 2.59 (SE = .24). Positive skew was expected as similar
constructs display comparable distributions (Baillien, Rodriguez-Munoz, Van den Broeck &
De Witte, 2011; Weatherbee, 2007). An initial examination demonstrated that the scale was
highly reliable (α = .94). Correlated item totals were also examined to determine whether
inconsistent items could be removed from the measure. Kim and Mueller (1978) suggest
removing items correlating below the .4 level. On this basis, four items were removed.
Before conducting factor analyses, similar to Einarsen et al. (2009) in their analysis
of the NAQ, the ‘at least weekly’ and ‘daily’ categories were collapsed into in a single
response category because the latter category was rarely selected. Further, as recommended
by Hinkin (1998) if the sample size is sufficiently large (n > 400) data can be split in half,
with exploratory factor analysis (EFA) performed on one half and confirmatory factor
analysis (CFA) on the other. Researchers maintain the value of using this approach;
Worthington and Whittaker (2006) state that exploratory methods are able to capture the
correct factor model in most cases and the hypothesised factor structure should be replicated
on a separate sample. Similarly, Kim, Egan and Tolson (2015) suggest that using both EFA
and CFA can produce more accurate measurement.
DEVELOPMENT OF A WORKPLACE CYBERBULLYING MEASURE
18
Principal axis factoring with oblique rotation was performed on the remaining 30
WCM items. Overall, as the communalities after extraction were below an average of .7 and
the sample size was lower than 250, a scree plot was used to determine the number of factors
to extract (Field, 2009). The scree plot revealed two salient factors and to aid interpretation
the EFA was respecified to force a two-factor solution. Two items with communalities after
extraction of below .3 were removed due to their lack of shared variance and two further
items were then removed because the difference in their loadings across factors was less than
.15 from the higher loading factor (Worthington & Whittaker, 2006). After removal of these
items the EFA was re-specified for the remaining 26 indicators. This analysis was originally
conducted in SPSS, although sensitivity analysis conducted using Mplus confirmed that the
results were the same regardless of the statistical package used.
The Kaiser-Meyer-Olkin measure verified the sampling adequacy, KMO = .91 and
all KMO values for individual items were > .82, above the acceptable limit of .5 (Field,
2009). All 26 items achieved factor loadings of .40 or greater (Table 1), and the two factor
structure seemed to represent constructs of work-related cyberbullying (involving acts related
to an individual’s working experience) and person-related cyberbullying (encompassing acts
of a more personal nature). This structure is theoretically similar to the one underlying
traditional workplace bullying (Einarsen et al, 2009).
Table 1 Here
A CFA was performed to cross-validate the two-factor cyberbullying solution using
Mplus version 7. An MLM estimator was selected which provides maximum likelihood
parameter estimates with standard errors and a mean-adjusted chi-square to account for non-
normality (Satorra, 2000). The model was assessed using absolute and incremental fit indices
(Hu & Bentler, 1999), including the chi-square statistic, the comparative fit index (CFI), the
DEVELOPMENT OF A WORKPLACE CYBERBULLYING MEASURE
19
standardised root-mean-square residual (SRMR) and the root-mean-square error of
approximation (RMSEA).
The chi-square test of exact fit provides an indication of the difference between the
observed covariance matrix and the model covariance matrix. It is often used to evaluate
model fit, however it is influenced by sample size, data non-normality and model complexity
and thus alternative fit indices are generally preferred (Garrido, Abad & Ponsoda, 2016). The
CFI is a measure of incremental fit that assesses the degree to which the specified model is
superior to the null model. Values greater than 0.90 can be considered favourable and values
≥ .95 indicate good fit (Hu & Bentler, 1999). The RMSEA is a measure of absolute fit, which
is sensitive to model complexity, values lower than .08 and .05 indicate reasonable and close
fit, respectively (Garrido et al, 2016). Finally, the SRMR indicates the “standardized
difference between the observed and model-implied covariance/correlation matrices”
(Garrido et al, 2016, p. 96), values greater than .08 indicate a poorly fitted model.
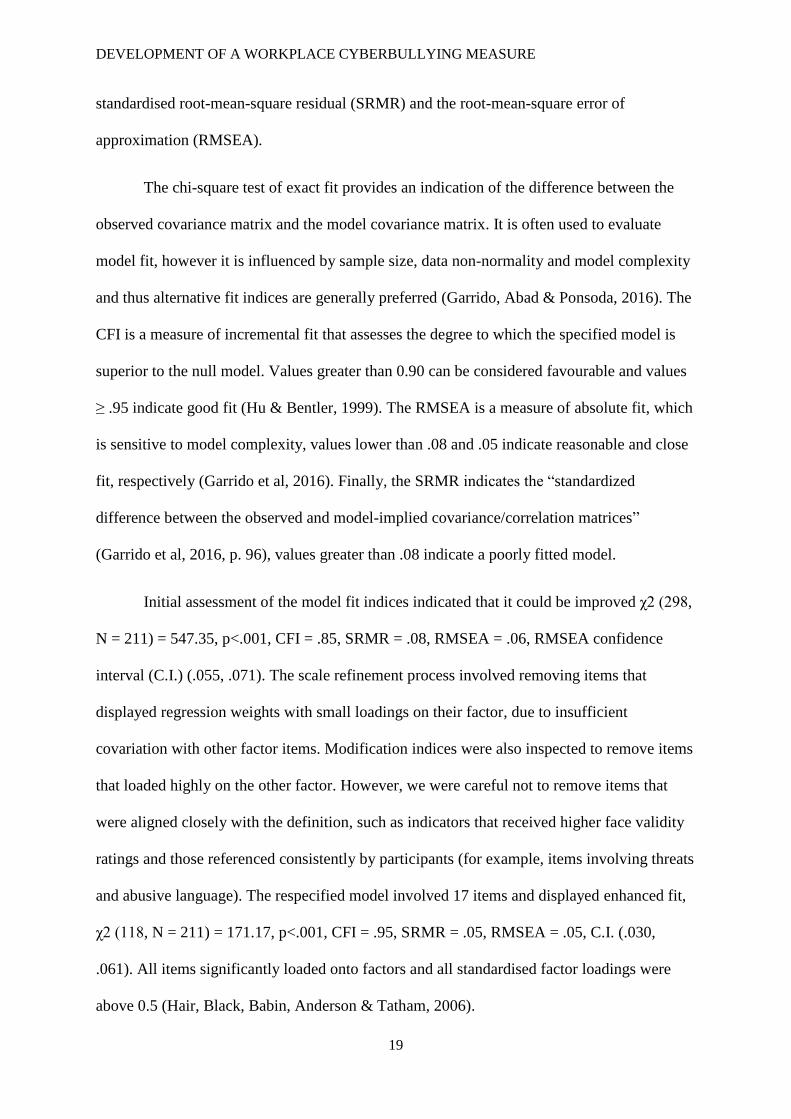
Initial assessment of the model fit indices indicated that it could be improved χ2 (298,
N = 211) = 547.35, p<.001, CFI = .85, SRMR = .08, RMSEA = .06, RMSEA confidence
interval (C.I.) (.055, .071). The scale refinement process involved removing items that
displayed regression weights with small loadings on their factor, due to insufficient
covariation with other factor items. Modification indices were also inspected to remove items
that loaded highly on the other factor. However, we were careful not to remove items that
were aligned closely with the definition, such as indicators that received higher face validity
ratings and those referenced consistently by participants (for example, items involving threats
and abusive language). The respecified model involved 17 items and displayed enhanced fit,
χ2 (118, N = 211) = 171.17, p<.001, CFI = .95, SRMR = .05, RMSEA = .05, C.I. (.030,
.061). All items significantly loaded onto factors and all standardised factor loadings were
above 0.5 (Hair, Black, Babin, Anderson & Tatham, 2006).
DEVELOPMENT OF A WORKPLACE CYBERBULLYING MEASURE
20
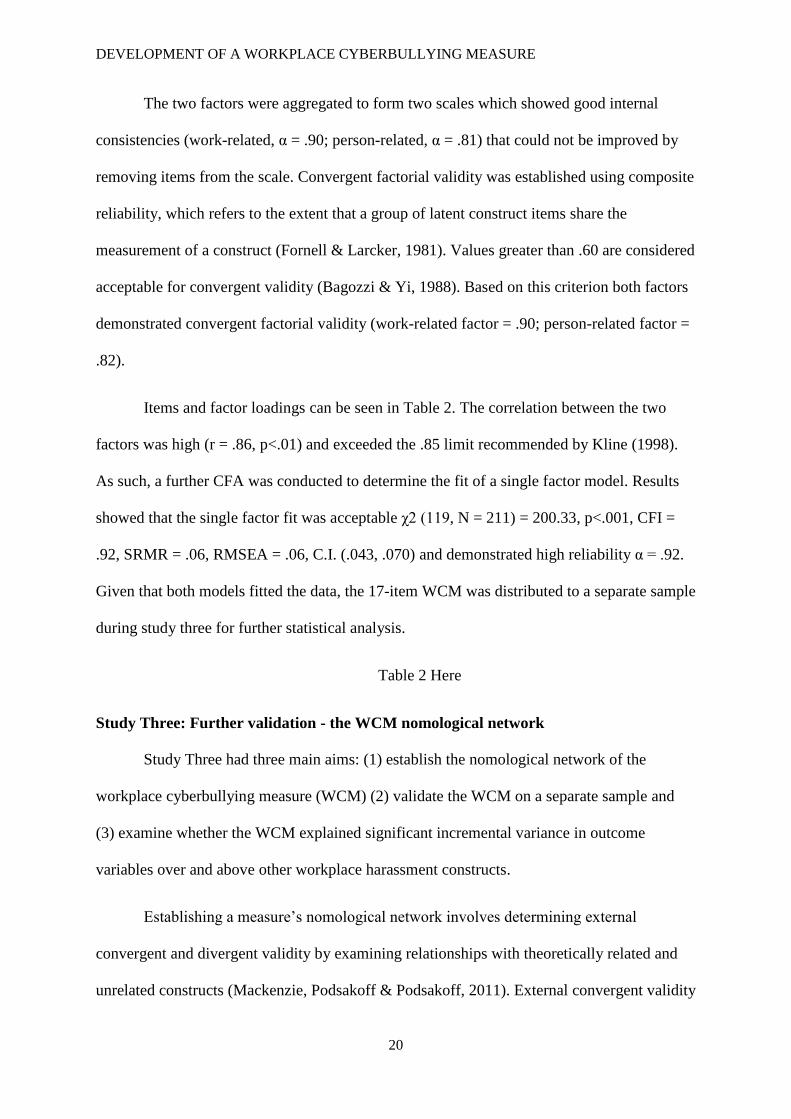
The two factors were aggregated to form two scales which showed good internal
consistencies (work-related, α = .90; person-related, α = .81) that could not be improved by
removing items from the scale. Convergent factorial validity was established using composite
reliability, which refers to the extent that a group of latent construct items share the
measurement of a construct (Fornell & Larcker, 1981). Values greater than .60 are considered
acceptable for convergent validity (Bagozzi & Yi, 1988). Based on this criterion both factors
demonstrated convergent factorial validity (work-related factor = .90; person-related factor =
.82).
Items and factor loadings can be seen in Table 2. The correlation between the two
factors was high (r = .86, p<.01) and exceeded the .85 limit recommended by Kline (1998).
As such, a further CFA was conducted to determine the fit of a single factor model. Results
showed that the single factor fit was acceptable χ2 (119, N = 211) = 200.33, p<.001, CFI =
.92, SRMR = .06, RMSEA = .06, C.I. (.043, .070) and demonstrated high reliability α = .92.
Given that both models fitted the data, the 17-item WCM was distributed to a separate sample
during study three for further statistical analysis.
Table 2 Here
Study Three: Further validation - the WCM nomological network
Study Three had three main aims: (1) establish the nomological network of the
workplace cyberbullying measure (WCM) (2) validate the WCM on a separate sample and
(3) examine whether the WCM explained significant incremental variance in outcome
variables over and above other workplace harassment constructs.
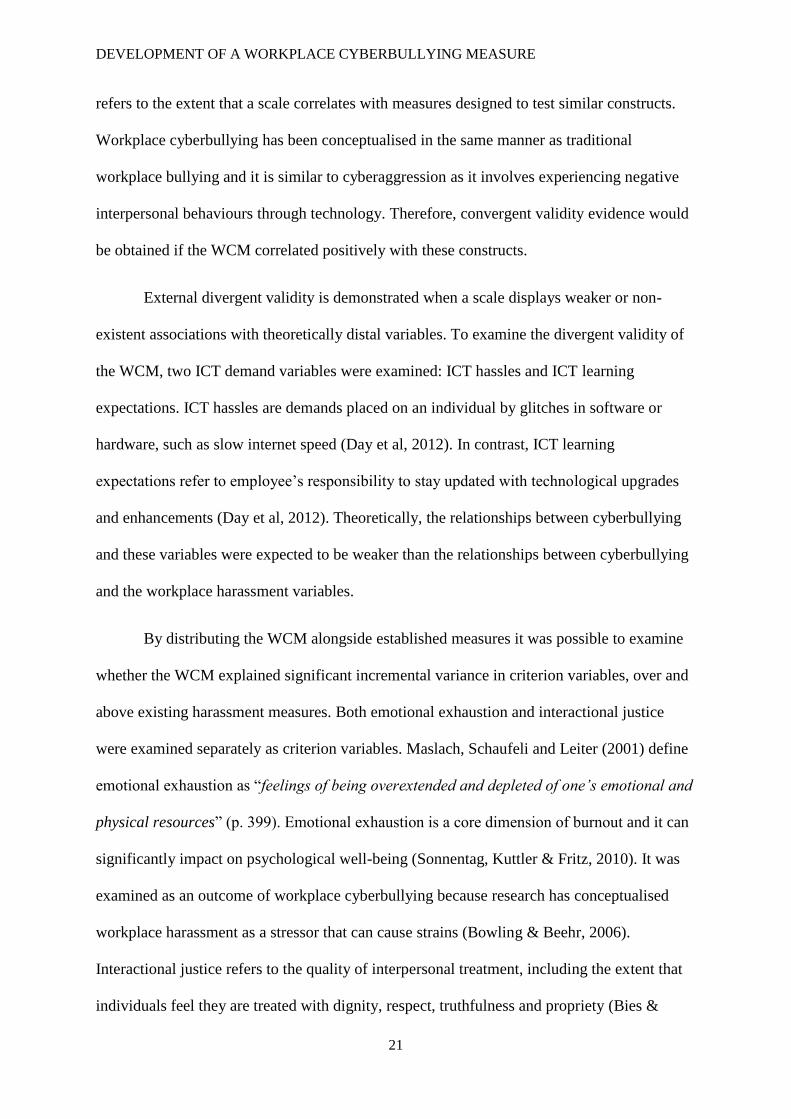
Establishing a measure’s nomological network involves determining external
convergent and divergent validity by examining relationships with theoretically related and
unrelated constructs (Mackenzie, Podsakoff & Podsakoff, 2011). External convergent validity
DEVELOPMENT OF A WORKPLACE CYBERBULLYING MEASURE
21
refers to the extent that a scale correlates with measures designed to test similar constructs.
Workplace cyberbullying has been conceptualised in the same manner as traditional
workplace bullying and it is similar to cyberaggression as it involves experiencing negative
interpersonal behaviours through technology. Therefore, convergent validity evidence would
be obtained if the WCM correlated positively with these constructs.
External divergent validity is demonstrated when a scale displays weaker or non-
existent associations with theoretically distal variables. To examine the divergent validity of
the WCM, two ICT demand variables were examined: ICT hassles and ICT learning
expectations. ICT hassles are demands placed on an individual by glitches in software or
hardware, such as slow internet speed (Day et al, 2012). In contrast, ICT learning
expectations refer to employee’s responsibility to stay updated with technological upgrades
and enhancements (Day et al, 2012). Theoretically, the relationships between cyberbullying
and these variables were expected to be weaker than the relationships between cyberbullying
and the workplace harassment variables.
By distributing the WCM alongside established measures it was possible to examine
whether the WCM explained significant incremental variance in criterion variables, over and
above existing harassment measures. Both emotional exhaustion and interactional justice
were examined separately as criterion variables. Maslach, Schaufeli and Leiter (2001) define
emotional exhaustion as “feelings of being overextended and depleted of one’s emotional and
physical resources” (p. 399). Emotional exhaustion is a core dimension of burnout and it can
significantly impact on psychological well-being (Sonnentag, Kuttler & Fritz, 2010). It was
examined as an outcome of workplace cyberbullying because research has conceptualised
workplace harassment as a stressor that can cause strains (Bowling & Beehr, 2006).
Interactional justice refers to the quality of interpersonal treatment, including the extent that
individuals feel they are treated with dignity, respect, truthfulness and propriety (Bies &

DEVELOPMENT OF A WORKPLACE CYBERBULLYING MEASURE
22
Moag, 1986). Interactional justice was examined as an outcome variable because researchers
have argued that bullying may cause injustice by destroying employee’s perceptions of a
relatively just world (Parzefall & Salin, 2010).
Sample & Procedure
Data were collected from five sources using an online Qualtrics survey that generated
272 completed responses. The respondents included 19 (7.0%) individuals from the
researcher’s network, 65 (23.9%) employees from a large UK university, 133 (48.9%)
members of JISC mail groups (different groups were contacted from those contacted in
studies 1 and 2), 11 (4%) members of a large higher and further education union and 44
(16.2%) employees in the workforce and education team of a National Health Service (NHS)
hospital. The final sample consisted of 185 (68%) females and 87 (32%) males. They were
aged between 16 and 83 (M = 43 years, SD = 11.47) and held job roles including professor,
lawyer and nurse. Their average organisational tenure was 8.80 years (SD = 8.51).
Measurement
Workplace Cyberbullying. The revised 17-item WCM assessed respondent’s exposure to
cyberbullying over the previous six months. The response categories ‘at least weekly’ and
‘daily’ categories were again collapsed prior to statistical analysis. The internal consistency
of the 17-item scale was 0.93. As used in Study Two, a separate single-item measured self-
labelled cyberbullying.
Traditional workplace bullying was measured using the 9-item negative acts questionnaire
short (“S-NAQ”, Notelaers & Einarsen, 2008). Respondents indicated how often they had
experienced bullying behaviours including gossip, exclusion and insults on a five-point scale
ranging from ‘Never’ to ‘Daily’ (α=0.89). To ensure that respondents knew these behaviours

DEVELOPMENT OF A WORKPLACE CYBERBULLYING MEASURE
23
referred to face-to-face acts, a statement was added prior to the scale which stated that items
referred to offline behaviours and not acts conducted through technology.
Cyberaggression was assessed using an 8-item measure developed by Weatherbee (2007).
The scale measures aggression experienced through email or instant messaging (e.g. “During
the last 6 months, have you ever received e-mail or instant messages from a subordinate, a
coworker, or a supervisor that you would describe as hostile towards you?”). Responses were
made on a seven-point scale ranging from ‘Never’ to ‘Very frequently’ (α=.95).
ICT hassles and ICT learning expectations were measured using separate factors of Day et
al’s (2012) ICT demands measure. ICT hassles were measured using five items that assess
common hassles people experience when using ICTs (e.g. ‘my computer freezes’). The alpha
of this scale was 0.79. ICT learning expectations were measured using three items which
measure the extent that respondents are expected to stay current with ICTs at work (α=.72).
The response category of both scales was ‘Never’, ‘Infrequently’, ‘Sometimes’, ‘Frequently’
and ‘Almost Always’.
Emotional exhaustion was measured using three items from the Maslach Burnout Inventory
(Carlson, Anson & Thomas, 2003; Maslach & Jackson, 1981). Respondents were asked how
often they felt emotionally exhausted on a seven-point scale ranging from ‘Never’ to ‘Daily’
(α=.90).
Interactional justice was measured using three items developed by Bies and Moag (1986)
which measures the extent that participants feel treated with dignity and respect at work, such
as ‘At work I am treated in a polite manner’. The response category was: ‘very slightly’, ‘not
at all’, ‘a little’, ‘moderately’, ‘quite a bit’ and, ‘extremely’ (α= .96).
Prior to conducting correlation and regression analysis, the distribution of all variables
were examined. The workplace cyberbullying (M = 1.60, SD = .49) variable was positively
DEVELOPMENT OF A WORKPLACE CYBERBULLYING MEASURE
24
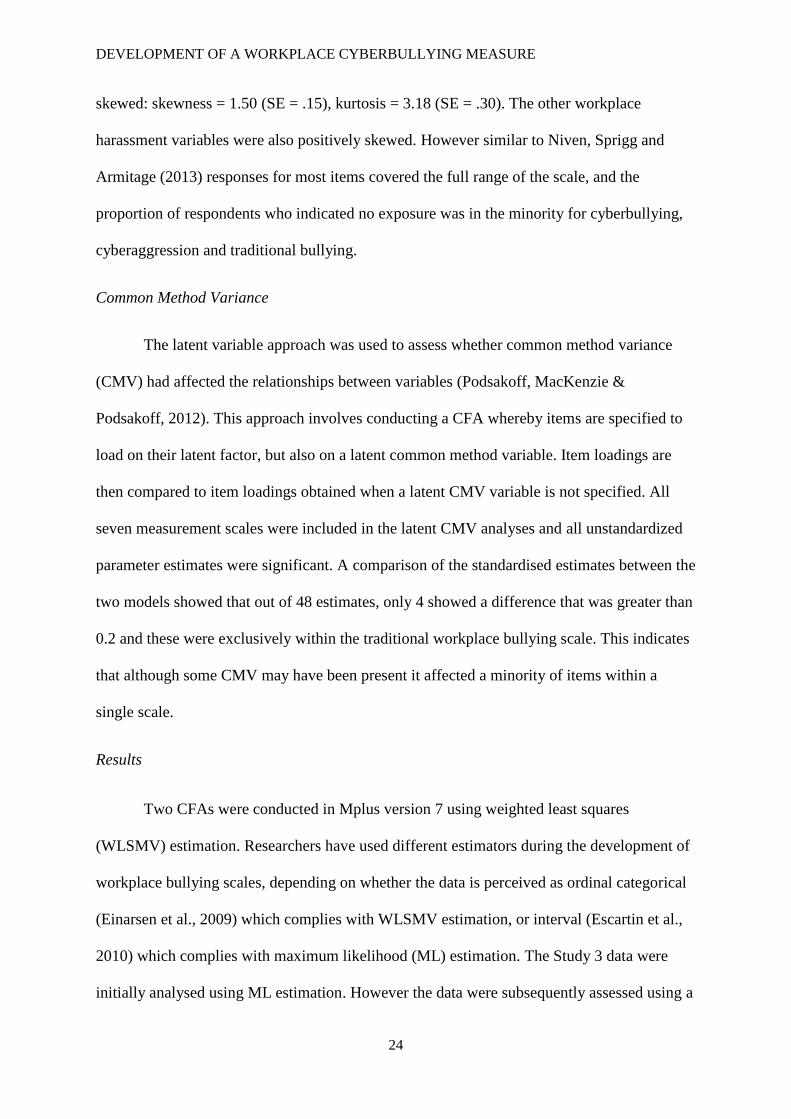
skewed: skewness = 1.50 (SE = .15), kurtosis = 3.18 (SE = .30). The other workplace
harassment variables were also positively skewed. However similar to Niven, Sprigg and
Armitage (2013) responses for most items covered the full range of the scale, and the
proportion of respondents who indicated no exposure was in the minority for cyberbullying,
cyberaggression and traditional bullying.
Common Method Variance
The latent variable approach was used to assess whether common method variance
(CMV) had affected the relationships between variables (Podsakoff, MacKenzie &
Podsakoff, 2012). This approach involves conducting a CFA whereby items are specified to
load on their latent factor, but also on a latent common method variable. Item loadings are
then compared to item loadings obtained when a latent CMV variable is not specified. All
seven measurement scales were included in the latent CMV analyses and all unstandardized
parameter estimates were significant. A comparison of the standardised estimates between the
two models showed that out of 48 estimates, only 4 showed a difference that was greater than
0.2 and these were exclusively within the traditional workplace bullying scale. This indicates
that although some CMV may have been present it affected a minority of items within a
single scale.
Results
Two CFAs were conducted in Mplus version 7 using weighted least squares
(WLSMV) estimation. Researchers have used different estimators during the development of
workplace bullying scales, depending on whether the data is perceived as ordinal categorical
(Einarsen et al., 2009) which complies with WLSMV estimation, or interval (Escartin et al.,
2010) which complies with maximum likelihood (ML) estimation. The Study 3 data were
initially analysed using ML estimation. However the data were subsequently assessed using a

DEVELOPMENT OF A WORKPLACE CYBERBULLYING MEASURE
25
WLSMV estimator as the nonnormality that results from skewed response distributions can
considerably influence commonly used fit indices when ML is adopted (Nye & Drasgow,
2011). It was not possible to analyse the Study 2 data using WLSMV as item retention
decisions had been made based upon the initial ML estimation results.
It should be noted that using statistical rules of thumb to evaluate model fit is not
recommended in all scenarios. Nye and Drasgow (2011) found that the statistical criteria used
to evaluate ML model fit are not necessarily appropriate when WLSMV estimation is
adopted. Indeed, they suggest that using statistical cut-offs should not be conducted without
considering the characteristics of the data, including sample size, normality and model
misspecification. Thus it is important to consider other aspect of the model when evaluating
fit and to account for theory when evaluating the factor structure (Nye, Brummel & Drasgow,
2014).
The two-factor model comprising work-related and person related cyberbullying
demonstrated relatively good fit: χ2 (118, N = 266) = 307.38, p<.001, CFI = .97, WRMR =
1.12, RMSEA = .08, C.I. (.067, .088). The competing single factor model was also specified
which produced similar fit indices: χ2 (119, N = 266) = 366.90, p<.001, CFI = .96, WRMR =
1.26, RMSEA = .09, C.I. (.078, .099). Similar to Study 2, the correlation between the latent
factors was very high (.87) and factor loadings were all significant and greater than .6 for the
single factor model. Therefore, the one dimensional model seemed more appropriate. There is
also a theoretical rationale for treating cyberbullying as a unidimensional construct, at least
during the early stages of workplace cyberbullying research. The development of a
unidimensional measure facilitates research on meaningful preliminary questions, for
instance do cyberbullying and traditional bullying relate in the same way to outcomes.
Researchers also tend to assess bullying as a unidimensional construct, rather than conducting
analysis on separate factors (Notelaers, Baillien, De Witte, Einarsen & Vermunt, 2013)

DEVELOPMENT OF A WORKPLACE CYBERBULLYING MEASURE
26
perhaps because it gives a better indication of the overall level of bullying experienced.
Further analysis was therefore conducted using the WCM as a single factor measure.
Confirmatory factor analysis was conducted to assess the harassment constructs. A
three factor model was initially specified, in which cyberbullying, cyberaggression and
traditional workplace bullying loaded onto separate factors χ2 (524, N = 263) = 1093.94,
p<.001, CFI = .97, WRMR = 1.27, RMSEA = .06, C.I. (.059, .070). The model was
compared to a two-factor model where cyberbullying and cyberaggression loaded on one
factor and traditional bullying loaded on the other χ2 (526, N = 263) = 1380.87, p<.001, CFI
= .95, WRMR = 1.52, RMSEA = .08, C.I. (.074, .084). It was also compared to a one-factor
model in which all items loaded onto a single factor χ2 (527, N = 263) = 1576.02, p<.001,
CFI = .94, WRMR = 1.67, RMSEA = .09, C.I. (.082, .092). The three factor model displays
superior fit to the two-factor and the one factor models, providing support for the construct
validity of the WCM.
To assess convergent validity, the WCM was compared with traditional workplace
bullying and cyberaggression. As shown by Table 3, convergent validity was established
because the WCM was strongly correlated with traditional workplace bullying (r = .74,
p<.01) and cyberaggression (r = .75, p<.01) (values of .10, .30 and .50 denote small, medium
and large effect size respectively; Cohen, 1988). Further support for convergent validity was
found as experiencing workplace cyberbullying behaviours was significantly correlated with
self-labelling as a cyberbullying victim (r = .48, p<.01; Spearman’s correlation).
Comparatively, the correlation between experiencing traditional (face-to-face) bullying
behaviours and self-labelling as a cyberbullying victim was lower, but also significant (r =
.36, p<.01; Spearman’s correlation). Steiger’s (1980) z-test was used to statistically compare
the size of the correlation between (1) experiencing cyberbullying behaviours and self-
labelling as a cyberbullying victim, compared to (2) experiencing traditional bullying

DEVELOPMENT OF A WORKPLACE CYBERBULLYING MEASURE
27
behaviours and self-labelling as a cyberbullying victim. The z-test revealed that the
correlation between the WCM and self-labelling as a cyberbullying victim was significantly
stronger that the correlation between experiencing traditional workplace bullying behaviours
and self-labelling (z = 2.6, p<.01). It should also be noted here that only four (1.5%)
participants perceived themselves as cyberbullying victims on either a weekly or daily basis.
A further z-test revealed no significant difference in the correlations between (1) the WCM
and self-labelling, compared with (2) cyberaggression and self-labelling (z = .26, p = 0.79).
Furthermore, cyberbullying was positively correlated with ICT learning expectations (r = .30
p<.01) and ICT hassles (r = .21, p<.01). As expected, these correlations were smaller than
those observed between cyberbullying and the harassment variables which provides
discriminant validity evidence.
Table 3 Here
To examine whether the WCM accounted for incremental variance over traditional
workplace bullying and cyberaggression, two hierarchical regressions were conducted with
emotional exhaustion and interactional justice as outcome variables. Demographic variables
were not included as covariates because they did not display significant correlations with any
of the test variables. However, given that the data were comprised of several different
samples, the data collection stream was added as a covariate to filter out any variance that
could be attributed to a particular sample. In each regression, the sample variable was added
in the first step, traditional workplace bullying was added in the second step, cyberaggression
was added in the third step and cyberbullying was added in the final step. Table 4 shows that
workplace cyberbullying accounted for a small, but significant amount of incremental
variance in emotional exhaustion after controlling for traditional workplace bullying and
cyberaggression (R² change = .018, p<.05). Cohen’s f2 was .021, f2 effect sizes of .02 are
considered small, while those around .15 and .30 are considered medium and large

DEVELOPMENT OF A WORKPLACE CYBERBULLYING MEASURE
28
respectively (Cohen, 1988). Cyberbullying did not account for significant incremental
variance in interactional justice when entered after the aforementioned variables (R² = .006, p
= .12).
Table 4 Here
Discussion
In this study we conceptualised cyberbullying using the same criteria used to define
traditional workplace bullying: repeated exposure to negative acts and a power disparity
between perpetrator(s) and victim. New scales are needed to measure workplace
cyberbullying as existing tools either lack construct validity (e.g. cyber incivility scales) or
they lack content validity as they do not tap cyber-specific behaviours (e.g. the cyber NAQ).
We therefore aimed to fulfil the need for a workplace cyberbullying measure by developing a
scale with sufficient construct and content validity to assess exposure to cyberbullying across
working populations. Evidence for the reliability and validity of the 17-item WCM was
established during three studies involving 944 participants. Confirmatory factor analyses
provided evidence for the validity of a single factor model and also a two-factor model
comprising work-related cyberbullying and person-related bullying. Given the substantial
correlation between the two factors and the minimal difference in fit for both models, we
chose to adopt the single factor model.
The WCM is comprised of 17 behavioural items that assess exposure to negative
work-related acts experienced through technology and a self-report definition item that
captures the power disparity criterion. Nielsen et al (2010) note that behavioural inventories
alone do not assess whether respondents perceive a power imbalance between themselves and
the perpetrator, which is a key element of the theoretical definition. In cyberbullying
contexts, there are a multitude of factors that may produce a perceived power imbalance,

DEVELOPMENT OF A WORKPLACE CYBERBULLYING MEASURE
29
including the time and location a target is contacted by the perpetrator, a divergence in
technological ability and perpetrator anonymity. Hence, it is important to include the self-
report item when administering the WCM, because it can capture the various ways that
respondents may feel powerless compared with the perpetrator. In this respect, we contend
that the correlation between the behavioural scale and the self-report item can be used as a
validation check: higher correlations confirm that respondents who experience more
behaviours more frequently also tend to perceive themselves as being less capable of
defending themselves. Furthermore, it should be noted that the power criterion was
congenital in the development of the 17 items. The theoretical definition (which includes the
notion of power) was used to generate the behavioural descriptions, it was also used by SMEs
to evaluate face validity and a significant positive relationship was observed between the
behavioural scale and the self-report definition item.
The nomological network of the WCM was established as its pattern of
intercorrelations with a wide range of variables conformed to expectations. The WCM was
highly correlated with traditional bullying which was unsurprising given similarities in
conceptualisation. The WCM also correlated strongly with cyberaggression, which conforms
to logic as one would expect cyberbullying victims to encounter cyberaggression. Whilst
some of the study results suggest that traditional bullying and cyberbullying represent
identical constructs, other analyses suggest that cyberbullying has predictive value over and
above traditional bullying.
The WCM explained a small, but significant amount of incremental variance in
emotional exhaustion over and above the other harassment variables. One potential
explanation for this finding is that cyberbullying spans time and space boundaries, which
means that employees may be exposed to cyberbullying outside of their working hours. This
may in turn prevent psychological detachment and recovery from work, which is negatively

DEVELOPMENT OF A WORKPLACE CYBERBULLYING MEASURE
30
associated with emotional exhaustion (Sonnentag et al., 2010). However, researchers have
suggested other reasons why cyberbullying may explain additional variance in outcomes.
Coyne et al. (2016) suggest that the boundaryless nature of cyberbullying may lead to a more
severe impact because cyberbullying acts can quickly be distributed to everyone within an
organisation. Furthermore, Ford (2013) found that perpetrator anonymity amplified the
association between virtual harassment and fear of future harassment. The value of the WCM
lies in its ability to investigate whether these unique features moderate the relationship
between cyberbullying and outcomes. Olweus (2012) contends that systematic efforts are
needed to determine whether the unique features of cyberbullying actually influence target
reactions, or whether these differences have relatively little effect over and above traditional
bullying. The WCM can help answer such questions, as well as others concerning prevalence,
duration and risk groups.
The current study contributes to the workplace bullying literature by fulfilling the
need for a cyberbullying measure that is relevant to the context of work. Researchers can now
utilise the WCM rather than adapting traditional bullying measures or using scales developed
to assess other cyber harassment constructs. The WCM is broader than existing cyber
harassment scales because it assesses behaviours experienced through various technologies
that individuals use in relation to their work, rather than through a specific medium. The
WCM can therefore obtain a more complete picture of cyberbullying experiences and it is
more resilient to technological developments because items do not reference specific media
that could become outdated in future years. The measure also provides researchers with a
homogenous method of assessing workplace cyberbullying, which allows for comparisons
across studies and samples. Finally, Bowling et al (2015) suggest that multiple measures are
needed for each form of workplace abuse as this enables a greater understanding of a
phenomenon at the construct level.

DEVELOPMENT OF A WORKPLACE CYBERBULLYING MEASURE
31
Practical Applications
The WCM provides organisations with a list of indicators that employees find
unacceptable which can aid the establishment of policies and avoid confusion regarding
normal practise. In a study that detailed an update to their workplace bullying checklist (WB-
C), Fox and Cowan (2015) state that human resources professionals (HRPs) can use the
information at their disposal to create organisational training on what constitutes bullying.
West et al. (2014) found that one problem facing HRPs is the difficulty of developing policies
for cyberbullying because it is not well defined. As such, the definition and indicators of
workplace cyberbullying developed during this study can be used to establish policies and
guidelines. The self-labelling item could also be combined with the behavioural scale to
create a four-by-four matrix that allows organisations to determine the level of cyberbullying
among the workforce. If a notable proportion of staff consistently report high behavioural
exposure, organisational-level interventions should be implemented, especially if high self-
labelling is reported in conjunction.
When administering the scale, practitioners should consider the response format. In
this study the ‘at least weekly’ and ‘daily’ categories were collapsed as the latter was rarely
selected, indicating that the daily category may be redundant. However, research is needed to
determine the average duration of cyberbullying cases. Unlike traditional workplace bullying
cases, organisational outsiders can perpetrate cyberbullying more easily, which could produce
shorter-lived experiences. Neall and Tuckey (2014) recommend assessing the perpetrator of
harassment when using bullying measures. This would allow administrators of the WCM to
identify whether it has come from within or outside the organisation. Practitioners should also
consider how to ensure the pre-item instructions have been read and understood. One option
in this regard would be a tick box that respondents check to confirm the instructions have
been understood.
DEVELOPMENT OF A WORKPLACE CYBERBULLYING MEASURE
32
Study Limitations
Self-report data were used to construct and validate the measure. This may have
caused respondents to either under report or over report their exposure to workplace
cyberbullying behaviours. Critics of the self-report methodology state that participants may
respond in a socially desirable manner rather than in the way that best reflects their
experiences and opinions. Therefore some individuals may have underreported their exposed
to cyberbullying as acknowledgement of victimisation could prompt feelings of vulnerability
(van Beest & Williams, 2006). Attempts were made to reduce the risk of common method
bias as the anonymous treatment of study results was outlined and participants were clearly
advised that they could withdraw from the research at any time (Conway & Lance, 2010).
Second, because we aimed to create a measure that would be resilient to changes in
technology, medium specific items were eliminated. This limits the scale because it does not
allow discrimination between communications media, which have different characteristics
that could affect a cyberbullying experience. Similarly, it could be argued that the WCM does
not capture certain features that underpin certain cyberbullying experiences, such as
anonymity and visibility. However, given that these features fall outside the definitional
parameters of the construct it may actually be more appropriate to examine them as
antecedents or moderators of workplace cyberbullying. For example, anonymity could be a
causal factor in cyberbullying perceptions. Indeed, the WCM may be combined with other
measures to investigate how specific features of cyberbullying affect employees. For
instance, Ford (2013) investigated the unique aspects of virtual harassment by using a general
cyberaggression measure combined with separate measures that assessed anonymity, location
and media richness.
DEVELOPMENT OF A WORKPLACE CYBERBULLYING MEASURE
33
A further limitation concerns the estimation methods used to evaluate model fit
across the studies. ML estimation was employed during Study 2, whereas WLSMV
estimation was used during Study 3. Einarsen et al (2009) used WLS estimation to analyse
the factor structure of the NAQ as they suggested that the response categories were ordinal
rather than interval. However, other researchers have used a maximum likelihood estimator
during the development of bullying scales, which is more compatible with continuous data
(Escartin et al., 2010). This disparity reflects an ongoing debate in scale research which
concerns whether Likert scale data should be treated as ordinal data or interval data (Norman,
2010). Since the response scale of the WCM is not strictly equal, WLSMV estimation is
arguably a more appropriate estimator, especially given the measure’s distribution. However
during Study 2 ML estimation was employed which influenced retention decisions. Therefore
it should be noted that the number of items retained may have been different if WLSMV
estimation had been used in Study 2.
Conclusion
In response for arguments stating that different types of bullying should be
investigated and evaluated differently (Hoel et al, 2004; Escartin et al, 2010) this study
developed a workplace cyberbullying measure. Systematic research is needed to determine
differences between traditional bullying and cyberbullying, and whether the development of
the latter construct adds value. We hope that the WCM can prove a useful tool during this
endeavour.
Acknowledgements: We would like to thank the anonymous reviewers who provided
valuable feedback that improved this article. We would also like to thank Felicity Lawrence
for helping to administer the Study One survey within the APS.

DEVELOPMENT OF A WORKPLACE CYBERBULLYING MEASURE
34
References
Anderson, L. M., & Pearson, C. M. (1999). Tit for tat? The spiraling effects of incivility in the
workplace. Academy of Management Review, 24(3), 452–471.
Bagozzi, R. P., & Yi, Y. (1988). On the evaluation of structural equation models. Journal of
the Academy of Marketing Science, 16(1), 74-94.
Baillien, E., Rodriguez-Munoz, A., Van den Broeck, A., & De Witte, H. (2011). Do demands
and resources affect target's and perpetrators' reports of workplace bullying? A two-wave
cross-lagged study. Work & Stress, 25(2), 128-146.
Baruch, Y. (2005). Bullying on the net: Adverse behavior on e-mail and its
impact. Information & Management, 42(2), 361-371.
Bies, R., & Moag, J. (1986). Interactional justice: Communication criteria of fairness. In R. J
Lewicki, B. H. Sheppard., M. H. Bazerman (Eds.), Research on negotiations in
organizations. 1st ed. Greenwich, CT: JAI Press (pp. 43-55).
Bowling, N. A., & Beehr, T. A. (2006). Workplace harassment from the victim's perspective: a
theoretical model and meta-analysis. Journal of Applied Psychology, 91(5), 998-1012.
Bowling, N. A., Camus, K. A., & Blackmore, C. E. (2015). Conceptualizing and measuring
workplace abuse: Implications for the study of abuse’s predictors and consequences.
In Mistreatment in organizations (pp. 225-263). Emerald Group Publishing Limited.
Branch, S., Ramsay, S., & Barker, M. (2013). Workplace bullying, mobbing and general
harassment: A review. International Journal of Management Reviews, 15(3), 280-299.
Carlson, J. R., Anson, R. H., & Thomas, G. (2003). Correctional officer burnout and stress:
does gender matter?. The Prison Journal, 83(3), 277-288.
DEVELOPMENT OF A WORKPLACE CYBERBULLYING MEASURE
35
Cohen, J. (1988). Statistical power analysis for the behavioral sciences (2nd ed.). Hillsdale,
NJ: Lawrence Erlbaum Associates.
Conway, J. M., & Lance, C. E. (2010). What reviewers should expect from authors regarding
common method bias in organizational research. Journal of Business and Psychology,
25(3), 325–334.
Coyne, I., Farley, S., Axtell, C., Sprigg, C., Best, L & Kwok, O. Workplace cyberbullying,
employee mental strain and job satisfaction: A dysempowerment perspective.
International Journal of Human Resource Management, published online ahead of print
26th Feb 2016, 1-28.
Daft, R. L., & Lengel, R. H. (1986). Organizational information requirements, media richness
and structural design. Management Science, 32(5), 554-571.
Day, A., Paquet, S., Scott, N., & Hambley, L. (2012). Perceived information and
communication technology (ICT) demands on employee outcomes: The moderating
effect of organizational ICT support. Journal of Occupational Health Psychology, 17(4),
473-491.
D'cruz, P., & Noronha, E. (2013). Navigating the extended reach: Target experiences of
cyberbullying at work. Information and Organization, 23(4), 324-343.
Doane, A. N., Kelley, M. L., Chiang, E. S., & Padilla, M. A. (2013). Development of the
cyberbullying experiences survey. Emerging Adulthood, 1(3), 207–218.
Dooley, J. J., Pyzalski, J., & Cross, D. (2009). Cyberbullying versus face-to-face bullying: A
theoretical and conceptual review. Zeitschrift für Psychologie/Journal of Psychology,
217(4), 182–188.

DEVELOPMENT OF A WORKPLACE CYBERBULLYING MEASURE
36
Einarsen, S. (2000). Harassment and bullying at work: A review of the Scandinavian approach.
Aggression and Violent Behaviour: A Review Journal, 5(4), 371–401
Einarsen, S., Hoel, H., & Notelaers, G. (2009). Measuring exposure to bullying and harassment
at work: Validity, factor structure and psychometric properties of the Negative Acts
Questionnaire-Revised. Work & Stress, 23(1), 24-44.
Einarsen, S., Hoel, H., Zapf, D., & Cooper, C. (2011). Bullying and Harrassment in the
Workplace: Developments in Theory, Research and Practice (No. 2nd ed). Crc Press.
Escartín, J., Rodríguez-Carballeira, Á., Gómez-Benito, J., & Zapf, D. (2010). Development
and validation of the workplace bullying scale EAPA-T. International Journal of
Clinical Health & Psychology, 10, 519-539.
Farley, S., Coyne, I., Sprigg, C., Axtell, C., & Subramanian, G. (2015). Exploring the impact
of workplace cyberbullying on trainee doctors. Medical Education, 49(4), 436-443.
Field, A. (2009). Discovering statistics using SPSS. Sage publications.
Ford, D. P. (2013). Virtual harassment: media characteristics' role in psychological
health. Journal of Managerial Psychology, 28(4), 408-428.
Fornell, C., & Larcker, D. (1981). Structural equation models with unobservable variables and
measurement error: Algebra and statistics. Journal of Marketing Research, 18(3) 382-
388.
Fox, S., & Cowan, R. L. (2015). Revision of the workplace bullying checklist: the importance
of human resource management's role in defining and addressing workplace
bullying. Human Resource Management Journal, 25(1), 116-130.

DEVELOPMENT OF A WORKPLACE CYBERBULLYING MEASURE
37
Garrido, L. E., Abad, F. J., & Ponsoda, V. (2016). Are Fit Indices Really Fit to Estimate the
Number of Factors With Categorical Variables? Some Cautionary Findings via Monte
Carlo Simulation. Psychological Methods, 21(1), 93-111.
Giumetti, G. W., McKibben, E. S., Hatfield, A. L., Schroeder, A. N., & Kowalski, R. M.
(2012). Cyber incivility@ work: The new age of interpersonal deviance.
Cyberpsychology, Behavior, and Social Networking, 15(3), 148-154.
Hair, J. F., Black, B., Babin, B., Anderson, R. E., & Tatham, R. L. (2006). Multivariate data
analysis (Vol. 6). Upper Saddle River, NJ: Pearson Prentice Hall.
Hardesty, D. M., & Bearden, W. O. (2004). The use of expert judges in scale development:
Implications for improving face validity of measures of unobservable constructs. Journal
of Business Research, 57(2), 98-107.
Hershcovis, M. S. (2011). “Incivility, social undermining, bullying… oh my!”: A call to
reconcile constructs within workplace aggression research. Journal of Organizational
Behavior, 32(3), 499-519.
Hinkin, T. R. (1998). A brief tutorial on the development of measures for use in survey
questionnaires. Organizational Research Methods, 1(1), 104-121.
Hoel, H., Faragher, B., & Cooper, C. L. (2004). Bullying is detrimental to health, but all
bullying behaviours are not necessarily equally damaging. British Journal of Guidance
and Counselling, 32(3), 367-387.
Hong, J. C., Chien-Hou, L., Hwang, M. Y., Hu, R. P., & Chen, Y. L. (2014). Positive affect
predicting worker psychological response to cyber-bullying in the high-tech industry in
Northern Taiwan. Computers in Human Behavior, 30, 307-314.
Hu, L., & Bentler, P. M. (1999). Cutoff criteria for fit indexes in covariance structure analysis:
conventional criteria versus new alternatives. Structural Equation Modeling, 6(1), 1–55.

DEVELOPMENT OF A WORKPLACE CYBERBULLYING MEASURE
38
Keller, T., & Dansereau, F. (2001). The effect of adding items to scales: An illustrative case of
LMX. Organizational Research Methods, 4(2), 131-143.
Kim, J., Egan, T., & Tolson, H. (2015). Examining the Dimensions of the Learning
Organization Questionnaire A Review and Critique of Research Utilizing the
DLOQ. Human Resource Development Review, 1-22.
Kim, J. O., & Mueller, C. W. (1978). Introduction to factor analysis: What it is and how to do
it. Beverly Hills, CA: Sage.
Kline, R. (1998). Principles and practice of structural equation modelling. New York:
Guilford.
Kowalski, R. M., Giumetti, G. W., Schroeder, A. N., & Lattanner, M. R. (2014). Bullying in
the Digital Age: A Critical Review and Meta-Analysis of Cyberbullying Research
Among Youth. Psychological Bulletin, 140(4), 1073-1137.
Lichtenstein, D. R., Netemeyer, R. G., & Burton, S. (1990). Distinguishing coupon proneness
from value consciousness: an acquisition-transaction utility theory perspective. The
Journal of Marketing, 54(3), 54-67.
Lim, V. K., & Teo, T. S. (2009). Mind your E-manners: Impact of cyber incivility on
employees’ work attitude and behavior. Information & Management, 46(8), 419-425.
Loevinger, J. (1957). Objective tests as instruments of psychological theory. Psychological
Reports, 3, 635-694.
MacKenzie, S. B., Podsakoff, P. M., & Podsakoff, N. P. (2011). Construct measurement and
validation procedures in MIS and behavioral research: Integrating new and existing
techniques. MIS Quarterly, 35(2), 293-334.
DEVELOPMENT OF A WORKPLACE CYBERBULLYING MEASURE
39
Maslach, C., & Jackson, S. E. (1981). The measurement of experienced burnout. Journal of
Occupational Behavior, 2(2), 99–113.
Maslach, C., Schaufeli, W. B., & Leiter, M. P. (2001). Job burnout. Annual Review of
Psychology, 52(1), 397-422.
Matthiesen, S., & Einarsen, S. (2007). Perpetrators and targets of bullying at work: role stress
and individual differences. Violence and Victims, 22(6), 735-753.
Menesini, E., Nocentini, A., & Calussi, P. (2011). The measurement of cyberbullying:
Dimensional structure and relative item severity and discrimination. Cyberpsychology,
Behavior, and Social Networking, 14(5), 267–274.
Neall, A. M., & Tuckey, M. R. (2014). A methodological review of research on the
antecedents and consequences of workplace harassment. Journal of Occupational and
Organizational Psychology, 87(2), 225-257.
Nielsen, M. B., Matthiesen, S. B., & Einarsen, S. (2010). The impact of methodological
moderators on prevalence rates of workplace bullying. A meta-analysis. Journal of
Occupational and Organizational Psychology, 83(4), 955-979.
Niven, K., Sprigg, C. A., & Armitage, C. J. (2013). Does emotion regulation protect employees
from the negative effects of workplace aggression?. European Journal of Work and
Organizational Psychology, 22(1), 88-106.
Norman, G. (2010). Likert scales, levels of measurement and the “laws” of statistics. Advances
in Health Sciences Education, 15, 625-632.
Notelaers, G., Baillien, E., De Witte, H., Einarsen, S., & Vermunt, J. K. (2013). Testing the
strain hypothesis of the Demand Control Model to explain severe bullying at
work. Economic and Industrial Democracy, 34, 69-87.

DEVELOPMENT OF A WORKPLACE CYBERBULLYING MEASURE
40
Notelaers, G., & Einarsen, S. (2008, June). The construction and validation of the Short -
Negative Acts Questionnaire. Paper presented at 6th International Conference on
Workplace Bullying, Montreal, Canada.
Nye, C. D., Brummel, B. J., & Drasgow, F. (2014). Understanding sexual harassment using
aggregate construct models. Journal of Applied Psychology, 99(6), 1204-1221.
Nye, C. D., & Drasgow, F. (2011). Assessing Goodness of Fit: Simple Rules of Thumb Simply
Do Not Work. Organizational Research Methods, 14, 548-570.
Olweus, D. (2012). Comments on cyberbullying article: A rejoinder. European Journal of
Developmental Psychology, 9(5), 559-568.
Parzefall, M. R., & Salin, D. M. (2010). Perceptions of and reactions to workplace bullying: a
social exchange perspective. Human Relations, 63(6), 761-780.
Podsakoff, P. M., MacKenzie, S. B., & Podsakoff, N. P. (2012). Sources of method bias in
social science research and recommendations on how to control it. Annual Review of
Psychology, 63, 539-569.
Privitera, C., & Campbell, M. A. (2009). Cyberbullying: The new face of workplace
bullying? CyberPsychology & Behavior, 12(4), 395-400.
Satorra, A. (2000). Scaled and adjusted restricted tests in multi-sample analysis of moment
structures. In R. D. H, Heijmans., D.S.G, Pollock., & A, Satorra (Eds.), Innovations in
multivariate statistical analysis. A Festschrift for Heinz Neudecker (pp. 233-247).
London: Kluwer Academic Publishers.
Schat, A. C., & Kelloway, E. K. (2005). Workplace aggression. Handbook of Work Stress,
189-218.

DEVELOPMENT OF A WORKPLACE CYBERBULLYING MEASURE
41
Smith, P. K. (2012). Cyberbullying and cyber aggression. In S. R. Jimerson, A. B. Nickerson,
M. J. Mayer, & M. J. Furlong (Eds.), Handbook of school violence and school safety:
International research and practice (pp. 93–103). New York, NY: Routledge.
Smith, P. K., Mahdavi, J., Carvalho, M., Fisher, S., Russell, S., & Tippett, N. (2008).
Cyberbullying: Its nature and impact in secondary school pupils. Journal of Child
Psychology and Psychiatry, 49(4), 376-385.
Snyman, R., & Loh, J. M. (2015). Cyberbullying at work: The mediating role of optimism
between cyberbullying and job outcomes. Computers in Human Behavior, 53, 161-168.
Sonnentag, S., Kuttler, I., & Fritz, C. (2010). Job stressors, emotional exhaustion, and need for
recovery: A multi-source study on the benefits of psychological detachment. Journal of
Vocational Behavior, 76(3), 355-365.
Spector, P.E. (2014). Survey design and measure development. In T. D. Little (Eds.), The
Oxford Handbook of Quantitative Methods, (pp. 170-188). Oxford University Press.
Steiger, J. H. (1980). Tests for comparing elements of a correlation matrix. Psychological
Bulletin, 87, 245-251.
Tokunaga, R. S. (2010). Following you home from school: A critical review and synthesis of
research on cyberbullying victimization. Computers in Human Behavior, 26(3), 277-287.
van Beest, I., & Williams, K. D. (2006). When inclusion costs and ostracism pays, ostracism
still hurts. Journal of Personality and Social Psychology, 91(5), 918–928.
Weatherbee, T. G. (2007), Cyberaggression in the Workplace: Construct Development,
Operationalization, and Measurement, Sobey’s School of Business, Saint Mary’s
University, Halifax. Willard.
DEVELOPMENT OF A WORKPLACE CYBERBULLYING MEASURE
42
Weatherbee, T. G., & Kelloway, E. K. (2006). A Case of Cyberdeviancy: CyberAggression in
the Workplace. In E. K. Kelloway, J. Barling, & J. J. Hurrell (Eds.), Handbook of
Workplace Violence. (pp. 445−487). Thousand Oaks, CA: Sage Publications, Inc.
West, B., Foster, M., Levin, A., Edmison, J., & Robibero, D. (2014). Cyberbullying at Work:
In Search of Effective Guidance. Laws, 3(3), 598-617.
Worthington, R. L., & Whittaker, T. A. (2006). Scale development research a content analysis
and recommendations for best practices. The Counseling Psychologist, 34(6), 806-838.
Zhang, S., & Leidner, D. (2014, August). Workplace Cyberbullying: The Antecedents and
Consequences. Twentieth Americas Conference on Information Systems, Savannah,
Georgia.
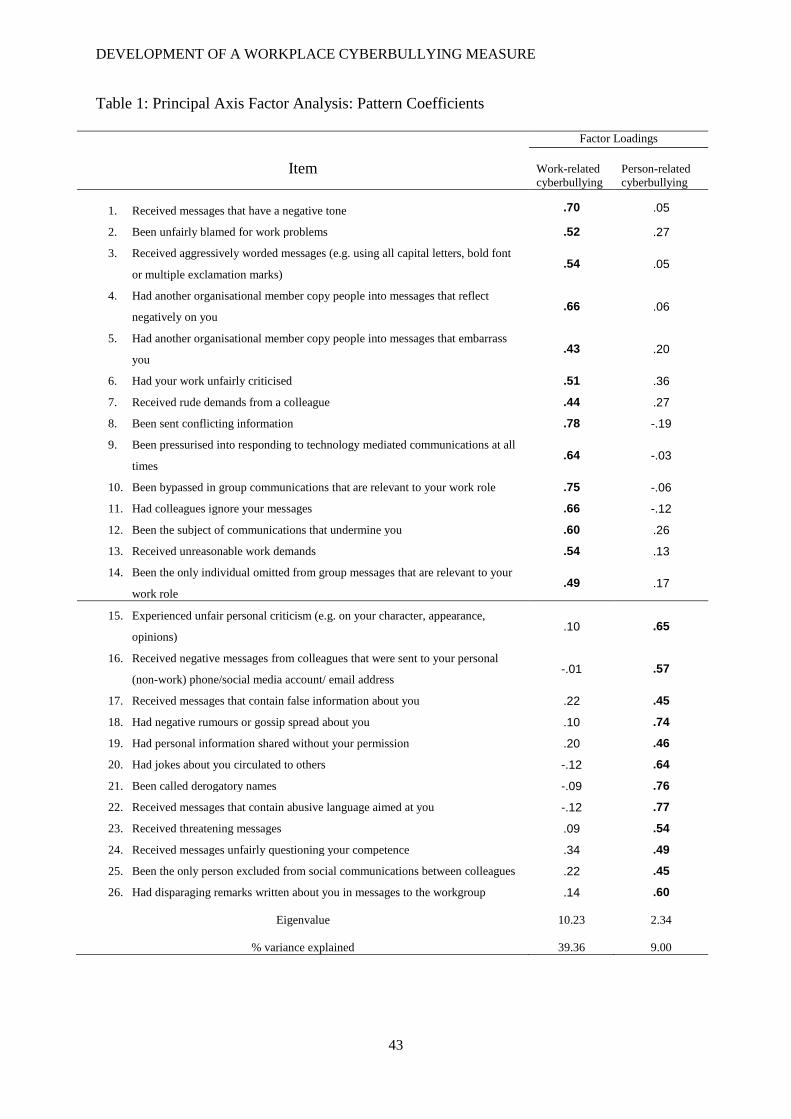
DEVELOPMENT OF A WORKPLACE CYBERBULLYING MEASURE
43
Table 1: Principal Axis Factor Analysis: Pattern Coefficients
Item
Factor Loadings
Work-related
cyberbullying
Person-related
cyberbullying
1. Received messages that have a negative tone .70 .05
2. Been unfairly blamed for work problems .52 .27
3. Received aggressively worded messages (e.g. using all capital letters, bold font
or multiple exclamation marks) .54 .05
4. Had another organisational member copy people into messages that reflect
negatively on you .66 .06
5. Had another organisational member copy people into messages that embarrass
you .43 .20
6. Had your work unfairly criticised .51 .36
7. Received rude demands from a colleague .44 .27
8. Been sent conflicting information .78 -.19
9. Been pressurised into responding to technology mediated communications at all
times .64 -.03
10. Been bypassed in group communications that are relevant to your work role .75 -.06
11. Had colleagues ignore your messages .66 -.12
12. Been the subject of communications that undermine you .60 .26
13. Received unreasonable work demands .54 .13
14. Been the only individual omitted from group messages that are relevant to your
work role .49 .17
15. Experienced unfair personal criticism (e.g. on your character, appearance,
opinions) .10 .65
16. Received negative messages from colleagues that were sent to your personal
(non-work) phone/social media account/ email address -.01 .57
17. Received messages that contain false information about you .22 .45
18. Had negative rumours or gossip spread about you .10 .74
19. Had personal information shared without your permission .20 .46
20. Had jokes about you circulated to others -.12 .64
21. Been called derogatory names -.09 .76
22. Received messages that contain abusive language aimed at you -.12 .77
23. Received threatening messages .09 .54
24. Received messages unfairly questioning your competence .34 .49
25. Been the only person excluded from social communications between colleagues .22 .45
26. Had disparaging remarks written about you in messages to the workgroup .14 .60
Eigenvalue
10.23
2.34
% variance explained 39.36 9.00

DEVELOPMENT OF A WORKPLACE CYBERBULLYING MEASURE
44
Table 2: CFA using MLM estimation: Items, factor loadings and correlations between
workplace cyberbullying factors
Factor Item Factor
loading
Work related
cyberbullying
Received messages that have a disrespectful tone 0.633
Been unfairly blamed for work problems 0.797
Received aggressively worded messages (e.g. using all capital letters, bold font
or multiple exclamation marks) 0.597
Had another organisational member copy people into messages that reflect
negatively on you 0.661
Had your work unfairly criticised 0.746
Received rude demands from a colleague 0.759
Been sent conflicting information 0.663
Been bypassed in group communications that are relevant to your work role 0.584
Been the subject of communications that undermine you 0.778
Received unreasonable work demands 0.670
Person related
cyberbullying
Experienced unfair personal criticism (e.g. on your character, appearance,
opinions) 0.595
Had negative rumours or gossip spread about you 0.682
Had personal information shared without your permission 0.682
Received messages that contain abusive language aimed at you 0.566
Received threatening messages 0.579
Received messages unfairly questioning your competence 0.721
Been the only person excluded from social communications between colleagues
0.575
Correlations between factors = .86
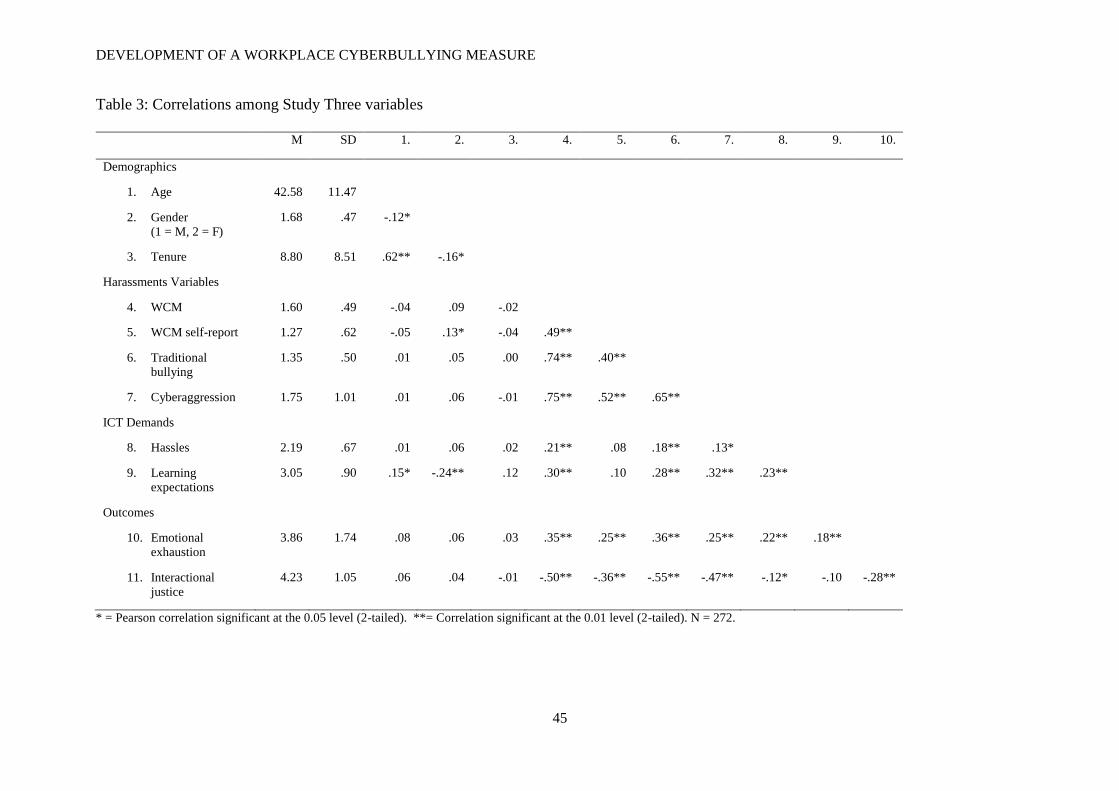
DEVELOPMENT OF A WORKPLACE CYBERBULLYING MEASURE
45
Table 3: Correlations among Study Three variables
M SD 1. 2. 3. 4. 5. 6. 7. 8. 9. 10.
Demographics
1. Age 42.58 11.47
2. Gender
(1 = M, 2 = F)
1.68 .47 -.12*
3. Tenure 8.80 8.51 .62** -.16*
Harassments Variables
4. WCM 1.60 .49 -.04 .09 -.02
5. WCM self-report 1.27 .62 -.05 .13* -.04 .49**
6. Traditional
bullying
1.35 .50 .01 .05 .00 .74** .40**
7. Cyberaggression 1.75 1.01 .01 .06 -.01 .75** .52** .65**
ICT Demands
8. Hassles 2.19 .67 .01 .06 .02 .21** .08 .18** .13*
9. Learning
expectations
3.05 .90 .15* -.24** .12 .30** .10 .28** .32** .23**
Outcomes
10. Emotional
exhaustion
3.86 1.74 .08 .06 .03 .35** .25** .36** .25** .22** .18**
11. Interactional
justice
4.23 1.05 .06 .04 -.01 -.50** -.36** -.55** -.47** -.12* -.10 -.28**
* = Pearson correlation significant at the 0.05 level (2-tailed). **= Correlation significant at the 0.01 level (2-tailed). N = 272.

DEVELOPMENT OF A WORKPLACE CYBERBULLYING MEASURE
46
Table 4: Hierarchical regression analyses on the effect of traditional bullying,
cyberaggression and cyberbullying on emotional exhaustion and interactional justice
Criteria and predictors Adjusted R² R² Change Beta F (df1, df,2)
Emotional Exhaustion
Model 1: Sample
Model 2: Traditional bullying
Model 3: Cyberaggression
Model 4: Cyberbullying
Interactional Justice
Model 1: Sample
Model 2: Traditional Bullying
Model 3: Cyberaggression
Model 4: Cyberbullying
.001
.132
.129
.144
-.004
.300
.318
.322
.002
.136***
.000
.018*
.00
.305***
.020**
.006
.05
.37***
.02
.24*
.01
-.56***
-.18**
-.14
.61 (1, 269)
21.48 (2, 268)
14.31 (3, 267)
12.38 (4, 266)
.01 (1, 269)
58.90 (2, 268)
42.94 (3, 267)
33.00 (4, 266)
* p<0.05; ** p<0.01; *** p<0.001. Standardised Betas presented.