design & development of gastro retentive floating ...ijupbs.com/uploads/28. rpa1415073015.pdfso,...
TRANSCRIPT

456 | P a g e International Standard Serial Number (ISSN): 2319-8141
Full Text Available On www.ijupbs.com
International Journal of Universal Pharmacy and Bio Sciences 3(3): May-June 2014
INTERNATIONAL JOURNAL OF UNIVERSAL
PHARMACY AND BIO SCIENCES IMPACT FACTOR 1.89***
ICV 5.13*** Pharmaceutical Sciences RESEARCH ARTICLE……!!!
DESIGN & DEVELOPMENT OF GASTRO RETENTIVE FLOATING
MICROSPHERES OF BACLOFEN A Hiren B. Upadhyay, Dr. K. R. Patel, Dr. M. R .Patel
Department of Pharmaceutics, Shri B. M. Shah College of Pharmaceutical Education and Research,
Modasa-383315, Gujarat, India.
KEYWORDS:
Baclofen microsphere;
GRDDS; Floating
system, 32factorial
design.
For Correspondence:
Hiren B. Upadhyay *
Address:
Department of
Pharmaceutics, Shri B.
M. Shah College of
Pharmaceutical Education
and Research, Modasa-
383315, Gujarat, India.
Email:
Hirenupadhyay53@gmail
.com
ABSTRACT
Objectives: Objective of present investigation was to develop baclofen
floating microsphere for retention in the upper part of the GIT to
improve the dissolution in where the solubility of baclofen is more in
acidic medium. Experimental work: Floating Microspheres were
prepared by emulsion solvent evaporation method using Ethyl
cellulose and Eudragit S 100 as polymer and 0.15% w/v span 80 &
liquid paraffin as external medium. 32 full factorial design was used for
optimizing the drug: polymer ratio(X1) and Ethyl cellulose: Eudragit S
100(X2) ratios were selected as independent variables evaluated for
various parameters and analysed using ANOVA and Surface Response
Methodology. Results: Batch F6 was selected as optimized, as
provides desired zero order release profile as well as 79.37%
Buoyancy and 84.08% Entrapment Efficiency, 82.02% yield and mean
particle size of 288.89 μm and spherical microsphere obtained
confirmed by SEM study. Batch F6 remains stable after 30 day
accelerated stability study. Conclusion: Combination of EC and
Eudragit S 100 provides better product compared to EC or Eudragit S
100 alone. Drug and excipients are compatible to each other was
confirmed by FTIR and DSC study.

457 | P a g e International Standard Serial Number (ISSN): 2319-8141
Full Text Available On www.ijupbs.com
INTRODUCTION
Oral drug delivery has been known for decades as the most widely utilized route of administration
for delivery of drug via different dosage form due to its ease of administration, high patient
compliance least sterility constraints and flexibility in the design of dosage form.
Gastro retentive system can remain in the gastric region for several hours and hence significantly
prolongs the Gastric Residence Time (GRT) of drug. Prolonged gastric retention improves
bioavailability, reduces drug waste and improves solubility of drug that is less soluble in high ph
environment. It has application also for local drug delivery to the stomach and proximal small
intestine. Gastro retention helps to provide better availability of new products with new therapeutic
possibilities and substantial benefit for patient.
Baclofen is an oral medication that the skeletal muscle, chemically related to gamma-amino butyric
acid (GABA) a naturally occurring neurotransmitter in the brain. It is believed that baclofen, acting
like GABA, blocks the activity of nerves within the part of the brain that control the contraction and
relaxation of skeletal muscle. The evidence suggest the baclofen is transported from gastro intestinal
tract is indicated in long-term treatment of spasticity resulting from multiple -sclerosis and spinal
cord injuries.
Administration of conventional tablet of Baclofen has reported to exhibit fluctuation in plasma drug
concentration leading to fluctuation in plasma concentration, producing side effect such dizziness to
the prescribers. There for release of drug in sustained manner and also requires steady state plasma
concentration. So, formulation of Gastroretentive floating drug delivery satisfies these conditions.
Gastroretentive drug delivery system can be retained in stomach for prolonged time and assist in
increasing sustained delivery of drug delivery like Gas generating system, Raft forming system,
Hydro dynamically balanced system, Low density system, High density system and Bio adhesive
system.
Hence objective of study to formulate floating microspheres of Baclofen to improve bioavailability
and also get steady state plasma concentration.
MATERIAL
Baclofen from Intas Healthcare Pvt. Ltd., Ahmedabad, Ethocel (Ethyl cellulose 20 cps) from
Colorcon Asia Pvt. Ltd., Goa. Eudragit S100 from Evonik degusa india Pvt ltd., Mumbai, Liquid
paraffin from Finar Chemical Ltd Ahmedabad, India, Tween 80 from S. D. Fine Chemicals Ltd.,
Mumbai, India, Ethanol from Finar Chemical Ltd Ahmedabad, India, Dichloromethane form Finar
Chemical Ltd Ahmedabad, India.

458 | P a g e International Standard Serial Number (ISSN): 2319-8141
Full Text Available On www.ijupbs.com
Method
Microspheres were prepared by Emulsion solvent evaporation method. Baclofen and Different
polymer with drug to polymer ratio (1:1, 1:2, 1:3, 1:4) are dissolved in organic solvent like
Dichloromethane : Ethanol (1:1) to get dispersed phase in non polar Liquid paraffin containing Span
80 (0.15%w/w)as droplet stabilizer and stirred at 1200 rpm for 3 hr. During this time solvent was
completely removed by evaporation. The solidified microspheres were filtered, washed five times
with 20 ml petroleum ether, dried under vaccum at a room temperature for 12 hr.
Selection of polymer
Review of literature reveals EC and Eudragit®
S 100 is most widely used encapsulating polymer
because of its compatibility and multi-functionality, in present study, Ethocel 20 cps and Eudragit®
S100 is selected as polymer and various batches of microsphere prepared using single and
combination of polymer.
Characterization of microspheres
A) Scanning Electron Microscopy and Morphology Characterisation22
The surface morphology and internal texture of the microspheres were studied by scanning electron
microscopy. Scanning Electron Microscope (JSM 5610 LV SEM, JEOL, Datum Ltd, Tokyo, Japan)
Acceleration voltage set at 15 kV at Magnification level 200x, 100x, 70x.The samples were then
randomly scanned and microphotographs were taken on different magnification. Then
morphological characteristics of microspheres were determined from photograph of SEM.
B) % Production Yield 23
The percentage yield of microspheres of various formulations was calculated using the weight of
final product after drying with respect to the initial total weight of the drug and polymer used for
preparation of microspheres. The percentage yields were calculated as per the formula mentioned
below.
% Production Yield = Total mass of microsphere/total mass of raw materials× 100
C) Determination of mean particle size 21
The particle size was measured using an optical microscope, and the mean particle size was
calculated by measuring 100 particles with the help of calibrated ocular micrometer. The slide
containing microspheres was mounted on the stage of the microscope and diameter of at least 100
particles was measured using a calibrated optical micrometer.
D) % Drug loading: 11
To determine the % drug loading, 20 mg microspheres were thoroughly triturated and dissolved in
minimum amount of methanol. The resulting solution was made up to 100 ml with 0.1 N HCl and

459 | P a g e International Standard Serial Number (ISSN): 2319-8141
Full Text Available On www.ijupbs.com
filtered. Drug content was analyzed spectrophotometrically at 219 nm. The percentage incorporation
efficiency and percentage drug loading were calculated using eq. given below.
% Drug loading = Actual drug present / Weight of microsphere taken for analysis x 100
E) Entrapment Efficiency: 16
To determine the % Entrapment Efficiency 20mg microspheres were crushed in a glass mortar and
dissolved in minimum amount of methanol. The resulting solution was made up to 100 ml with 0.1
N HCl and filtered and analyzed spectrophotometrically at 219 nm.
% Entrapment Efficiency = Actual drug content / Theoretical drug content x 100
F) In-vitro buoyancy18
Floating behaviour of hollow microspheres was studied using a USP dissolution test apparatus ΙΙ.
The microsphere (50 mg) was spread on 900 ml of 0.1 N HCl . The medium was agitated with a
paddle rotating at 100 rpm and maintained at 37̊ C. After12 hr. Both the floating and settled portion
of microspheres was collected separately. The microspheres were dried and weighed and the
percentage of floating microspheres was calculated.
Buoyancy (%) = Wf /Wf + Ws
Where, Wf and Ws are the weights of the floating and settled microspheres.
G) Density 8
The bulk density (BD) and tapped density (TD) of microspheres were determined. Two grams of
microspheres was introduced into a 10 ml calibrated measuring cylinder. After noting down the
initial volume, the cylinder was allowed to fall under its own weight onto a hard surface from the
height of 2.5 inch at 2 second intervals. The tapping was continued until no further change in volume
was noted. BD and TD were calculated using following equations:
BD = Weight of Powder / Volume of Packaging
TD=Weight of Powder / Volume of Packaging after tapping
H) Hausner’s ratio
Hausner‟s ratio of the microspheres was calculated by using following formula:
Hausner‟s ratio= Tapped Density / Bulk Density
I) Carr’s index
The Carr‟s index of microspheres was determined by following equation
Carr‟s Index = Tapped Density - Bulk Density/ Tapped Density x100
K) Angle of repose
The angle of repose was determined by the fixed funnel method. The accurately weighed powders
were taken in a funnel. The height of funnel was adjusted in such a way that the tip of the funnel just

460 | P a g e International Standard Serial Number (ISSN): 2319-8141
Full Text Available On www.ijupbs.com
touched the apex of the head of the powder. The powder was allowed to flow through the funnel
freely onto the surface. The diameter of the powder cone was measured. The angle of repose was
calculated using the following equation.
Angle of Repose = tan-1
h/r
Where, h = Height of the powder blend cone
r = Radius of the powder blend cone
L) In-vitro drug release 13
Weighed microspheres equivalent to 30 mg of Baclofen were taken and filled in capsule (size No.0)
and subjected to dissolution test in USP XXΙΙΙ dissolution test apparatus using paddle method . The
dissolution media was 900 ml of HCl buffer pH 1.2 maintained at 37± 0.5̊ C and rotated at 50 rpm.
Sample (5 ml) were withdrawn at specified time intervals and replaced with the same volume of
fresh medium, filtered, suitably diluted and analyzed at 219 nm.
Kinetic model for release data (12-15)
The drug released data of all batches were fitted with desired kinetic model such as Zero order
kinetic, First order kinetic, Higuchi model and Korsemeyer peppas model to ascertain the drug
release. The Zero order and First order drug release. The Zero order and First order drug release
explain the drug release depend on drug concentration or not. The Korsemeyer peppas model
described the method of drug release and Higuchi model described the diffusional drug release.
Zero order = Q1 = Q0 + K0t
First order = Qt = Q0e-K1t
Higuchi model = m= (100-q) ×t1/2
Hixon Crowell Model = W01/3
– Wt1/3
= kt
Korsemeyer peppas model = Mt/Mα = K × t n
Where Q1 is the amount of drug dissolved in time t, Q0 is the initial amount of drug in the solution,
Qt is the amount of drug dissolved in time t, W0 is initial amount of drug in dosage form, Wt is
remaining amount of drug in dosage form at time t, Mt/Mα is the fraction of drug release at time t
and n is diffusion exponent. K0, K1, and k refer to the rate constant.
Statistical analysis
The statistical analysis of the factorial design batches was performed by multiple regression analysis
using Microsoft Excel. Data obtained from all formulations were analyzed using statistica software
and used to generate the study design and the response surface plots. Polynomial models were
generated for all the response variables using Microsoft Excel. In addition analysis of variance
(ANOVA) was used to identify significant effects of factors on response regression coefficients. The
F value and p values were also calculated using Microsoft Excel. The relationship between the
dependent and independent variables was further elucidated using response surface plots.

461 | P a g e International Standard Serial Number (ISSN): 2319-8141
Full Text Available On www.ijupbs.com
Similarity factor (f2) 16-17
To evaluate and comparison of dissolution profiles, the dissolution profiles were analyzed using
similarity factor f2. The f2 value between 50 and 100 suggests that the dissolution profiles are similar.
Dissimilarity factor (f1) 16-17
The dissimilarity factor (f1) calculates the percent difference between the two curves at each time
point and is a measurement of the relative error between the two curves. The values should lie
between 0-15.
Accelerated stability study 18
The purpose of stability testing is to provide evidence on how the quality of drug substance or drug
product varies with time under the influence of a variety of environmental factors such as
temperature, humidity, and light, and to establish a re-test for the drug substance or a shelf life for
the drug product and recommended storage condition. The storage condition used for stability
studies were accelerated condition (400 C ± 2
0 C / 75 % ± 5% RH). Stability study was carried out
for the optimized formulations. Tablets of optimized formulation were striped packed and kept in
humidity chamber on above mention temperature.
Preliminary trial batches
Table 1: Preliminary trial batches
Formulation code Polymer used Drug : Polymer ratio
B 1
Ethyl cellulose
1:1
B 2 1:2
B 3 1:3
B 4 1:4
B 5
Eudragit S 100
1:1
B 6 1:2
B 7 1:3
B 8 1:4
B 9 Ethyl cellulose : Eudragit
S 100(1:1)
1:4

462 | P a g e International Standard Serial Number (ISSN): 2319-8141
Full Text Available On www.ijupbs.com
Table 2: Preliminary batches composition
Ingredient Formulation code
B 1 B 2 B 3 B 4 B 5 B 6 B 7 B 8 B 9
BACLOFEN 250 250 250 250 250 250 250 250 250
EC 250 500 750 1000 - - - - 500
EUDRAGIT
S100
- - - - 250 500 750 1000 500
DCM 10 10 10 10 10 10 10 10 10
ETHANOL 10 10 10 10 10 10 10 10 10
Tween
80%w/w
0.15 0.15 0.15 0.15 0.15 0.15 0.15 0.15 0.15
Figure 1: FT-IR spectra of pure drug Baclofen
Table 3: Selection of independent variables, dependent variables
32 Full Factorial Designs
Independent Variables Dependent Variables
X1 X2 Y
Drug : Polymer Ratio Ethocel : Eudragit®
S
100
Drug Entrapment Efficiency,
% Drug loading,
% Drug Release at 2 hour
5007501250175022502750325037501/cm
0
10
20
30
40
50
60
70
80
90%T
2983
.98
2845
.10
2750
.58
2690
.79
2569
.27
2569
.27
2324
.30
2158
.42
1627
.97
1627
.97
baclofen

463 | P a g e International Standard Serial Number (ISSN): 2319-8141
Full Text Available On www.ijupbs.com
Table 4: Selection of levels for independent variables
Coded value Drug : Polymer ratio Ethocel : Eudragit® S 100
-1 1:3 75:25
0 1:4 50:50
1 1:5 25:75
Table 5: 32 factorial design layout
Batch
Code
Coded Value Actual value
Drug :
polymer
ratio
Ethocel :
Eudragit® S 100
Drug :
polymer
ratio
Ethocel : Eudragit®
S 100
F1
-1 -1 1:3 75:25
F2 0 -1 1:4 75:25
F3 1 -1 1:5 75:25
F4 -1 0 1:3 50:50
F5 0 0 1:4 50:50
F6 1 0 1:5 50:50
F7 -1 1 1:3 25:75
F8 0 1 1:4 25:75 F9 1 1 1:5 25:75
Table 6: Formulation of 32 factorial designs bathes
Formulation code Baclofen(gm) Ethocel
(gm)
Eudragit S 100 (gm)
F1 0.5 1.125 0.375
F2 0.5 1.500 0.500
F3 0.5 1.875 0.625
F4 0.5 0.750 0.750
F5 0.5 1.000 1.000
F6 0.5 1.250 1.250
F7 0.5 0.375 1.125
F8 0.5 0.5 1.5
F9 0.5 0.625 1.825

464 | P a g e International Standard Serial Number (ISSN): 2319-8141
Full Text Available On www.ijupbs.com
Table 7: Results of % Production Yield of preliminary batches
Batch No. Theoretical
Yield
Practical
Yield
%Practical
Yield
Product
characteristic
B1 500 410 82.00% Not spherical
B2 750 635 84.66% Nearly spherical
B3 1000 854 85.4% Spherical
B4 1250 1120 89.60% Spherical
B5 500 395 79.00% Not spherical
B6 750 610 81.33% Nearly spherical
B7 1000 821 82.10% Spherical
B8 1250 1050 84.00% Spherical
B9 1250 1155 92.4% Spherical
Table 8: Result of % Drug loading and Entrapment efficiency
Batch
No.
%Drug
Loading
Entrapment efficiency
Theoretical
Drug content
Actual drug
content (n=3)
% EE
B1 47.50 10 9.5±0.02 95
B2 30.1 6.66 6.02±0.05 90.39
B3 19.6 5 3.92±0.04 78.4
B4 16.0 4 3.20±0.01 80.00
B5 46.5 10 9.3±0.03 93
B6 29.5 6.66 5.9±0.02 88.58
B7 18.00 5 3.60±0.01 72.00
B8 15.6 4 3.12±0.03 78.00
B9 17.2 4 3.45±0.01 86.25
Table 9: Results of % Buoyancy
Batch no. % Buoyancy
B1 82 %
B2 75 %
B3 84.1 %
B4 82.6 %
B5 83.5 %
B6 80.7 %
B7 79.9 %
B8 76.14 %
B9 92.97 %

465 | P a g e International Standard Serial Number (ISSN): 2319-8141
Full Text Available On www.ijupbs.com
Table 10: Results of mean particle size analysis
Batch No. Mean particle size (µm)
B1 209.76
B2 223.43
B3 241.24
B4 267.85
B5 201.67
B6 232.59
B7 247.86
B8 278.07
B9 303.75
Figure 2: SEM formulation F6 at 70X magnification
Figure 3: SEM formulation F6 at 100X magnification
Figure 4: SEM formulation F6 at 200X magnification

466 | P a g e International Standard Serial Number (ISSN): 2319-8141
Full Text Available On www.ijupbs.com
Table 11: Micromeritic properties of of factorial batches F1-F9
Batch
code
Bulk density
(g/cm3)
Tapped
density
(g/cm3)
Hausner’s
ratio
Carr’s index
(%)
Angle of
repose(θ)
F1 0.364 0.421 1.15 13.53 21.69
F2 0.379 0.435 1.14 12.87 21.45
F3 0.416 0.473 1.13 12.05 22.65
F4 0.437 0.504 1.15 13.29 24.30
F5 0.449 0.53 1.18 15.28 24.85
F6 0.463 0.531 1.14 12.80 26.56
F7 0.481 0.563 1.17 14.56 28.57
F8 0.458 0.547 1.19 16.27 29.89
F9 0.463 0.558 1.20 17.02 29.08
Table 12: Particle size of factorial batches F1-F9
Batch code Particle size (μm)
F1 275.75
F2 278.98
F3 279.43
F4 273.67
F5 276.04
F6 288.89
F7 272.75
F8 276.45
F9 268.32
Table 13: Results of %yield of factorial batches F1-F9
Batch code % Yield
F1 80.59
F2 88.82
F3 89.68
F4 81.35
F5 82.87
F6 82.02
F7 75.66
F8 78.35
F9 79.03

467 | P a g e International Standard Serial Number (ISSN): 2319-8141
Full Text Available On www.ijupbs.com
Table 14:%Drug loading and Entrapment Efficiency of factorial batches F1-F9
Batch
no.
%Drug
loading
Entrapment efficiency (EE)
Theoretical drug
content/20 mg of
microsphere in mg
Actual drug content/20
mg of microsphere in
mg n=3
EE
F1
F2
F3
F4
F5
F6
F7
F8
F9
19%
15.55%
13.25%
19.25%
16%
14.45%
20.30%
16.60%
14.75%
5
4
3.33
5
4
3.33
5
4
3.33
3.80 ±0.02
3.11±0.01
2.65±0.03
3.85±0.02
3.20±0.01
2.89±0.02
4.06±0.04
3.32±0.03
2.95±0.05
76%
77.75%
79.57%
77.00%
80.00%
84.08%
81.2%
83%
88.58%
Table 15: %Buoyancy of factorial batches F1-F9
Batch no. %Buoyancy
F1 80.15
F2 82.72
F3 83.15
F4 73.88
F5 77.16
F6 79.37
F7 71.39
F8 74.88
F9 78.53
Table 16: Formulation and Evaluation of Batches in 32 factorial Design
Batc
h
Cod
e
Variable
Levels in
Coded Form
DL EE Q2 n K
X1 X2
F1 -1 -1 19 76 47.41 0.405 0.373
F2 0 -1 15.55 77.57 41.62 0.495 0.293
F3 1 -1 13.25 79.57 29.38 0.593 0.206
F4 -1 0 19.25 77 56.35 0.279 0.471
F5 0 0 16 80 53.52 0.299 0.438
F6 1 0 14.45 84.08 42.40 0.447 0.309
F7 -1 1 20.30 81.2 63.50 0.325 0.515
F8 0 1 16.60 83 49.09 0.395 0.375
F9 1 1 14.75 88.58 43.43 0.407 0.336
Coded
Values
Actual Values
X1 X2
-1 1:3 75:25
0 1:4 50:50
1 1:5 25:75
468 | P a g e International Standard Serial Number (ISSN): 2319-8141
Full Text Available On www.ijupbs.com
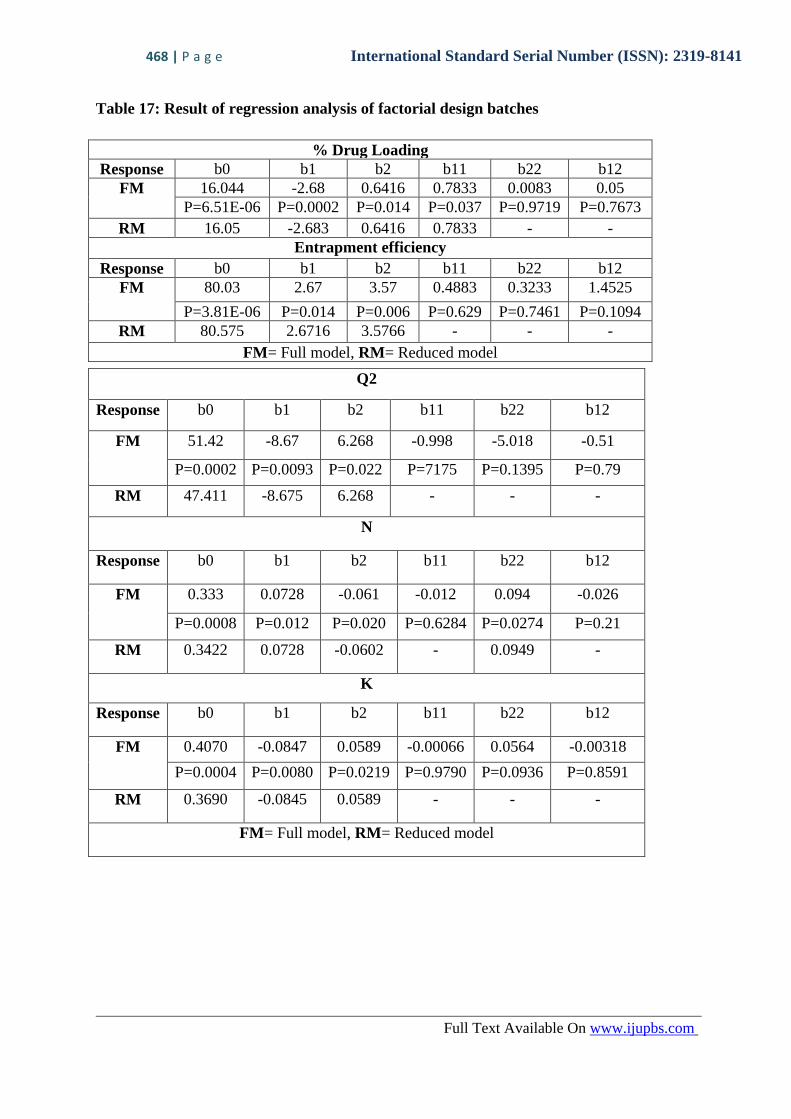
Table 17: Result of regression analysis of factorial design batches
% Drug Loading
Response b0 b1 b2 b11 b22 b12
FM 16.044 -2.68 0.6416 0.7833 0.0083 0.05
P=6.51E-06 P=0.0002 P=0.014 P=0.037 P=0.9719 P=0.7673
RM 16.05 -2.683 0.6416 0.7833 - -
Entrapment efficiency
Response b0 b1 b2 b11 b22 b12
FM 80.03 2.67 3.57 0.4883 0.3233 1.4525
P=3.81E-06 P=0.014 P=0.006 P=0.629 P=0.7461 P=0.1094
RM 80.575 2.6716 3.5766 - - -
FM= Full model, RM= Reduced model
Q2
Response b0 b1 b2 b11 b22 b12
FM 51.42 -8.67 6.268 -0.998 -5.018 -0.51
P=0.0002 P=0.0093 P=0.022 P=7175 P=0.1395 P=0.79
RM 47.411 -8.675 6.268 - - -
N
Response b0 b1 b2 b11 b22 b12
FM 0.333 0.0728 -0.061 -0.012 0.094 -0.026
P=0.0008 P=0.012 P=0.020 P=0.6284 P=0.0274 P=0.21
RM 0.3422 0.0728 -0.0602 - 0.0949 -
K
Response b0 b1 b2 b11 b22 b12
FM 0.4070 -0.0847 0.0589 -0.00066 0.0564 -0.00318
P=0.0004 P=0.0080 P=0.0219 P=0.9790 P=0.0936 P=0.8591
RM 0.3690 -0.0845 0.0589 - - -
FM= Full model, RM= Reduced model

469 | P a g e International Standard Serial Number (ISSN): 2319-8141
Full Text Available On www.ijupbs.com
Table 18: Result of ANOVA (regression analysis) of factorial design batches for selected
responses
.
Q2
DF SS MS F R2 Significance F
Regression
FM
RM
Error
FM
RM
5
2
3
6
738.70
687.28
37.8246
91.2554
148.13
343.64
12.60
15.20
18.54
22.59
0.9488
0.8827
0.018307
0.0016274
Fcalc.= 1.72
Fcritical=9.27
DF(3,3)
N
DF SS MS F R2 Significance F
Regression
FM
RM
Error
FM
RM
5
3
3
5
0.07546
0.072255
0.003364
0.006409
0.01529
0.024085
0.00112
0.00123
13.57
18.7796
0.9576
0.9184
0.02843
0.003786
Fcalc.= 1.38
Fcritical=9.55
DF(2,3)
K
DF SS MS F R2 Significance F
Regression
FM
RM
Error
FM
RM
5
2
3
6
0.070376
0.06396
0.003215
0.009664
0.01407
0.0319
0.001083
0.001611
12.999
19.8563
0.9558
0.8687
-
0.0307453
0.0022526
Fcalc.=1.97
Fcritical=9.2766
DF (3,3)
% Drug Loading
DF SS MS F R2 Significance F
Regression
FM
RM
Error
FM
RM
5
3
3
5
46.9094
46.8993
0.2861
02962
9.381
15.6374
0.09532
0.05922
98.37
263.84
-
-
0.9939
0.9937
0.0015
6.35E-06
Fcalc.= 1.60
Fcritical=9.55
DF(2,3)
% EE
DF SS MS F R2 Significance F
Regression
FM
RM
Error
FM
RM
5
3
3
5
128.70
119.58
4.9816
14.1067
25.7486
59.7907
1.6605
2.3511
15.5086
25.4364
-
0.9627
0.8944
-
0.02860
0.001175
Fcalc.= 7.49
Fcritical=9.55
DF(2,3)

470 | P a g e International Standard Serial Number (ISSN): 2319-8141
Full Text Available On www.ijupbs.com
RESULT AND DISCUSSION
Drug excipients compatibility study:
Fourier transform infrared spectroscopy has been used to study the physical and chemical
interactions between drug and the excipients used. Fourier transform infrared (FTIR) spectra of
Baclofen, Ethocel 20 cps, Eudragit S 100 and physical mixture of Baclofen, Eudragit S 100 and
Ethocel 20 cps was recorded using KBr mixing method on FTIR instrument (FTIR-8400S,
Shimadzu, Kyoto, Japan).
% Practical Yield of preliminary batches
The percentage yields of microspheres of all the formulation was in the range of 79 % to 92.4%.
% Buoyancy of preliminary batches
From the result it can be observed that highest % Buoyancy observed for batch B9, B1, B3, B4 and
B5 so it can be concluded that combination of polymer Ethyl cellulose and Eudragit S100 impart
highest % buoyancy.
Mean Particle size of preliminary batches
The Mean Particle size of all the batches was found to be ranging between 201.67-303.75 µm. As
drug: Polymer concentration increase mean particle size increase as shown in (table 10).
In-Vitro drug release studies of preliminary batches
Figure 5: In-vitro drug release studies of preliminary batches n=3, SD±0.47
Scanning Electron Microscopy and Morphology Characterization of factorial design batches:
Spherical microspheres formed during the solvent evaporation diffusion process could be evidently
seen from photographs of SEM. Inward dents were seen on the surface, probably due to collapse of
the walls of the microspheres during the in situ drying process. Thus, removal of the solvent from
the embryonic microspheres influences the morphology of the product. The microspheres were
rough and grossly spherical and slightly aggregated and shows few pores on surface, due to the rapid
0
20
40
60
80
100
120
0 2 4 6 8 10 12 14
C
P
R
TIME IN HOUR
B1
B2
B3
B4
B5
B6
B7
B8
B9

471 | P a g e International Standard Serial Number (ISSN): 2319-8141
Full Text Available On www.ijupbs.com
escape of the volatile solvents during formulation. Very less particulate matter of the drug and
polymer were seen on the surface of the microspheres, indicating uniform distribution of the drug in
the polymeric network.
Micromeritic properties of floating microspheres of factorial design batches:
The evaluation was carried out were bulk density, tapped density, Hausner‟s ratio, Carr‟s index, and
angle of repose as per procedure described in Preformulation study.
The angle of repose of formulations of the microspheres ranged from 21.45° to 29.89° (Table-). The
bulk and tapped density values of formulations of the microspheres ranged from 0.364 to 0.481
g/cm3 and 0.421 to 0.563 g/cm
3 respectively. The % compressibility index (Carr‟s index) ranged
between 12.05% and 17.02%. The values of Carr‟s index and the angle of repose indicate excellent
flow properties. Obviously the density values of the floating microspheres (</1.000 g/cm3) were less
than that of the gastric fluid (~/1.004 g/cm3), thereby, implying that these microcapsules will exhibit
an excellent buoyancy effect in vivo. Also, Hausner‟s ratio found 1.13-1.20 that indicates greater
cohesion between particles. The better flow property indicates that the floating microspheres
produced are unaggregated. Thus, it is an added advantage while processing the formulation using
high-speed packaging equipments.
Average Particle size of factorial design batches:
The effect of polymer concentration on the particle size of the microspheres was determined. The
mean particle size of the microspheres found in the range of 272.75-288.89μm. Although polymer
Ethyl cellulose and Eudragit S 100 affects the particle size, it was noted that particle size increased
with the increasing Ethyl cellulose concentration and a minor decrease in the particle size observed
in the batches prepared using higher amount of Eudragit S 100 (Table-5.9). The viscosity of the
medium increases at a higher Ethyl cellulose concentration resulting in enhanced interfacial tension.
Also noted that mean particle size of the microspheres decreased with increasing Eudragit S 100
concentration.
% Yield of factorial design batches:
Effect of polymer concentration on the percentage yield of the resulting microspheres observed,
formulations were prepared at varying concentrations of Ethyl cellulose and Eudragit S 100. The
yield of the resulting microspheres increased with increasing concentration of Ethyl cellulose (batch
F1-F3) and slight decrease in the %yield observed with increase in the concentration of Eudragit S
100.

472 | P a g e International Standard Serial Number (ISSN): 2319-8141
Full Text Available On www.ijupbs.com
% Drug loading and Entrapment Efficiency of factorial design batches:
The drug loading of microspheres varied from 13.25% to 20.30% and the drug entrapment efficiency
of microspheres varied from 76% to 88.58% (Table-14). Results demonstrated that as the drug:
polymer ratio increases, there is decrease in drug loading of the microspheres was noted. Polymer
Ethyl cellulose and Eudragit S 100 does not influence drug loading of the microsphere although
entrapment efficiency is affected by Ethyl cellulose: Eudragit S 100 ratio. Increase in the entrapment
efficiency is observed as the amount of Ethyl cellulose decrease and Eudragit S 100 increase in
formulation. It was noted that entrapment efficiency is not significantly affected by Drug: Polymer
ratio but affected by the Ethyl cellulose: Eudragit S 100 ratio and concluded that Eudragit S 100 is
more efficient polymer for encapsulating the drug in the microsphere.
%Buoyancy of factorial design batches:
It is floating ability test to investigate the total floating time of the prepared microspheres. The
microspheres were spread over the surface of simulated gastric fluid (SGF) and the fraction of the
microspheres settling as a function of time was quantified. It should be noted that the situation in
vivo can be quite different and the residence time may vary widely depending on the phase of gastric
motility. The microspheres containing more Ethyl cellulose compared to Eudragit S 100 showed
good floating ability and conclusion made that EC being insoluble and unswellable remained floated,
whereas Eudragit S100 swelled and eroded with time. The results also showed a tendency that larger
the particle size more the buoyancy.
In vitro drug release study of factorial design batches:
From the results of the dissolution study, it was concluded that formulation F1, F4, and F7
containing lowest Drug: Polymer ratio showed 96% ~100% drug release in 10 hours. For
formulations F2, F5, and F8, the drug release was 94.24%–96.76% within 10 hours and F5 shows
96.95% drug release in 12 hours. Formulations F3, F6, and F9 showed 94.25%–100.56% of drug
release at 12 hour. Important conclusion drawn that Drug present on the surface was responsible for
the „burst effect‟ or „burst release‟ in initial time or at first hour after administration of dosage form.
As Drug: Polymer ratio increases, further retardation in drug release observed. Another observation
made is that when concentration of Eudragit S 100 among two polymer increases then more release
of drug observed (F7-F9) compared to those batches containing less amount of Eudragit S 100 (F1-
F3). Moreover, from the results it is also clear that no burst effect was seen and drug release was
significantly sustained. It was observed that as the concentration of EC increased, %cumulative
release of Baclofen from microsphere decreased and as the concentration of Eudragit S 100 increases

473 | P a g e International Standard Serial Number (ISSN): 2319-8141
Full Text Available On www.ijupbs.com
in formulation, increase in the %cumulative release observed. Among nine batches, one batch to be
is selected as optimized batch after calculating the similarity factor for dissolution test.
Figure 5: Graph of in vitro drug release study of factorial batches F1-F3
Figure 6: Graph of in vitro drug release study of factorial batches F4-F6
Figure 7: Graphs of in vitro drug release study of factorial batches F7-F9
0
20
40
60
80
100
120
0 2 4 6 8 10 12 14
f1
f2
f3
C
P
R
TIME IN HOUR
0
20
40
60
80
100
120
0 2 4 6 8 10 12 14
F4
F5
F6
C
P
R
TIME IN HOUR
0
20
40
60
80
100
120
0 2 4 6 8 10 12 14
F7
F8
F9
C
P
R
TIME IN HOUR

474 | P a g e International Standard Serial Number (ISSN): 2319-8141
Full Text Available On www.ijupbs.com
Full and Reduced Model for Q2
Full model
Y = 51.4238 - 8.67839 (X1) + 6.26833345 (X2) -0.51724432 (X12)
-0.998346 (X1)2 – 5.01864 (X2)
2
Reduced model Y = 47.41132 -8.67635 (X1) +6.26853(X2)
Figure 8: Response surface plot of Q2
From the surface plot of Q2 (drug release from microsphere at 2 hour) it can be concluded that as X1
(drug: polymer ratio) increases drug release decreases and as X2 (EC: Eudragit S 100 ratio)
increases i.e. as amount of EC compared to Eudragit S increases then drug release also increases
from microsphere. 3D surface plot of Q2 clearly indicate effect of both parameters, on the drug
release as discussed above.
Full and Reduced Model for Release Rate Constant (k)
Full model Y = 0.4070567757 - 0.0847635842 (X1) + 0.0589159296 (X2)
- 0.0031867 (X12) -0.00066517 (X1) 2
- 0.05643194(X2) 2
Reduced model Y = 0.3690172527- 0.084379546(X1) + 0.0589566896(X2)
Figure 9: Response surface plot of k

475 | P a g e International Standard Serial Number (ISSN): 2319-8141
Full Text Available On www.ijupbs.com
From the surface plot of release rate constant (k) it can be concluded that as X1 (drug: polymer ratio)
increases, release rate constant (k) decrease and as X2 (EC: Eudragit S 100 ratio) increases i.e. as
amount of EC compared to Eudragit S increases then release rate constant (k) increases.
Full and Reduced Model for diffusion co-efficient (n)
Full model Y = 0.333471270 + 0.07281940 (X1) - 0.0639259 (X2)
- 0.0268896 (X12) + 0.0124897 (X1) 2
+ 0.0949742 (X2) 2
Reduced model Y = 0.342246968 + 0.072852503 (X1) - 0.06090915(X2)
+0.094949203(X2) 2
Figure 9: Response surface plot of n
From the surface plot of diffusion exponent (n) it can be concluded that as X1 (drug: polymer ratio)
increases, diffusion exponent (n) increases and as X2 (EC: Eudragit S 100 ratio) increases then
diffusion exponent (n) decrease.
Full and Reduced Model for % Drug loading
Full model Y = 16.044176249 - 2.680461504 (X1) + 0.641633835 (X2)
+ 0.05789639 (X12) + 0.7823946 (X1) 2 +0.0083138 (X2)
2
Reduced model Y = 16.05639724 - 2.683131504 (X1) + 0.616633235(X2)
+ 0.781297464(X1) 2
476 | P a g e International Standard Serial Number (ISSN): 2319-8141
Full Text Available On www.ijupbs.com
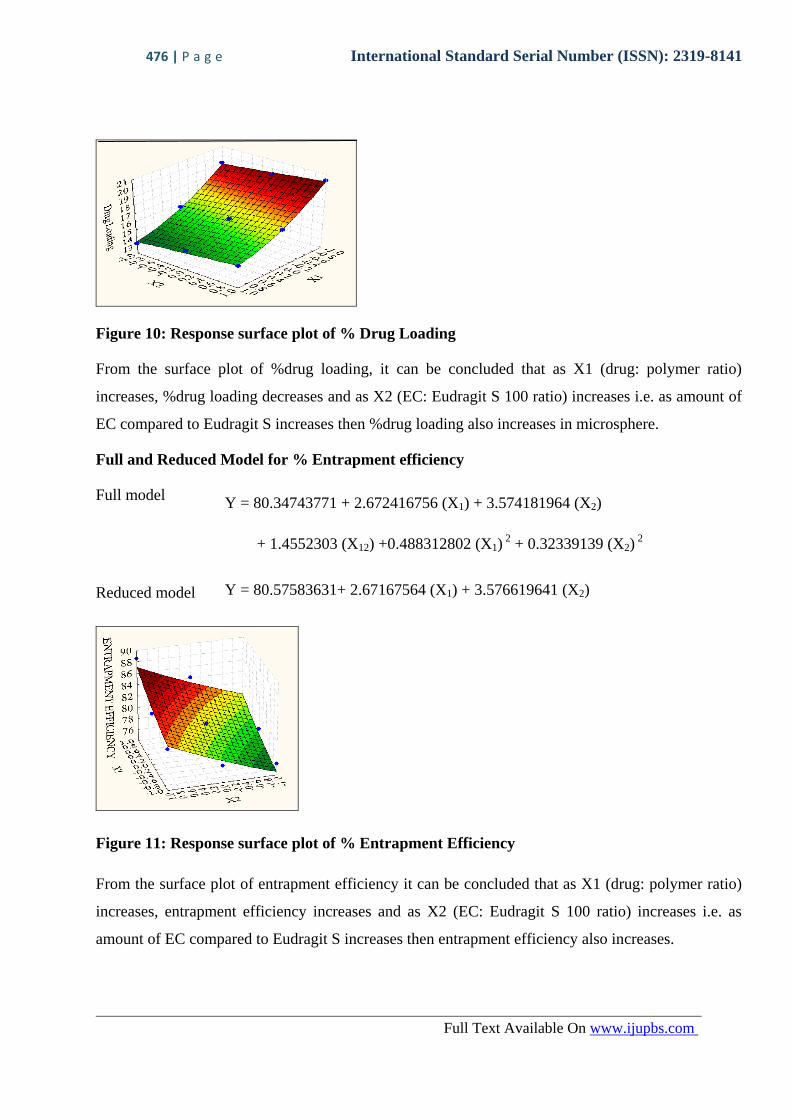
Figure 10: Response surface plot of % Drug Loading
From the surface plot of %drug loading, it can be concluded that as X1 (drug: polymer ratio)
increases, %drug loading decreases and as X2 (EC: Eudragit S 100 ratio) increases i.e. as amount of
EC compared to Eudragit S increases then %drug loading also increases in microsphere.
Full and Reduced Model for % Entrapment efficiency
Full model Y = 80.34743771 + 2.672416756 (X1) + 3.574181964 (X2)
+ 1.4552303 (X12) +0.488312802 (X1) 2 + 0.32339139 (X2)
2
Reduced model Y = 80.57583631+ 2.67167564 (X1) + 3.576619641 (X2)
Figure 11: Response surface plot of % Entrapment Efficiency
From the surface plot of entrapment efficiency it can be concluded that as X1 (drug: polymer ratio)
increases, entrapment efficiency increases and as X2 (EC: Eudragit S 100 ratio) increases i.e. as
amount of EC compared to Eudragit S increases then entrapment efficiency also increases.

477 | P a g e International Standard Serial Number (ISSN): 2319-8141
Full Text Available On www.ijupbs.com
Result of kinetic modeling of dissolution data
Table 19: kinetic treatment of dissolution data
The kinetics of the dissolution data were well fitted to zero order, Higuchi model and Krosemeyer-
Peppas model as evident from regression coefficients (table 9)
F1 F2 F3 F4 F5 F6 F7 F8 F9
Zero order
B 7.212 6.740 7.196 5.016 4.552 5.811 7.076 6.052 5.738
A 32.98 28.14 14.98 45.85 44.41 30.77 49.349 36.985 31.959
R2 0.996 0.990 0.976 0.994 0.996 0.993 0.979 0.996 0.996
First order
B 0.046 0.047 0.056 0.030 0.027 0.039 0.039 0.038 0.037
A 1.587 1.52 1.38 1.69 1.67 1.55 1.72 1.61 1.57
R2 0.994 0.967 0.965 0.992 0.988 0.971 0.966 0.976 0.988
Higuchi
B 29.04 30.11 32.70 21.14 20.89 26.82 27.79 26.92 26.07
A 6.744 -2.006 -17.96 25.94 23.09 3.16 24.54 10.18 5.71
R2 0.981 0.994 0.961 0.980 0.990 0.993 0.987 0.993 0.980
Hixon Crowell
B -2.404 -2.246 -2.398 -1.672 -1.517 -1.937 -2.358 -2.017 -1.912
A 22.33 23.95 28.33 18.04 18.52 23.07 16.88 21.00 22.68
R2 -0.996 -0.990 -0.976 -0.994 -0.996 -0.993 -0.997 -0.993 -0.996
Korsmeyer and Peppas
A -0.428 -0.531 -0.685 -0.326 -0.357 -0.509 -0.287 -0.425 -0.473
n 0.405 0.495 0.598 0.279 0.299 0.447 0.325 0.395 0.407
R2 0.978 0.991 0.935 0.964 0.973 0.990 0.985 0.984 0.975
B = slope, A= intercept, n= diffusion exponent R2= Square of corr. coefficient,
Comparison of dissolution profiles for selection of optimum batch
Table 20: Dissimilarity factor (f1) and Similarity Factor (f2) for F1-F9
Batch dissimilarity factor (f1) Similarity factor (f2)
F1 23.73 44.50
F2 10.417 57.71
F3 8.36 57.90
F4 24.56 42.11
F5 14.42 49.21
F6 5.74 68.44
F7 54.19 28.32
F8 18.01 47.99
F9 6.11 66.21

478 | P a g e International Standard Serial Number (ISSN): 2319-8141
Full Text Available On www.ijupbs.com
Result of accelerated stability study
Table 21: Parameters of Batch F6 after Accelerated Stability Study
Parameters Zero time After 30 day
%Drug loading 14.45% 14.03%
Entrapment efficiency 84.08% 83.33%
%Buoyancy 79.37% 75.54%
Comparison of dissolution profile at initial time
Similarity Factor (f2) 96.6861
Dissimilarity Factor
(f1)
0.5640
CONCLUSION:
The present study was reported that the development of Baclofen-loaded floating micro-particulate
system by an Emulsion solvent evaporation method. From the preliminary trials, combination of
biocompatible and cost-effective encapsulating polymers ethyl cellulose and Eudragit S 100 selected
as it provides better results compared to EC and Eudragit S 100 alone when evaluated for Drug
loading, entrapment efficiency, yield and buoyancy.
32 full factorial design used for optimization, variables shows the significant effect on microsphere
formulation. The particle size analysis revealed microsphere size range of 272.75-288.89μm and
scanning electron microscopic studies shows spherical shape of microsphere. Response obtained
were evaluated statistically using ANOVA model and Regression analysis, statistics results found to
be significant and concluded that Formulation F6 prepared with 1:5 drug: polymer ratio and EC:
Eudragit S 100(50:50) was found to be the optimized as microspheres exhibited good encapsulation
efficiencies, excellent floating and micromeritic properties for formulating as single-unit dosage
forms like microsphere filled hard gelatin capsule. The microspheres were having lower densities
thus; such floating microspheres of baclofen can be used for prolonged gastric residence of the drug
and improves dissolution in stomach. In vitro drug release data showed that optimized formulations
released baclofen in a controlled manner for 12 h. Drug release kinetics fitted best with zero order,
Higuchi model and korsemeyer peppas equation based on the highest n values. The mechanism of
drug release of Microspheres showed fickian diffusion bared mixed order (anomalous) with zero
order drug release dominant. Formulation F6 seen to be stable after 30 days of accelerated stability
study.
Finally concluded that Baclofen floating microsphere are better promising alternative to
conventional oral drug delivery system for the treatment of patients suffering from spasticity.

479 | P a g e International Standard Serial Number (ISSN): 2319-8141
Full Text Available On www.ijupbs.com
BIBLIOGRAPHY AND REFERENCES
1. Sarojini S, “An overview on various approaches to gastroretentive dosage forms.” Int. J. of Drug
Dev. & Res. 2012, 4(1), 01-13.
2. Chikhalikar SS and Wakade RB, “Floating drug delivery system – an approach to oral controlled
drug delivery‟‟ Int.J.Pharm.Tech.Res.2012, 4(4), 1812-1826.
3. Sharma N, Agarwal D and Gupta MK, “A comprehensive review on floating drug delivery
system.‟‟ Int. J. of Res. in Pharmaceu. & Bio. Sci.2011, 2(2), 428-441.
4. Mayavanshi AV and Gajjar SS, “Floating drug delivery systems to increase gastric retention of
drugs: a review.‟‟ Res. J. Pharm. and Tech. 2008, 1(4), 345-348.
5. Kapoor D and Patel S, “Formulation optimization and evaluation of floating microspheres of
captopril.” Asian J. Bio. Pharm. Sci. 2012, 2(9), 1-10.
6. Gandhi S, Bhandari A and Jani GK, “Optimization of floating microspheres of captopril using
full factorial design.” Asian J. Bio. Pharm. Sci. 2012, 2(15), 69-94.
7. Debjit B, Chiranjib B and Margret C, “Floating drug delivery system-a review.‟‟ Scholars Res.
Lib. 2009, 1(2), 199-218.
8. Dixit N, “Floating drug delivery system.‟‟ J. of Current Pharmaceu. Res. 2011, 7(1), 6-20.
9. Shinde S, Tadwee I and Shahi S, “Gastro retentive drug delivery system: A Review.‟‟ I. J. of
Pharmaceu. Res. & Allied Sci. 2012, 1(1), 1-13.
10. Pandey A ,Kumar G, Kothiyal P and Barshiliya Y, “A review on current approaches in gastro
retentive drug delivery system.‟‟ A. J. of Pharm. & Medi. Sci. 2012, 2(4), 60-77.
11. Chavda JR. Ph.D Thesis, “Studies in design and development of stomach specific drug delivery
system using various approaches‟‟ Saurashtra University, 2010.
12. Patel N, Nagesh C and Patel J, “Floating drug delivery system: an innovative acceptable
approach in gastro retentive drug delivery.‟‟ A. J. Pharm. Res. 2012, 2(1), 07-18.
13. Kawatra M and Jain U, “Recent advances in floating microspheres as gastro-retentive drug
delivery system: a review.” Int. J. Recent Adv. Pharm. Res.2012, 2(3), 5-23.
14. Joshi P and Shah M, “Single and multiparticulate floating drug delivery system: an updated
review.‟‟ I. J. of Uni. Pharmacy & Bio. Sci. 2013, 2(1), 88-102.
15. Patil JM, Hirlekar RS and Kadam VJ, “Trends in floating drug delivery systems.‟‟ J. of Scientific
& Industrial Res. 2006, 6(5), 11-21.
16. Chordiya MA and Gangurde HH, “Floating drug delivery system: a versatile approach for gastric
retention.’’ I.J.P.F.Res.2011, 1(3), 96-112.

480 | P a g e International Standard Serial Number (ISSN): 2319-8141
Full Text Available On www.ijupbs.com
17. Hafeez A and Maurya A, “An overview on floating microsphere: gastro retention floating drug
delivery system (FDDS).‟‟ The J. of Phytopharmacology. 2013, 2(3), 1-12.
18. www.google.co.in/search?q=floating+microspheres
19. Pandya K and Prajapati G, “A review on microspheres.‟‟ Int. Pharmaceutica Sci. 2012, 2(2), 53-
57.
20. Shaha SH, Patel JK and Patel NV, “An overview of a gastro-retentive floating drug delivery
system.‟‟ A. J. of Pharmaceutical Sci. 2009, 4 (1), 65-80.
21. Goyal M, Prajapati R and Mehta SC, “Floating drug delievery system.‟‟ J. of Current
Pharmaceu. Res. 2011, 5(1), 7-18.
22. Mayavanshi AV and Gajjar SS, “Floating drug delivery systems to increase gastric retention of
drugs: a review.‟‟ Res. J. Pharm. & Tech. 2008, 1(4), 345-348.
23. Sivannarayana P and Saikishore V, “A review on novel approach in gastro retentive floating
drug delivery: floating microspheres.‟‟ Res. J. of Pharmaceu. Bio. and Chemical Sci. 2012,
3(3),1279-1299.