design of an on-board 3d weather situation awareness · pdf filedesign of an on-board 3d...
TRANSCRIPT
Proceedings 19th Triennial Congress of the IEA, Melbourne, Australia, 9-14 August 2015
1
Design of an On-board 3D Weather Situation Awareness System
Thomas Laurain a, Guy A. Boy b, Lucas Stephane b
a Laboratoire d’Automatique, de Mécanique et d’Informatique Industrielles et Humaines, Université de
Valenciennes et du Hainaut-Cambrésis, Valenciennes, France b Human-Centered Design Institute, Florida Institute of Technology, Melbourne, FL, USA
This paper presents the Onboard Weather Situation Awareness System (OWSAS), an innovative tangible interactive system. Its purpose is aircrew support for strategic weather awareness in the context of NextGen and SESAR programs. Weather awareness is crucial to increase safety and efficiency in our currently evolving airspace, especially with the increase of air traffic density around airports. OWSAS is implemented on a tablet, uses advanced 3D visualization and real-time navigation parameters. This first version of OWSAS was developed using a human-centered design (HCD) approach, including iterative creation and improvement of prototypes, participation of professional pilots, and tests on the HCDi Boeing 737 simulator. Current results using this HCD approach confirmed its suitability for the design of a life-critical system such as OWSAS.
Keywords: Human-Centered Design, Weather Situation Awareness, Avionics, Tangible Interactive Systems, Human-In-The-Loop Simulation
1. Introduction
Nowadays, the US airspace system is saturated and works over its capacities (Allignol et al., 2012). The Federal Aviation Administration (FAA) reveals that every day, 87 000 planes cross the US sky. Current role of Air Traffic Controllers (ATCOs) is guiding and solving aircraft conflicts (Lemoine et al., 1997) (Debernard et al., 2009). ATCOs are often overloaded. Their work environment is very complex, highly interconnected and globalized. This enhances the need for human-machine cooperation (Millot and Boy, 2012). Without taking into account the weather, the air traffic system is already an extremely complex system that will become even more complex. According to Boeing, the number of aircraft has increased by 5% between 2011 and 2012 and this increasing factor will be kept for the next decades: Every year until 2020, the passengers flow will increase by 5% for a total of 35 000 new planes in 2032.
Weather is a chaotic, random and hardly predictable natural system that causes 70% flight delays in the US and 23% of airplane accidents. Therefore, not anticipating weather conditions correctly leads to disastrous consequences for human lives, economy (e.g., airlines lost around 2 billions of dollars per year due to weather issues (Weber et al., 2005)) and environment (e.g., delays lead to increasing fuel consumptions and pollution). Consequently, FAA is carrying out the NextGen program. Its purpose is to redesign the US air traffic system entirely as a socio-technical system, using new technologies of both aircraft and ATC, as well as changing the role of each actor.
The main difficulty for a pilot is not to fly an airplane in the traditional sense (i.e., the autopilot can do it, even if pilots need to keep their flying skills, understand what automation is doing and be able to handle manual reversion when necessary), but manage complex artificial and natural phenomena, such as saturated traffic and unpredictable weather. One of his/her crucial cognitive functions is situation awareness (Endsley, 1995a). Situation awareness (SA) is commonly modeled as pilot’s ability to perceive, understand and project a given situation. SA could be very difficult in life-critical systems. This paper presents the On-board Weather Situation Awareness System (OWSAS), which was designed for enhancing weather SA of aircraft pilots using 3D visualization of available weather data coming from satellite and other sources. OWSAS was developed on a tablet, considered as a tangible interactive system (Boy, to appear), easily manipulable by a pilot in a cockpit environment. Latest Human-Centered Design (HCD) methods and tools were used to carry out this first phase of the OWSAS project. Results are presented and discussed.
2. State of the art
Data used in this project comes from the National Climatic Data Center (NCDC) that hosts all NOAA’s meteorological data, which are downloadable. The National Weather Service (NWS) collects, analyses and
Proceedings 19th Triennial Congress of the IEA, Melbourne, Australia, 9-14 August 2015
2
shares with the NCDC the entire weather data on the American territory. NCDC and NWS belong to the National Oceanic and Atmospheric Administration (NOAA). NOAA has numerous radars that enable sensing shape, speed and altitude of various kinds of objects, including clouds, thanks to radio waves (1300 impulsions/second). Radar provides 3D data from 0.3° to 25°of angle. Radar technology evolved from basic radars WSR-57 (Weather Surveillance Radar – 1957) built with the WWII technology, to most recent radars, the WSR-88D (Weather Surveillance Radar – 1988), which are Doppler radars (88D) also called NEXRAD (Next Generation Radars). The radar data are refreshed and updated every 10 minutes.
Huge amounts of software and applications are currently available to create and visualize 3D weather models. Google Earth (GE) is the most famous. It was used in several projects related to weather, such as Butler’s NASA project that enables visualization of weather data using Google Earth interactivity (Butler, 2006). Another Google Earth-based system was proposed for the localization of climate in UK (Strangeways, 2009). Not to mention NOAA’s display of a 3D radar data representation (Figure 1).
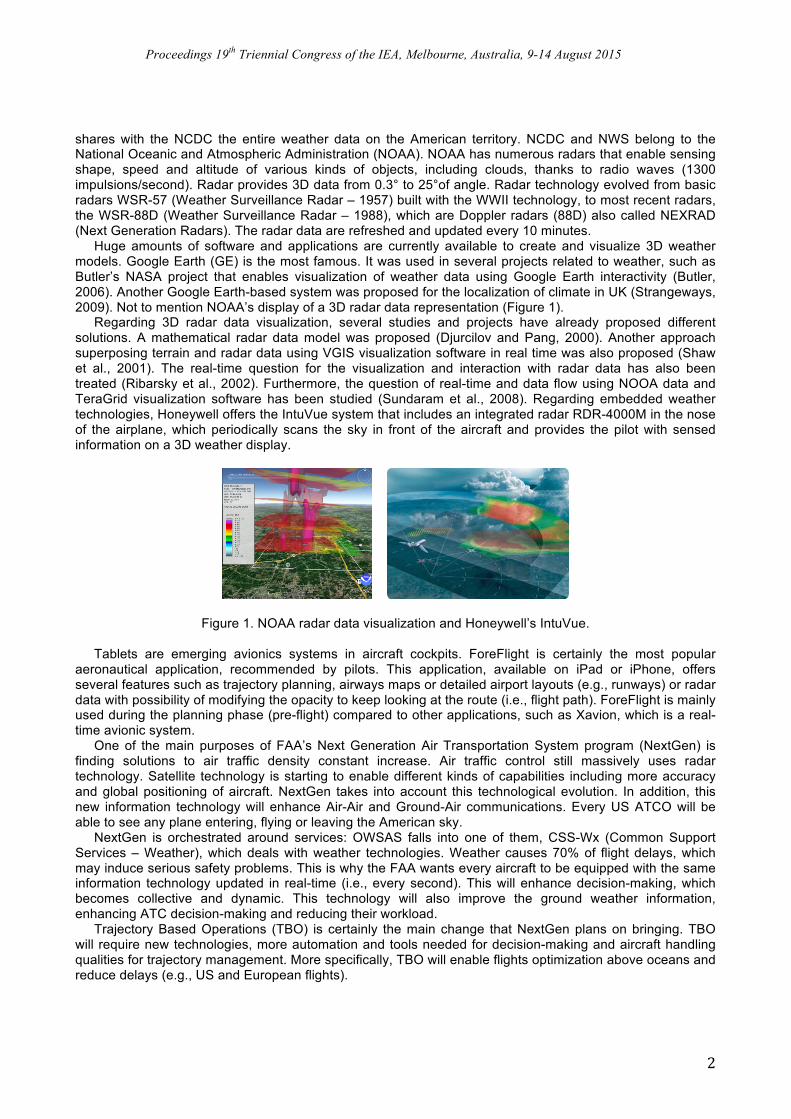
Regarding 3D radar data visualization, several studies and projects have already proposed different solutions. A mathematical radar data model was proposed (Djurcilov and Pang, 2000). Another approach superposing terrain and radar data using VGIS visualization software in real time was also proposed (Shaw et al., 2001). The real-time question for the visualization and interaction with radar data has also been treated (Ribarsky et al., 2002). Furthermore, the question of real-time and data flow using NOOA data and TeraGrid visualization software has been studied (Sundaram et al., 2008). Regarding embedded weather technologies, Honeywell offers the IntuVue system that includes an integrated radar RDR-4000M in the nose of the airplane, which periodically scans the sky in front of the aircraft and provides the pilot with sensed information on a 3D weather display.
Figure 1. NOAA radar data visualization and Honeywell’s IntuVue.
Tablets are emerging avionics systems in aircraft cockpits. ForeFlight is certainly the most popular aeronautical application, recommended by pilots. This application, available on iPad or iPhone, offers several features such as trajectory planning, airways maps or detailed airport layouts (e.g., runways) or radar data with possibility of modifying the opacity to keep looking at the route (i.e., flight path). ForeFlight is mainly used during the planning phase (pre-flight) compared to other applications, such as Xavion, which is a real-time avionic system.
One of the main purposes of FAA’s Next Generation Air Transportation System program (NextGen) is finding solutions to air traffic density constant increase. Air traffic control still massively uses radar technology. Satellite technology is starting to enable different kinds of capabilities including more accuracy and global positioning of aircraft. NextGen takes into account this technological evolution. In addition, this new information technology will enhance Air-Air and Ground-Air communications. Every US ATCO will be able to see any plane entering, flying or leaving the American sky.
NextGen is orchestrated around services: OWSAS falls into one of them, CSS-Wx (Common Support Services – Weather), which deals with weather technologies. Weather causes 70% of flight delays, which may induce serious safety problems. This is why the FAA wants every aircraft to be equipped with the same information technology updated in real-time (i.e., every second). This will enhance decision-making, which becomes collective and dynamic. This technology will also improve the ground weather information, enhancing ATC decision-making and reducing their workload.
Trajectory Based Operations (TBO) is certainly the main change that NextGen plans on bringing. TBO will require new technologies, more automation and tools needed for decision-making and aircraft handling qualities for trajectory management. More specifically, TBO will enable flights optimization above oceans and reduce delays (e.g., US and European flights).
Proceedings 19th Triennial Congress of the IEA, Melbourne, Australia, 9-14 August 2015
3
3. Human-Centered Design principles Cognitive engineering (CE) has become an integrating part of design and engineering. Strongly based on human and social sciences, connected with Human Factors and Ergonomics (HFE), CE aims at designing Human-Machine Systems (HMS) by integrating various relevant human cognitive aspects (e.g., SA, decision-making, cognitive models and so on…) (Boy, 1998). In this project, we mainly focus on SA and more specifically on weather SA. SA has been a very popular HFE topic (Endsley, 1995a).
In addition, Endsley proposed techniques and methods for assessing SA. The most famous is the Situation Awareness Global Assessment Technique (SAGAT) (Endsley, 1995b). Other techniques are available in the literature, such as the Situation Awareness Rating Technique (SART), that Endsley compared to SAGAT (Endsley, 1998). SAGAT provides results based on sets of questions prepared by designers; instead, SART results are gathered through rating scales related to Skills, Rules and Knowledge.
Human Factors engineers typically use Endsley’s methods to assess existing systems to prove that they have not been designed to be ergonomic. Endsley goes deeper explaining in the book “Designing for Situation Awareness” (Endsley, 2011) that SA must be at the heart of the design, and assessed before the final product is commercialized. This is typically what Human-Centered Design (HCD) does (Boy, 2013).
Engineers typically use technology-centered approaches to develop systems. They do not take into account potential users, as well as socio-technical and organizational aspects. HCD uses prototyping, human-in-the-loop simulation and tests involving professionals. HCD is iterative. Prototypes are incrementally modified, taking into account formative evaluation results at each step of the design process, until they match the purpose.
4. Methodology and Development The main objective OWSAS is to provide pilots with real-time global weather information awareness, it belongs to the main purposes of NextGen. In the first mockup, we used global weather data based on real-time ground information on a tablet PC. We quickly shifted from tactical to strategic storms management to fit with NextGen goals. The current technology-dependent framework leads pilots to discover a storm or a dangerous zone when they are almost inside it. If needed, OWSAS is designed to handle weather and change the trajectory before it is too late. The tablet-based solution is very interesting for commercial aviation because it is generic and mobile (i.e., same information technology for all aircraft). In addition, small aircraft do not have embedded weather radar and pilots can only rely on ground weather briefing.
OWSAS includes also an automated trajectory negotiation algorithm that enables authority sharing (i.e., the pilot can be the decision maker). The ATC would only have to validate the proposed trajectory. The authority sharing has already been studied elsewhere (Boy & Grote, 2009; Platt, 2013). Such authority sharing should enable to highly decrease ATCOs’ workload. Currently, the pilot detects a storm and informs ATC, who modifies aircraft trajectory taking into account air traffic and send an order to the pilot. When the pilot uses OWSAS, s/he detects a storm, runs the algorithm that will provide a new route, submits this route to the ATC that checks traffic and validates back. OWSAS design is based on the following cognitive functions used as criteria: workload, SA and decision-making. These criteria were used during the tests.
FAA Aeronautic Information Manual (AIM) recommends not to use data linked weather next generation weather radar (NEXRAD) for tactical maneuvering in case of storms, but for strategic maneuvering. We used data at a given time T providing real-time weather and the archive data at 10T + providing weather forecasted by NOAA. NOAA software was used, as well as the Weather & Climate Toolkit (WCT), which was free and available from Internet. Therefore, radar data was extracted and displayed from these sources.
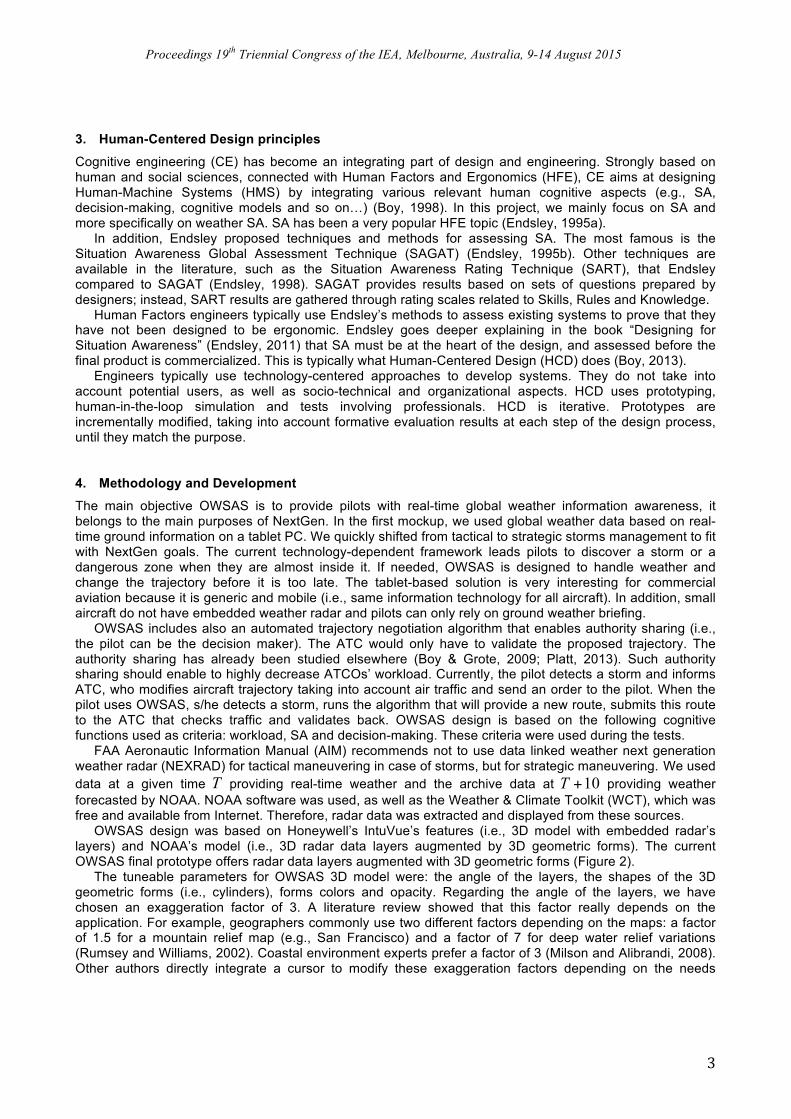
OWSAS design was based on Honeywell’s IntuVue’s features (i.e., 3D model with embedded radar’s layers) and NOAA’s model (i.e., 3D radar data layers augmented by 3D geometric forms). The current OWSAS final prototype offers radar data layers augmented with 3D geometric forms (Figure 2).
The tuneable parameters for OWSAS 3D model were: the angle of the layers, the shapes of the 3D geometric forms (i.e., cylinders), forms colors and opacity. Regarding the angle of the layers, we have chosen an exaggeration factor of 3. A literature review showed that this factor really depends on the application. For example, geographers commonly use two different factors depending on the maps: a factor of 1.5 for a mountain relief map (e.g., San Francisco) and a factor of 7 for deep water relief variations (Rumsey and Williams, 2002). Coastal environment experts prefer a factor of 3 (Milson and Alibrandi, 2008). Other authors directly integrate a cursor to modify these exaggeration factors depending on the needs
Proceedings 19th Triennial Congress of the IEA, Melbourne, Australia, 9-14 August 2015
4
(Kienberger and Tiede, 2008). In order to simplify prototypes and pilots’ interpretation, storm shapes were represented as cylinders, which are called Critical Storm Constraints. We used bright colors for the cylinders consistent with NEXRAD data colors (e.g., red and orange). This two-color coding enables distinguishing two zones: dangerous zones (i.e., red) – where the storm is currently striking, and unadvised zones (i.e., orange) – where it could be dangerous to go in the near future. Cylinder opacity depends on the color, because the red cylinders needed to be well seen but not too much, otherwise they would hide the relief. The opacity of the data layers has also been changed, allowing seeing the relief across the first three layers (common altitude in flight). This transparency enables the pilots to see radar data (i.e., enough opacity to be seen and understood without effort) and orient themselves by looking at the relief, cities and waypoints. Finally, the Flight Management System (FMS) flight path was added to the 3D model.
Figure 2. Weather as cylinders.
The prototype support is a tablet. The resulting device is mobile and belongs to a new type of technology called tangible interactive objects (Boy, 2014), extended to tangible interactive systems (Boy, to appear). These objects or systems were first developed in the human-computer interaction community, and extended in the HCD community for human-systems integration. In the past, the systems were mechanical (i.e., hardware) where electronic components (i.e., software) were incrementally integrated. Nowadays, systems are developed as software entities from the beginning and need to become tangible things to enable people to grasp them. Tangible interactive objects enable people to interact with virtual things (Boy, 2014).
The design of the optimization algorithm was based on Rasmussen’s levels of abstraction (Millot and Lemoine, 1998; Rasmussen, 1991). For a tactical optimization, mathematical techniques such as criteria minimization or optimal command can be applied. For a strategic optimization, a global approach is preferred, based on cities and routes like the algorithm used in the GPS. This technique uses the Graph Theory. Graph Theory is extensively used in computer science, mainly applied in computer networks and telecommunications, but also more widely in domains such as biology1 . Once the pilot provides the waypoints s/he considers as dangerous, the algorithm automatically provides a new flight path, avoiding the storms and, thanks to the Djikstra’s algorithm, certified as the shortest path. This new trajectory is displayed in the 3D model using Google Earth.
5. Scenario-Based Design
Three scenarios were developed and used: Scenario A (outside the simulator); Scenarios B-1 and B-2 (in the simulator). The purpose of Scenario A was usability testing of the 3D model. Assessment criteria were SA and Workload when a pilot used the prototype. SA assessment methods, such as SAGAT, SPAM or SAVANT were reviewed (Stanton et al., 2013). SAGAT is an online method with pause of the experimentation for asking SA questions balanced according to Endsley’s three-level SA model, i.e. perception, comprehension and projection, and their relationships with mental models. In some cases,
1 Djikstra’s algorithm (i.e., Shortest Way algorithm) was implemented in OWSAS. It calculates the shortest way between two points A and B of a graph using the equation:
d = 6371*Acos Sin lat1*π180
!
"#
$
%&*Sin
lat2*π180
!
"#
$
%&+Cos
lat1*π180
!
"#
$
%&*Cos
lat2*π180
!
"#
$
%&*Cos
lon1− lon2( )*π180
!
"
##
$
%
&&
!
"
##
$
%
&&
Proceedings 19th Triennial Congress of the IEA, Melbourne, Australia, 9-14 August 2015
5
pausing the scenario has an impact on the real-time aspect of the experiment, resulting in possible intrusiveness. Situation Present Assessment Method (SPAM) is an online method without pause, but it could also be intrusive depending on the case. SPAM is mainly based on reaction time so its efficiency to measure situation awareness is subject to some debates. Situation Awareness Verification and Analysis Tool (SAVANT) developed by the FAA is a combination of the two previous methods. All scenario were based SAGAT concepts and levels, but we did not use SAGAT questions directly in the evaluation. For assessing SA, we preferred to use instead a combination of several methods. Regarding decision-making assessment and SA contributions, we used Klein’s model-based Naturalistic Decision Making (NDM) (Klein, 1993) and Recognition-Primed Decision Making (RPDM) that describe how users’ experience enables them to create schemes that enhance decision making (Klein, 2008). Pilots successfully related SA “Relevant Cues” supporting their decision-making to the various prototype features (e.g. both visualization – colors, shapes, opacity – and the optimization algorithm). Risk Information Seeking and Processing (RISP) (Griffin et al., 2004) introduced for assessing decision-making in 3D environments by (Stephane, 2013) addresses deep knowledge This method details with scales the profile of the subject, and, of particular interest in our study, her or his assessment of the “Information Sufficiency” and the possible routines s/he may develop in the decision-making process. Pilots’ feedback was also collected using the Cognitive Walkthrough (CW) technique, a method that enables to capture cognition during the interaction with the system (Lewis et al., 1990; Wharton et al., 1994). Due to experimental time constraints, only 5 CW SA-related questions were selected. For assessing workload, we used NASA-TLX (Task Load Index; Mental, Manual, Temporal, Effort, Performance, and Frustration dimensions). NASA-TLX is an off-line method (i.e., performed after each experiment session). It is widely used and described in (Rehmann, 1995; Stanton et al., 2013). The Mental Demand dimension was augmented with Visual Demand for assessing in particular the visual load related to the 3D model (Stephane, 2013). The experimental protocol was the following: a training session with the tablet and the 3D model; execution of six tasks; and administration of the CW test. Each subject rated the NASA-TLX criteria at the end of the scenario. Scenario A experiments took about 45 minutes (including the training session). Scenarios B-1 and B-2 took place on HCDi Boeing 737 flight deck simulator. Workload and decision-making were assessed and compared with Scenario A results. Scenario B was divided into two missions where the subject is the PNF (Pilot Non Flying). During the first flight, the pilot used the 3D model on the tablet. During the second flight, the pilot used the 3D model and the optimization algorithm. In both cases, each pilot had the same tasks to perform: (1) follow the Flight Path and (2) identify dangerous waypoints. In mission 1, the pilot had to choose how to deviate the trajectory, and in mission 2, the pilot had to use the optimization algorithm provided by the Assistant Tool. Each mission was carried out in about 45 minutes. In this exploratory stage, eight experimented pilots were involved in these experiments. Their profiles were different, i.e. General Aviation pilots, civil and military company pilots, and one fixed and rotary wing aircraft and space shuttle pilot. 6. Main results
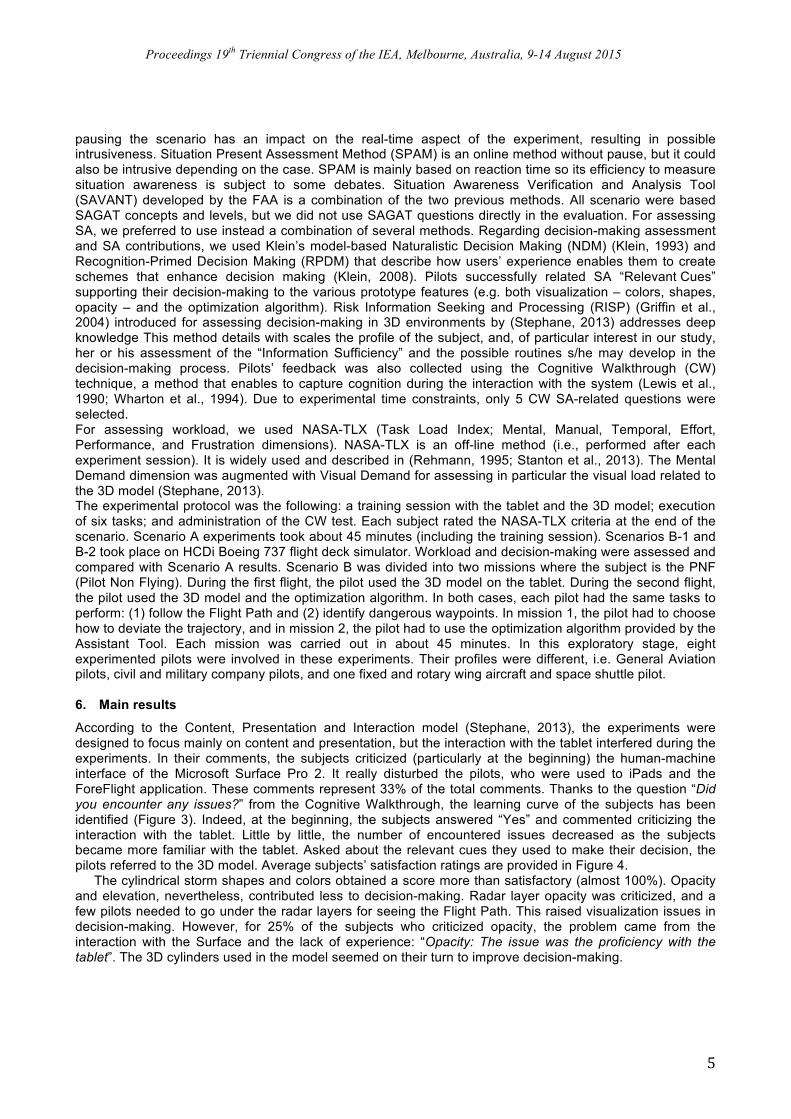
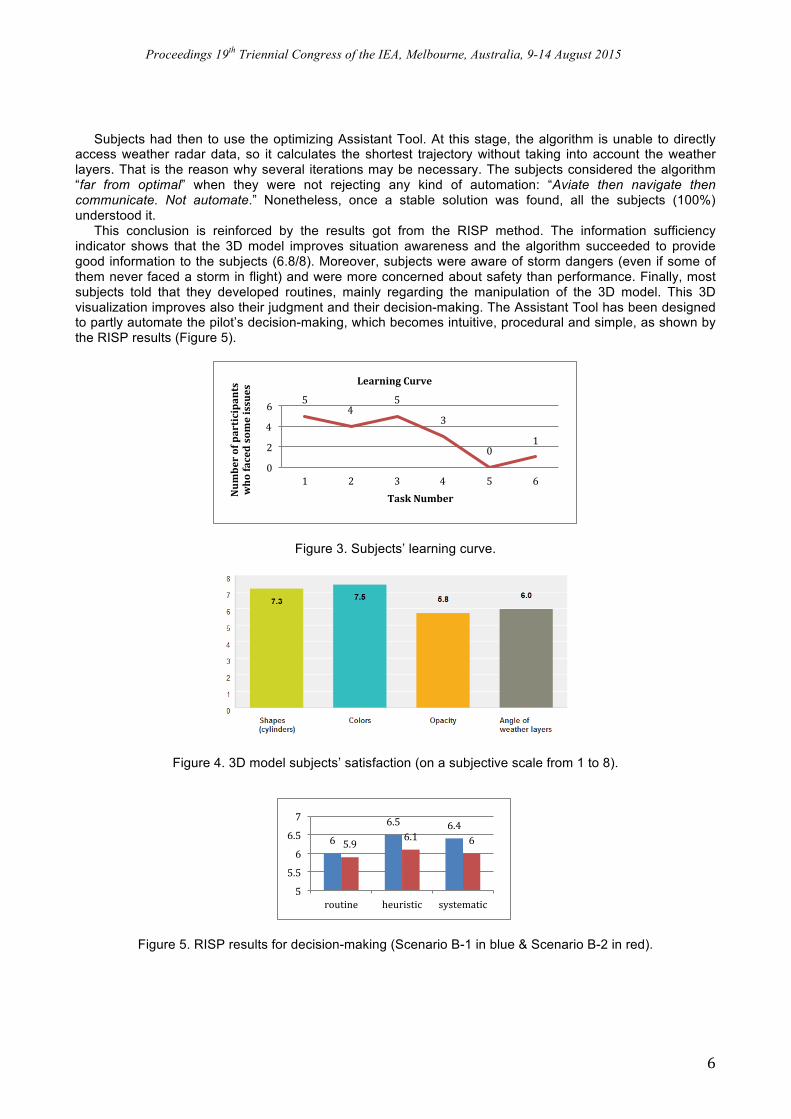
According to the Content, Presentation and Interaction model (Stephane, 2013), the experiments were designed to focus mainly on content and presentation, but the interaction with the tablet interfered during the experiments. In their comments, the subjects criticized (particularly at the beginning) the human-machine interface of the Microsoft Surface Pro 2. It really disturbed the pilots, who were used to iPads and the ForeFlight application. These comments represent 33% of the total comments. Thanks to the question “Did you encounter any issues?” from the Cognitive Walkthrough, the learning curve of the subjects has been identified (Figure 3). Indeed, at the beginning, the subjects answered “Yes” and commented criticizing the interaction with the tablet. Little by little, the number of encountered issues decreased as the subjects became more familiar with the tablet. Asked about the relevant cues they used to make their decision, the pilots referred to the 3D model. Average subjects’ satisfaction ratings are provided in Figure 4.
The cylindrical storm shapes and colors obtained a score more than satisfactory (almost 100%). Opacity and elevation, nevertheless, contributed less to decision-making. Radar layer opacity was criticized, and a few pilots needed to go under the radar layers for seeing the Flight Path. This raised visualization issues in decision-making. However, for 25% of the subjects who criticized opacity, the problem came from the interaction with the Surface and the lack of experience: “Opacity: The issue was the proficiency with the tablet”. The 3D cylinders used in the model seemed on their turn to improve decision-making.
Proceedings 19th Triennial Congress of the IEA, Melbourne, Australia, 9-14 August 2015
6
Subjects had then to use the optimizing Assistant Tool. At this stage, the algorithm is unable to directly access weather radar data, so it calculates the shortest trajectory without taking into account the weather layers. That is the reason why several iterations may be necessary. The subjects considered the algorithm “far from optimal” when they were not rejecting any kind of automation: “Aviate then navigate then communicate. Not automate.” Nonetheless, once a stable solution was found, all the subjects (100%) understood it.
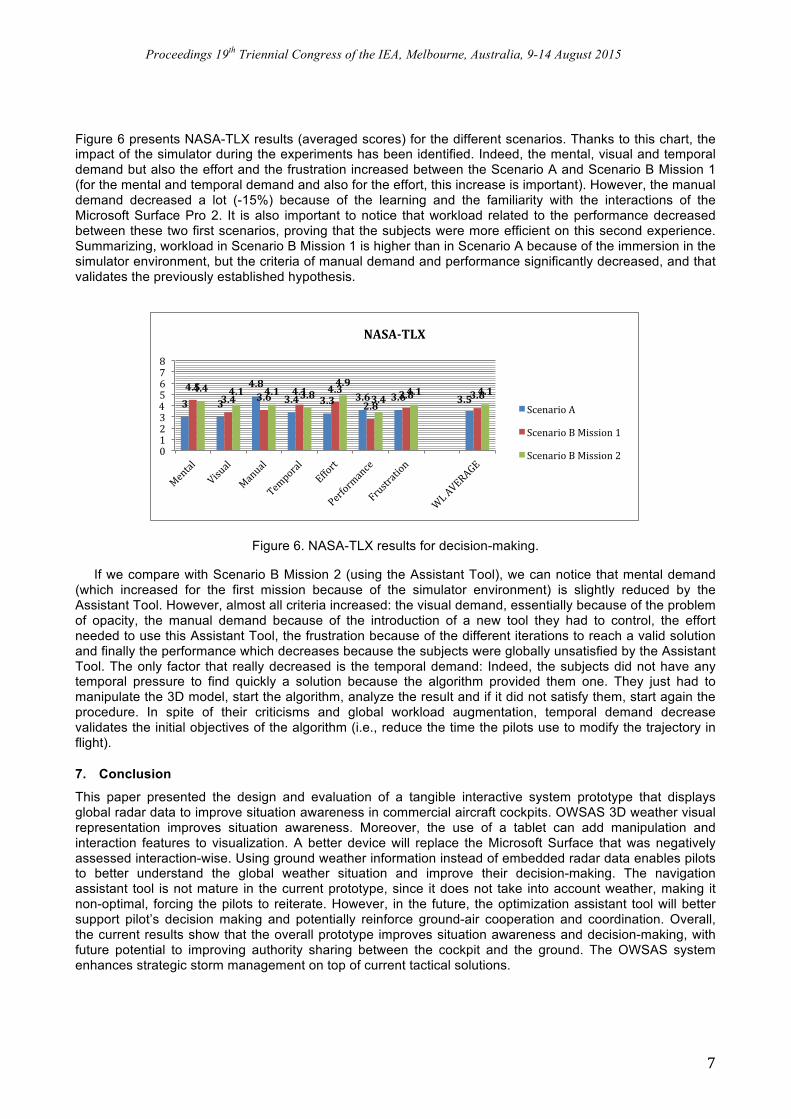
This conclusion is reinforced by the results got from the RISP method. The information sufficiency indicator shows that the 3D model improves situation awareness and the algorithm succeeded to provide good information to the subjects (6.8/8). Moreover, subjects were aware of storm dangers (even if some of them never faced a storm in flight) and were more concerned about safety than performance. Finally, most subjects told that they developed routines, mainly regarding the manipulation of the 3D model. This 3D visualization improves also their judgment and their decision-making. The Assistant Tool has been designed to partly automate the pilot’s decision-making, which becomes intuitive, procedural and simple, as shown by the RISP results (Figure 5).
Figure 3. Subjects’ learning curve.
Figure 4. 3D model subjects’ satisfaction (on a subjective scale from 1 to 8).
Figure 5. RISP results for decision-making (Scenario B-1 in blue & Scenario B-2 in red).
5 4
5
3
0 1
0
2
4
6
1 2 3 4 5 6
Num
ber of participants
who faced some issues
Task Number
Learning Curve
6
6.5 6.4
5.9 6.1 6
5
5.5
6
6.5
7
routine heuristic systematic
Proceedings 19th Triennial Congress of the IEA, Melbourne, Australia, 9-14 August 2015
7
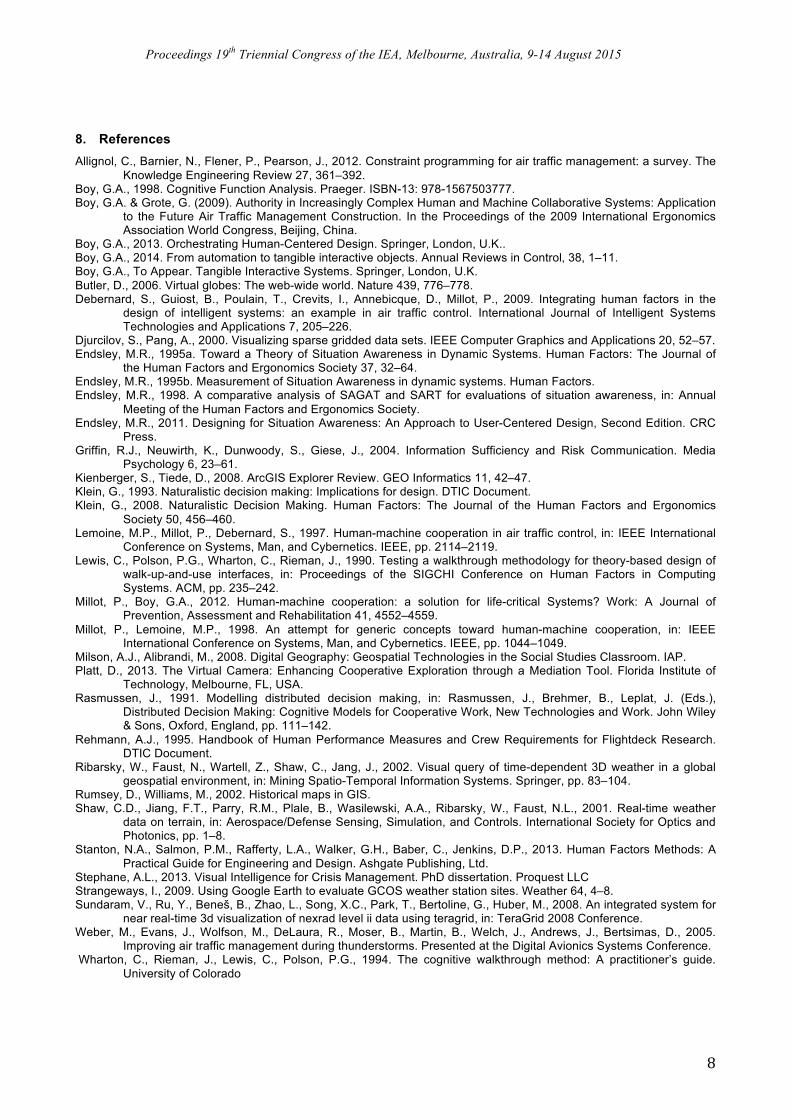
Figure 6 presents NASA-TLX results (averaged scores) for the different scenarios. Thanks to this chart, the impact of the simulator during the experiments has been identified. Indeed, the mental, visual and temporal demand but also the effort and the frustration increased between the Scenario A and Scenario B Mission 1 (for the mental and temporal demand and also for the effort, this increase is important). However, the manual demand decreased a lot (-15%) because of the learning and the familiarity with the interactions of the Microsoft Surface Pro 2. It is also important to notice that workload related to the performance decreased between these two first scenarios, proving that the subjects were more efficient on this second experience. Summarizing, workload in Scenario B Mission 1 is higher than in Scenario A because of the immersion in the simulator environment, but the criteria of manual demand and performance significantly decreased, and that validates the previously established hypothesis.
Figure 6. NASA-TLX results for decision-making.
If we compare with Scenario B Mission 2 (using the Assistant Tool), we can notice that mental demand (which increased for the first mission because of the simulator environment) is slightly reduced by the Assistant Tool. However, almost all criteria increased: the visual demand, essentially because of the problem of opacity, the manual demand because of the introduction of a new tool they had to control, the effort needed to use this Assistant Tool, the frustration because of the different iterations to reach a valid solution and finally the performance which decreases because the subjects were globally unsatisfied by the Assistant Tool. The only factor that really decreased is the temporal demand: Indeed, the subjects did not have any temporal pressure to find quickly a solution because the algorithm provided them one. They just had to manipulate the 3D model, start the algorithm, analyze the result and if it did not satisfy them, start again the procedure. In spite of their criticisms and global workload augmentation, temporal demand decrease validates the initial objectives of the algorithm (i.e., reduce the time the pilots use to modify the trajectory in flight).
7. Conclusion
This paper presented the design and evaluation of a tangible interactive system prototype that displays global radar data to improve situation awareness in commercial aircraft cockpits. OWSAS 3D weather visual representation improves situation awareness. Moreover, the use of a tablet can add manipulation and interaction features to visualization. A better device will replace the Microsoft Surface that was negatively assessed interaction-wise. Using ground weather information instead of embedded radar data enables pilots to better understand the global weather situation and improve their decision-making. The navigation assistant tool is not mature in the current prototype, since it does not take into account weather, making it non-optimal, forcing the pilots to reiterate. However, in the future, the optimization assistant tool will better support pilot’s decision making and potentially reinforce ground-air cooperation and coordination. Overall, the current results show that the overall prototype improves situation awareness and decision-making, with future potential to improving authority sharing between the cockpit and the ground. The OWSAS system enhances strategic storm management on top of current tactical solutions.
3 3
4.8 3.4 3.3 3.6 3.6 3.5
4.5 3.4 3.6 4.1 4.3
2.8 3.8 3.8 4.4 4.1 4.1 3.8
4.9 3.4
4.1 4.1
0 1 2 3 4 5 6 7 8
NASA-‐TLX
Scenario A
Scenario B Mission 1
Scenario B Mission 2
Proceedings 19th Triennial Congress of the IEA, Melbourne, Australia, 9-14 August 2015
8
8. References Allignol, C., Barnier, N., Flener, P., Pearson, J., 2012. Constraint programming for air traffic management: a survey. The
Knowledge Engineering Review 27, 361–392. Boy, G.A., 1998. Cognitive Function Analysis. Praeger. ISBN-13: 978-1567503777. Boy, G.A. & Grote, G. (2009). Authority in Increasingly Complex Human and Machine Collaborative Systems: Application
to the Future Air Traffic Management Construction. In the Proceedings of the 2009 International Ergonomics Association World Congress, Beijing, China.
Boy, G.A., 2013. Orchestrating Human-Centered Design. Springer, London, U.K.. Boy, G.A., 2014. From automation to tangible interactive objects. Annual Reviews in Control, 38, 1–11. Boy, G.A., To Appear. Tangible Interactive Systems. Springer, London, U.K. Butler, D., 2006. Virtual globes: The web-wide world. Nature 439, 776–778. Debernard, S., Guiost, B., Poulain, T., Crevits, I., Annebicque, D., Millot, P., 2009. Integrating human factors in the
design of intelligent systems: an example in air traffic control. International Journal of Intelligent Systems Technologies and Applications 7, 205–226.
Djurcilov, S., Pang, A., 2000. Visualizing sparse gridded data sets. IEEE Computer Graphics and Applications 20, 52–57. Endsley, M.R., 1995a. Toward a Theory of Situation Awareness in Dynamic Systems. Human Factors: The Journal of
the Human Factors and Ergonomics Society 37, 32–64. Endsley, M.R., 1995b. Measurement of Situation Awareness in dynamic systems. Human Factors. Endsley, M.R., 1998. A comparative analysis of SAGAT and SART for evaluations of situation awareness, in: Annual
Meeting of the Human Factors and Ergonomics Society. Endsley, M.R., 2011. Designing for Situation Awareness: An Approach to User-Centered Design, Second Edition. CRC
Press. Griffin, R.J., Neuwirth, K., Dunwoody, S., Giese, J., 2004. Information Sufficiency and Risk Communication. Media
Psychology 6, 23–61. Kienberger, S., Tiede, D., 2008. ArcGIS Explorer Review. GEO Informatics 11, 42–47. Klein, G., 1993. Naturalistic decision making: Implications for design. DTIC Document. Klein, G., 2008. Naturalistic Decision Making. Human Factors: The Journal of the Human Factors and Ergonomics
Society 50, 456–460. Lemoine, M.P., Millot, P., Debernard, S., 1997. Human-machine cooperation in air traffic control, in: IEEE International
Conference on Systems, Man, and Cybernetics. IEEE, pp. 2114–2119. Lewis, C., Polson, P.G., Wharton, C., Rieman, J., 1990. Testing a walkthrough methodology for theory-based design of
walk-up-and-use interfaces, in: Proceedings of the SIGCHI Conference on Human Factors in Computing Systems. ACM, pp. 235–242.
Millot, P., Boy, G.A., 2012. Human-machine cooperation: a solution for life-critical Systems? Work: A Journal of Prevention, Assessment and Rehabilitation 41, 4552–4559.
Millot, P., Lemoine, M.P., 1998. An attempt for generic concepts toward human-machine cooperation, in: IEEE International Conference on Systems, Man, and Cybernetics. IEEE, pp. 1044–1049.
Milson, A.J., Alibrandi, M., 2008. Digital Geography: Geospatial Technologies in the Social Studies Classroom. IAP. Platt, D., 2013. The Virtual Camera: Enhancing Cooperative Exploration through a Mediation Tool. Florida Institute of
Technology, Melbourne, FL, USA. Rasmussen, J., 1991. Modelling distributed decision making, in: Rasmussen, J., Brehmer, B., Leplat, J. (Eds.),
Distributed Decision Making: Cognitive Models for Cooperative Work, New Technologies and Work. John Wiley & Sons, Oxford, England, pp. 111–142.
Rehmann, A.J., 1995. Handbook of Human Performance Measures and Crew Requirements for Flightdeck Research. DTIC Document.
Ribarsky, W., Faust, N., Wartell, Z., Shaw, C., Jang, J., 2002. Visual query of time-dependent 3D weather in a global geospatial environment, in: Mining Spatio-Temporal Information Systems. Springer, pp. 83–104.
Rumsey, D., Williams, M., 2002. Historical maps in GIS. Shaw, C.D., Jiang, F.T., Parry, R.M., Plale, B., Wasilewski, A.A., Ribarsky, W., Faust, N.L., 2001. Real-time weather
data on terrain, in: Aerospace/Defense Sensing, Simulation, and Controls. International Society for Optics and Photonics, pp. 1–8.
Stanton, N.A., Salmon, P.M., Rafferty, L.A., Walker, G.H., Baber, C., Jenkins, D.P., 2013. Human Factors Methods: A Practical Guide for Engineering and Design. Ashgate Publishing, Ltd.
Stephane, A.L., 2013. Visual Intelligence for Crisis Management. PhD dissertation. Proquest LLC Strangeways, I., 2009. Using Google Earth to evaluate GCOS weather station sites. Weather 64, 4–8. Sundaram, V., Ru, Y., Beneš, B., Zhao, L., Song, X.C., Park, T., Bertoline, G., Huber, M., 2008. An integrated system for
near real-time 3d visualization of nexrad level ii data using teragrid, in: TeraGrid 2008 Conference. Weber, M., Evans, J., Wolfson, M., DeLaura, R., Moser, B., Martin, B., Welch, J., Andrews, J., Bertsimas, D., 2005.
Improving air traffic management during thunderstorms. Presented at the Digital Avionics Systems Conference. Wharton, C., Rieman, J., Lewis, C., Polson, P.G., 1994. The cognitive walkthrough method: A practitioner’s guide.
University of Colorado