design of arterial blood pressure, heart rate variability, and br
TRANSCRIPT
McMaster UniversityDigitalCommons@McMasterEE 4BI6 Electrical Engineering BiomedicalCapstones
Department of Electrical and ComputerEngineering
4-23-2009
Design of Arterial Blood Pressure, Heart RateVariability, and Breathing Rate Monitoring DeviceMastan Singh KalsiMcMaster University
This Capstone is brought to you for free and open access by the Department of Electrical and Computer Engineering at [email protected] has been accepted for inclusion in EE 4BI6 Electrical Engineering Biomedical Capstones by an authorized administrator ofDigitalCommons@McMaster. For more information, please contact [email protected].
Recommended CitationSingh Kalsi, Mastan, "Design of Arterial Blood Pressure, Heart Rate Variability, and Breathing Rate Monitoring Device" (2009). EE4BI6 Electrical Engineering Biomedical Capstones. Paper 7.http://digitalcommons.mcmaster.ca/ee4bi6/7
Design of Arterial Blood Pressure, Heart Rate Variability, and Breathing Rate Monitoring Device
by
Mastan Singh Kalsi
Electrical and Biomedical Engineering Design Project (4BI6) Department of Electrical and Computer Engineering
McMaster University Hamilton, Ontario, Canada
Design of Arterial Blood Pressure, Heart Rate Variability, and Breathing Rate Monitoring Device
by
Mastan Singh Kalsi
Department of Electrical and Computer Engineering Faculty Advisor: Prof. Doyle
Electrical and Biomedical Engineering Project Report Submitted in partial fulfillment of the requirements
for the degree of bachelor of Engineering
McMaster University Hamilton, Ontario, Canada
April 23, 2009 Copyright © March 2009 by Mastan Singh Kalsi
ii
ABSTRACT An infrared emitter and a photodiode pressed against a highly vascular surface of a finger or on the brachial artery allow the photodiode to generate a current based on the infrared light it receives. Moreover, the varying amount of blood in the artery as the pulse passes through it impacts the light intensity the photodiode receives. Therefore, the signal received from the photodiode can be used to calculate the instantaneous heart rate and consequently the heart rate variability. Furthermore, the signal received from the photodiode is the photoplethysmographic (PPG) waveform which can be used to calculate the pulse transit time (PTT), the pulse height, and the breathing rate. PTT is the time interval between a peak on the finger PPG waveform and the corresponding peak on the brachial artery PPG waveform. Since PTT is inversely related to blood pressure changes, and the pulse height is proportional to the difference between the systolic and the diastolic pressure in the arteries, with correlation coefficients calculated with the aid of a standard blood pressure monitoring system, arterial blood pressure values can be calculated. By comparing the theories encompassing the hardware design with the experimental results the report articulates the effectiveness of the device. Keywords – arterial blood pressure, brachial artery, breathing rate, heart rate variability, photodiode, photoplethysmographic, PPG, PTT, pulse height, systolic and diastolic pressure

iii
ACKNOWLEDGEMENTS
Mastan Singh Kalsi, the author of this report, with sincere appreciation would like to thank many individuals who have contributed greatly in providing knowledge, support, and encouragement throughout this project. Yousuf Jawahar, Omer Waseem, and Aiyush Bansal, the members of the NIHMS project and the author’s colleagues, provided tremendous assistance in the successful completion of this project. They also acted as test subjects during numerous stages of testing and troubleshooting. Dr. Doyle, the supervisor and co-coordinator of this project, has been a great teacher and mentor. The NIHMS team would also like to thank Dr. Hubert deBruin for his great words of encouragement and wisdom and letting the team borrow a sphygmomanometer for calibration purposes. The author further wishes to express appreciation to and thank his parents, family, and friends for their wealth of knowledge on this project. The author would like to recognize and thank the editor of this report, and a great friend, Akhil Chandan.
iv
TABLE OF CONTENTS
Abstract ........................................................................................................................................... ii
Acknowledgements ........................................................................................................................ iii
Table of Contents ........................................................................................................................... iv
LIST OF TABLES ......................................................................................................................... vi
List of figures ................................................................................................................................ vii
Nomenclature ............................................................................................................................... viii
1 Introduction ............................................................................................................................. 1
1.1 Objectives ............................................................................................................................. 1
1.2 Scope and Methodology ....................................................................................................... 2 2 Literature Review.................................................................................................................... 3
2.1 Blood Pressure from Blood Flow ......................................................................................... 3 2.2 Breathing Rate ...................................................................................................................... 3
2.3 Photoplethysmography (PPG) .............................................................................................. 4 3 Problem Statement and Methodology of Solution .................................................................. 6
3.2 Theory of measuring Blood Pressure using PPG Pulse Height ............................................ 7
3.3 Theory of measuring Blood Pressure using Pulse Transit Time........................................... 7
3.3 Problem Statement ................................................................................................................ 9
3.4 Methodology of Solution .................................................................................................... 10 3.4.1 Calculating Systolic and Diastolic Blood Pressure ...................................................... 10
3.4.2 Calculating Breathing Rate .......................................................................................... 12
3.4.3 Calculating Heart Rate Variability............................................................................... 12
4 Design Procedures ................................................................................................................ 13
4.1 Selection of Material ........................................................................................................... 13
4.2 IR Emitter Diode Circuit . ................................................................................................ 14
4.3 Photodiode Signal to an Electrical Voltage Signal ............................................................. 14 4.4 Initial Amplification............................................................................................................ 15
4.5 Noise Removal .................................................................................................................... 16
4.6.1 Active Signal Filtering ..................................................................................................... 18
4.7 Passive Signal Filtering....................................................................................................... 20
4.8 Summing Amplifier ............................................................................................................ 21
4.9 Final Amplification ............................................................................................................. 22
4.9.1 Measuring the Pulse Height and Pulse Transit Time ................................................... 22
4.9.2 Measuring the Breathing Rate . ................................................................................. 23
4.10 Breathing Rate Envelope Detection using Hardware ....................................................... 24 4.11 Breathing Rate Envelope Detection using Software ......................................................... 25 4.12 Complete Hardware Circuit .............................................................................................. 27
5 Results and Discussion ......................................................................................................... 28 5.1 Testing................................................................................................................................. 28
5.2 Hardware Results ................................................................................................................ 30
5.3 Signal Transmission from Hardware to Computer ............................................................. 33 5.4 Digital Filtering ................................................................................................................... 33
5.5 Peak Detection Algorithm ................................................................................................... 35

v
5.6 Arterial Blood Pressure Calculation Using Pulse Height ................................................... 37 5.7 Arterial Blood Pressure Calculation Using Pulse Transit Time . ..................................... 38
5.8. Heart Rate Variability Data Processing ............................................................................ 40 5.9 Instantaneous Breathing Rate Calculation .......................................................................... 41
6 Conclusions ........................................................................................................................... 42
7 Recommendations ................................................................................................................. 43
8 Appendix A: Hardware Designs ........................................................................................... 44 9 Appendix B: Data processing in matlab ............................................................................... 50
9.1 Breathing Rate Envelop Detection...................................................................................... 50 9.2 Peak Detection Algorithm Implementation and the remaining Calculations ..................... 50
10 References ............................................................................................................................. 53
11 Vitae ...................................................................................................................................... 55

vi
LIST OF TABLES
Table 1 - Major Parts used in the Hardware Circuits.................................................................... 13 Table 2 - Time Constant Determination Chart ............................................................................. 24 Table 3 - Physiological Data obtained from the Sphygmomanometer ......................................... 33
Table 4 - Test Values obtained for Calibration ............................................................................. 37 Table 5 - Calibration Factors for to determine SBP and DBP ...................................................... 37 Table 6 - Blood Pressure Calculations using the Pulse Height Correlation Coefficients ............. 38
Table 7 - Correlation Coefficients for Pulse Transit Time ........................................................... 39 Table 8 - Instantaneous Blood Pressure Calculations for two peaks using PTT .......................... 39
vii
L IST OF FIGURES Figure 1 - Major strata of the reflected light intensity at the PPG site ........................................... 5 Figure 2 - A period of PPG showing the anacrotic and the catacrotic phase, dicrotic notch, as well as the PPG peak height............................................................................................................ 6
Figure 3 - Cardiovascular network showing the path from the aorta to the brachial artery [9]. ..... 8
Figure 4 - Pulse transit time using two PPG waveforms [ 7]. ...................................................... 11 Figure 5 - Emitter Diode Circuit ................................................................................................... 14
Figure 6 - Current to voltage conversion circuit ........................................................................... 15 Figure 7 – Pre-amplification inverting amplifier .......................................................................... 16 Figure 8 - Active Band Pass Filter Circuit .................................................................................... 19 Figure 9 - Magnitude transfer function for the active band pass filter ......................................... 20 Figure 10 - Passive band pass filter .............................................................................................. 21
Figure 11 - Summing Amplifier ................................................................................................... 22
Figure 12 - Non-inverting amplifier circuit .................................................................................. 23 Figure 13 - Final amplification block for the breathing rate calculation ...................................... 24 Figure 14 - Envelope Detection Circuit ........................................................................................ 25 Figure 15 - Front end of the flashlight transducer ........................................................................ 29 Figure 16 - Finger PPG waveform observed on the oscilloscope ................................................. 31 Figure 17 - Brachial PPG (top), Finger PPG (bottom) ................................................................. 32 Figure 18 - Raw PPG signals as sent to the computer .................................................................. 34 Figure 19 - Digital filtered finger PPG (blue) along with the brachial PPG (green) .................... 35
Figure 20 - Three points compared in the peak detection algorithm ............................................ 35 Figure 21- Peak amplitudes to determine peak height .................................................................. 37 Figure 22 - SBP and DBP values calculated for the labeled peaks .............................................. 38 Figure 23 - Stability of the correlation coefficients tested over the course of 12 peaks ............... 39
Figure 24 - Stability of PTT correlation coefficients observed through 12 consecutive SBP readings ......................................................................................................................................... 40
Figure 25 - HRV calculated using standard deviation and a set of IHR values ............................ 40
Figure 26 – Breathing Rate Measurement and envelope detection .............................................. 41 Figure 27 - First PPG Transducer ................................................................................................. 44
Figure 28 - Device Hardware Complete Circuit Block ................................................................ 45 Figure 29 - An Improved Transducer ........................................................................................... 46 Figure 30 - Device Hardware Prototype with the Transducer ...................................................... 47 Figure 31 - Hardware Prototype for Breathing Rate Envelope Detection .................................... 48
Figure 32 - Site for Brachial PPG Detection ................................................................................ 49

viii
NOMENCLATURE Arterial Blood Pressure: Pressure of the blood in the arterial system. Heart Rate Variability: The rate at which the heart rate varies with the heart rate measured at the arteries. Breathing Rate: The rate of breathing as measured from the photoplethysmographic waveform of the arterial system in the finger. Non-invasive: Such that an object or material do not cut through the skin or cause an alternation in anything beneath the skin. NIHMS: Non-invasive Health Monitoring System
1
1 INTRODUCTION The need for a device that continuously monitors the health of an individual arises when the
person interested in monitoring desires to be informed of the health status as soon as a critical
condition is observed so the appropriate remedy can be immediately provided. There are many
applications of this device. A parent may want to monitor the health of a child with a cardiac
disorder, or a doctor may need to study how a patient’s health condition varies in a period of few
days. While a single blood pressure (BP) or heart rate (HR) reading is interesting, it is sometimes
more important to assess the health status based on trends in the BP and HR readings. A BP
reading decreasing in a short period of time would suggest that the patient is going into shock. A
long term trend of BP values maybe requested to assess if the patient is experiencing
hypertension. Hypertension is a major risk factor of myocardial infarction, congestive heart
failure, stroke, kidney failure and blindness. More than 15% of Canadians suffer from high blood
pressure [1]. The existing BP devices are mainly cuff based that are bulky, inconvenient to carry,
and do not allow for BP value to be obtained in a beat-by-beat manner. Therefore, a cuff-less and
non-invasive device is desirable that allows continuous BP measurements to be made.
While there has been an increased demand of a continuous health monitoring system the
importance of remotely monitoring the physiological condition of a soldier and firefighter has
gained significant momentum. Breathing rate is one of the first vital signs examined following an
injury. Sudden changes in breathing rate can be due to airway obstruction, wounds to the
abdomen or pleural cavity, or blunt chest trauma [2]. Furthermore, since heart rate variability
(HRV) indicates autonomic nervous system activity its readings report detrimental physiological
changes [3]. Thus, an HRV reading can provide an advanced warning of critical conditions to
allow for faster medical attention using a wireless transmission of the health status.
1.1 Objectives
The objective of this project was to design and develop a device, named Non-invasive Health
Monitoring System (NIHMS), that picks up physiological signals from the body and transmits
them to a data processing unit for meaningful results to be computed and displayed. The
detection of the signal from the body has to be safe and non-invasive. The transducer needs to be
2
designed such that it does not inject any current into the patient. While the focus of this module
of the project is on measuring arterial blood pressure (ABP), heart rate and breathing rate,
NIHMS has the capacity to integrate multiple transducers detecting several physiological signals
simultaneously. The physiological signals measured in collaboration with the NIHMS team
include ABP, heart rate, breathing rate, blood oxygen saturation, body temperature and the
resting potential of the retina using electrooculography (EOG).
Once the signal is detected it needs to be converted to the form that can be transmitted using a
wireless device. The wireless transmission of the signal is crucial because the party interested in
observing the data maybe far away. The device needs to be able to integrate with a network at
the university, hospital or another workplace.
1.2 Scope and Methodology
This module, referred to as the project from this point, focuses on measuring arterial blood
pressure, heart rate variability and breathing rate. The physiological signal measured from the
body is converted to a sufficiently scaled voltage reading. This signal is then sent to a
microprocessor to be passed to a Bluetooth module. The signal then gets transmitted to a data
processing unit, that can be any computer or a smartphone equipped with Bluetooth technology.
The microprocessor and the Bluetooth hardware and software was designed and developed by
the NIHMS team member, Omer Waseem. Hence, this report will not discuss the details of these
two components except for the conditions it places on the signal it receives. The microprocessor
requires that the signal passed to it must be in the positive Volts range. To meet this requirement,
a summing amplifier was integrated into the project hardware circuit. This matter is further
discussed in the latter sections of the report.
Data processing was done in software to reduce the cost of the project and to limit the hardware
circuitry to avoid making the device bulky. The software chosen for this project was MATLAB
version 7.5. Data processing further cleans the signal for an accurate prognosis. Signal
processing techniques such as fast Fourier transform (FFT) were used in the cleaning of the
signal. While much of the noise was filtered in the hardware, some instrumentation noise was
3
unavoidable due to the monetary budget constraints on this project. Data processing was also
used to compute the heart rate variability and the breathing rate values.
2 L ITERATURE REVIEW Blood pressure is the pressure that the blood exerts on the walls of the vessels that the blood
travels within. In general, blood pressure being referred to is the systemic arterial blood pressure,
which is the pressure in the arteries of the body. The ABP is used to push the blood through the
arteries and into the tissue. The supply of blood to a region is called perfusion. Blood pressure is
needed to allow for tissue perfusion. When the heart ventricles contract, expelling the blood from
the heart, blood pressure is generated and it is at its maximum in the arterial system. This is
called the systolic blood pressure (SBP) during the period when the heart is contracting. When
the heart is relaxing and the ventricles are refilling with the blood returning from the body, the
pressure in the arteries is very low. This lower reading is called the diastolic blood pressure
(DBP). It is important to note that for a healthy individual the blood pressure is well maintained.
As the heart contracts and the blood enters the arteries the pressure widens the arteries. The
elasticity properties of the arteries allow them to recoil as the heart relaxes and the pressure
drops. The recoiling effect pushes the blood further maintaining the DBP [4].
2.1 Blood Pressure from Blood Flow
Blood pressure is mathematically calculated as the cardiac output times the peripheral resistance.
The cardiac output is the product of heart rate and stroke volume. Cardiac output then is the
volume of blood ejected by the heart per minute. As the cardiac output increases, the amount of
blood entering the arteries increases. This increase in flow rate increases the blood pressure [4].
2.2 Breathing Rate
As studied above, pressure travels down its gradient. The intake of air requires the pressure in the
container to be lower than the atmospheric pressure. Thus, to allow inspiration the respiration
muscles increase the volume of the thoracic cavity. According to Boyle’s gas law, the increase in
volume causes the pressure in the lungs to become lower than the atmospheric pressure. This in
4
turn lets the air enter the lungs. Likewise, the volume decrease of the thoracic cavity increases
the pressure in the lungs allowing for expiration to take place.
It is important to note that since the volume of the entire thoracic cavity changes due to
inspiration and expiration, the heart’s blood inflow and outflow also get affected. This is simply
because the heart resides in the thoracic cavity. Therefore, breathing in causes a slight decrease
in pressure in the four chambers of the heart. This lowered pressure in the heart creates a larger
pressure gradient with respect to the rest of the body resulting in an increased amount of blood
return to the right side of the heart.
Since the right side of the heart gets the blood from the body, the larger pressure gradient allows
for the higher cardiac input. However, the vessels that feed into the left side of the heart are the
pulmonary veins. These veins reside in the thorax and experience the same pressure that the rest
of the thoracic cavity does. As there is no increase in the pressure gradient for theses veins the
cardiac input to the left side of the heart remains unchanged [4].
2.3 Photoplethysmography (PPG)
Photoplethysmography is a technique that uses a light emitter and detector to measure pulsatile
blood flow. A diode is a device that has two electrodes and only allows current to flow in one
direction. A light emitting diode (LED) is a P-N junction device that emits light when it is
forward-biased. While the regular incandescent bulbs emit light over a large range of bandwidth,
an LED emits light of a specific wavelength. In PPG, a corresponding photo-detector diode with
the matching wavelength as the LED is used. The photo-detector diode is a semiconductor light
sensor that generates a current proportional to the light intensity it receives [5].
If the light emitter and detector are placed on a highly vascular surface of a finger, the detector
will pick up the light intensity reflected back from the tissue. There are many factors that affect
the light after it is sent from the emitter and before it gets reflected to the detector. The blood
volume and the surrounding tissue such as the blood vessel wall have the largest impact on the
light that gets reflected. The reflected light intensity decreases as the blood volume increases in
5
the region where the diodes are placed. Therefore, as the blood volume varies according to the
cardiac output, the reflected light intensity respectively gets affected. The result is an alternating
current (AC) component of the PPG waveform. There is also a direct current (DC) component in
the PPG waveform. This latter component is due to the tissues and the average amount of blood
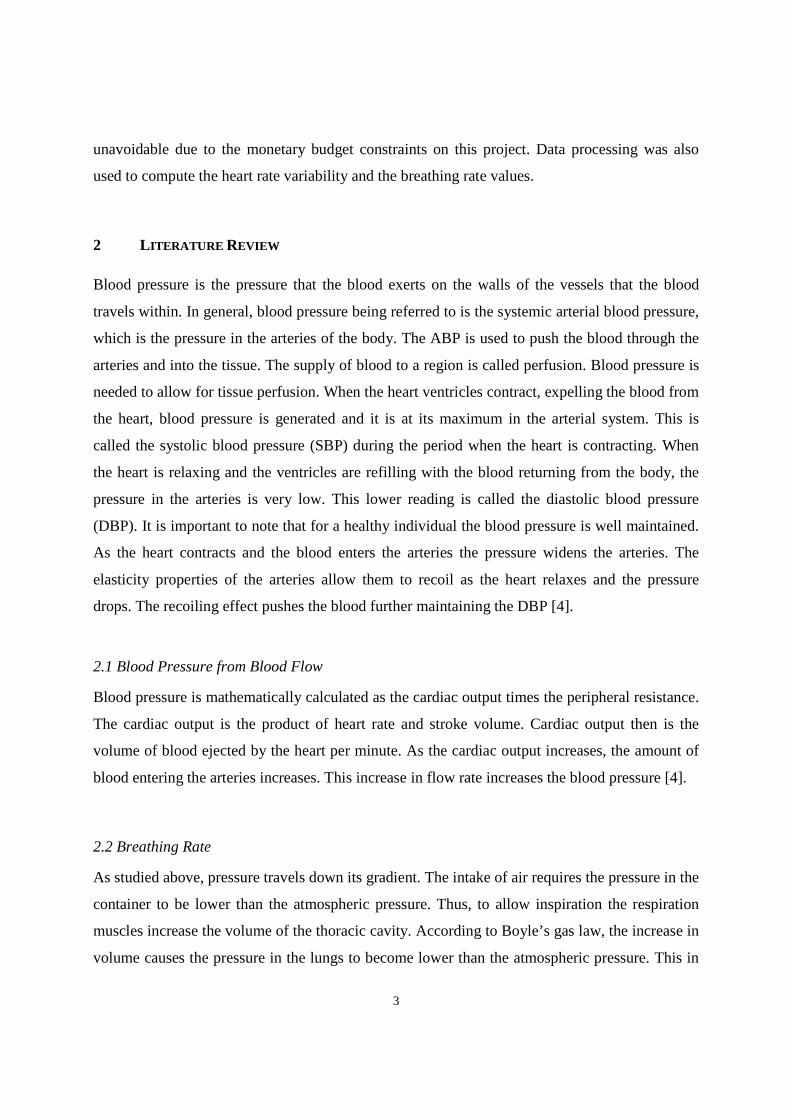
volume that always remain in the section of the artery being sampled. The figure below is a
demonstration that shows the AC component riding on the DC signal. It can be observed that the
reflected light due to the pulsatile arterial blood flow is much smaller than the DC component.
Figure 1 - Major strata of the reflected light intensity at the PPG site

6
3 PROBLEM STATEMENT AND METHODOLOGY OF SOLUTION A clear definition of the problem statement, the solution and theories encompassing the hardware
design are presented in this section.
3.1 Decomposition Analysis of PPG
The Photoplethysmography technique used to study pulsatile arterial flow presents interesting
useful subcomponents of the cardiac cycle. The right ventricle pumps the blood to the pulmonary
circulation through the pulmonary arteries. The blood releases carbon dioxide and picks up
oxygen through gas exchange in the alveoli of the lungs. The oxygenated blood then enters the
left atrium through the pulmonary veins. The blood passes through a valve into the left ventricle,
which then ejects the blood through the aorta and into the arteries. The deoxygenated blood
returns from the body and enters the right atrium through the veins [4]. The contraction of the
ventricles is called systole and the relaxation period when the ventricles are refilling is called
diastole. A period of the PPG waveform can be split into two phases. The first rising edge is the
anacrotic phase. This is the systolic upstroke time. The second falling edge is catacrotic phase
characterized by the diastole. A dicrotic notch is also observed in the catacrotic phase. This notch
is due to the sudden closing of the aortic valve resulting in retrograde flow and a subsequent
temporary increase of blood volume in the arteries [5]. These main segments of the PPG along
with the peak height are shown in the figure below.
Figure 2 - A period of PPG showing the anacrotic and the catacrotic phase, dicrotic notch, as well as the PPG peak height.
7
3.2 Theory of measuring Blood Pressure using PPG Pulse Height
From the above PPG decomposition analysis, the peak height is the difference between the
maximum of a cardiac cycle and the previous minimum. This is the height of the pulsatile (AC)
component of the PPG. It is proportional to the difference between the arterial systolic and
diastolic pressures. However, this approach to measuring the blood pressure is not self sufficient
because the SBP and the DBP values cannot be calculated from the pulse height alone without
knowing a baseline blood pressure. Either the SBP or the DBP needs to be measured using
another approach to extract any useful information from the pulse height.
Calibration requirements of this technique necessitate the need to consider the alternative
approach of using the PPG pulse wave velocity.
3.3 Theory of measuring Blood Pressure using Pulse Transit Time
The second technique also provides beat-to-beat tracking of the blood pressure. In this approach
instead of the amplitude of the PPG waveform, the time variable was considered. The periodicity
and the continuous flow of the PPG waveform allows for a beat-to-beat analysis along several
interesting points on a peak.
Blood pressure is a function of cardiac output, which is the amount of blood volume output per
cycle. It was noted earlier that an increase in the flow rate of the blood causes the blood pressure
to rise. Thus, there exists a linear relationship between the blood pressure value and the rate at
which the blood travels in the arteries. This flow rate can be calculated if the pulse wave velocity
is known. Although, the PPG waveform is the technique used to measure blood flow in the
arteries, the factor that relates the flow to the blood pressure is the pulse transit time (PTT).
Determining the PTT is a difficult procedure.
8
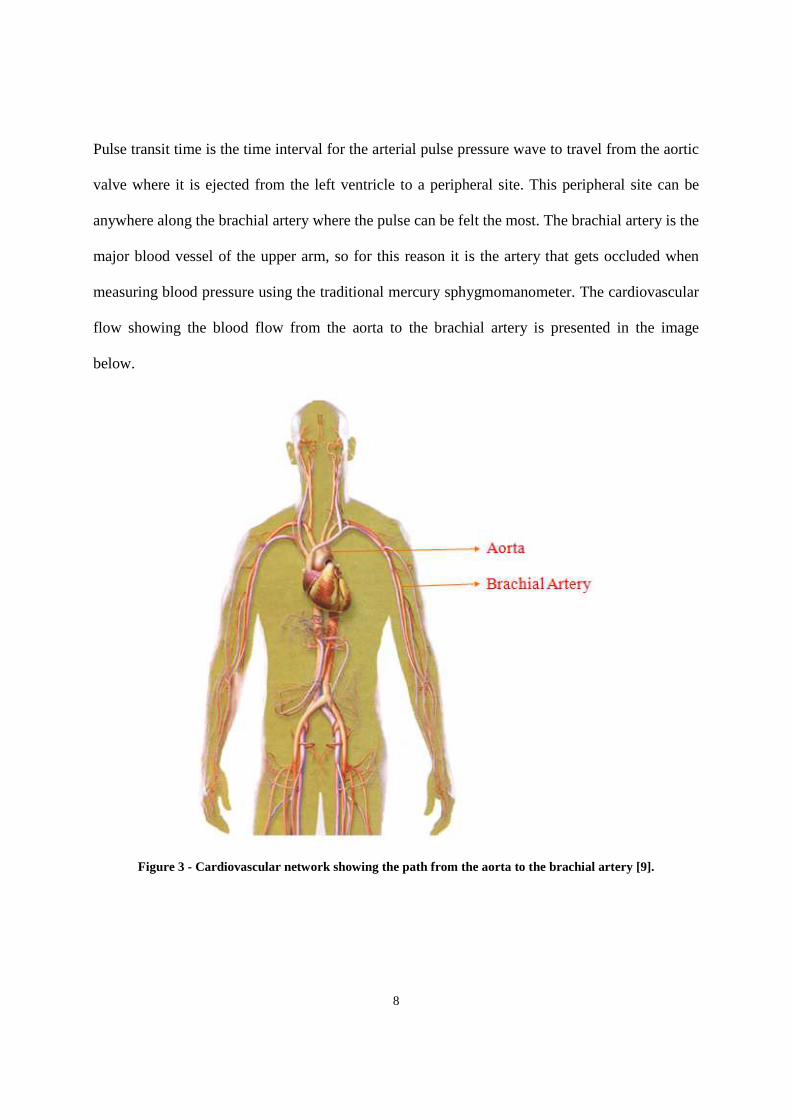
Pulse transit time is the time interval for the arterial pulse pressure wave to travel from the aortic
valve where it is ejected from the left ventricle to a peripheral site. This peripheral site can be
anywhere along the brachial artery where the pulse can be felt the most. The brachial artery is the
major blood vessel of the upper arm, so for this reason it is the artery that gets occluded when
measuring blood pressure using the traditional mercury sphygmomanometer. The cardiovascular
flow showing the blood flow from the aorta to the brachial artery is presented in the image
below.
Figure 3 - Cardiovascular network showing the path from the aorta to the brachial artery [9].
9
To determine the time at which the blood leaves the aortic valve an electrocardiogram (ECG) is
used. The QRS peak in the ECG waveform is a result of the ventricular contraction. Since, the R
value in the QRS peak is highest amplitude, it is used as the marker for the time when the blood
leaves the aortic valve. From this R peak value obtained, the PTT can be calculated.
The pulse transit time is calculated from the R peak in the ECG waveform to the foot of the PPG
wave at the peripheral site. To calculate the blood pressure using the PTT, it is important to note
the two quantities are related by an inverse relationship. This is because an increase in blood
pressure results in an increase in blood velocity which means the blood reaches the peripheral
site from the aortic valve in a smaller time interval. Consequently, a decrease in the blood
pressure corresponds to a longer pulse transit time.
3.3 Problem Statement
Although, direct measurements of blood pressure can be made using an invasive technique, a
non-invasive and less cumbersome approach is preferred. In the past, the correlation between the
pulse transit time and the arterial blood pressure is used to calculate the systolic and diastolic
blood pressure values. However, this technique requires the use of an ECG, that makes the
device bulky and unportable.
The problem is to design and develop an arterial blood pressure, heart rate variability, and
breathing rate monitoring device without using an ECG. The device must be non-invasive and
safe for the user to use. The device cannot be bulky and must not use the traditional cuff used in
the past to measure blood pressure. The device must output a positive voltage signal that can be
sent to the microprocessor. While software techniques can be used to filter instrumentation noise
and to clean the signal, much of the filtering must take place in the hardware circuitry. The
10
power requirements of the device are also limited. Since a 9 Volt battery is easily accessible and
safe to use, the preferred source voltage allowed for the hardware circuit is 9 Volts.
The device must provide a signal that can be used to calculate systolic and diastolic blood
pressure reading within reasonable error. Majority of the project component for measuring blood
pressure must be done in hardware. A transducer must be built that can be used on any
individual. The transducer must also be non-invasive and safe to use. Since the heart rate
variability and the breathing rate calculation are the minor components of the project, these
measurements can be done in software alone.
The budget allowed for the project is a maximum of $50 Canadian dollars. The completion
timeline of the project is seven months.
3.4 Methodology of Solution
3.4.1 Calculating Systolic and Diastolic Blood Pressure
The problem statement requires that the ECG may not be used. The theory of using the PPG peak
height requires some calculations that must be made. Therefore, a solution was found that
combines the aforementioned theories involving the peak height and the pulse transit time.
The pressure waves travel along the arterial walls and therefore propagate slower under low
blood pressure and faster under higher blood pressure. Thus, if the ECG in the pulse transit time
calculation is replaced by another PPG signal then this approach provides additional information.
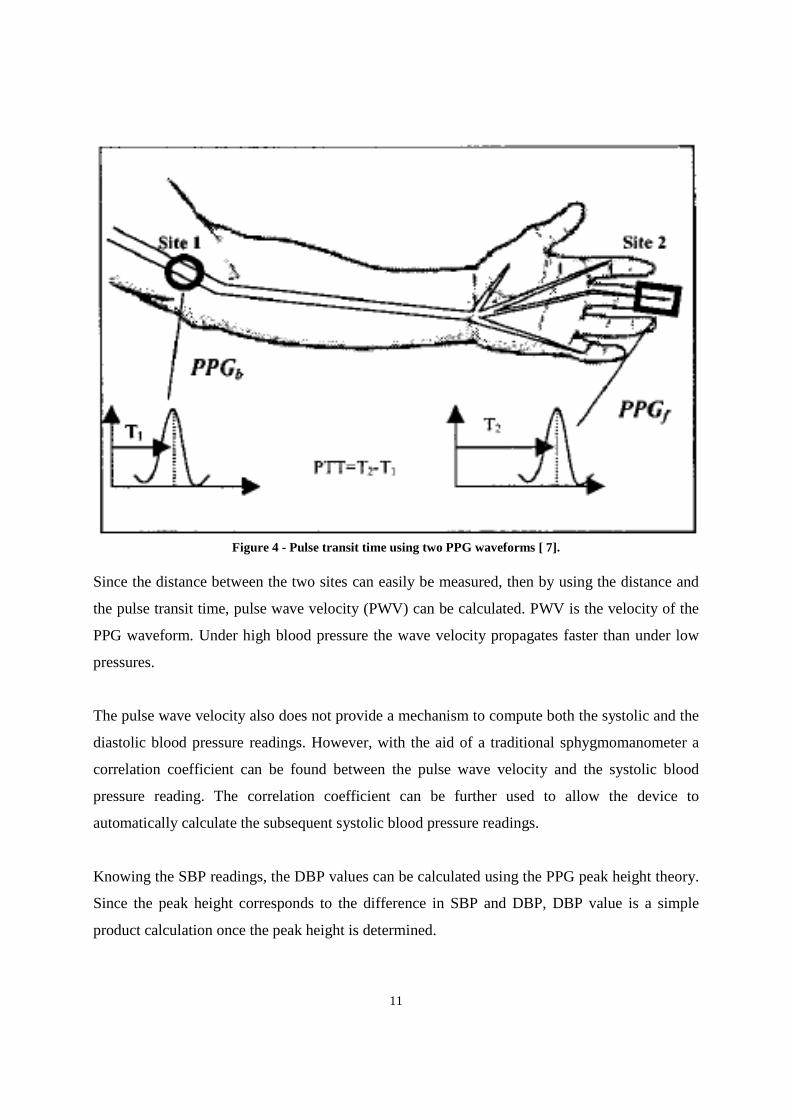
If a PPG waveform is taken at a site along the brachial artery near the end of the upper arm and
another PPG waveform is taken at the tip of the finger on the same side of the body, then the
travel time for the PPG pulse from one site to the other can be classified as the pulse transit time.
These two sites are clearly shown in the figure 4 below.
11
Figure 4 - Pulse transit time using two PPG waveforms [ 7].
Since the distance between the two sites can easily be measured, then by using the distance and
the pulse transit time, pulse wave velocity (PWV) can be calculated. PWV is the velocity of the
PPG waveform. Under high blood pressure the wave velocity propagates faster than under low
pressures.
The pulse wave velocity also does not provide a mechanism to compute both the systolic and the
diastolic blood pressure readings. However, with the aid of a traditional sphygmomanometer a
correlation coefficient can be found between the pulse wave velocity and the systolic blood
pressure reading. The correlation coefficient can be further used to allow the device to
automatically calculate the subsequent systolic blood pressure readings.
Knowing the SBP readings, the DBP values can be calculated using the PPG peak height theory.
Since the peak height corresponds to the difference in SBP and DBP, DBP value is a simple
product calculation once the peak height is determined.
12
3.4.2 Calculating Breathing Rate
As discussed in the literary review, inhaling air results in an increased amount of blood returned
to the heart due to the larger pressure gradient. Consequently, a larger volume of blood is also
ejected that corresponds to an increased cardiac output value. Since the cardiac output is directly
proportional to the blood pressure, the BP value also gets affected [4].
Respiration causes small variations in the peripheral circulation. These low frequency respiratory
induced intensity variations provide a mechanism to measure the breathing rate using the PPG
waveform [5].
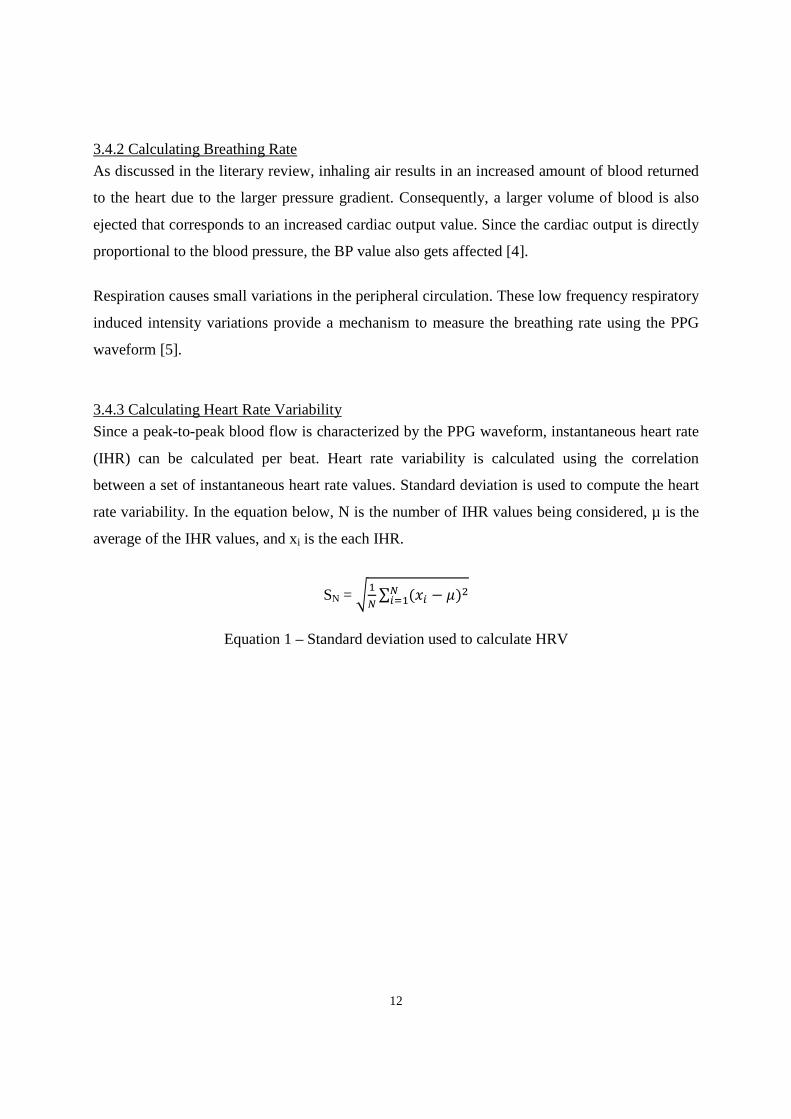
3.4.3 Calculating Heart Rate Variability
Since a peak-to-peak blood flow is characterized by the PPG waveform, instantaneous heart rate
(IHR) can be calculated per beat. Heart rate variability is calculated using the correlation
between a set of instantaneous heart rate values. Standard deviation is used to compute the heart
rate variability. In the equation below, N is the number of IHR values being considered, µ is the
average of the IHR values, and xi is the each IHR.
SN = ∑ ( − )
Equation 1 – Standard deviation used to calculate HRV
13
4 DESIGN PROCEDURES This section details the hardware and software designs used to implement the methodologies
described in the previous section. Specifically, major circuit components’ characteristics are
discussed, followed by the process of converting the light intensity variations caused by the
changing blood flow into a voltage signal. Then detailed circuit analysis is presented for the rest
of the hardware followed by the software algorithms.
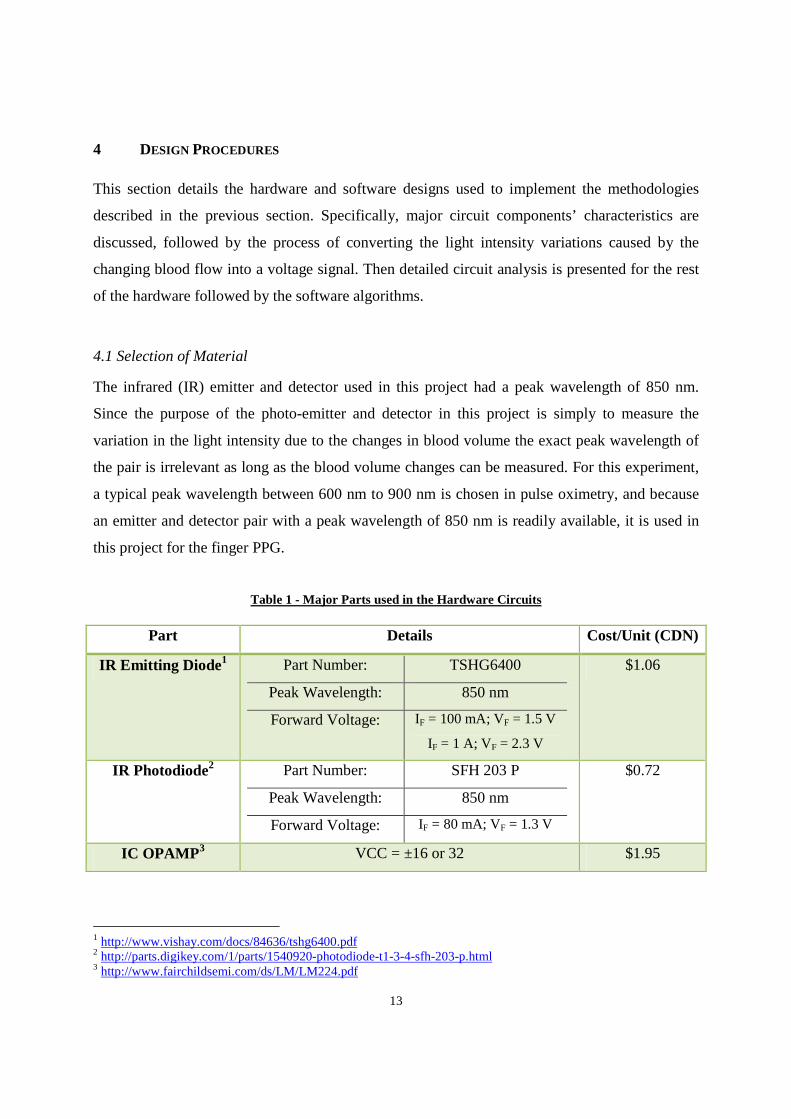
4.1 Selection of Material
The infrared (IR) emitter and detector used in this project had a peak wavelength of 850 nm.
Since the purpose of the photo-emitter and detector in this project is simply to measure the
variation in the light intensity due to the changes in blood volume the exact peak wavelength of
the pair is irrelevant as long as the blood volume changes can be measured. For this experiment,
a typical peak wavelength between 600 nm to 900 nm is chosen in pulse oximetry, and because
an emitter and detector pair with a peak wavelength of 850 nm is readily available, it is used in
this project for the finger PPG.
Table 1 - Major Parts used in the Hardware Circuits
Part Details Cost/Unit (CDN)
IR Emitting Diode 1 Part Number: TSHG6400
Peak Wavelength: 850 nm
Forward Voltage: IF = 100 mA; VF = 1.5 V
IF = 1 A; VF = 2.3 V
$1.06
IR Photodiode2 Part Number: SFH 203 P
Peak Wavelength: 850 nm
Forward Voltage: IF = 80 mA; VF = 1.3 V
$0.72
IC OPAMP 3 VCC = ±16 or 32 $1.95
1 http://www.vishay.com/docs/84636/tshg6400.pdf 2 http://parts.digikey.com/1/parts/1540920-photodiode-t1-3-4-sfh-203-p.html 3 http://www.fairchildsemi.com/ds/LM/LM224.pdf
14
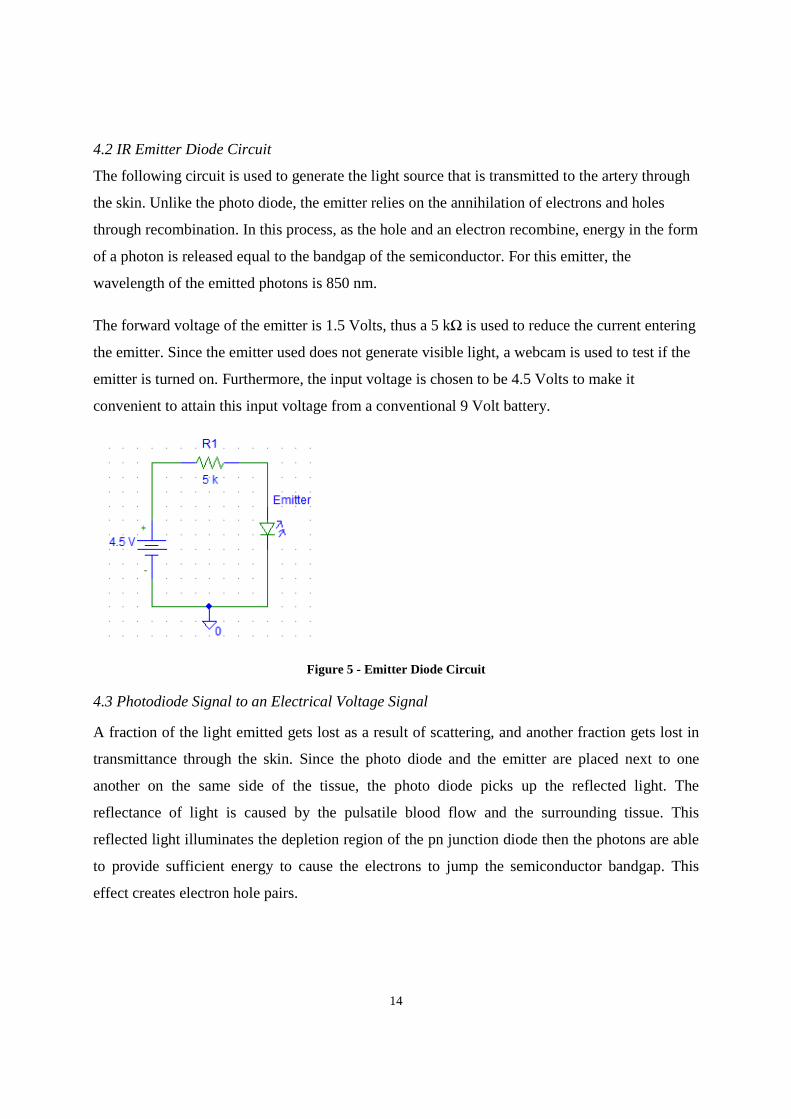
4.2 IR Emitter Diode Circuit
The following circuit is used to generate the light source that is transmitted to the artery through
the skin. Unlike the photo diode, the emitter relies on the annihilation of electrons and holes
through recombination. In this process, as the hole and an electron recombine, energy in the form
of a photon is released equal to the bandgap of the semiconductor. For this emitter, the
wavelength of the emitted photons is 850 nm.
The forward voltage of the emitter is 1.5 Volts, thus a 5 kΩ is used to reduce the current entering
the emitter. Since the emitter used does not generate visible light, a webcam is used to test if the
emitter is turned on. Furthermore, the input voltage is chosen to be 4.5 Volts to make it
convenient to attain this input voltage from a conventional 9 Volt battery.
Figure 5 - Emitter Diode Circuit
4.3 Photodiode Signal to an Electrical Voltage Signal
A fraction of the light emitted gets lost as a result of scattering, and another fraction gets lost in
transmittance through the skin. Since the photo diode and the emitter are placed next to one
another on the same side of the tissue, the photo diode picks up the reflected light. The
reflectance of light is caused by the pulsatile blood flow and the surrounding tissue. This
reflected light illuminates the depletion region of the pn junction diode then the photons are able
to provide sufficient energy to cause the electrons to jump the semiconductor bandgap. This
effect creates electron hole pairs.
15
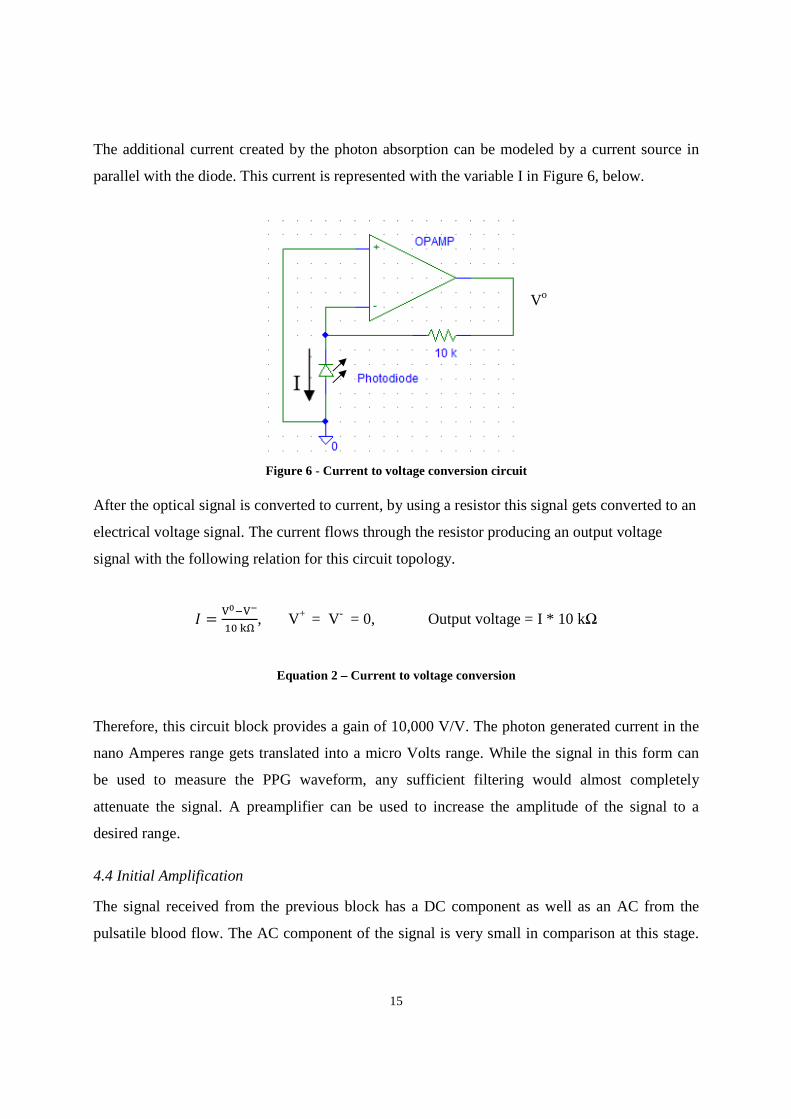
The additional current created by the photon absorption can be modeled by a current source in
parallel with the diode. This current is represented with the variable I in Figure 6, below.
Figure 6 - Current to voltage conversion circuit
After the optical signal is converted to current, by using a resistor this signal gets converted to an
electrical voltage signal. The current flows through the resistor producing an output voltage
signal with the following relation for this circuit topology.
, V+ = V- = 0, Output voltage = I * 10 kΩ
Equation 2 – Current to voltage conversion
Therefore, this circuit block provides a gain of 10,000 V/V. The photon generated current in the
nano Amperes range gets translated into a micro Volts range. While the signal in this form can
be used to measure the PPG waveform, any sufficient filtering would almost completely
attenuate the signal. A preamplifier can be used to increase the amplitude of the signal to a
desired range.
4.4 Initial Amplification
The signal received from the previous block has a DC component as well as an AC from the
pulsatile blood flow. The AC component of the signal is very small in comparison at this stage.
Vo
16
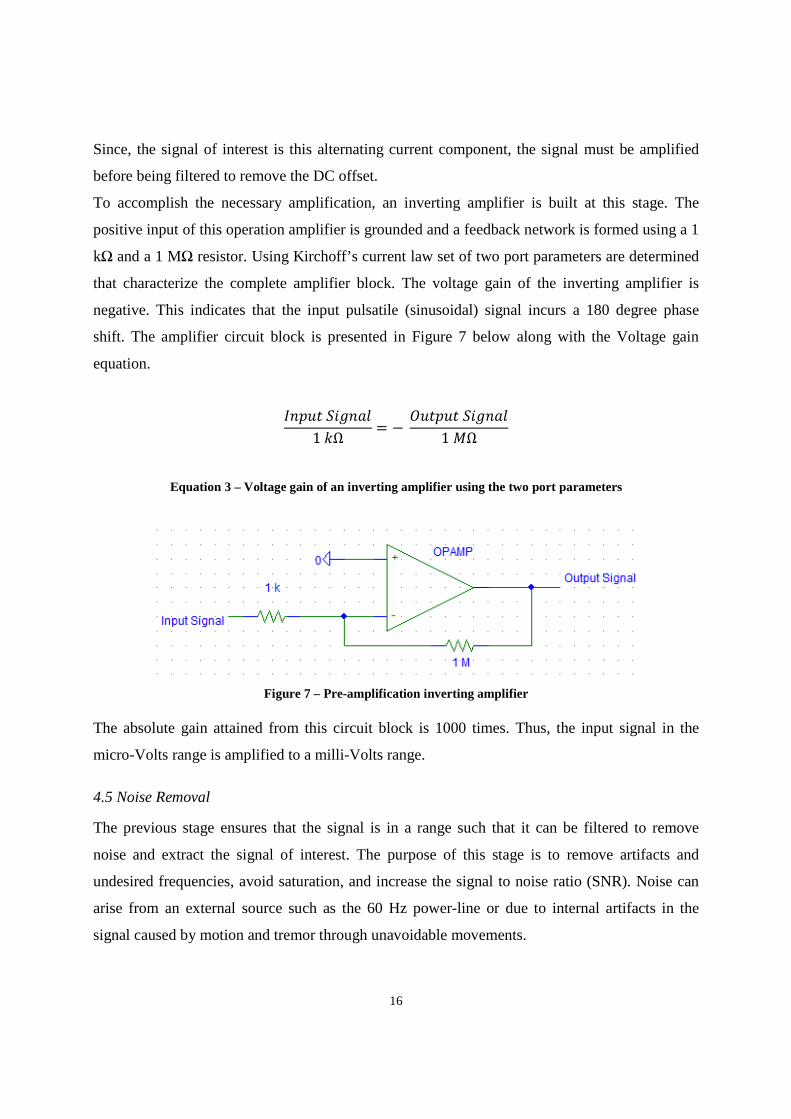
Since, the signal of interest is this alternating current component, the signal must be amplified
before being filtered to remove the DC offset.
To accomplish the necessary amplification, an inverting amplifier is built at this stage. The
positive input of this operation amplifier is grounded and a feedback network is formed using a 1
kΩ and a 1 MΩ resistor. Using Kirchoff’s current law set of two port parameters are determined
that characterize the complete amplifier block. The voltage gain of the inverting amplifier is
negative. This indicates that the input pulsatile (sinusoidal) signal incurs a 180 degree phase
shift. The amplifier circuit block is presented in Figure 7 below along with the Voltage gain
equation.
1 !Ω = − # 1 $Ω
Equation 3 – Voltage gain of an inverting amplifier using the two port parameters
Figure 7 – Pre-amplification inverting amplifier
The absolute gain attained from this circuit block is 1000 times. Thus, the input signal in the
micro-Volts range is amplified to a milli-Volts range.
4.5 Noise Removal
The previous stage ensures that the signal is in a range such that it can be filtered to remove
noise and extract the signal of interest. The purpose of this stage is to remove artifacts and
undesired frequencies, avoid saturation, and increase the signal to noise ratio (SNR). Noise can
arise from an external source such as the 60 Hz power-line or due to internal artifacts in the
signal caused by motion and tremor through unavoidable movements.
17
Artifacts in a signal often occur due to interference, which is the imposition of the unwanted
signal on the signal of interest. While the low frequency respiratory induced intensity variations
in the photo diode signal are of primary interest in determining the breathing rate, it is a source
of noise in the PPG waveform used to calculate pulse transit time.
The DC offset in the photo diode optical signal contains no useful information for any
calculation and therefore needs to be attenuated to the maximum. This attenuation can be made
possibly by considering the differences in the way the DC and the AC signal are being generated.
The DC offset arises due to the reflectance of light from the tissue surrounding the pulsatile
blood flow, and the significant property of this tissue is that it does not change in any shape or
form in a small period of time. Then assuming that the DC offset will always be non-changing, it
can be removed by passing the signal through a high pass filter. Since the DC offset has no
frequency components above 0 Hz, any cut-off above this value for the high pass filter should
attenuate the DC signal. However, because the filters do not cut off frequency components
sharply the roll off property requires that the cut off frequency be slightly above the desired cut
off value.
Another major source of noise in the signal was originating from the ambient noise. Although,
the photo diode has a peak wavelength of 850 nm, it does take in photons with slightly different
energy levels. The lighting in the room was being picked up by photo diode as the optical signal
that distorts the PPG waveform. This was observed after passing the voltage signal through a
high pass filter. While the filtering removed the DC offset, the AC signal was extremely noisy.
The zoom function on the oscilloscope allowed the identification of a 60 Hz sinusoidal signal
embedded in the PPG waveform. This noise was removed from the spectrum by suppressing all
frequency components above 40 Hz. This task can be accomplished through the use of a low
pass filter with a cut off frequency significantly lower than the 50-60 Hz ambient noise.
Motion artifact is another main source of noise. Since complete immobility of the arm or finger
where the PPG transducer is placed is not realistic, some correction to remove this artifact needs
to be implemented in the hardware circuitry. Although, the interference due to this
nondeterministic noise can have large amplitudes, its frequency range is below 10 Hz [10].
18
Therefore, to reduce the impact of motion artifact on the PPG waveform a cut-off for the high
pass filter must be below 10 Hz. However, to determine the exact cut-off frequency the signal of
interest needs further analysis.
The removal of the DC offset and the ambient noise require in combination a band pass filter.
The band pass filter can be realized by combining the characteristics of the low-pass and high-
pass filters. Revising the signal of interest is helpful in designing the cut-off frequencies of the
band pass filter. The PPG signal is essentially a beat-to-beat blood flow waveform varying
according to the cardiac output and the heart rate. The slight variations in the cardiac output are
of interest in calculating the breathing rate. However, the heart rate is the major characterizing
aspect of the PPG waveform. A typical heart rate of 60 beats per minute (bpm) corresponds to 1
Hz. According to the Heart and Stroke Foundation, a normal heart rate is around 60 to 80 bpm4.
Thus, a lower cut-off of 30 bpm corresponding to 0.5 Hz for the band pass filter should pass the
signal of interest while attenuating the 0 Hz DC offset. Similarly, the upper cut-off frequency can
be selected by suppressing any signal above 3.5 Hz (210 bpm). This cut-off will ensure the
removal of any interference from the ambient noise and much of the motion artifact.
In determining the cut-off frequencies for the filter excessive bandwidth is avoided as it allows
passage of voltage signals that tend to obscure the bioelectric signal of interest.
4.6.1 Active Signal Filtering
A filter is a circuit that is used to attenuate the undesired frequency components causing
interference. Active filters make use of amplifiers in addition to the passive components such as
resistors and capacitors, in order to obtain better performance than offered by the passive filters.
Analog filters are based on the mathematical operator of differentiation. The DC component in
the signal is removed by the derivative operator. In this respect, the gain increases linearly with
frequency. Thus, higher frequencies receive linearly increasing gain that results in the attenuation
of the 0 Hz.
4 http://www.heartandstroke.com/site/c.ikIQLcMWJtE/b.3532069/k.5F46/Anatomy_of_the_Heart.htm
19
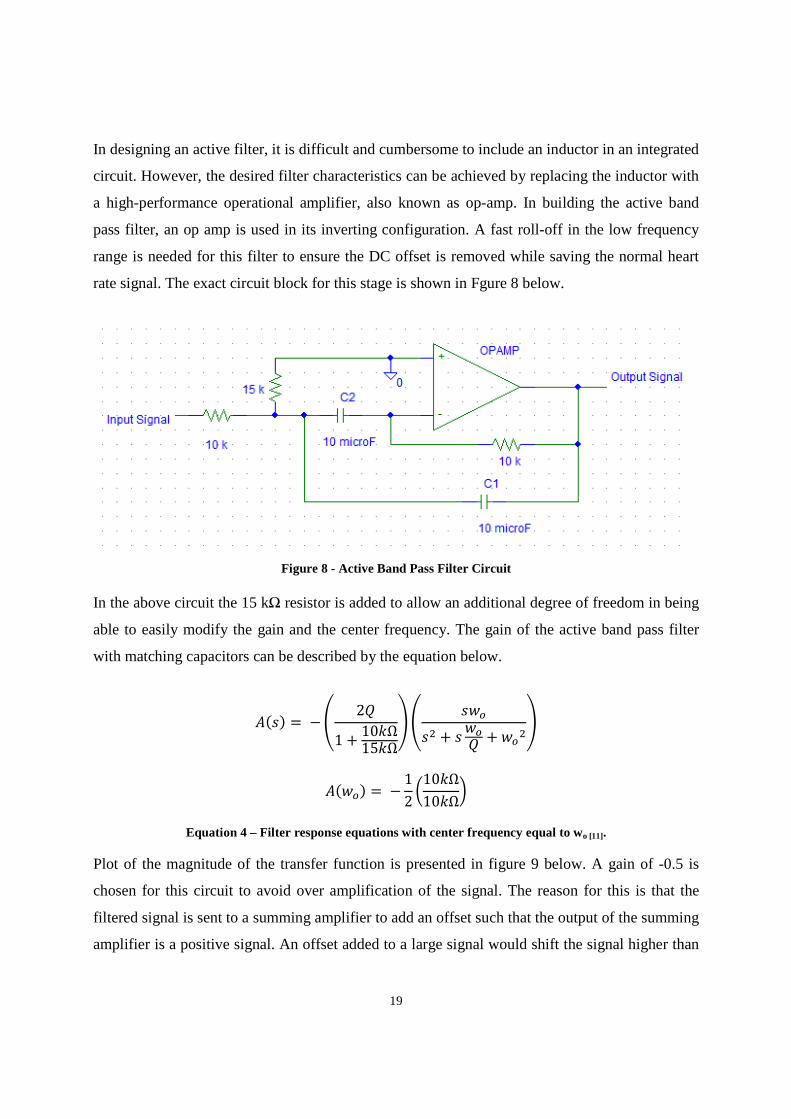
In designing an active filter, it is difficult and cumbersome to include an inductor in an integrated
circuit. However, the desired filter characteristics can be achieved by replacing the inductor with
a high-performance operational amplifier, also known as op-amp. In building the active band
pass filter, an op amp is used in its inverting configuration. A fast roll-off in the low frequency
range is needed for this filter to ensure the DC offset is removed while saving the normal heart
rate signal. The exact circuit block for this stage is shown in Fgure 8 below.
Figure 8 - Active Band Pass Filter Circuit
In the above circuit the 15 kΩ resistor is added to allow an additional degree of freedom in being
able to easily modify the gain and the center frequency. The gain of the active band pass filter
with matching capacitors can be described by the equation below.
%& = − ' 2)1 + 10!Ω15!Ω- ' &./& + & ./) + ./-
%./ = − 12 010!Ω10!Ω1
Equation 4 – Filter response equations with center frequency equal to wo [11].
Plot of the magnitude of the transfer function is presented in figure 9 below. A gain of -0.5 is
chosen for this circuit to avoid over amplification of the signal. The reason for this is that the
filtered signal is sent to a summing amplifier to add an offset such that the output of the summing
amplifier is a positive signal. An offset added to a large signal would shift the signal higher than
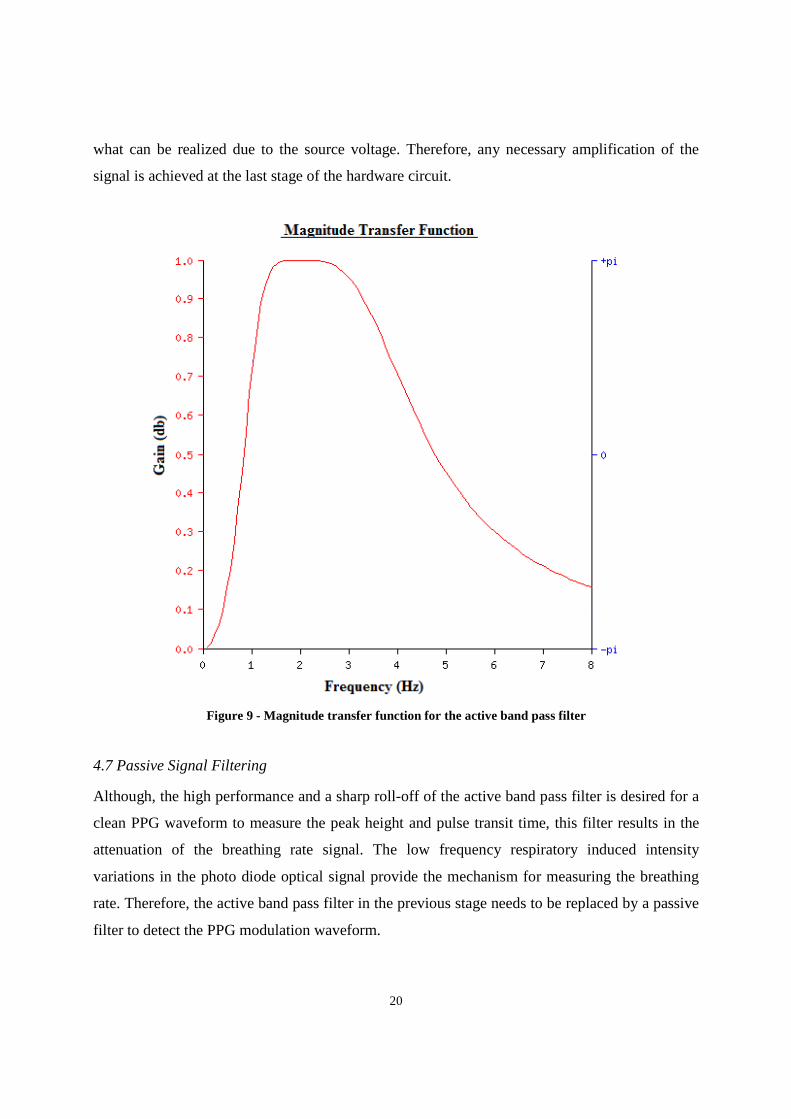
20
what can be realized due to the source voltage. Therefore, any necessary amplification of the
signal is achieved at the last stage of the hardware circuit.
Figure 9 - Magnitude transfer function for the active band pass filter
4.7 Passive Signal Filtering
Although, the high performance and a sharp roll-off of the active band pass filter is desired for a
clean PPG waveform to measure the peak height and pulse transit time, this filter results in the
attenuation of the breathing rate signal. The low frequency respiratory induced intensity
variations in the photo diode optical signal provide the mechanism for measuring the breathing
rate. Therefore, the active band pass filter in the previous stage needs to be replaced by a passive
filter to detect the PPG modulation waveform.
21
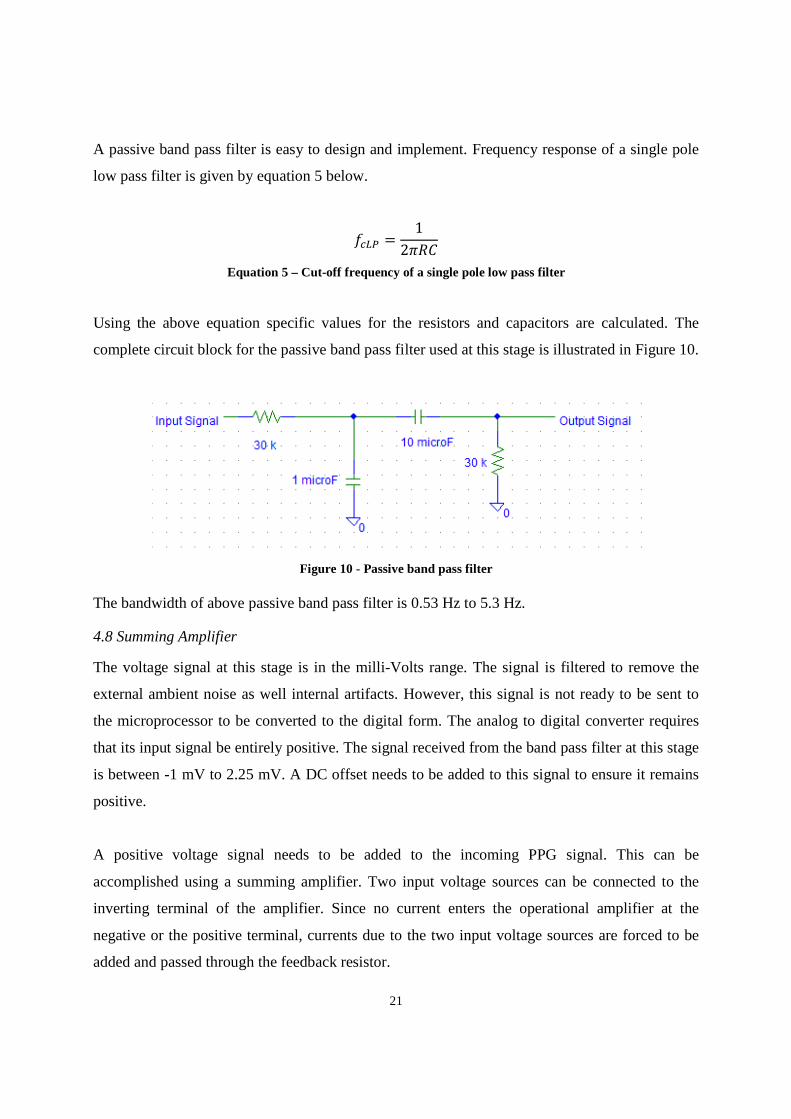
A passive band pass filter is easy to design and implement. Frequency response of a single pole
low pass filter is given by equation 5 below.
2345 = 12678
Equation 5 – Cut-off frequency of a single pole low pass filter
Using the above equation specific values for the resistors and capacitors are calculated. The
complete circuit block for the passive band pass filter used at this stage is illustrated in Figure 10.
Figure 10 - Passive band pass filter
The bandwidth of above passive band pass filter is 0.53 Hz to 5.3 Hz.
4.8 Summing Amplifier
The voltage signal at this stage is in the milli-Volts range. The signal is filtered to remove the
external ambient noise as well internal artifacts. However, this signal is not ready to be sent to
the microprocessor to be converted to the digital form. The analog to digital converter requires
that its input signal be entirely positive. The signal received from the band pass filter at this stage
is between -1 mV to 2.25 mV. A DC offset needs to be added to this signal to ensure it remains
positive.
A positive voltage signal needs to be added to the incoming PPG signal. This can be
accomplished using a summing amplifier. Two input voltage sources can be connected to the
inverting terminal of the amplifier. Since no current enters the operational amplifier at the
negative or the positive terminal, currents due to the two input voltage sources are forced to be
added and passed through the feedback resistor.
22
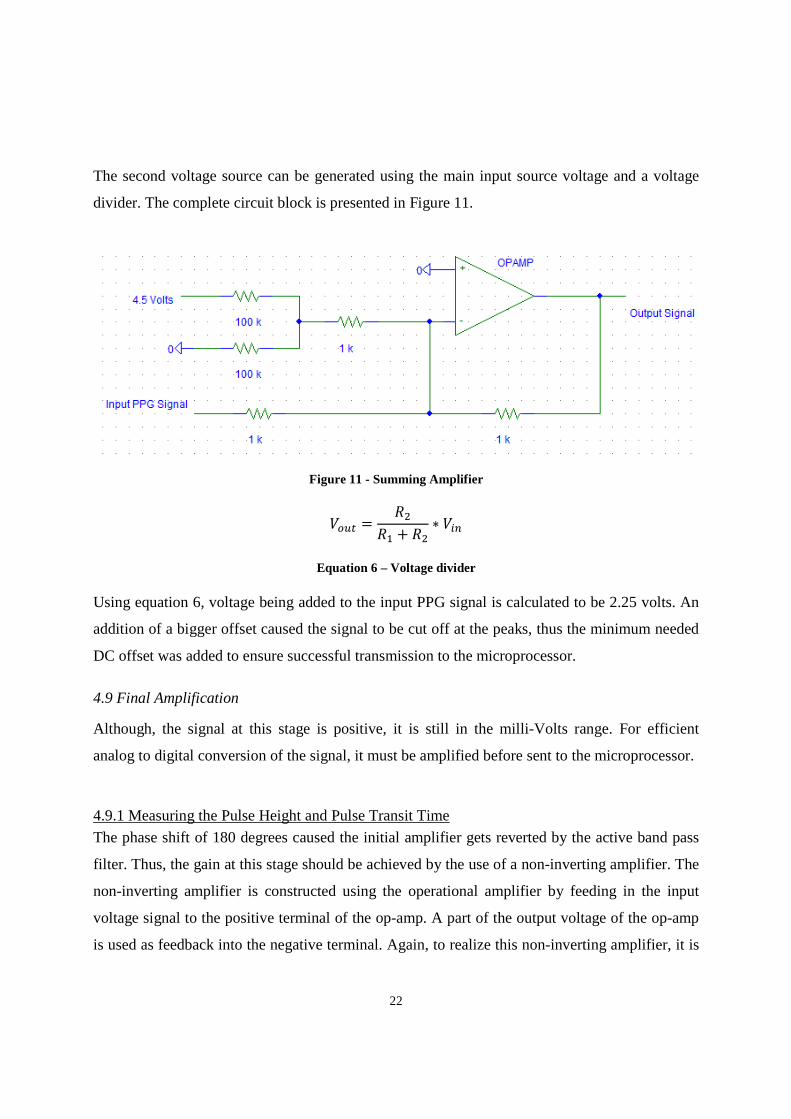
The second voltage source can be generated using the main input source voltage and a voltage
divider. The complete circuit block is presented in Figure 11.
Figure 11 - Summing Amplifier
9/:; = 77 + 7 ∗ 9=
Equation 6 – Voltage divider
Using equation 6, voltage being added to the input PPG signal is calculated to be 2.25 volts. An
addition of a bigger offset caused the signal to be cut off at the peaks, thus the minimum needed
DC offset was added to ensure successful transmission to the microprocessor.
4.9 Final Amplification
Although, the signal at this stage is positive, it is still in the milli-Volts range. For efficient
analog to digital conversion of the signal, it must be amplified before sent to the microprocessor.
4.9.1 Measuring the Pulse Height and Pulse Transit Time
The phase shift of 180 degrees caused the initial amplifier gets reverted by the active band pass
filter. Thus, the gain at this stage should be achieved by the use of a non-inverting amplifier. The
non-inverting amplifier is constructed using the operational amplifier by feeding in the input
voltage signal to the positive terminal of the op-amp. A part of the output voltage of the op-amp
is used as feedback into the negative terminal. Again, to realize this non-inverting amplifier, it is
23
assumed that the operational amplifier is ideal and the current fed into the negative terminal of
the op-amp is zero. The resulting gain is given by the equation 7.
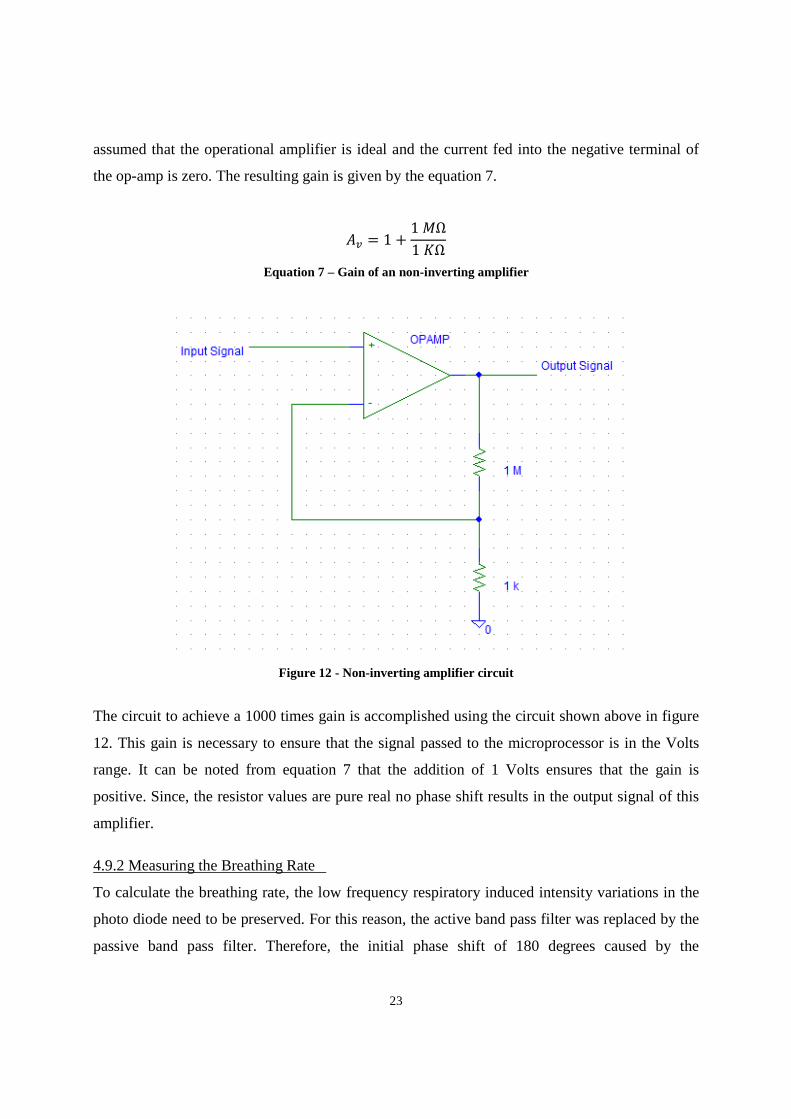
%> = 1 + 1 $Ω1 ?Ω
Equation 7 – Gain of an non-inverting amplifier
Figure 12 - Non-inverting amplifier circuit
The circuit to achieve a 1000 times gain is accomplished using the circuit shown above in figure
12. This gain is necessary to ensure that the signal passed to the microprocessor is in the Volts
range. It can be noted from equation 7 that the addition of 1 Volts ensures that the gain is
positive. Since, the resistor values are pure real no phase shift results in the output signal of this
amplifier.
4.9.2 Measuring the Breathing Rate
To calculate the breathing rate, the low frequency respiratory induced intensity variations in the
photo diode need to be preserved. For this reason, the active band pass filter was replaced by the
passive band pass filter. Therefore, the initial phase shift of 180 degrees caused by the
24
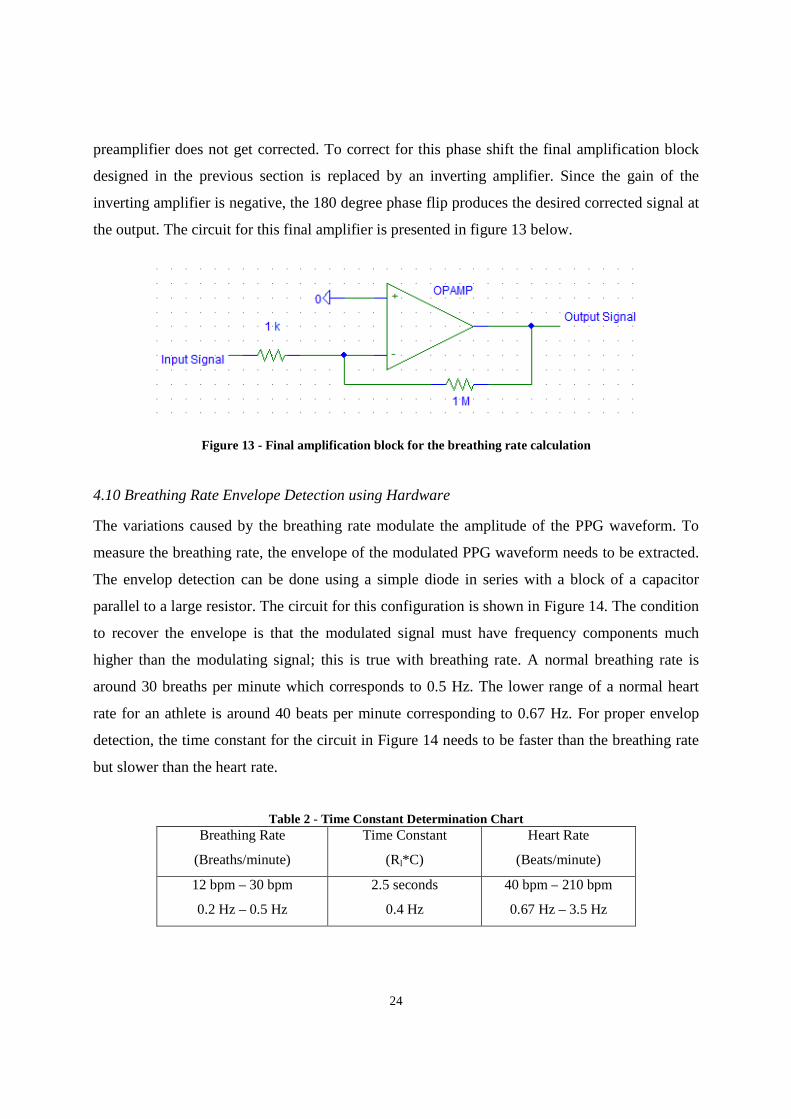
preamplifier does not get corrected. To correct for this phase shift the final amplification block
designed in the previous section is replaced by an inverting amplifier. Since the gain of the
inverting amplifier is negative, the 180 degree phase flip produces the desired corrected signal at
the output. The circuit for this final amplifier is presented in figure 13 below.
Figure 13 - Final amplification block for the breathing rate calculation
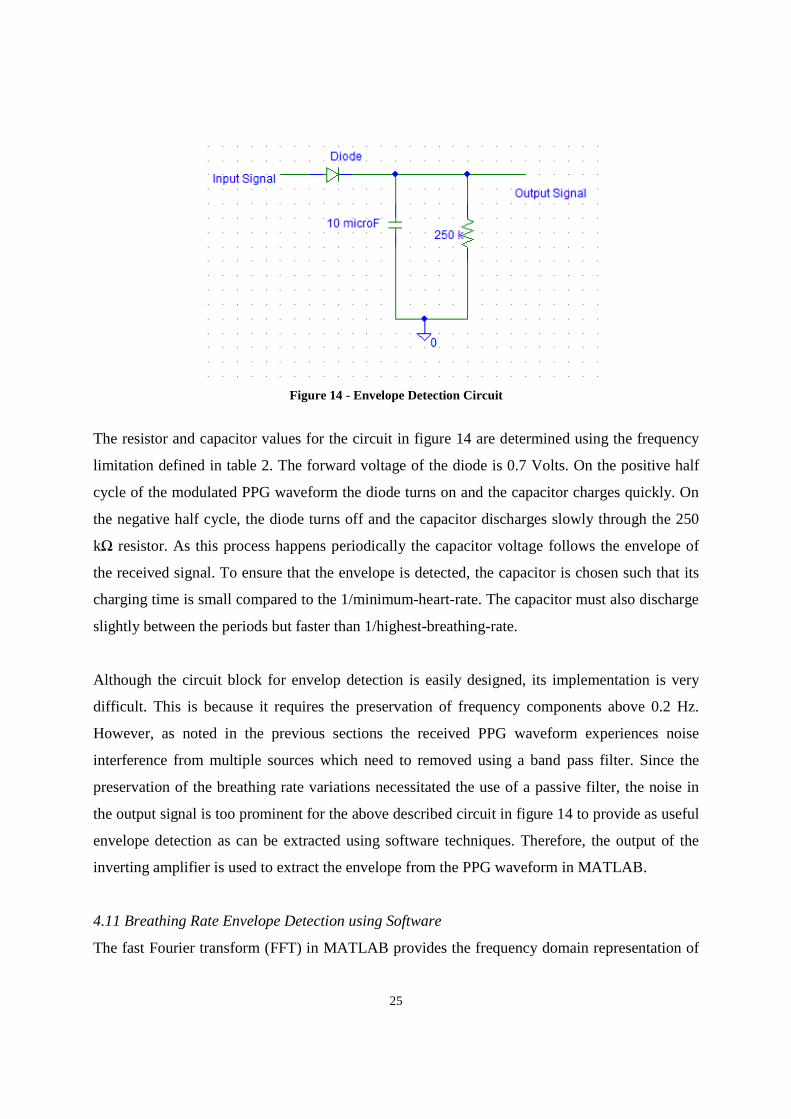
4.10 Breathing Rate Envelope Detection using Hardware
The variations caused by the breathing rate modulate the amplitude of the PPG waveform. To
measure the breathing rate, the envelope of the modulated PPG waveform needs to be extracted.
The envelop detection can be done using a simple diode in series with a block of a capacitor
parallel to a large resistor. The circuit for this configuration is shown in Figure 14. The condition
to recover the envelope is that the modulated signal must have frequency components much
higher than the modulating signal; this is true with breathing rate. A normal breathing rate is
around 30 breaths per minute which corresponds to 0.5 Hz. The lower range of a normal heart
rate for an athlete is around 40 beats per minute corresponding to 0.67 Hz. For proper envelop
detection, the time constant for the circuit in Figure 14 needs to be faster than the breathing rate
but slower than the heart rate.
Table 2 - Time Constant Determination Chart Breathing Rate
(Breaths/minute)
Time Constant
(Rl*C)
Heart Rate
(Beats/minute)
12 bpm – 30 bpm
0.2 Hz – 0.5 Hz
2.5 seconds
0.4 Hz
40 bpm – 210 bpm
0.67 Hz – 3.5 Hz
25
Figure 14 - Envelope Detection Circuit
The resistor and capacitor values for the circuit in figure 14 are determined using the frequency
limitation defined in table 2. The forward voltage of the diode is 0.7 Volts. On the positive half
cycle of the modulated PPG waveform the diode turns on and the capacitor charges quickly. On
the negative half cycle, the diode turns off and the capacitor discharges slowly through the 250
kΩ resistor. As this process happens periodically the capacitor voltage follows the envelope of
the received signal. To ensure that the envelope is detected, the capacitor is chosen such that its
charging time is small compared to the 1/minimum-heart-rate. The capacitor must also discharge
slightly between the periods but faster than 1/highest-breathing-rate.
Although the circuit block for envelop detection is easily designed, its implementation is very
difficult. This is because it requires the preservation of frequency components above 0.2 Hz.
However, as noted in the previous sections the received PPG waveform experiences noise
interference from multiple sources which need to removed using a band pass filter. Since the
preservation of the breathing rate variations necessitated the use of a passive filter, the noise in
the output signal is too prominent for the above described circuit in figure 14 to provide as useful
envelope detection as can be extracted using software techniques. Therefore, the output of the
inverting amplifier is used to extract the envelope from the PPG waveform in MATLAB.
4.11 Breathing Rate Envelope Detection using Software
The fast Fourier transform (FFT) in MATLAB provides the frequency domain representation of

26
the time domain signal. This operation applied to the modulated PPG waveform presents all
frequency components in the signal. Zeroing all frequency above the maximum breathing rate
frequency provides the modulating envelope.
27
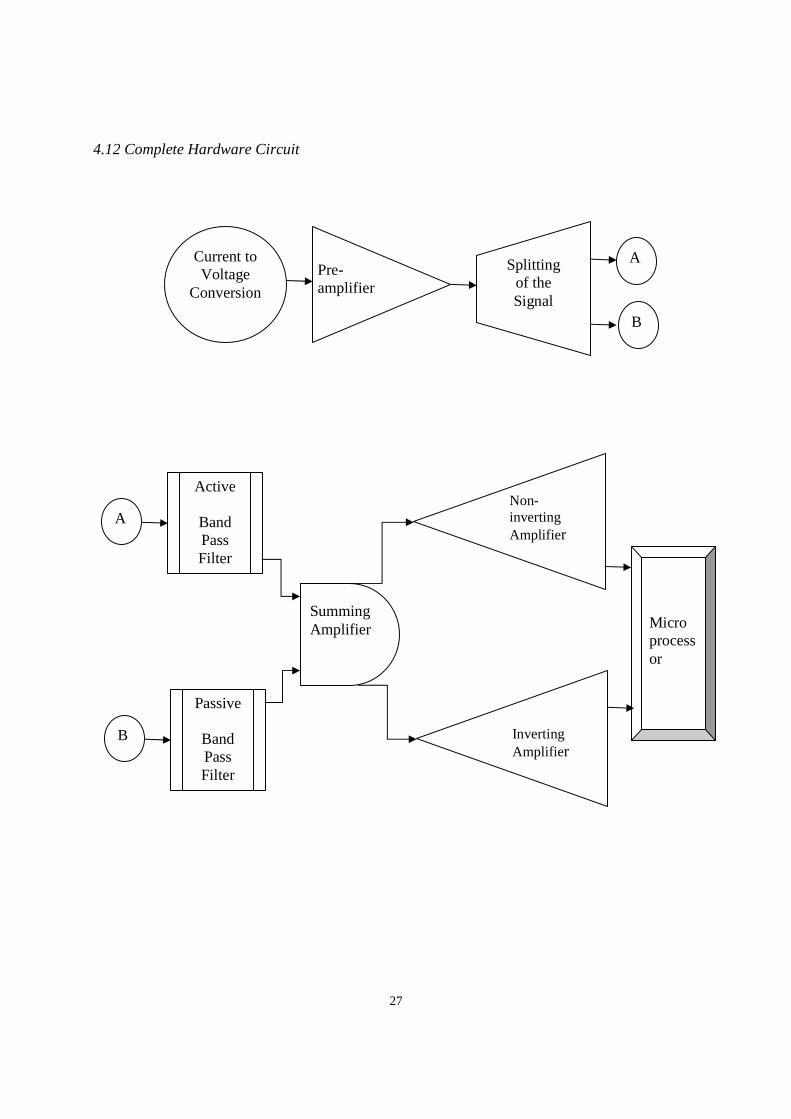
4.12 Complete Hardware Circuit
Current to Voltage
Conversion
Pre-amplifier
Splitting of the Signal
A
B
A
Active
Band Pass Filter
Summing Amplifier
Non-inverting Amplifier
Micro processor
B
Passive
Band Pass Filter
Inverting Amplifier
28
5 RESULTS AND DISCUSSION This section focuses on testing procedures and the results obtained. Since the implemented
hardware circuit is non-invasive and does not pass any sort of electrical signal to the user, the
device is safe to use.
5.1 Testing
The testing subject was a healthy 23 year old male university student, Omer Waseem. Omer is a
member of the NIHMS team who designed and implemented the microprocessor and the
Bluetooth hardware as well as the software components.
Although much of the noise was filtered using the band pass filter some noise was still present in
the signal. The sources of this noise were ambient light and motion artifact. Omer was asked to
remain as calm and still as possible. The impact of the ambient noise was reduced by covering
Omer’s finger with a dark cloth after the photo diode and the emitter were attached. While this
significantly cleaned the PPG waveform on the oscilloscope further stability was required.
Holding the photo diode and emitter in the other hand introduced motion artifact due to
unavoidable tremor. To minimize this artifact a proper transducer was required to keep the photo
diode and emitter in place.
To obtain a good waveform, the photo diode and the emitter had to be placed very close to each
other with a specific orientation. This further increased the need for a transducer. The first
prototype of the transducer was built using Styrofoam. It was used because of the flexibility it
provides in positioning the diodes. The Styrofoam also helped in covering the photo diode from
ambient light. The leads of the photo diode and emitter were separated using electrical tape to
avoid having them touch each other. Though, the transducer worked well for detecting the PPG
waveform on the tip of the index finger, the transducer did not work for the brachial site.
Two PPG waveforms are needed at two different sites along the arm length to determine the
pulse transit time. Exact replication of the same hardware circuit with another transducer was
needed to detect the waveform along the brachial artery. Since, Yousuf Jawahar, another member
of the NIHMS team implemented the PPG hardware for the calculation of blood oxygen
29
saturation, his device was used to pick up the PPG waveform at the second site simultaneously.
Though, the both of the circuits were able to detect the PPG waveform at the tips of the finger,
none worked for the site along the brachial artery on the upper arm.
After an exhaustive number of testing trials a new design of the transducer was built using a
small cup with a diameter size of 0.5 inches and a width of approximately 0.75 inches. Holes
were made on the bottom of the cup to insert the leads of the diodes. The other topless end of the
cup was attached to the brachial site on the arm. This transducer was less bulky than the
Styrofoam, however, it was not easy to relocate the transducer to a slightly different position
along the brachial artery. This transducer was also not helpful in detecting a PPG waveform
anywhere along the upper arm.
A third transducer was built using a small flashlight. The flashlight was disassembled to remove
the original components in it. The leads of the photo diode and the emitter were soldered to long
wires and pushed through to the back of the flashlight. An illustration of this transducer is
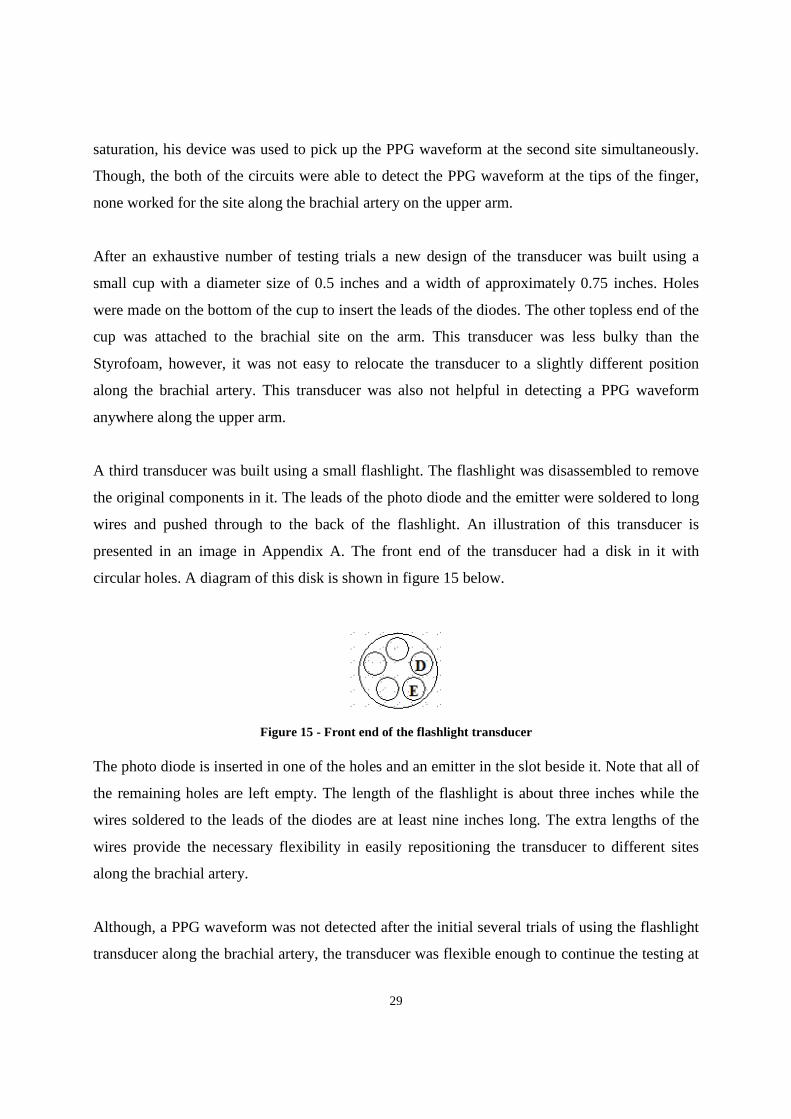
presented in an image in Appendix A. The front end of the transducer had a disk in it with
circular holes. A diagram of this disk is shown in figure 15 below.
Figure 15 - Front end of the flashlight transducer
The photo diode is inserted in one of the holes and an emitter in the slot beside it. Note that all of
the remaining holes are left empty. The length of the flashlight is about three inches while the
wires soldered to the leads of the diodes are at least nine inches long. The extra lengths of the
wires provide the necessary flexibility in easily repositioning the transducer to different sites
along the brachial artery.
Although, a PPG waveform was not detected after the initial several trials of using the flashlight
transducer along the brachial artery, the transducer was flexible enough to continue the testing at
30
other sites. An exhaustive set of trials eventually provided a small PPG waveform measured
along the brachial artery near the left arm elbow.
The difficulty encountered in detecting the PPG waveform at a site on the upper arm was due to
the excessive amount of tissue, bone and muscle mass present. The brachial artery is embedded
in this mesh and so it does not receive the light emitted by the LED in a sufficient quantity. For
the same reason, a huge fraction of the light gets lost in transmittance through tissue or is
returned as reflectance resulting in a large DC output signal. Once a site along the arm near the
elbow was found it was marked with a pen. A picture of this marked site is included in Appendix
A.
The device and the transducer were tested with several individual and consistent results were
received. A PPG waveform was easily detected along the tip of the finger but a few trials were
needed to pick up the PPG signal from the brachial site.
Furthermore, the hardware circuit designed for the breathing rate envelope detection was tested
however, unsatisfactory results are obtained. The amount of noise filtering needed to be reduced
to allow the respiratory induced variations in the PPG waveform to be noticeable. This largely
decreased the signal to noise ratio. Amplification of the signal did not aid as it would also
amplify the noise embedded in the signal. After fine tuning the cut off frequencies of the filters a
noticeable modulation of the PPG waveform by the breathing rate was observed. Hardware
approach to envelop detection was replaced by MATLAB software as it provided a much cleaner
envelope.
5.2 Hardware Results
This section includes results obtained from the hardware before any data processing is
performed. In order for the analog to digital converter to properly sample and convert the signal,
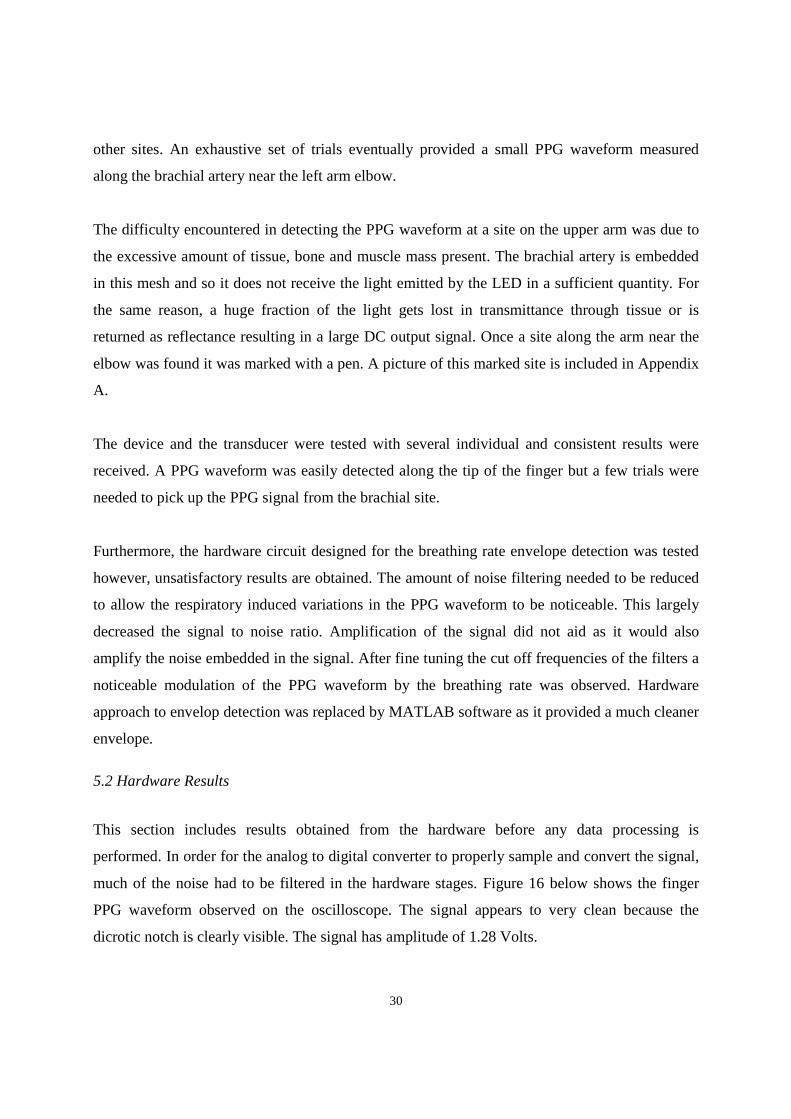
much of the noise had to be filtered in the hardware stages. Figure 16 below shows the finger
PPG waveform observed on the oscilloscope. The signal appears to very clean because the
dicrotic notch is clearly visible. The signal has amplitude of 1.28 Volts.
31
Figure 16 - Finger PPG waveform observed on the oscilloscope
The above figure is the test result of Yousuf Jawahar’s finger PPG waveform. This waveform
can be used to calculate the heart rate variability and to measure the peak height. However, a
single PPG waveform is not useful enough as it does not provide the pulse transit time.
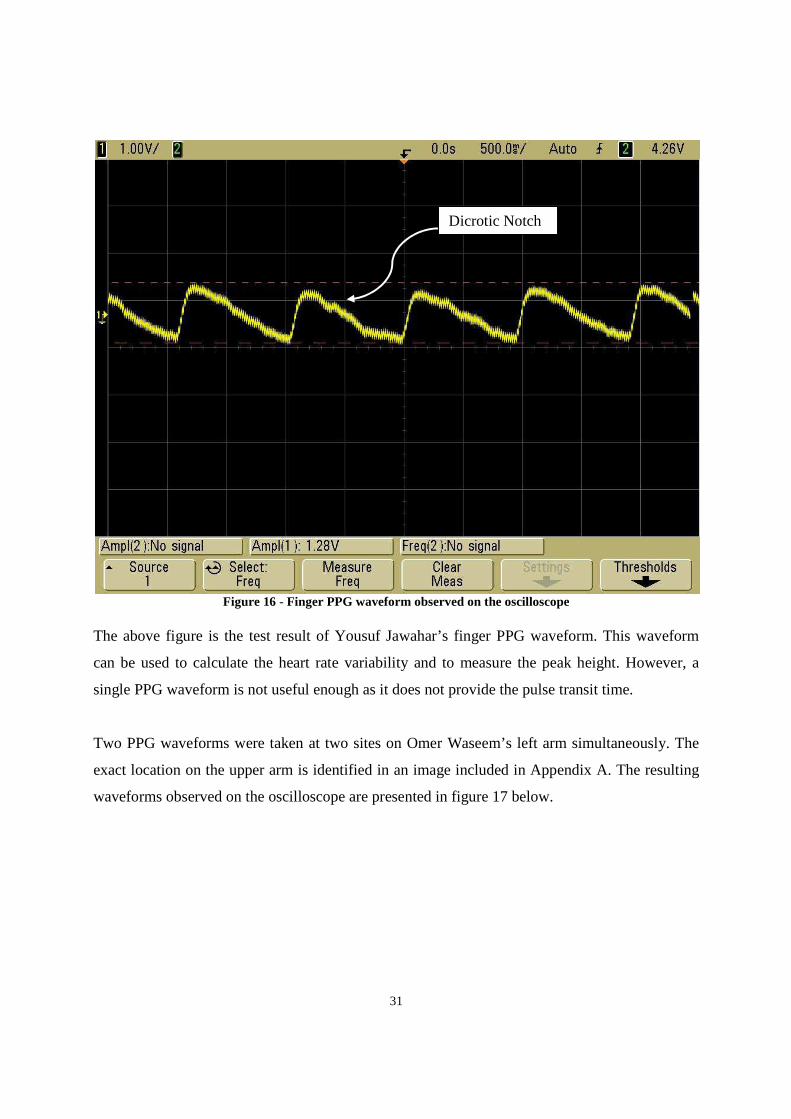
Two PPG waveforms were taken at two sites on Omer Waseem’s left arm simultaneously. The
exact location on the upper arm is identified in an image included in Appendix A. The resulting
waveforms observed on the oscilloscope are presented in figure 17 below.
Dicrotic Notch
32
Figure 17 - Brachial PPG (top), Finger PPG (bottom)
Real time clean PPG signals in Figure 17 from hardware filtering alone proves the successful
working state of the developed hardware. The top waveform is the brachial PPG and the bottom
is the finger PPG. The traditional sphygmomanometer’s cuff was placed on Omer’s right upper
arm to determine his systolic and diastolic blood pressure at the same time as receiving the two
PPG waveforms. The purpose of this trial was to determine the correlation coefficient between
the actual SBP/DBP and the PPG peak height and pulse transit time. His heart rate recorded at
the time along with several blood pressure readings are tabulated below in table 3.
33
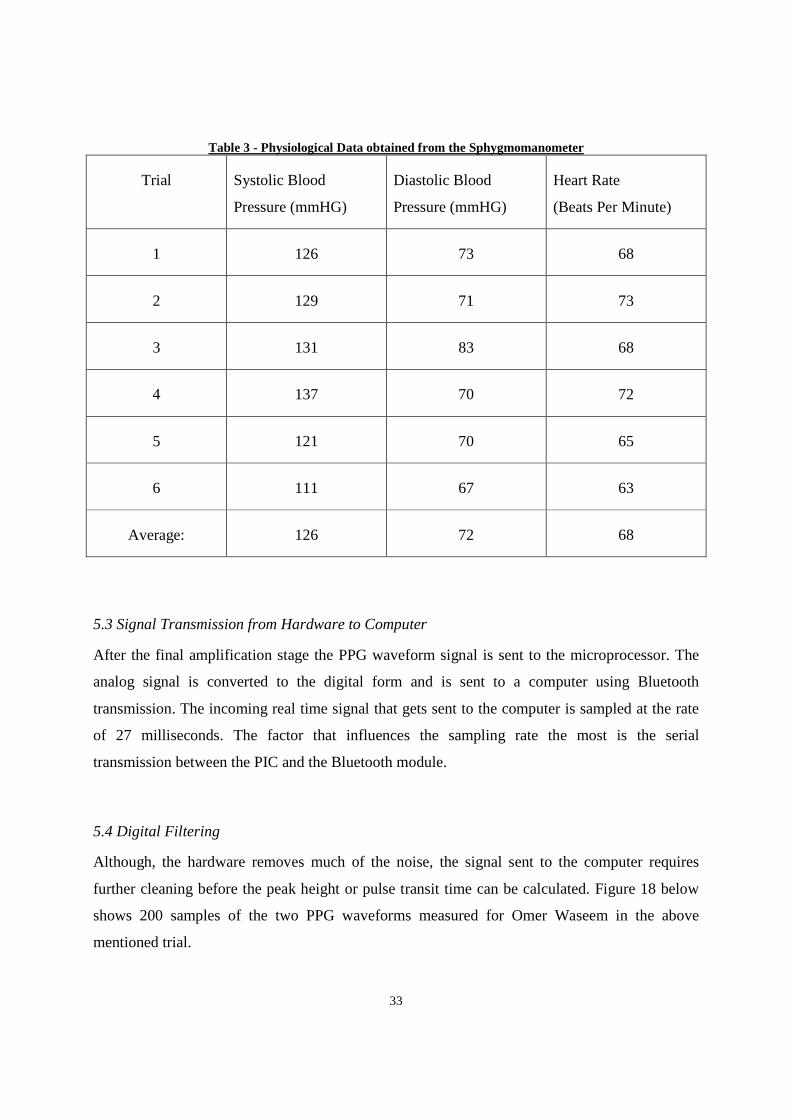
Table 3 - Physiological Data obtained from the Sphygmomanometer
Trial Systolic Blood
Pressure (mmHG)
Diastolic Blood
Pressure (mmHG)
Heart Rate
(Beats Per Minute)
1 126 73 68
2 129 71 73
3 131 83 68
4 137 70 72
5 121 70 65
6 111 67 63
Average: 126 72 68
5.3 Signal Transmission from Hardware to Computer
After the final amplification stage the PPG waveform signal is sent to the microprocessor. The
analog signal is converted to the digital form and is sent to a computer using Bluetooth
transmission. The incoming real time signal that gets sent to the computer is sampled at the rate
of 27 milliseconds. The factor that influences the sampling rate the most is the serial
transmission between the PIC and the Bluetooth module.
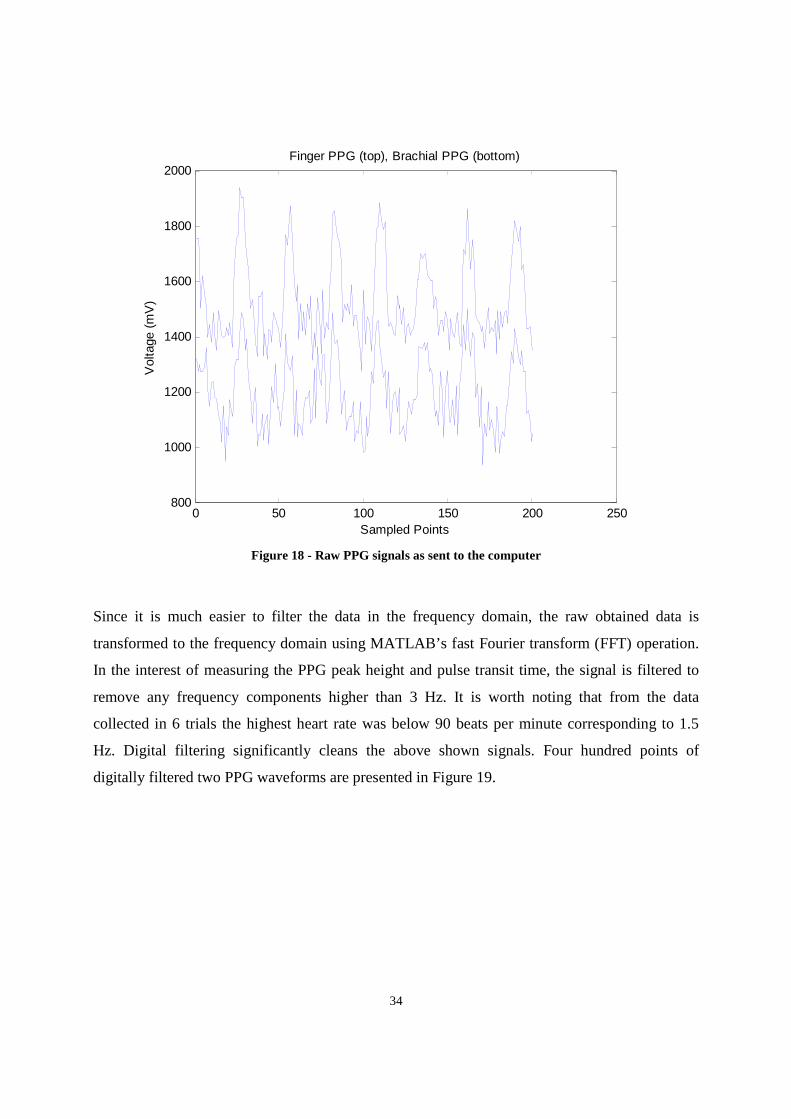
5.4 Digital Filtering
Although, the hardware removes much of the noise, the signal sent to the computer requires
further cleaning before the peak height or pulse transit time can be calculated. Figure 18 below
shows 200 samples of the two PPG waveforms measured for Omer Waseem in the above
mentioned trial.
34
Figure 18 - Raw PPG signals as sent to the computer
Since it is much easier to filter the data in the frequency domain, the raw obtained data is
transformed to the frequency domain using MATLAB’s fast Fourier transform (FFT) operation.
In the interest of measuring the PPG peak height and pulse transit time, the signal is filtered to
remove any frequency components higher than 3 Hz. It is worth noting that from the data
collected in 6 trials the highest heart rate was below 90 beats per minute corresponding to 1.5
Hz. Digital filtering significantly cleans the above shown signals. Four hundred points of
digitally filtered two PPG waveforms are presented in Figure 19.
0 50 100 150 200 250800
1000
1200
1400
1600
1800
2000
Sampled Points
Vol
tage
(m
V)
Finger PPG (top), Brachial PPG (bottom)
35
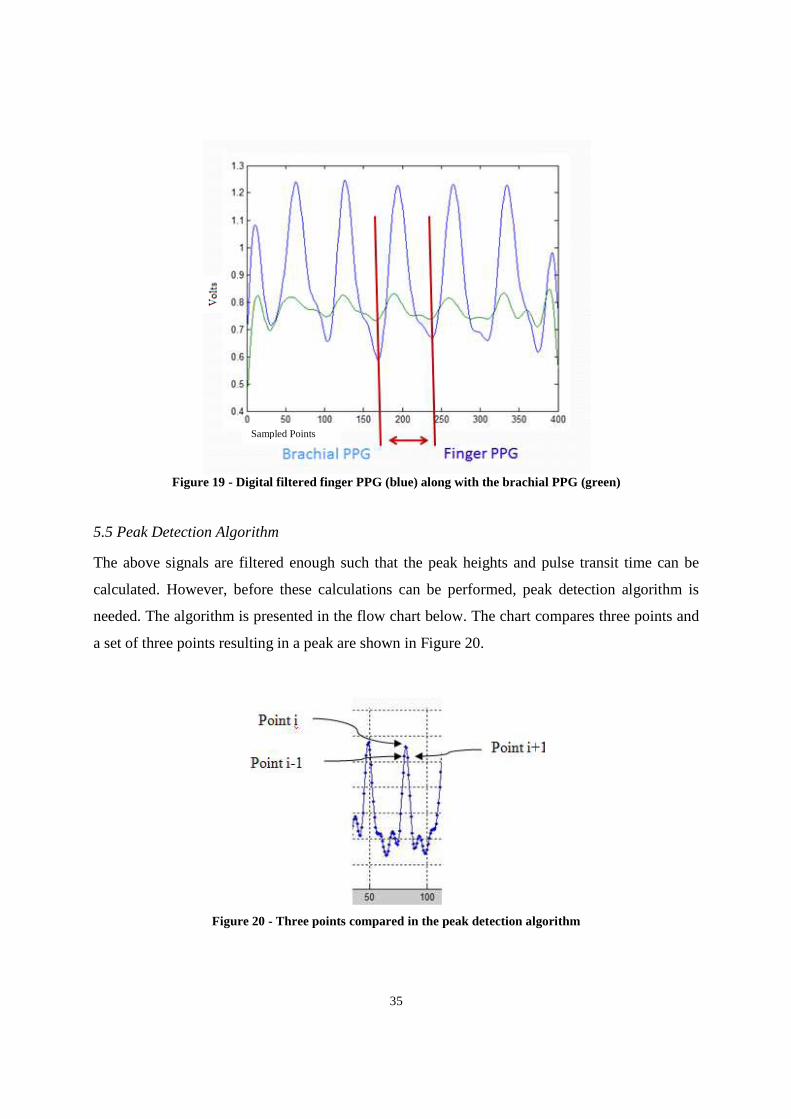
Figure 19 - Digital filtered finger PPG (blue) along with the brachial PPG (green)
5.5 Peak Detection Algorithm
The above signals are filtered enough such that the peak heights and pulse transit time can be
calculated. However, before these calculations can be performed, peak detection algorithm is
needed. The algorithm is presented in the flow chart below. The chart compares three points and
a set of three points resulting in a peak are shown in Figure 20.
Figure 20 - Three points compared in the peak detection algorithm
Sampled Points
36
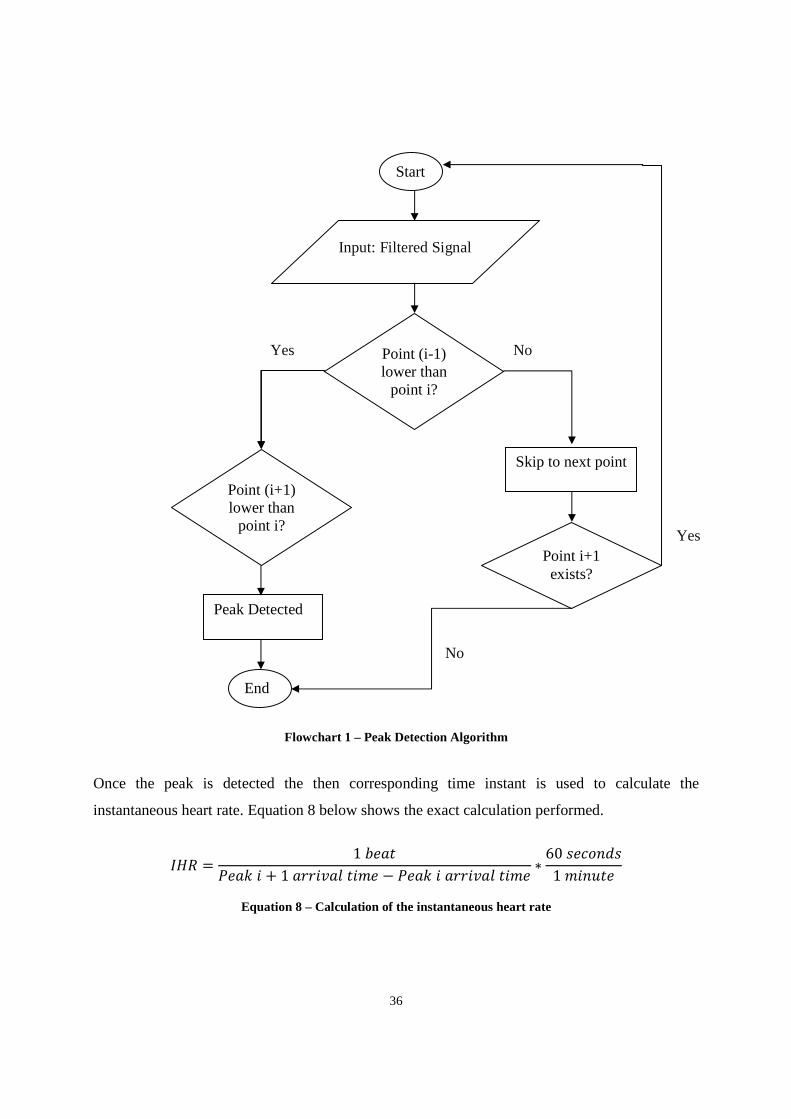
Flowchart 1 – Peak Detection Algorithm Once the peak is detected the then corresponding time instant is used to calculate the
instantaneous heart rate. Equation 8 below shows the exact calculation performed.
@7 = 1 ABCB! + 1 DDE FB − CB! DDE FB ∗ 60 &BHIJ&1 FB
Equation 8 – Calculation of the instantaneous heart rate
Start
Input: Filtered Signal
Point (i-1) lower than
point i?
Yes No
Point (i+1) lower than
point i?
Skip to next point
Peak Detected
End
Point i+1 exists?
Yes
No
37
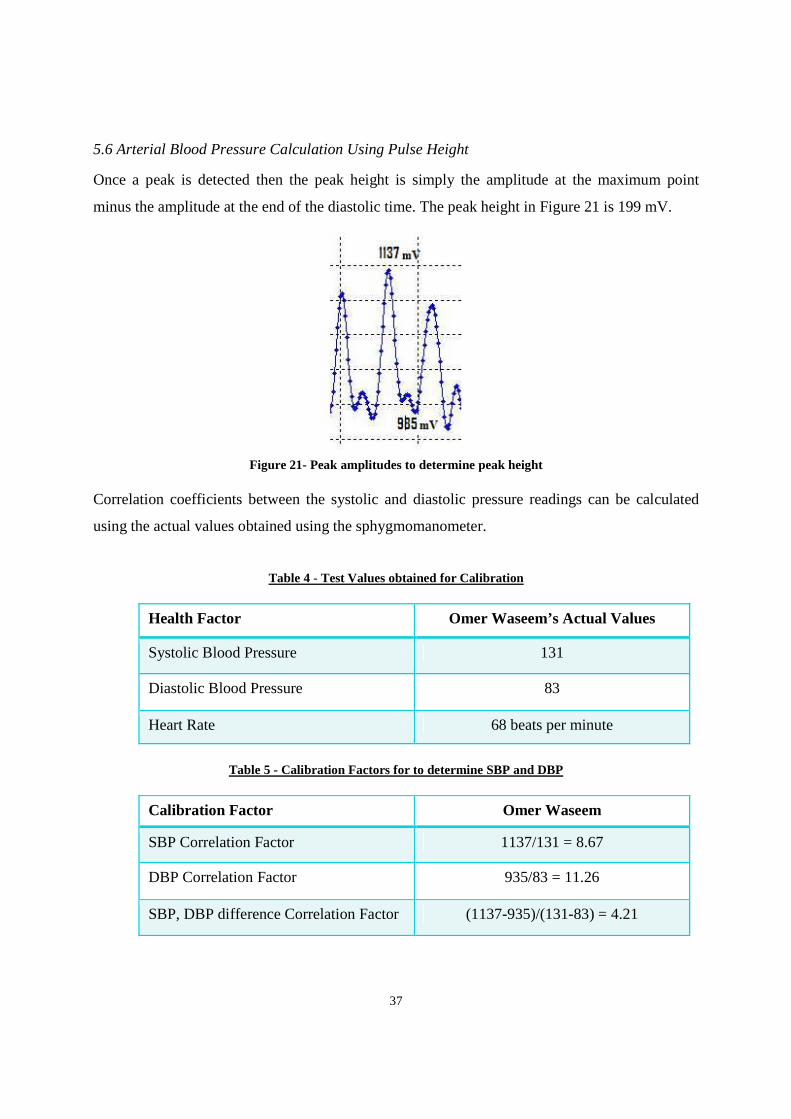
5.6 Arterial Blood Pressure Calculation Using Pulse Height
Once a peak is detected then the peak height is simply the amplitude at the maximum point
minus the amplitude at the end of the diastolic time. The peak height in Figure 21 is 199 mV.
Figure 21- Peak amplitudes to determine peak height
Correlation coefficients between the systolic and diastolic pressure readings can be calculated
using the actual values obtained using the sphygmomanometer.
Table 4 - Test Values obtained for Calibration
Health Factor Omer Waseem’s Actual Values
Systolic Blood Pressure 131
Diastolic Blood Pressure 83
Heart Rate 68 beats per minute
Table 5 - Calibration Factors for to determine SBP and DBP
Calibration Factor Omer Waseem
SBP Correlation Factor 1137/131 = 8.67
DBP Correlation Factor 935/83 = 11.26
SBP, DBP difference Correlation Factor (1137-935)/(131-83) = 4.21
38
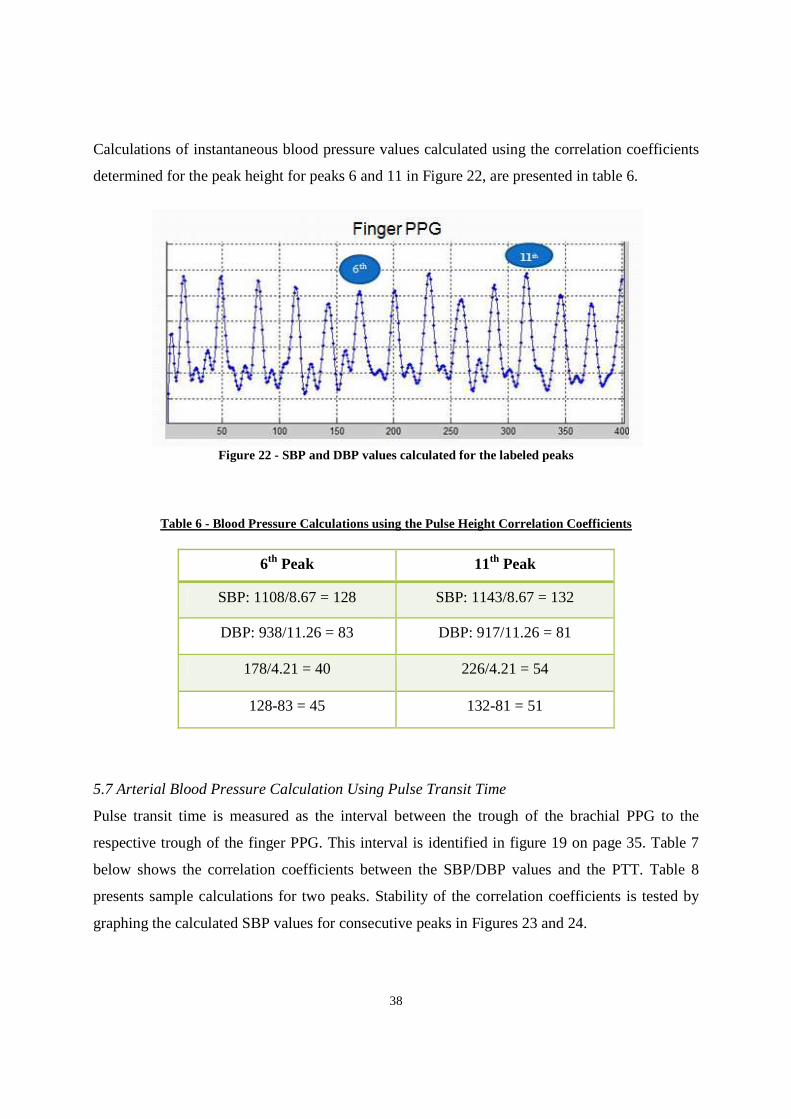
Calculations of instantaneous blood pressure values calculated using the correlation coefficients
determined for the peak height for peaks 6 and 11 in Figure 22, are presented in table 6.
Figure 22 - SBP and DBP values calculated for the labeled peaks
Table 6 - Blood Pressure Calculations using the Pulse Height Correlation Coefficients
6th Peak 11th Peak
SBP: 1108/8.67 = 128 SBP: 1143/8.67 = 132
DBP: 938/11.26 = 83 DBP: 917/11.26 = 81
178/4.21 = 40 226/4.21 = 54
128-83 = 45 132-81 = 51
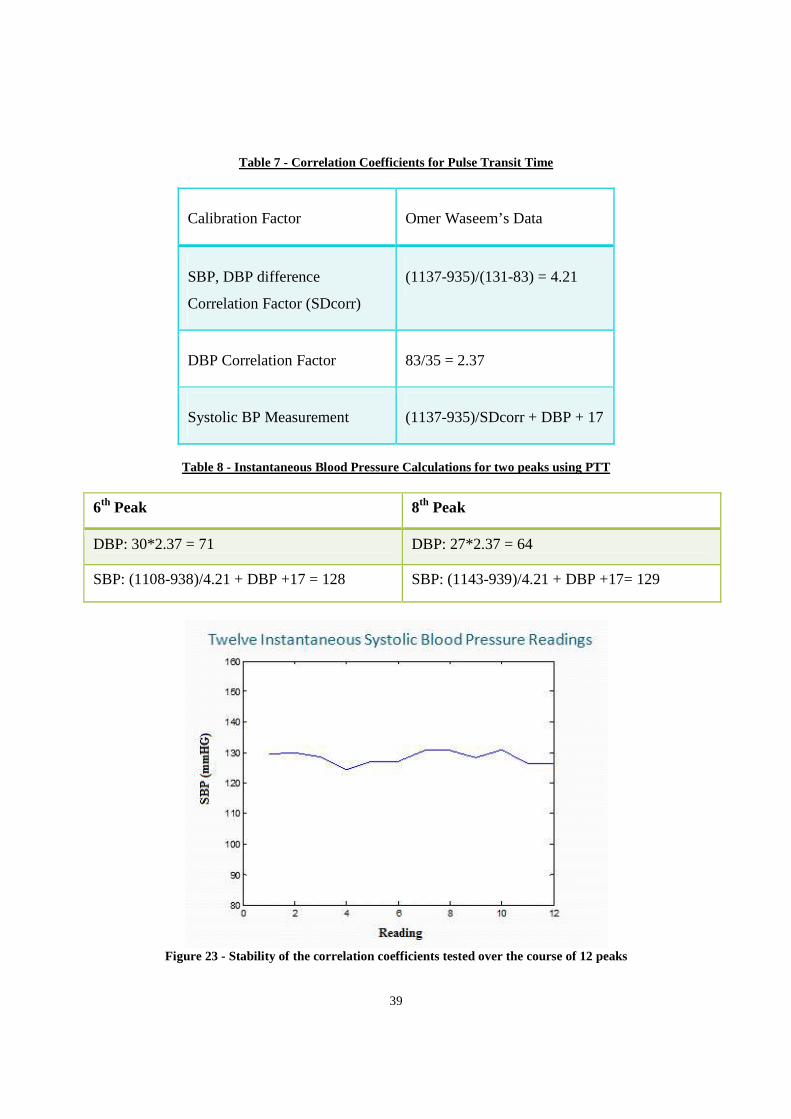
5.7 Arterial Blood Pressure Calculation Using Pulse Transit Time
Pulse transit time is measured as the interval between the trough of the brachial PPG to the
respective trough of the finger PPG. This interval is identified in figure 19 on page 35. Table 7
below shows the correlation coefficients between the SBP/DBP values and the PTT. Table 8
presents sample calculations for two peaks. Stability of the correlation coefficients is tested by
graphing the calculated SBP values for consecutive peaks in Figures 23 and 24.
39
Table 7 - Correlation Coefficients for Pulse Transit Time
Calibration Factor Omer Waseem’s Data
SBP, DBP difference
Correlation Factor (SDcorr)
(1137-935)/(131-83) = 4.21
DBP Correlation Factor 83/35 = 2.37
Systolic BP Measurement (1137-935)/SDcorr + DBP + 17
Table 8 - Instantaneous Blood Pressure Calculations for two peaks using PTT
6th Peak 8th Peak
DBP: 30*2.37 = 71 DBP: 27*2.37 = 64
SBP: (1108-938)/4.21 + DBP +17 = 128 SBP: (1143-939)/4.21 + DBP +17= 129
Figure 23 - Stability of the correlation coefficients tested over the course of 12 peaks
40
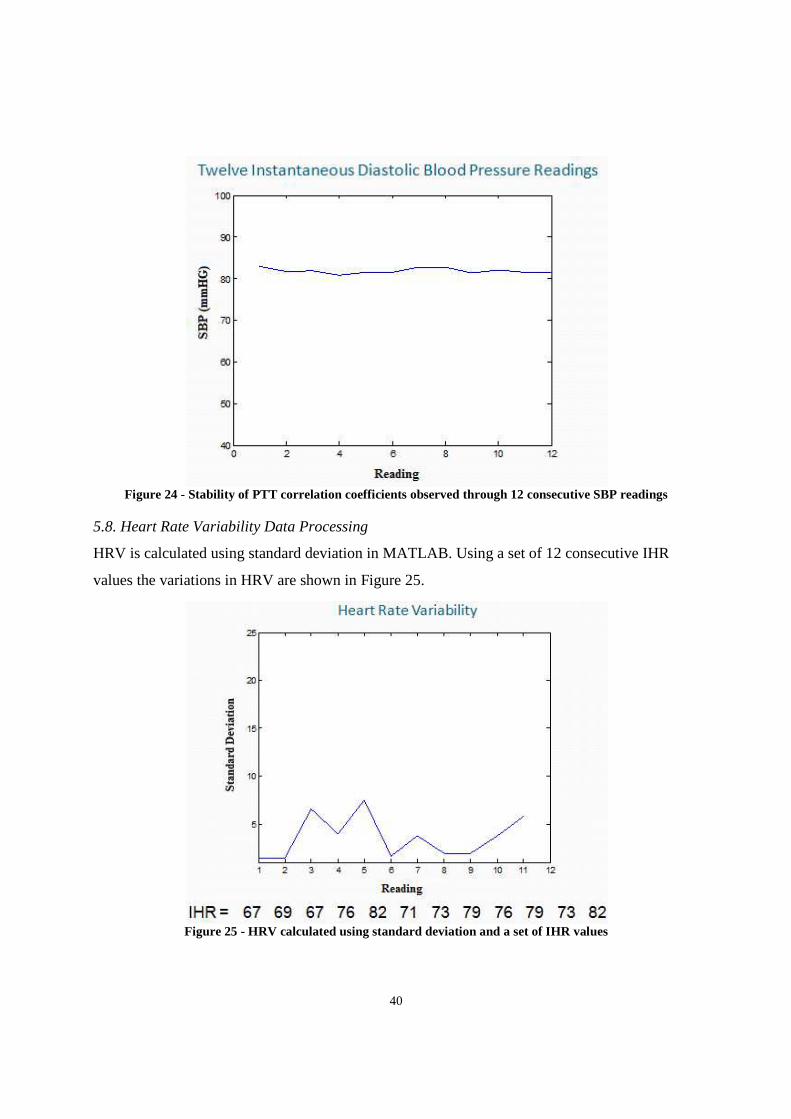
Figure 24 - Stability of PTT correlation coefficients observed through 12 consecutive SBP readings
5.8. Heart Rate Variability Data Processing
HRV is calculated using standard deviation in MATLAB. Using a set of 12 consecutive IHR
values the variations in HRV are shown in Figure 25.
Figure 25 - HRV calculated using standard deviation and a set of IHR values
41
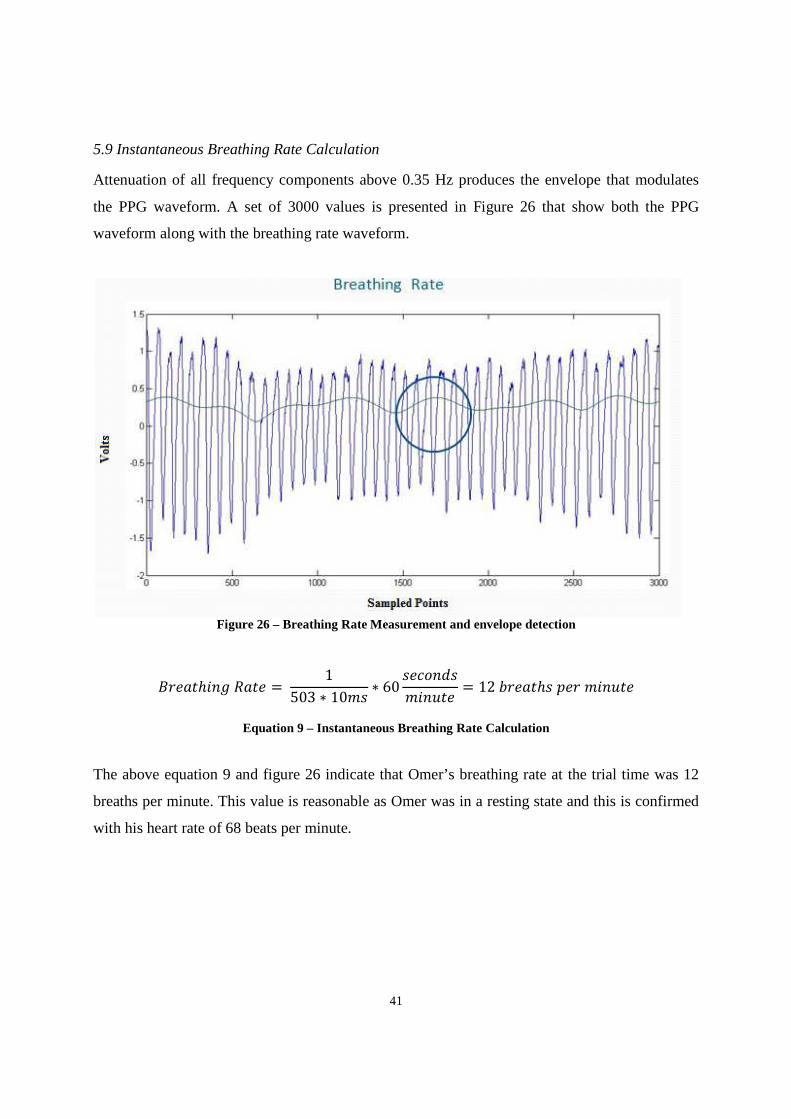
5.9 Instantaneous Breathing Rate Calculation
Attenuation of all frequency components above 0.35 Hz produces the envelope that modulates
the PPG waveform. A set of 3000 values is presented in Figure 26 that show both the PPG
waveform along with the breathing rate waveform.
Figure 26 – Breathing Rate Measurement and envelope detection
KDBℎ 7B = 1503 ∗ 10F& ∗ 60 &BHIJ&FB = 12 ADBℎ& BD FB
Equation 9 – Instantaneous Breathing Rate Calculation
The above equation 9 and figure 26 indicate that Omer’s breathing rate at the trial time was 12
breaths per minute. This value is reasonable as Omer was in a resting state and this is confirmed
with his heart rate of 68 beats per minute.
42
6 CONCLUSIONS The problem stated in section 3 of designing and developing a non-invasive and safe device that
allows instantaneous systolic and diastolic blood pressure values to be measured along with beat-
to-beat breathing rate and heart rate variability was resolved within reasonable errors. There
were hurdles such as difficult to filter interference due to ambient noise; however the biggest
obstacle encountered was detecting the PPG waveform at the brachial site along the upper arm.
Several transducers were built and many different test subjects were approached. An exhaustive
set of trials eventually lead to a promising solution. Difficult to locate PPG waveform detection
site along the brachial artery suggests that a robust transducer is absolutely necessary for the
device to have usefulness in a clinical setting.
Since both the pulse height and pulse transit time could be measured once the PPG signals were
digitally filtered, one was used to ensure the correctness of the calculated values using the other
approach. Both of the approaches were necessary to find values for all unknown variables. The
pulse height is the correlated difference between the systolic and diastolic blood pressure.
However, knowing just the pulse height without the baseline blood pressure, specific values are
difficult to compute. The pulse transit time varies inversely with the blood pressure. Thus, a
baseline blood pressure using the pulse transit time can be used in the pulse height technique.
Similarly, the difference in SBP and DBP from the pulse height can also be used to compute
calculations in the pulse transit time approach.
Heart rate variability and breathing rate were both computed using the MATLAB software. Peak
detection algorithm was used to identify the peaks of the PPG waveform. Identification of the
peak provided a mechanism to extract detailed information about the peak which was used to
calculate the HRV and BR.
The total project cost was $45 Canadian dollars. A breadboard, diodes, capacitors, and resistors
were purchased. The project was successfully completed in 7 months. A month was allocated to
literary research, the hardware was built in 3 months, 2 months were spent on troubleshooting,
and the last month was spent on data processing in MATLAB.
43
7 RECOMMENDATIONS A robust transducer is absolutely crucial for PPG detection from the brachial artery. An in depth
knowledge and creativity should be employed in designing the transducer. While all things may
be considered on paper to produce the best seeming design, it may still fail in testing. Therefore,
exhaustive testing trials must be performed to produce an improved design.
Biological signals are not only miniscule in quantity they are highly prone to noise and artifacts.
Sometimes, the noise interferes with the signal of interest in such a way that any attempt to
remove the noise will also attenuate the signal that needs to be measured. This was the case with
detecting the modulating envelope in the PPG waveform to calculate the breathing rate. Thus, a
software approach was used for envelope detection.
Additional literature research showed that the low frequency respiratory induced variations in the
PPG waveform may also be caused by the autonomic nervous system involvement. During
inhalation the stretch receptors in the lungs send a message to the pons in the brain through the
vagus nerve to initiate exhalation and avoid over inflation of the lungs. The vagus nerve is part of
the autonomic nervous system that influences the heartbeat. Inhalation inhibits the vagus nerve
and so the heartbeat increases. The opposite effect is observed during exhalation. Modulation of
the PPG waveform due to this factor is termed respiratory sinus arrhythmia (RSA) [12]. This
knowledge can be used to measure additional physiological information about RSA and ANS.
Knowing the spectral or temporal properties of a noise signal provides information which can be
used to design a filter. However, motion artifact is a type of interference for which the spectral
information is not always known. The solution to this problem can be provided through the use
of adaptive filters. The adaptive filter changes according to the change in noise. It can work as a
notch or a comb filter. The noise however needs to be additive in order for most of the adaptive
filters to work.
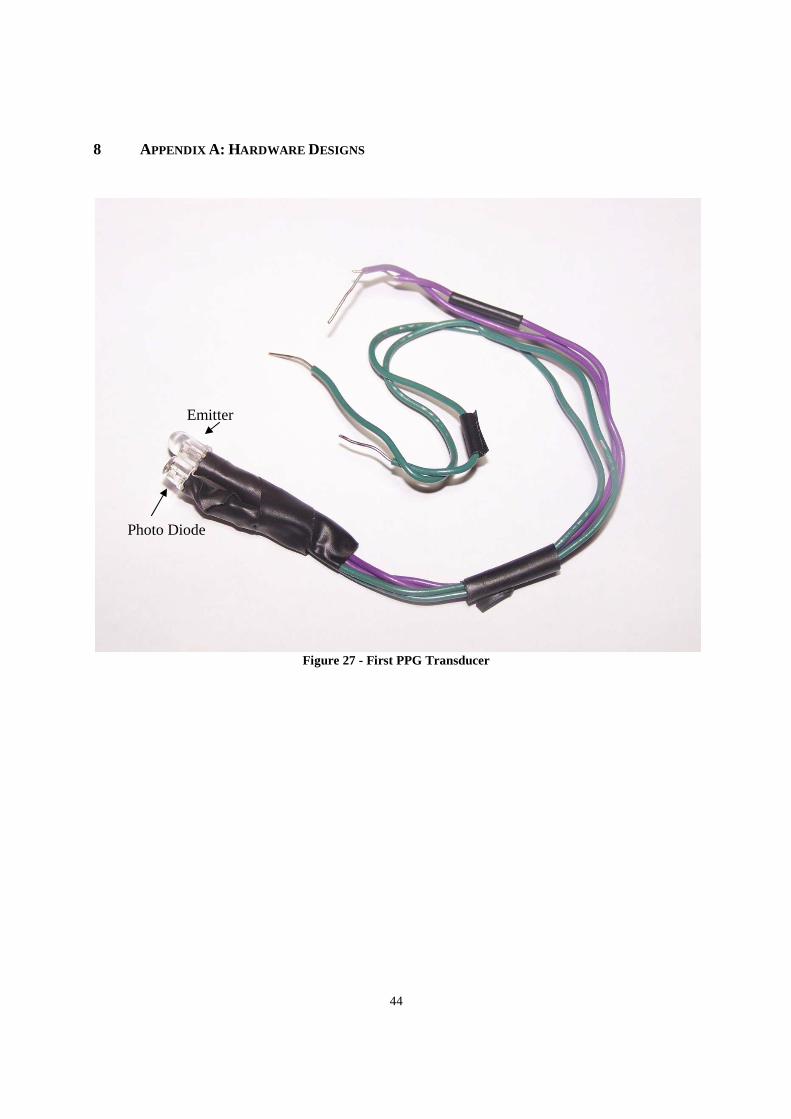
44
8 APPENDIX A: HARDWARE DESIGNS
Figure 27 - First PPG Transducer
Emitter
Photo Diode
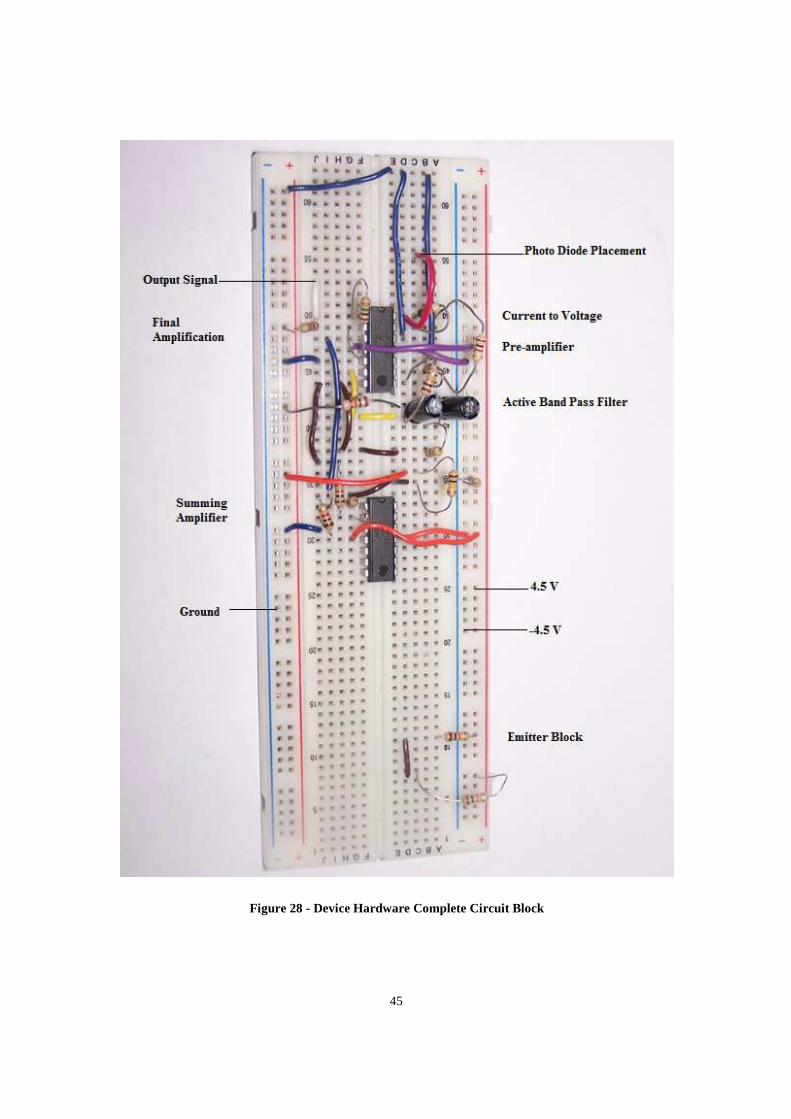
45
Figure 28 - Device Hardware Complete Circuit Block
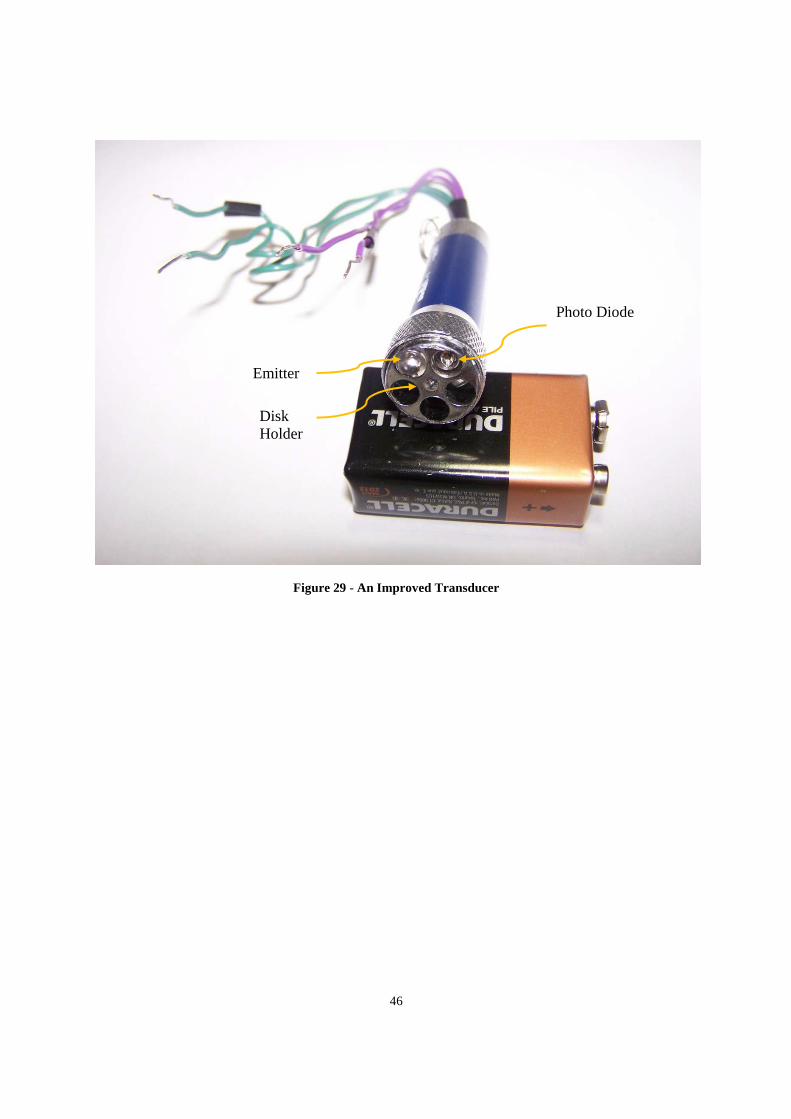
46
Figure 29 - An Improved Transducer
Emitter
Photo Diode
Disk Holder
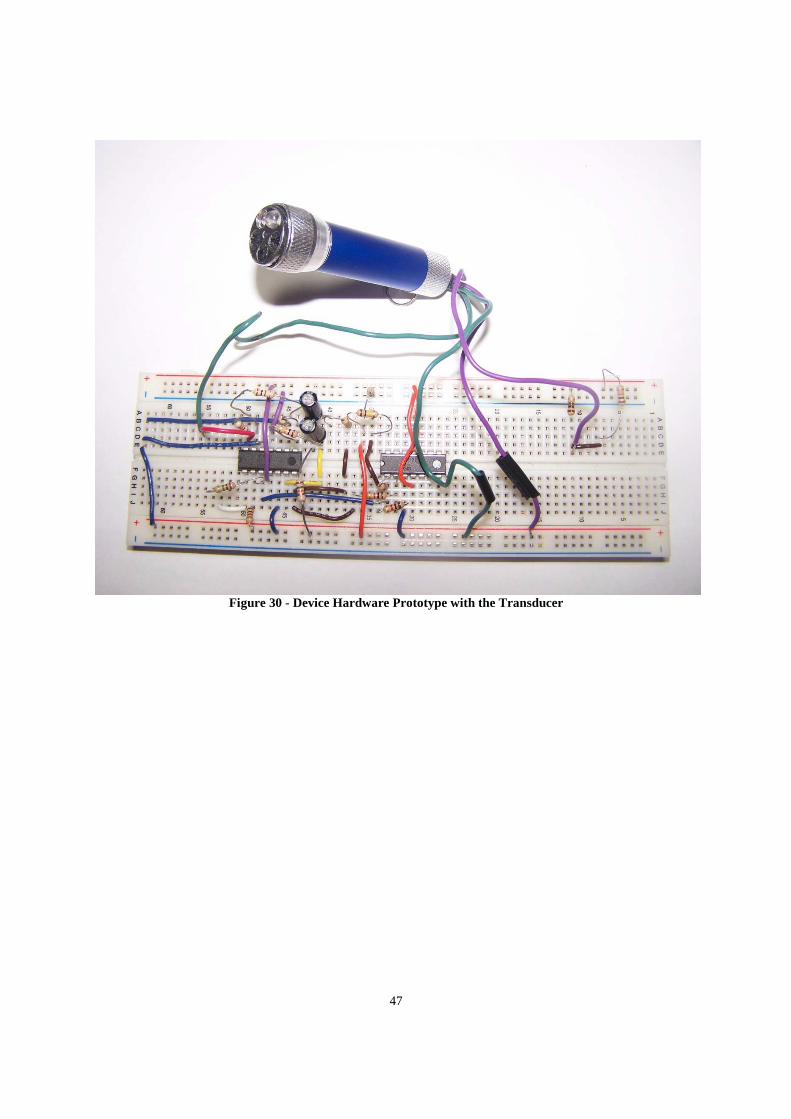
47
Figure 30 - Device Hardware Prototype with the Transducer
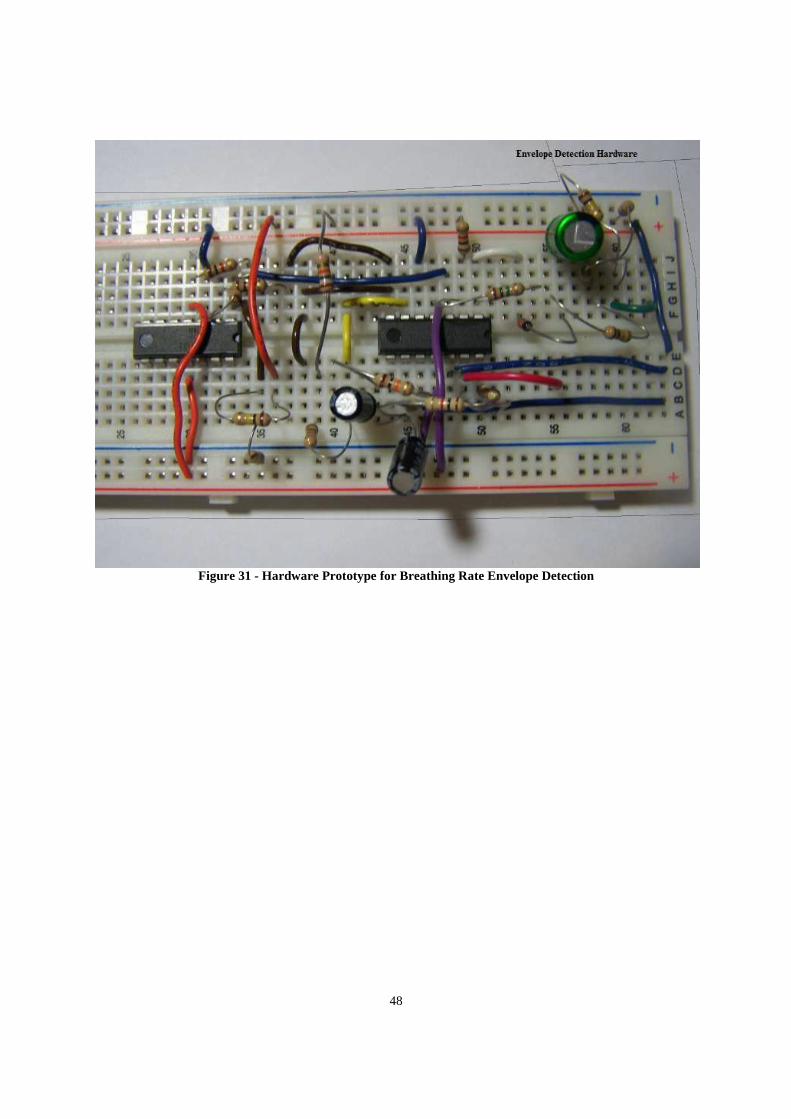
48
Figure 31 - Hardware Prototype for Breathing Rate Envelope Detection
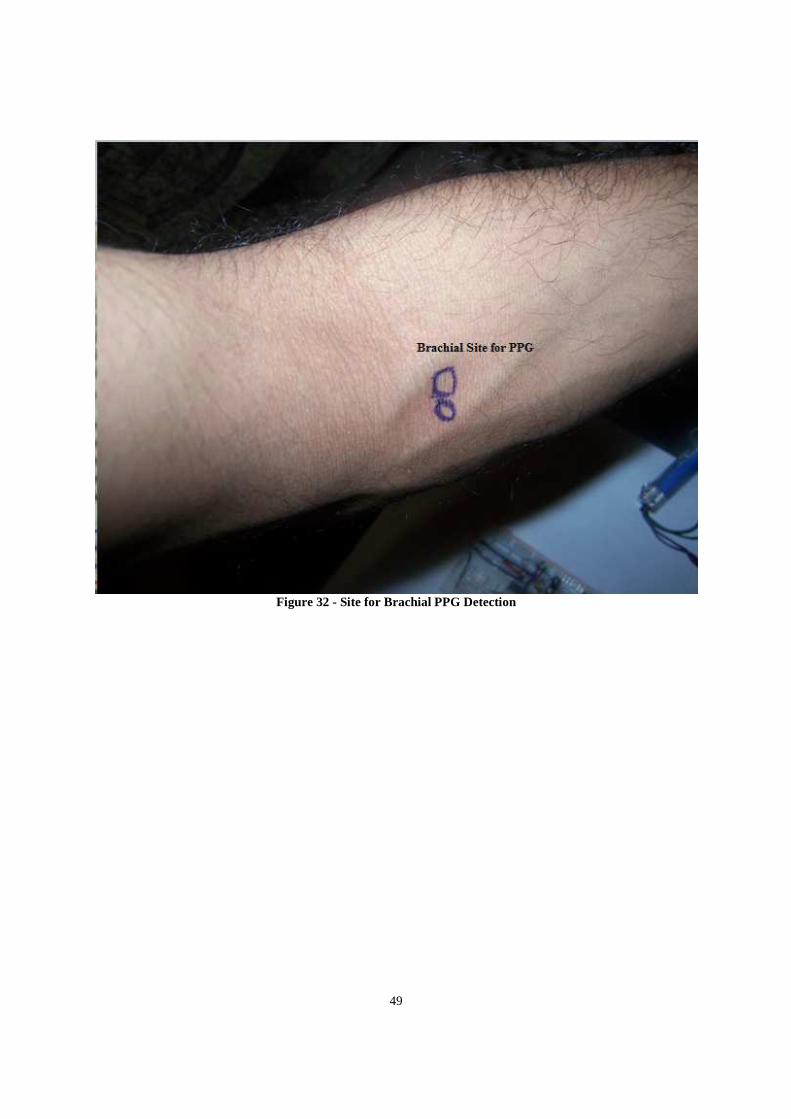
49
Figure 32 - Site for Brachial PPG Detection

50
9 APPENDIX B: DATA PROCESSING IN MATLAB
9.1 Breathing Rate Envelop Detection
9.2 Peak Detection Algorithm Implementation and the remaining Calculations
%Author: Mastan Singh Kalsi %Date: April 2009 %Purpose: Digitally filter the data, implement peak detection, calculate % the physiologic health factors along with the correlation % coefficients. close all ; clc; clear all ; load Mastan_finger.txt %INPUT DATA output = Mastan_finger; load IR_Brachial.txt Broutput=IR_Brachial; from=14400; %SELECT A RANGE OF DATA TO WORK WITH to=15000; figure; %PLOT THE RAW DATA plot((1:length(output(from:to))),output(from:to)); hold on; plot((1:length(Broutput(from:to))),Broutput(from:to )); hold off
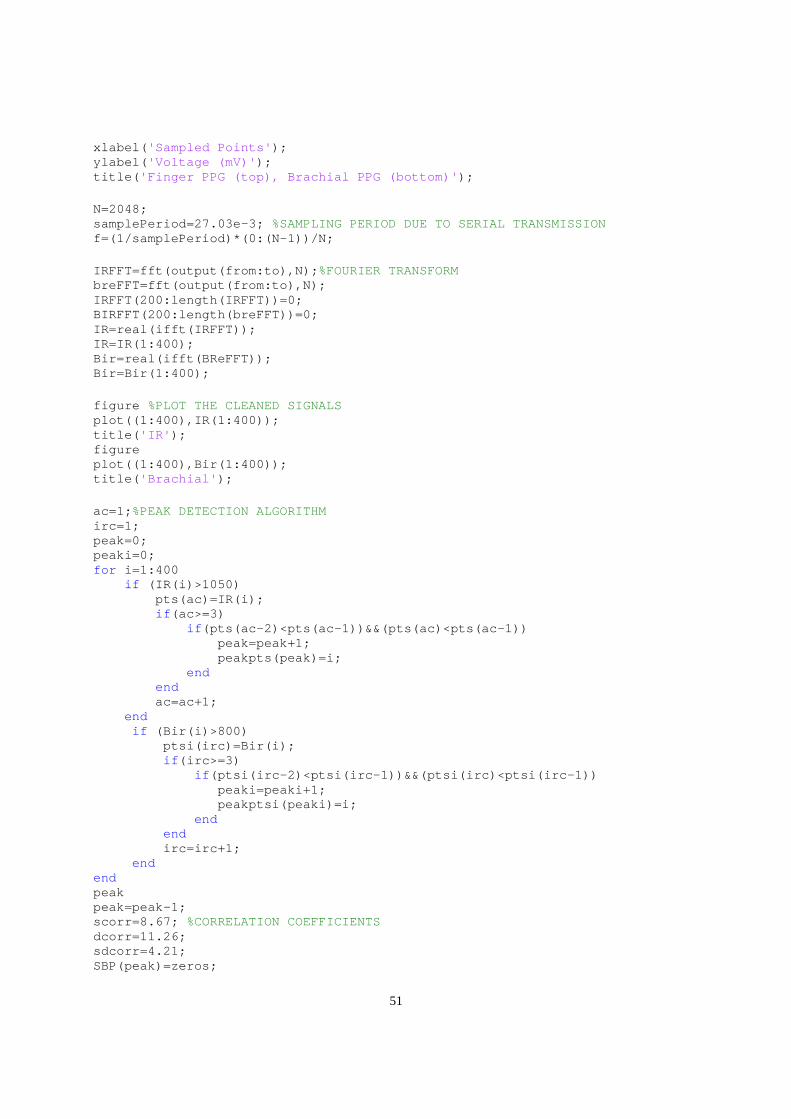
51
xlabel( 'Sampled Points' ); ylabel( 'Voltage (mV)' ); title( 'Finger PPG (top), Brachial PPG (bottom)' ); N=2048; samplePeriod=27.03e-3; %SAMPLING PERIOD DUE TO SERIAL TRANSMISSION f=(1/samplePeriod)*(0:(N-1))/N; IRFFT=fft(output(from:to),N); %FOURIER TRANSFORM breFFT=fft(output(from:to),N); IRFFT(200:length(IRFFT))=0; BIRFFT(200:length(breFFT))=0; IR=real(ifft(IRFFT)); IR=IR(1:400); Bir=real(ifft(BReFFT)); Bir=Bir(1:400); figure %PLOT THE CLEANED SIGNALS plot((1:400),IR(1:400)); title( 'IR' ); figure plot((1:400),Bir(1:400)); title( 'Brachial' ); ac=1; %PEAK DETECTION ALGORITHM irc=1; peak=0; peaki=0; for i=1:400 if (IR(i)>1050) pts(ac)=IR(i); if (ac>=3) if (pts(ac-2)<pts(ac-1))&&(pts(ac)<pts(ac-1)) peak=peak+1; peakpts(peak)=i; end end ac=ac+1; end if (Bir(i)>800) ptsi(irc)=Bir(i); if (irc>=3) if (ptsi(irc-2)<ptsi(irc-1))&&(ptsi(irc)<ptsi(irc-1)) peaki=peaki+1; peakptsi(peaki)=i; end end irc=irc+1; end end peak peak=peak-1; scorr=8.67; %CORRELATION COEFFICIENTS dcorr=11.26; sdcorr=4.21; SBP(peak)=zeros;
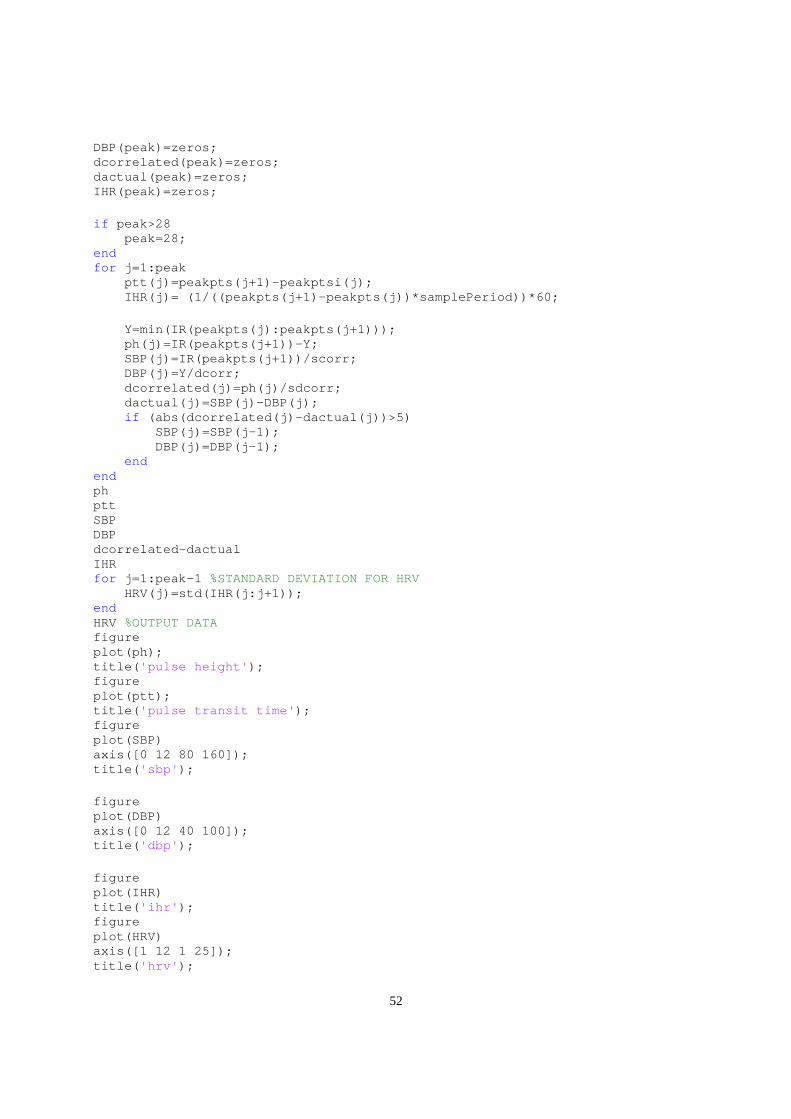
52
DBP(peak)=zeros; dcorrelated(peak)=zeros; dactual(peak)=zeros; IHR(peak)=zeros; if peak>28 peak=28; end for j=1:peak ptt(j)=peakpts(j+1)-peakptsi(j); IHR(j)= (1/((peakpts(j+1)-peakpts(j))*samplePer iod))*60; Y=min(IR(peakpts(j):peakpts(j+1))); ph(j)=IR(peakpts(j+1))-Y; SBP(j)=IR(peakpts(j+1))/scorr; DBP(j)=Y/dcorr; dcorrelated(j)=ph(j)/sdcorr; dactual(j)=SBP(j)-DBP(j); if (abs(dcorrelated(j)-dactual(j))>5) SBP(j)=SBP(j-1); DBP(j)=DBP(j-1); end end ph ptt SBP DBP dcorrelated-dactual IHR for j=1:peak-1 %STANDARD DEVIATION FOR HRV HRV(j)=std(IHR(j:j+1)); end HRV %OUTPUT DATA figure plot(ph); title( 'pulse height' ); figure plot(ptt); title( 'pulse transit time' ); figure plot(SBP) axis([0 12 80 160]); title( 'sbp' ); figure plot(DBP) axis([0 12 40 100]); title( 'dbp' ); figure plot(IHR) title( 'ihr' ); figure plot(HRV) axis([1 12 1 25]); title( 'hrv' );

53
10 REFERENCES [1] Canadian Hypertension Society, Blood Pressure Information, [online] 2008,
<http://www.hypertension.ca/> (Accessed: October 4th, 2008).
[2] W. S. Johnston and Y. Mendelson, "Extracting breathing rate information from a wearable reflectance pulse oximeter sensor," Engineering in Medicine and Biology
Society, 2004. IEMBS '04. 26th Annual International Conference of the IEEE, vol. 2, pp. 5388-5391, 2004.
[3] W. Johnston and Y. Mendelson, "Extracting heart rate variability from a wearable reflectance pulse oximeter," Bioengineering Conference, 2005. Proceedings of the IEEE
31st Annual Northeast, pp. 157-158, 2005.
[4] H. Coni and N. Coni, Blood Pressure – all you need to know, Illinois: Royal Society of Medicine Press Ltd, 2003, pp. 2.
[5] Sujay Deb, C. Nanda, D. Goswami, J. Mukhopadhyay and S. Chakrabarti, "Cuff-Less Estimation of Blood Pressure Using Pulse Transit Time and Pre-ejection Period," Convergence Information Technology, 2007. International Conference on, pp. 941-944, 2007.
[6] I. Rapoport and A. J. Cousin, "A Pilot Clinical PEP Monitor," Biomedical Engineering, IEEE Transactions on, vol. BME-26, pp. 345-349, 1979.
[7] X. F. Teng and Y. T. Zhang, "Continuous and noninvasive estimation of arterial blood pressure using a photoplethysmographic approach," Engineering in Medicine and
Biology Society, 2003. Proceedings of the 25th Annual International Conference of the
IEEE, vol. 4, pp. 3153-3156 Vol.4, 2003.
[8] Digikey, Photodiode Parts Information, [online] 2008, <http://parts.digikey.com/1/parts/1540920-photodiode-t1-3-4-sfh-203-p.html/> (Accessed: October 14th, 2008).
[9] H. Coni and N. Coni, Blood Pressure – all you need to know, Illinois: Royal Society of Medicine Press Ltd, 2003, pp. 6.
[10] R. S. Khandpur, Handbook of Biomedical Instrumentation, 2nd ed. New Delhi: Tata McGraw-Hill Publishing Company Limited, 2003, pp. 113.

54
[11] R. C. Jaeger and T. N. Blaclock, Microelectronic Circuit Design, 2nd ed. New York: The McGraw Hill Companies, 2004, pp. 157-158.
[12] B. H. Timmons and R. Ley, Behavioural and psychological approaches to breathing
disorders, pp. 36.

55
11 VITAE
NAME: Mastan Singh Kalsi
PLACE OF BIRTH: Jagraon, Punjab, India
YEAR OF BIRTH: 1984
SECONDARY EDUCATION: Turner Fenton Secondary School (1998 – 2003)
UNDERGRADUATE EDUCATION: Kinesiology and Health Sciences (2003 – 2004) Electrical and Biomedical Engineering (2004 – 2009)
WORK EXPERIENCE: Internship Position – Research In Motion Limited (2007 – 2008)
HONOURS AND AWARDS: Queen Elizabeth II Scholarship (2003) York University Entrance Scholarship (2003) Kinesiology and Health Sciences Faculty Scholarship (2003)