design of experiment - dipartimento di matematica - unipd
TRANSCRIPT

modeFRONTIER® is a registered product of ESTECO srlCopyright © ESTECO srl 1999-2007
For more information visit:
www.esteco.com or send an e-mail to:
Design of Experiment

modeFRONTIER® is a registered product of ESTECO srlCopyright © ESTECO srl 1999-2007
For more information visit:
www.esteco.com or send an e-mail to:
DOE stands for Design Of Experiments
DOE techniques are used to generate a series of designs which satisfy
different requisites according to the objective of the analysis, which can
be however always summarized as:
“have the best with the smallest effort”
The main concern is to determine the relationship between factors
(inputs) affecting a process and the output of that process with the
lowest number of experiments as possible.
What does DOE mean?

modeFRONTIER® is a registered product of ESTECO srlCopyright © ESTECO srl 1999-2007
For more information visit:
www.esteco.com or send an e-mail to:
• Have you flown a paper airplane before?
(Hopefully not in this class)
• Do you always use the same type of paper?
• Do you always use the same design?
• Do you want it to fly straight or do tricks?
In other words….

modeFRONTIER® is a registered product of ESTECO srlCopyright © ESTECO srl 1999-2007
For more information visit:
www.esteco.com or send an e-mail to:
• Design of experiment is used here to test paper airplane flight distance
• We want the planes to fly as far as they can.
• We need to think about how we are going to design and perform the
experiment.
• What things do we need to think about? (Think about the steps of the
Scientific Method)
What does DOE mean in this case?
• What question are we trying to answer?
– We want to design an experiment to test how the addition of
paper clips will affect the flight distance of the paper airplane.
– How does adding paper clips to a paper airplane affect its
flight?

modeFRONTIER® is a registered product of ESTECO srlCopyright © ESTECO srl 1999-2007
For more information visit:
www.esteco.com or send an e-mail to:
Procedure
• How are we going to perform the experiment?
– What do we need to do?
– What needs to be kept constant?
– What is our control?
– Which are our independent variables?
– What are we going to observe? How?
# of
paper
clips
Flight
Distance
(m)
0
1
2
3
4
5
6

modeFRONTIER® is a registered product of ESTECO srlCopyright © ESTECO srl 1999-2007
For more information visit:
www.esteco.com or send an e-mail to:
How adding paper clips affects paper airplane flight
distance.
2. Determine interval and label for x-axis.
3. Determine
interval and label for
y-axis.
4. Plot your data.
1 2 3 4 650
Number of paper clips
2
4
6
8
10
0
Flig
ht
Dis
tan
ce
(m
ete
rs)
5. Connect the data points.
Making a graph of your data

modeFRONTIER® is a registered product of ESTECO srlCopyright © ESTECO srl 1999-2007
For more information visit:
www.esteco.com or send an e-mail to:
The choice on experiments
Aim of the Activity: have a good sample from laboratory tests for statistic
study
Cost per Experiment: 1000 $
6 Random entries
Cost of the Campaign = 6,000 $
8 Full Factorial entries
Cost of the Campaign = 8,000 $
64 Full Factorial entries
Cost of the Campaign = 64,000 $
J Cost
L Quality
J Cost
K Quality
L Cost
J Quality

modeFRONTIER® is a registered product of ESTECO srlCopyright © ESTECO srl 1999-2007
For more information visit:
www.esteco.com or send an e-mail to:
Curse of dimensionality
• is the problem caused by the exponential increase in volume associated
with adding extra dimensions to a space.
For example, 100 evenly-spaced
sample points suffice to sample
a unit interval with no more than
0.01 distance between points;
an equivalent sampling of a 10-
dimensional unit hypercube with
a lattice with a spacing of 0.01
between adjacent points would
require 1020 sample points.

modeFRONTIER® is a registered product of ESTECO srlCopyright © ESTECO srl 1999-2007
For more information visit:
www.esteco.com or send an e-mail to:
Random & SOBOL
• The DOE Random & Sobol Sequences cover sufficiently the domain
of the functions.
• The mathematical theory is the Random Number Generation.
• Sequence Random (function with “many” variables)
• Sequence Sobol (function with “few” variables < 10)
• Random sequences of experiments allow the sampling of a
configuration space with continuous and discrete variables without
pre-defined interactions
• The use of random sequences avoids the risk of “correlated
sampling” even in the case of limited sampling

modeFRONTIER® is a registered product of ESTECO srlCopyright © ESTECO srl 1999-2007
For more information visit:
www.esteco.com or send an e-mail to:
DOE: space fillers
Random sequence
0
0.2
0.4
0.6
0.8
1
0 0.2 0.4 0.6 0.8 1
Sobol sequence
0
0.2
0.4
0.6
0.8
1
0 0.2 0.4 0.6 0.8 1
Pseudo-random
High number of variables
Suitable for GA
Better distributed designs
Suitable for a low number of variables (<10)
Suitable for RSM, GA
Random and Sobol

modeFRONTIER® is a registered product of ESTECO srlCopyright © ESTECO srl 1999-2007
For more information visit:
www.esteco.com or send an e-mail to:
Full factorial
Number of generated designs: mn
m = variable level
(number of “possible” states of a
variable)
n = variables number
Factorial DOE
Full Factorial 2 levels
2n designs allow to correctly
capture the first order interaction
(e.g. x*y)
Full Factorial 3 levels
3n designs allow to correctly
capture the second order
interaction (e.g. x2*y)Full Factorial
3 variables
3 levels
Pascal triangle

modeFRONTIER® is a registered product of ESTECO srlCopyright © ESTECO srl 1999-2007
For more information visit:
www.esteco.com or send an e-mail to:
DOE: space fillersReduced factorial
Number of generated designs = 2p
p < n (number of variables)
n. design x1 x2 x3 x4 (=x1*x2)
1 + + + +
2 + + - +
3 + - + -
4 + - - -
5 - + + -
6 - + - -
7 - - + +
8 - - - +
Removing
the second
order
information
for x1*x2

modeFRONTIER® is a registered product of ESTECO srlCopyright © ESTECO srl 1999-2007
For more information visit:
www.esteco.com or send an e-mail to:
DOE: space fillers
Cubic face centered
2n + 2*n +1 designs
allow to correctly capture the second order
interaction (e.g. x2*y)
3 variables
15 designs

modeFRONTIER® is a registered product of ESTECO srlCopyright © ESTECO srl 1999-2007
For more information visit:
www.esteco.com or send an e-mail to:
DOE: space fillers
Box Behnken
Very similar to the face centered algorithm, it uses the mid-side nodes
and the center of the (hyper-) cube
3 variables
13 designs

modeFRONTIER® is a registered product of ESTECO srlCopyright © ESTECO srl 1999-2007
For more information visit:
www.esteco.com or send an e-mail to:
Example: Latin Square with 3 variables (x1, x2, x3) and 3 levels
- x1 (1,2,3)
- x2 (A,B,C)
- x3 (a,b,c)
1 2 3
3 1 2
2 3 1
A B C
B C A
C A B
a b c
c a b
b c a
a1A b2B c3C
c3B a1C b2A
b2C c3A a1B
DOE: space fillers
Latin Square
The designs number (m2, where m is the required level) does not depend on
the number of variables
Suitable for statistical analysis
Only the zero order interactions can be captured

modeFRONTIER® is a registered product of ESTECO srlCopyright © ESTECO srl 1999-2007
For more information visit:
www.esteco.com or send an e-mail to:
DOE: space fillers
Latin Square

modeFRONTIER® is a registered product of ESTECO srlCopyright © ESTECO srl 1999-2007
For more information visit:
www.esteco.com or send an e-mail to:
DOE: Reliability and RobustnessMontecarlo and Latin Hypercube
These techniques generate a series of randomly distributed designs according
to a given probability density function (Normal, Cauchy, Weibull,…)
Define linear correlations
between variables

modeFRONTIER® is a registered product of ESTECO srlCopyright © ESTECO srl 1999-2007
For more information visit:
www.esteco.com or send an e-mail to:
Cauchy
Normal
DOE: Reliability and Robustness

modeFRONTIER® is a registered product of ESTECO srlCopyright © ESTECO srl 1999-2007
For more information visit:
www.esteco.com or send an e-mail to:
DOE: Reliability and Robustness
Montecarlo versus Latin Hypercube

modeFRONTIER® is a registered product of ESTECO srlCopyright © ESTECO srl 1999-2007
For more information visit:
www.esteco.com or send an e-mail to:
DOE: Reliability and Robustness
Montecarlo versus Latin Hypercube

modeFRONTIER® is a registered product of ESTECO srlCopyright © ESTECO srl 1999-2007
For more information visit:
www.esteco.com or send an e-mail to:
DOE: hands on
Try to show the differences between Montecarlo
and latin Hypercube
For a two variables problem
Generate a Montecarlo DOE
Generate a Latin Hypercube DOE
Plot hystograms, curve fitting, correlation matrix, Q-Q plots,
compare results

modeFRONTIER® is a registered product of ESTECO srlCopyright © ESTECO srl 1999-2007
For more information visit:
www.esteco.com or send an e-mail to:
Statistical analysis
• Statistical tools can be used to analyze distributions, coming from
experiments or from DOE, to obtain information from the system (e.g.,
what is the most responsible cause of failures)
• Statistical tools can be used to find correlations, in particular which
input variables have most influences in the system outputs; these
results can be obtained from an available database, from a DOE, or
after an optimisation phase

modeFRONTIER® is a registered product of ESTECO srlCopyright © ESTECO srl 1999-2007
For more information visit:
www.esteco.com or send an e-mail to:
Statistical analysis
Several statistical tools are
available:
• Density and cumulative
Distribution
• Box-Whiskers
• Quantile Plot
• Statistics summary
• ANOVA
• Broken Constraints
• Main and interaction effects
• Student
• Correlation Matrix
• Scatter Matrix
•SOMTools for distribution analysis
Tools for correlation analysis

modeFRONTIER® is a registered product of ESTECO srlCopyright © ESTECO srl 1999-2007
For more information visit:
www.esteco.com or send an e-mail to:
Probability Density Plot
• The Probability Density chart
summarizes the distribution of a
data set (min, max, mean,
variance,…)
• This plot is obtained by splitting the
range of the data into equal sized
classes
• The number of points that fall into
each class are counted
• It reveals:
– the kind of distribution
– where the data is located
– how spread out the data are

modeFRONTIER® is a registered product of ESTECO srlCopyright © ESTECO srl 1999-2007
For more information visit:
www.esteco.com or send an e-mail to:
Statistical analysis for distributions (Density and
Cumulative Distribution)
Probability density function (for any
input/output variable);
Cumulative Distribution function (for any
input/output variable);
• Select theoretical distribution from Properties>Distribution
• Distribution parameters are available in Properties>General Information

modeFRONTIER® is a registered product of ESTECO srlCopyright © ESTECO srl 1999-2007
For more information visit:
www.esteco.com or send an e-mail to:
Statistical analysis for distributions (Box Whiskers)
Reports statistical data (symbols and summary table) for any
input/output variable
Q1 (first quartile): cut off lowest 25% of data
Q3 (third quartile): cut off highest 25% of data
U1 (upper fence) = Q3+1.5*(Q3-Q1) : it is the limit over which
points are considered as outliers
L1 (lower fence) = Q1-1.5*(Q3-Q1) : it is the limit below which
points are considered as outliers
MEDIAN: 50% of the distribution data are expected to be lower
(or greater) than the Median value.
DENSEST HALF RANGE: smallest range that contains half of
the distribution samples
CONFIDENCE INTERVAL: 95% of confidence that the mean is
inside this range

modeFRONTIER® is a registered product of ESTECO srlCopyright © ESTECO srl 1999-2007
For more information visit:
www.esteco.com or send an e-mail to:
Statistical analysis for distributions (quantile-quantile plot)
Quantile-quantile plot for any input/output variable: It is used to determine if the data points (abscissa) can be
represented by an analytic distribution (ordinate, you can change the type in properties)
• best fitting distribution would have points on the green 45° line
• if some points are outside the region bounded by red lines (Lillenfor’s test), distributions are different

modeFRONTIER® is a registered product of ESTECO srlCopyright © ESTECO srl 1999-2007
For more information visit:
www.esteco.com or send an e-mail to:
Statistical analysis for distributions (Statistic
summary)
Automatic creation
of all the previous
chart on the
selected
input/output
variables
modeFRONTIER® is a registered product of ESTECO srlCopyright © ESTECO srl 1999-2007
For more information visit:
www.esteco.com or send an e-mail to:
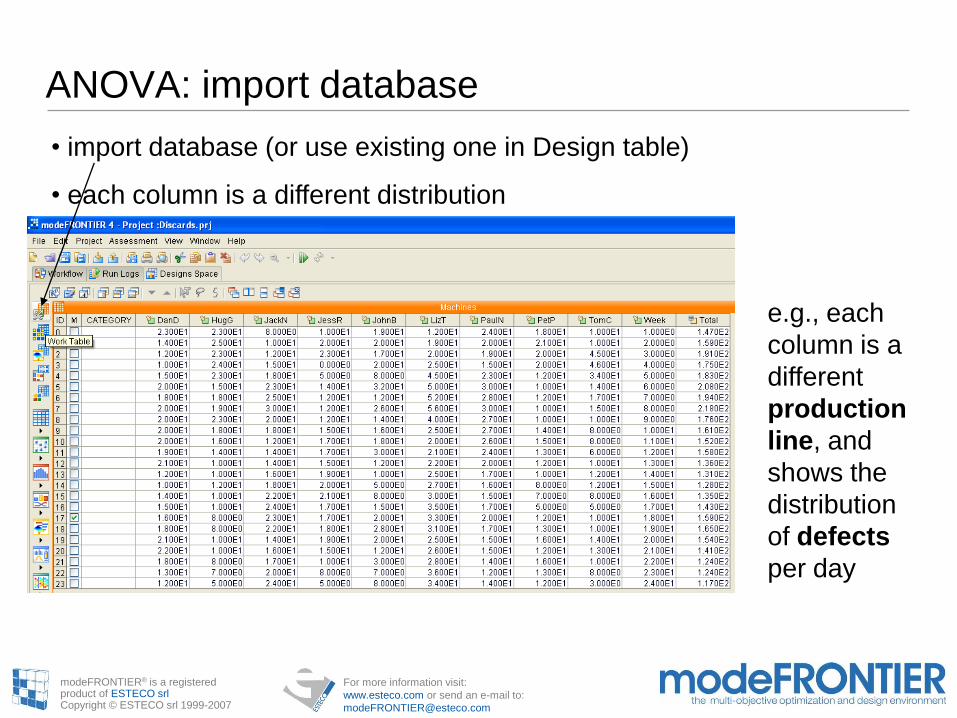
ANOVA: import database
• import database (or use existing one in Design table)
• each column is a different distribution
e.g., each
column is a
different
production
line, and
shows the
distribution
of defects
per day

modeFRONTIER® is a registered product of ESTECO srlCopyright © ESTECO srl 1999-2007
For more information visit:
www.esteco.com or send an e-mail to:
Question: which line is most defective?
History chart
for each line

modeFRONTIER® is a registered product of ESTECO srlCopyright © ESTECO srl 1999-2007
For more information visit:
www.esteco.com or send an e-mail to:
Box Whiskers: Distributions Means and Variances
Box Whiskers
can give a
preliminary
indication of
which is most
defective:
LizT seems to
have highest
mean, but we
need a tool to
validate
distribution
analysis: this
is ANOVA

modeFRONTIER® is a registered product of ESTECO srlCopyright © ESTECO srl 1999-2007
For more information visit:
www.esteco.com or send an e-mail to:
Statistical analysis for distributions (ANOVA)
• Select ANOVA tool
• Select table
• Select variables
(distributions) to analyze
• in this case LizT is
compared with other two
production lines

modeFRONTIER® is a registered product of ESTECO srlCopyright © ESTECO srl 1999-2007
For more information visit:
www.esteco.com or send an e-mail to:
Statistical analysis for distributions (ANOVA)
• ANOVA analysis summary is given to compare influence of different variables
-Variance check: only if variances of variables is similar, ANOVA can be performed
-Hartley's test (Fmax test) is performed to verify that different groups have a similar variance, an assumption needed for ANOVA.
-ANOVA table: determines if variables have different significance

modeFRONTIER® is a registered product of ESTECO srlCopyright © ESTECO srl 1999-2007
For more information visit:
www.esteco.com or send an e-mail to:
Statistical analysis for distributions (ANOVA)
- Box-Whiskers, table of means and differences: if previous tests are valid, indicates the most significant variable
- here we conclude that LizT is statistically the most defective line

modeFRONTIER® is a registered product of ESTECO srlCopyright © ESTECO srl 1999-2007
For more information visit:
www.esteco.com or send an e-mail to:
Tools for correlation analysis
• Main and interaction effects
• Student
• Correlation Matrix
• Scatter Matrix

modeFRONTIER® is a registered product of ESTECO srlCopyright © ESTECO srl 1999-2007
For more information visit:
www.esteco.com or send an e-mail to:
Statistical analysis for correlations (Effect matrix)
• Same effect: output are in this case
represented by bars (mean and
STDEV)
• Effect of one input (abscissa: range is
split in – and + half) to one output
(ordinate: mean value)
modeFRONTIER® is a registered product of ESTECO srlCopyright © ESTECO srl 1999-2007
For more information visit:
www.esteco.com or send an e-mail to:
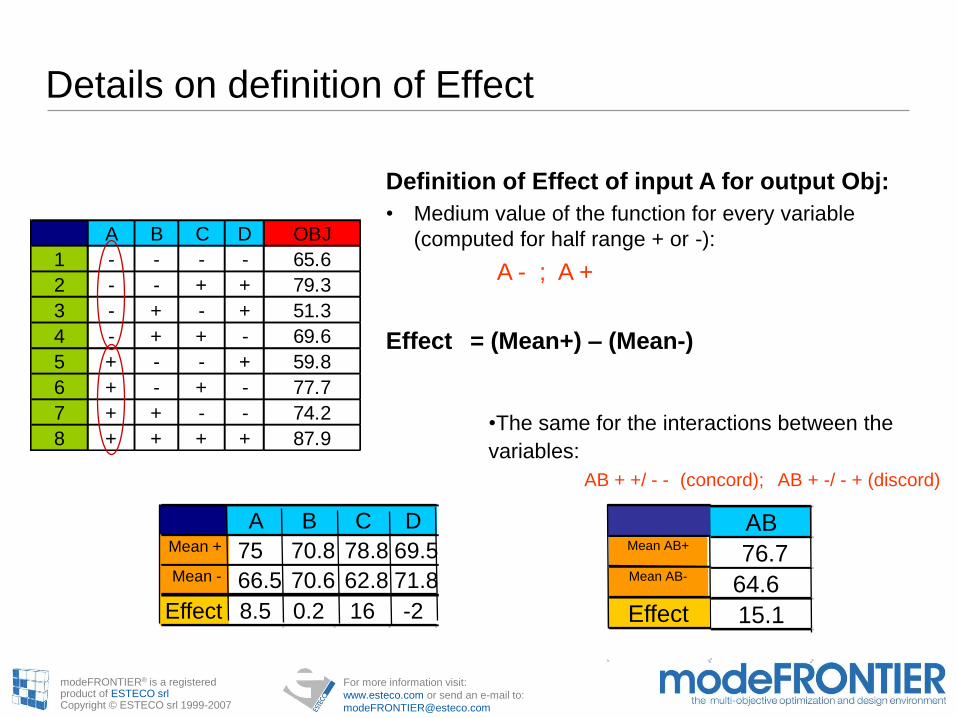
Details on definition of Effect
Definition of Effect of input A for output Obj:
• Medium value of the function for every variable
(computed for half range + or -):
A - ; A +
Effect = (Mean+) – (Mean-)
A B C D OBJ
1 - - - - 65.6
2 - - + + 79.3
3 - + - + 51.3
4 - + + - 69.6
5 + - - + 59.8
6 + - + - 77.7
7 + + - - 74.2
8 + + + + 87.9
A B C DMean + 75 70.8 78.8 69.5Mean - 66.5 70.6 62.8 71.8
Effect 8.5 0.2 16 -2
•The same for the interactions between the
variables:
AB + +/ - - (concord); AB + -/ - + (discord)
AB
76.7
64.6
15.1
Mean AB+
Mean AB-
Effect

modeFRONTIER® is a registered product of ESTECO srlCopyright © ESTECO srl 1999-2007
For more information visit:
www.esteco.com or send an e-mail to:
Statistical analysis for correlations (Student charts)
• t-Student chart shows the
effect of each input variable
accordingly to a selected
output
• Accordingly to t-Student
parameter definition, overall 3D
chart shows the normalised
effect of each input variable
accordingly to each output
Significance indicates the probability that response variable and the factor are not
correlated (i.e. it is the probability that a difference in the response at factor variation is due
to chance).

modeFRONTIER® is a registered product of ESTECO srlCopyright © ESTECO srl 1999-2007
For more information visit:
www.esteco.com or send an e-mail to:
Details on Student test
• Effect size indicates the kind of relationship between the factor and the response variable: a value less than zero indicates that the relationship is inverse.
• An high value of Significanceparameter (max value 0.5) indicates that there is a very high probability that the factor doesn’t influence the response variable.

modeFRONTIER® is a registered product of ESTECO srlCopyright © ESTECO srl 1999-2007
For more information visit:
www.esteco.com or send an e-mail to:
Details on Student test• n+ and n- are the numbers of values in the
upper and lower parts of domain of the input
variable
• M+ and M- are the means of the values for
the output variable x in the upper and lower
parts of domain of the input variable
• SG2 is the general variance
• S+2 and S-
2 are the variances of the population
for the output variable x in the upper and
lower parts of domain of the input variable
If t follows a well known distribution
called Student distribution then M-
and M+ are not statistically distinct
i.e. probably there is no correlation
between factor and response variable
(significance close to 0.5)
- +factor
M+
response
M-

modeFRONTIER® is a registered product of ESTECO srlCopyright © ESTECO srl 1999-2007
For more information visit:
www.esteco.com or send an e-mail to:
• critical t (a=0.1)=1.33 → means that if t≥1.33 the response variable and the factor are correlated with a significance = 10% (i.e. there is 10% of probability that the difference between the range + and - of the response variable is due to chance).
• critical t (a=0.05)=1.73 → means that if t≥1.73 the response variable and the factor are correlated with a significance = 5% (i.e. there is 5% of probability that the difference is due to chance).
• critical t (a=0.01)=2.55 → means that if t≥2.55 the response variable and the factor are correlated with a significance = 1% (i.e. there is 1% of probability that the difference is due to chance).
In the example t =1.688 and the significance is 0.129 → means that the probability that the difference between the range + and - of the response variable is due to chance is 12.9%.
The significance a is always between 0, i.e. correlation between factor and response variable, and 0.5, i.e. not correlation between factor and response variable (50% of probability that that the difference in the response variable ranges is due to chance).
Details on Student test

modeFRONTIER® is a registered product of ESTECO srlCopyright © ESTECO srl 1999-2007
For more information visit:
www.esteco.com or send an e-mail to:
Overall Student chart
For each response (S and V), effect of inputs are reported in an
overall chart on a common scale

modeFRONTIER® is a registered product of ESTECO srlCopyright © ESTECO srl 1999-2007
For more information visit:
www.esteco.com or send an e-mail to:
Statistical analysis for correlations (Correlation chart and
Scatter matrix)
Correlation chart:
• +1 max direct correlation
• -1 max inverse
correlation
• 0 no correlation
Scatter matrix:
• Report correlation,
scatter plot and distribution
charts for a pair of
variables

modeFRONTIER® is a registered product of ESTECO srlCopyright © ESTECO srl 1999-2007
For more information visit:
www.esteco.com or send an e-mail to:
Details on Correlation Matrix
• The correlation is a number (between -1 and 1) describing the degree of relationship between two variables
• The correlation is a measure of the linear association
• If it is exactly equal to 1, the two variables are perfectly positively correlated and the values all lie on a straight line with positive slope
• If it is equal to zero, the variables are uncorrelated, that is linearly unassociated
• If it is equal to -1, then the two variables are perfectly negatively correlated

modeFRONTIER® is a registered product of ESTECO srlCopyright © ESTECO srl 1999-2007
For more information visit:
www.esteco.com or send an e-mail to:
Statistical Analysis: Interaction Effects
Neither the t-Student test nor the
correlation matrix are able to assess if
interaction effects between factors exist.

modeFRONTIER® is a registered product of ESTECO srlCopyright © ESTECO srl 1999-2007
For more information visit:
www.esteco.com or send an e-mail to:
By using DOE Interaction Effects and Effects Matrix is possible to assess if
factors interactions play a role in the response variable.
Statistical Analysis: Interaction Effects

modeFRONTIER® is a registered product of ESTECO srlCopyright © ESTECO srl 1999-2007
For more information visit:
www.esteco.com or send an e-mail to:
Statistical Analysis: Interaction Effects
Doe Interaction Effects
If x[0] and x[1] are both set at upper or lower values the
response variable is higher, further information can be
obtained by the effects matrix chart.

modeFRONTIER® is a registered product of ESTECO srlCopyright © ESTECO srl 1999-2007
For more information visit:
www.esteco.com or send an e-mail to:
Statistical Analysis: Interaction Effects
It is possible to see that,
though x[0] has not a main
effect on the response
variable, increasing both x[0]
and x[1] an higher value of
the response variable is
obtained. On the other side if
both variables are set to
lower values there is no such
an effect.

modeFRONTIER® is a registered product of ESTECO srlCopyright © ESTECO srl 1999-2007
For more information visit:
www.esteco.com or send an e-mail to:
Example 1
How to use modeFRONTIER to get the most relevant
qualitative information from a data-base of experiments

modeFRONTIER® is a registered product of ESTECO srlCopyright © ESTECO srl 1999-2007
For more information visit:
www.esteco.com or send an e-mail to:
Statistical Analysis: Example 1
This experiment was conducted on a catapult – a table-top wooden device
often used to teach design of experiments and statistical process control. The
catapult has several controllable factors and a response easily measurable.

modeFRONTIER® is a registered product of ESTECO srlCopyright © ESTECO srl 1999-2007
For more information visit:
www.esteco.com or send an e-mail to:
Statistical Analysis: Example 1
Variables:
• Response Variable Y = distance
• Factor 1 = band height (height of the pivot point for the rubber bands –
levels were 3.25 and 4.75 inches with a centerpoint level of 4) ;
• Factor 2 = start angle (location of the arm when the operator releases–
starts the forward motion of the arm – levels were 0 and 20 degrees with
a centerpoint level of 10 degrees)
• Factor 3 = rubber bands (number of rubber bands used on the
catapult– levels were 1 and 2 bands)
• Factor 4 = arm length (distance the arm is extended – levels were 0
and 4 inches with a centerpoint level of 2 inches)
• Factor 5 = stop angle (location of the arm where the forward motion of
the arm is stopped and the ball starts flying – levels were 45 and 80
degrees with a centerpoint level of 62 degrees)
A reduced factorial technique was used, the number of designs evaluated is
25-1=16 +4 center points = 20 designs

modeFRONTIER® is a registered product of ESTECO srlCopyright © ESTECO srl 1999-2007
For more information visit:
www.esteco.com or send an e-mail to:
Statistical Analysis: Example 1
Patte rn band he ight sta rt angle rbands arm length stop angle Y_distance
----+ 3.25 0 1 0 80 28
00000 4 10 2 2 62 99
+++++ 4.75 20 2 4 80 126.5
+-++- 4.75 0 2 4 45 126.5
-+++- 3.25 20 2 4 45 45
+---- 4.75 0 1 0 45 35
00000 4 10 1 2 62 45
++--+ 4.75 20 1 0 80 28.25
+--++ 4.75 0 1 4 80 85
-+--- 3.25 20 1 0 45 8
++-+- 4.75 20 1 4 45 36.5
---+- 3.25 0 1 4 45 33
00000 4 10 2 2 62 84.5
+++-- 4.75 20 2 0 45 28.5
--+-- 3.25 0 2 0 45 33.5
-++-+ 3.25 20 2 0 80 36
+-+-+ 4.75 0 2 0 80 84
-+-++ 3.25 20 1 4 80 45
00000 4 10 1 2 62 37.5

modeFRONTIER® is a registered product of ESTECO srlCopyright © ESTECO srl 1999-2007
For more information visit:
www.esteco.com or send an e-mail to:
Statistical Analysis: Example 1
The probability density function and the
box whiskers chart show the large
spread of the data and a pattern that
should be explained by the analysis.

modeFRONTIER® is a registered product of ESTECO srlCopyright © ESTECO srl 1999-2007
For more information visit:
www.esteco.com or send an e-mail to:
Statistical Analysis: Example 1
Student chart is useful to see the relevance and the effects of the different
parameters.

modeFRONTIER® is a registered product of ESTECO srlCopyright © ESTECO srl 1999-2007
For more information visit:
www.esteco.com or send an e-mail to:
Statistical Analysis: Example 1
Interaction effects can play a
role as well. This can be
assessed by the DOE
interaction effects chart: it is
easy to understand if some
parameters have a strong
interaction. Further details can
be gained by the matrix
interaction charts.

modeFRONTIER® is a registered product of ESTECO srlCopyright © ESTECO srl 1999-2007
For more information visit:
www.esteco.com or send an e-mail to:
Statistical Analysis: Example 1
• Run order
interacts with arm
length, band height
and number of
rubber bands.
• Bands height and
number of rubber
bands interact.
• Arm length and
number of rubber
bands interact.

modeFRONTIER® is a registered product of ESTECO srlCopyright © ESTECO srl 1999-2007
For more information visit:
www.esteco.com or send an e-mail to:
Statistical Analysis
• An accurate assessment of the DOE is useful in any
case: it gives a better insight of the problem and can
reduce the complexity, limiting the number of
variables and the variables definition range.
• Be aware: the statistical tools need DOE tables able
to represent correctly all the design space.

modeFRONTIER® is a registered product of ESTECO srlCopyright © ESTECO srl 1999-2007
For more information visit:
www.esteco.com or send an e-mail to:
Example 2
Choosing the proper DOE for statistical analysis

modeFRONTIER® is a registered product of ESTECO srlCopyright © ESTECO srl 1999-2007
For more information visit:
www.esteco.com or send an e-mail to:
Two different
mathematical
functions
F x y A B A B1 1 1
2
2 2
21( , ) [ ( ) ( ) ]
x y, [ , ]
F x y x y2
2 23 1( , ) [( ) ( ) ]
a b
0 5 10
15 2 0
2 0 15
10 0 510 2 0
. .
. .
. .
. .. .a
))cos()sin((
))cos()sin((
2
1
,,
2
1
,,
j
jjijjii
j
jjijjii
baB
baA
aa
],[),( yx
Statistical Analysis: Example 2

modeFRONTIER® is a registered product of ESTECO srlCopyright © ESTECO srl 1999-2007
For more information visit:
www.esteco.com or send an e-mail to:
Statistical Analysis: Example 2
16 Designs computed with Full Factorial
Initial input
variables
Added input
variables
Results
Id x y dummy1 dummy2 o1 o2
0 -3.14 -3.14 -100 -100 -9.45804 -4.5992
1 -3.14 3.14 -100 -100 -9.45883 -17.1592
2 3.14 -3.14 -100 -100 -9.45444 -42.2792
3 3.14 3.14 -100 -100 -9.4553 -54.8392
4 -3.14 -3.14 -100 100 -9.45804 -4.5992
5 -3.14 3.14 -100 100 -9.45883 -17.1592
6 3.14 -3.14 -100 100 -9.45444 -42.2792
7 3.14 3.14 -100 100 -9.4553 -54.8392
8 -3.14 -3.14 100 -100 -9.45804 -4.5992
9 -3.14 3.14 100 -100 -9.45883 -17.1592
10 3.14 -3.14 100 -100 -9.45444 -42.2792
11 3.14 3.14 100 -100 -9.4553 -54.8392
12 -3.14 -3.14 100 100 -9.45804 -4.5992
13 -3.14 3.14 100 100 -9.45883 -17.1592

modeFRONTIER® is a registered product of ESTECO srlCopyright © ESTECO srl 1999-2007
For more information visit:
www.esteco.com or send an e-mail to:
dummy1 and dummy2 have significance 0.5 in both functions.
Hint: “The number of design variables can be reduced.”
Full factorial (or reduced factorial) gives a
complete information on variables if t-Student
test is used.
Statistical Analysis: Example 2

modeFRONTIER® is a registered product of ESTECO srlCopyright © ESTECO srl 1999-2007
For more information visit:
www.esteco.com or send an e-mail to:
16 Designs computed with Random DOE
Id x y dummy1 dummy2 o1 o2
0 -1.83551 -1.05044 46.17462 -17.9918 -42.0142 -1.35857
1 2.912641 2.762534 93.55936 -98.7799 -9.76235 -49.116
2 -0.64596 -0.95748 89.43894 87.41874 -61.4466 -5.5433
3 -2.41208 1.699224 -41.1941 1.290129 -4.06747 -7.63147
4 -0.76467 -2.2626 31.9732 -68.6569 -39.9631 -6.59087
5 -3.1086 0.145397 38.9939 61.05611 -5.06738 -1.32373
6 -0.11462 0.279802 48.79488 -71.5972 -32.432 -9.9633
7 0.774715 -1.97997 15.43154 -59.0159 -22.5719 -15.2088
8 -2.02205 0.253423 -97.8798 -67.7968 -17.0172 -2.52746
9 -0.66229 -1.77334 94.77948 -50.9151 -52.725 -6.06293
10 2.449131 -2.89945 -13.5914 -53.3753 -6.8771 -33.3009
11 -2.38758 0.957482 18.47185 31.0331 -3.9244 -4.20679
12 -0.78728 -0.23019 96.87969 -58.6559 -49.5447 -5.48876
13 0.026065 3.133719 -33.2733 -11.3511 -13.0261 -26.2447
Initial input
variables
Added input
variables
Results
Statistical Analysis: Example 2

modeFRONTIER® is a registered product of ESTECO srlCopyright © ESTECO srl 1999-2007
For more information visit:
www.esteco.com or send an e-mail to:
Random DOE does not provide
reasonable coverage of the
experiments space unless the number
of samples is large enough to cover
uniformly the variables range.
The variable significances are not
correct.
Statistical Analysis: Example 2