design of experiments: one factor and randomized …menasce/cs700/files/onefactorexpdesign.pdf ·...
TRANSCRIPT

1
© 2001. D. A. Menascé. All Rights Reserved.
1
Design of Experiments: One Factor and Randomized Block
Experiments
Prof. Daniel A. MenasceDept. of Computer ScienceGeorge Mason University
© 2001. D. A. Menascé. All Rights Reserved.
2
Basic Notions in Design of Experiments
• Response: what you want to measure.
• Factor: what affects the response.
• Level: value of a factor.
Response
CPU Clock Frequency
(MHz) Number of CPUsMain Memory
(MB)
Benchmark Execution Time (sec)
550 1 128 25.0750 1 128 32.01000 1 128 48.0550 2 128 19.0750 2 128 13.51000 2 128 10.0550 1 256 23.0750 1 256 29.01000 1 256 45.0550 2 256 16.5750 2 256 11.81000 2 256 8.8
Factors
Leve
ls

2
© 2001. D. A. Menascé. All Rights Reserved.
3
Comparing Means of Various Groups
• ANOVA: Analysis of Variance.• Consider c groups (each group is a level of
a factor). • Subdivide total variation in the response
into variations attributable to differences among the c groups and differences withinthe c groups (experimental error).
© 2001. D. A. Menascé. All Rights Reserved.
4
A B C D11 12 18 1113 14 16 1217 17 18 1617 19 20 1515 21 22 1416 18 15 1714 19 17 1310 18 21 1612 16 16 1714 18 20 18
Page Replacement Algorithm
• A, B, C, and D are different page replacement algorithms.• Factor: page replacement algorithm.• Levels: A, B, C, and D.• Number in each column: running times of programs under
each replacement algorithm.

3
© 2001. D. A. Menascé. All Rights Reserved.
5
How about the Influence of Uncontrolled and Unforeseen
Factors?• The running time of a program depends on
many other factors. Its locality of reference plays a role in the effectiveness of a page replacement algorithm.
• Randomization: consider a large set of programs and randomly assign programs to each group.
© 2001. D. A. Menascé. All Rights Reserved.
6
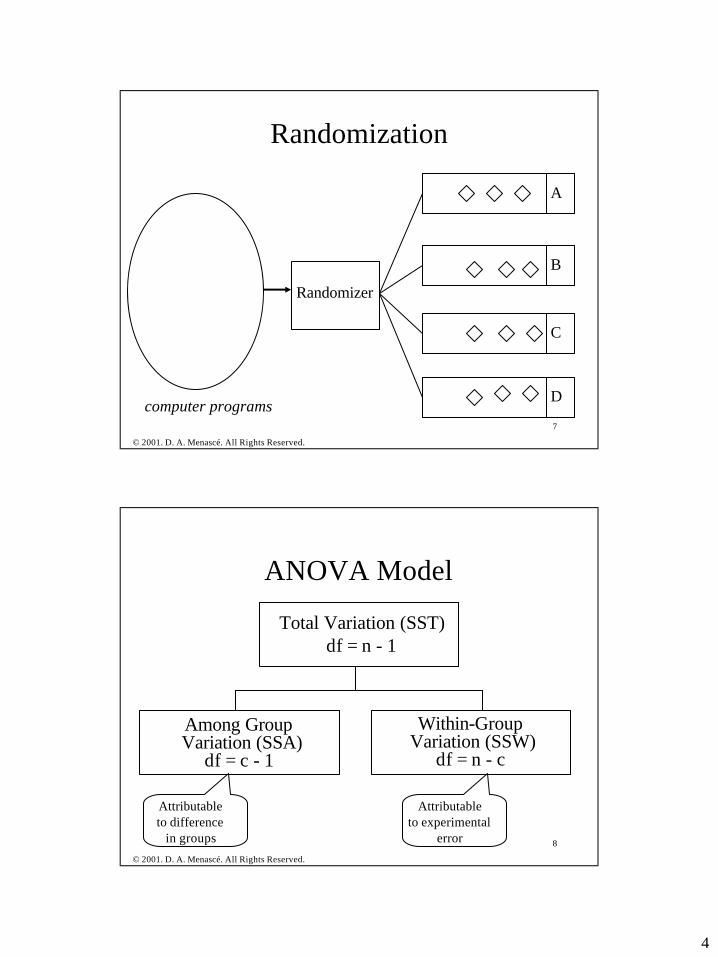
Randomization
Randomizer
A
B
C
Dcomputer programs
4
© 2001. D. A. Menascé. All Rights Reserved.
7
Randomization
Randomizer
A
B
C
Dcomputer programs
© 2001. D. A. Menascé. All Rights Reserved.
8
ANOVA Model
Total Variation (SST)df = n - 1
Among GroupVariation (SSA)
df = c - 1
Within-GroupVariation (SSW)
df = n - c
Attributableto experimental
error
Attributableto difference
in groups

5
© 2001. D. A. Menascé. All Rights Reserved.
9
ANOVA
• Assumptions:– c groups or levels of the factor being examined
represent populations whose outcome measurements are randomly and independently drawn and follow a normal distribution and have equal variances.
• Hypotheses:
cH µµµ === ...: 210
c)1,...,(j equal are allnot :1 =jH µ
© 2001. D. A. Menascé. All Rights Reserved.
10
ANOVA Model
Total Variation (SST)df = n - 1
Among GroupVariation (SSA)
df = c - 1
Within-GroupVariation (SSW)
df = n - c
6
© 2001. D. A. Menascé. All Rights Reserved.
11
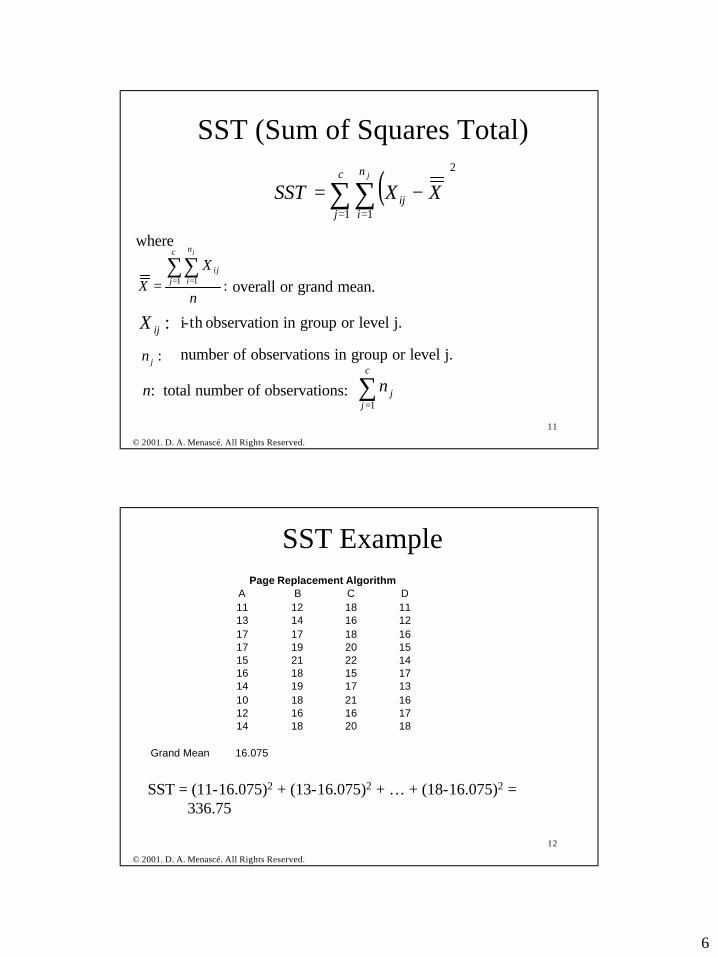
SST (Sum of Squares Total)
( )2
1 1∑∑
= =
−=c
j
n
iij
j
XXSST
where
:1 1
n
XX
c
j
n
iij
j
∑∑= == overall or grand mean.
:ijX i-th observation in group or level j.
:jn number of observations in group or level j.
n: total number of observations: ∑=
c
jjn
1
© 2001. D. A. Menascé. All Rights Reserved.
12
SST Example
SST = (11-16.075)2 + (13-16.075)2 + … + (18-16.075)2 =336.75
A B C D11 12 18 1113 14 16 1217 17 18 1617 19 20 1515 21 22 1416 18 15 1714 19 17 1310 18 21 1612 16 16 1714 18 20 18
Grand Mean 16.075
Page Replacement Algorithm

7
© 2001. D. A. Menascé. All Rights Reserved.
13
ANOVA Model
Total Variation (SST)df = n - 1
Among GroupVariation (SSA)
df = c - 1
Within-GroupVariation (SSW)
df = n - c
© 2001. D. A. Menascé. All Rights Reserved.
14
SSA (Sum of Squares Among Groups)
( )∑=
−=c
jjj XXnSSA
1
2
where
:1 1
n
XX
c
j
n
iij
j
∑∑= == overall or grand mean.
:jX sample mean corresponding to group or level j.
:jn number of observations in group or level j.

8
© 2001. D. A. Menascé. All Rights Reserved.
15
SSA ExampleA B C D11 12 18 1113 14 16 1217 17 18 1617 19 20 1515 21 22 1416 18 15 1714 19 17 1310 18 21 1612 16 16 1714 18 20 18
Mean 13.9 17.2 18.3 14.9
Grand Mean 16.075
Page Replacement Algorithm
SSA = 10 (13.9-16.075)2 + 10 (17.2-16.075)2 +10 (18.3- 16.075)2 + 10 (14.9- 16.075)2
= 123.275
© 2001. D. A. Menascé. All Rights Reserved.
16
ANOVA Model
Total Variation (SST)df = n - 1
Among GroupVariation (SSA)
df = c - 1
Within-GroupVariation (SSW)
df = n - c

9
© 2001. D. A. Menascé. All Rights Reserved.
17
SSW (Sum of Squares Within Groups)
where
:jX sample mean corresponding to group or level j.
( )2
1 1∑∑= =
−=c
j
n
ijij
j
XXSSW
:ijX i-th observation in group or level j.
© 2001. D. A. Menascé. All Rights Reserved.
18
SSW ExampleA B C D11 12 18 1113 14 16 1217 17 18 1617 19 20 1515 21 22 1416 18 15 1714 19 17 1310 18 21 1612 16 16 1714 18 20 18
Mean 13.9 17.2 18.3 14.9
Page Replacement Algorithm
SSW = (11-13.9)2 + …+(14-13.9)2 +(12-17.2)2 + … + (18-17.2)2 +(18-18.3)2 + … + (20-18.3)2 +(11-14.9)2 + … + (18-14.9)2
= 213.5

10
© 2001. D. A. Menascé. All Rights Reserved.
19
ANOVA Model
Total Variation (SST)df = n - 1
Among GroupVariation (SSA)
df = c - 1
Within-GroupVariation (SSW)
df = n - c
SST = SSA + SSW
© 2001. D. A. Menascé. All Rights Reserved.
20
ANOVA Model: Mean Squares
1
1
−=
−=
−=
nSST
MST
cnSSW
MSW
cSSA
MSA
The mean squares are variances!If there are no real differences among the c groups, MSA, MSW, and MST provide estimates for the
variance inherent in the data.

11
© 2001. D. A. Menascé. All Rights Reserved.
21
The one-way ANOVA F Test Static
MSWMSAF =
• The F-test statistic follows an F distribution with c-1 degrees offreedom in the numerator corresponding to MSA and n-c degreesof freedom in the denominator corresponding to MSW.
• Null hypothesis:H0: µ1=µ2=…=µc
•Alternative hypothesis:H1:Not all µj are equal (j=1,…c)
© 2001. D. A. Menascé. All Rights Reserved.
22
α
Region of rejection
Region of non-rejection
Fu: Critical Value
1−α
Reject Ho if F > Fu

12
© 2001. D. A. Menascé. All Rights Reserved.
23
ANOVA Summary Table
Source of Variation
Degrees of Freedom
Sum of Squares
Mean Square (Variance) F
Among groups c-1 SSA MSA= SSA/(c-1) F=MSA/MSWWithin Groups n-c SSW MSW=SSW/(n-c)Total n-1 SST
© 2001. D. A. Menascé. All Rights Reserved.
24
ANOVA ExampleA B C D11 12 18 1113 14 16 1217 17 18 1617 19 20 1515 21 22 1416 18 15 1714 19 17 1310 18 21 1612 16 16 1714 18 20 18
Mean 13.9 17.2 18.3 14.9
Grand Mean 16.075SSA 47.30625 12.65625 49.50625 13.80625 123.275SSW 213.5SST 336.775
MSA 41.091667MSW 5.9305556F 6.93
df numer. 3df denom. 36Fu 2.87 (from table)
Page Replacement Algorithm
F > Fu reject Ho.Algorithms A, B, C, andD have a significantdifference at 0.05 levelof significance.
c-1 = 4-1n-c = 40-4
αF=MSA/MSW

13
© 2001. D. A. Menascé. All Rights Reserved.
25
ANOVA With ExcelAnova: Single Factor
SUMMARYGroups Count Sum Average Variance
Column 1 10 139 13.9 5.877778Column 2 10 172 17.2 6.844444Column 3 10 183 18.3 5.566667Column 4 10 149 14.9 5.433333
ANOVASource of Variation SS df MS F P-value F crit
Between Groups 123.275 3 41.09167 6.928806 0.000844 2.866265Within Groups 213.5 36 5.930556
Total 336.775 39
Since the p-value is less than α = 0.05, reject Ho.
© 2001. D. A. Menascé. All Rights Reserved.
26
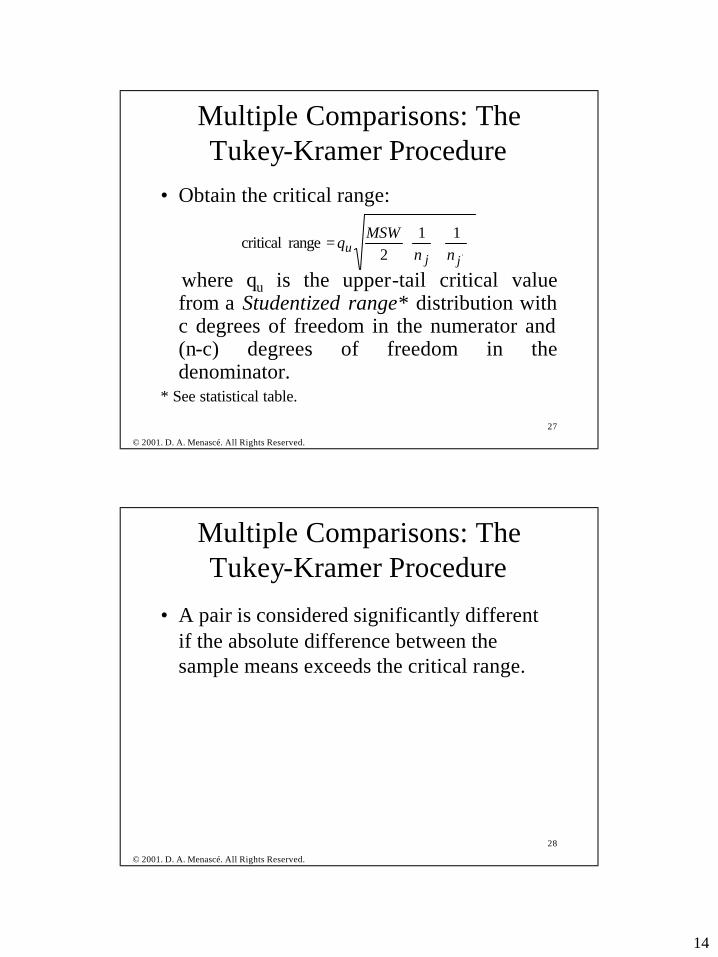
Multiple Comparisons: The Tukey-Kramer Procedure
• If Ho is rejected, then the question is “Which groups are different?”
• Use the Tukey-Kramer procedure to compare all pairs of groups simultaneously.
• Must compute the differences for among all c(c-1)/2 pairs of means.
'jj XX −'jj ≠
14
© 2001. D. A. Menascé. All Rights Reserved.
27
Multiple Comparisons: The Tukey-Kramer Procedure
• Obtain the critical range:
where qu is the upper-tail critical value from a Studentized range* distribution with c degrees of freedom in the numerator and (n-c) degrees of freedom in the denominator.
* See statistical table.
+=
'
112
range criticaljj
u nnMSW
q
© 2001. D. A. Menascé. All Rights Reserved.
28
Multiple Comparisons: The Tukey-Kramer Procedure
• A pair is considered significantly different if the absolute difference between the sample means exceeds the critical range.

15
© 2001. D. A. Menascé. All Rights Reserved.
29
Multiple Comparisons: The Tukey-Kramer Procedure
critical range|XA-XB| 3.3 2.9341 A significantly different than B|XA-XC| 4.4 2.9341 A significantly different than C|XA-XD| 1 2.9341 A not significantly different than D|XB-XC| 1.1 2.9341 B not significantly different than C|XB-XD| 2.3 2.9341 B not significantly different than D|XC-XD| 3.4 2.9341 C significantly different than D
qu 3.81 (from table)MSW 5.930556
>>
>
<<<
© 2001. D. A. Menascé. All Rights Reserved.
30
Reviewing ANOVA Assumptions• Randomness and independence: must always be
met.• Normality: ANOVA F test is robust as long as
distributions are not extremely different from a normal distribution particularly for large samples.
• Homogeneity of variance:– If unequal sample sizes between groups, different
variances is a problem.– Should try to use same-size groups.
2c
22
21 s...ss ===
16
© 2001. D. A. Menascé. All Rights Reserved.
31
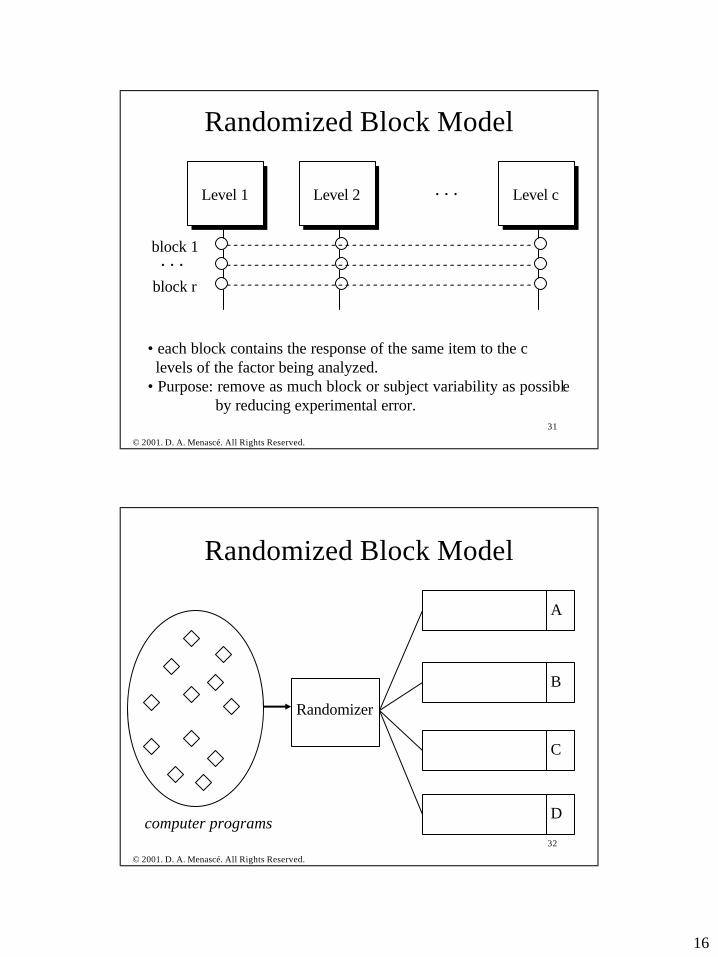
Randomized Block Model
Level 1 Level 2 Level c
block 1
block r
. . .
. . .
• each block contains the response of the same item to the clevels of the factor being analyzed.
• Purpose: remove as much block or subject variability as possibleby reducing experimental error.
© 2001. D. A. Menascé. All Rights Reserved.
32
Randomized Block Model
Randomizer
A
B
C
Dcomputer programs
17
© 2001. D. A. Menascé. All Rights Reserved.
33
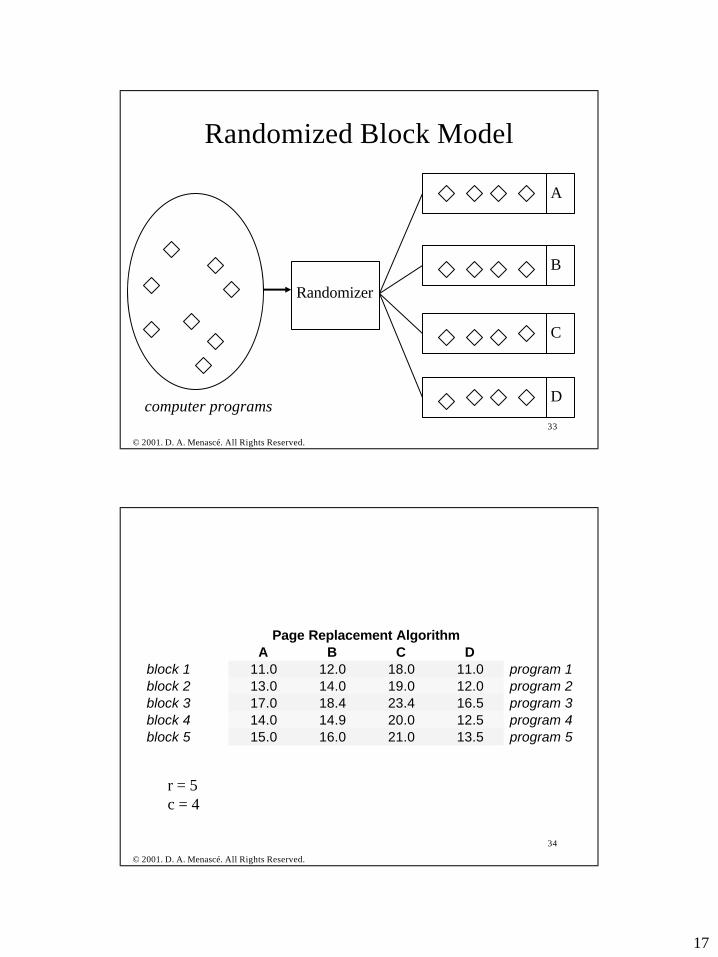
Randomized Block Model
Randomizer
A
B
C
Dcomputer programs
© 2001. D. A. Menascé. All Rights Reserved.
34
A B C Dblock 1 11.0 12.0 18.0 11.0 program 1block 2 13.0 14.0 19.0 12.0 program 2block 3 17.0 18.4 23.4 16.5 program 3block 4 14.0 14.9 20.0 12.5 program 4block 5 15.0 16.0 21.0 13.5 program 5
Page Replacement Algorithm
r = 5c = 4

18
© 2001. D. A. Menascé. All Rights Reserved.
35
ANOVA Model for Randomized Block Design
Total Variation (SST)df = n - 1
Among GroupVariation (SSA)
df = c - 1
Among-BlockVariation (SSBL)
df = r-1Random Variation (SSE)
df = (r-1)(c-1)
SST = SSA+SSBL+SSE
Note: n = r x c
© 2001. D. A. Menascé. All Rights Reserved.
36
ANOVA Model for Randomized Block Design
Total Variation (SST)df = n - 1
Among GroupVariation (SSA)
df = c - 1
Among-BlockVariation (SSBL)
df = r-1Random Variation (SSE)
df = (r-1)(c-1)
SST = SSA+SSBL+SSE
Note: n = r x c
19
© 2001. D. A. Menascé. All Rights Reserved.
37
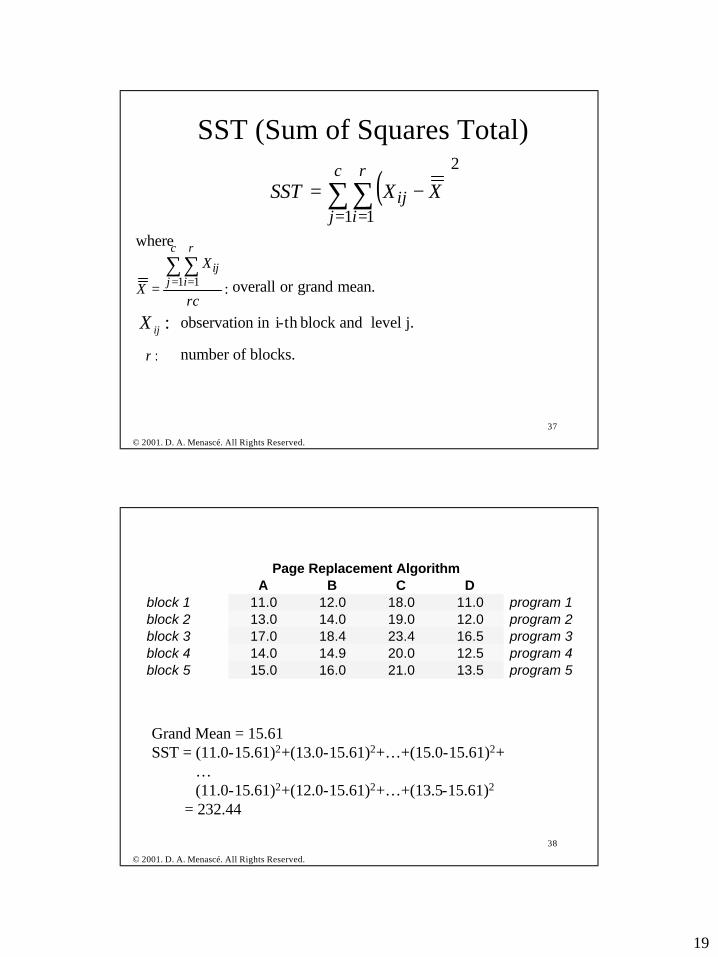
SST (Sum of Squares Total)
( )2
1 1∑∑= =
−=c
j
r
iij XXSST
where
:1 1
rc
X
X
c
j
r
iij∑∑
= == overall or grand mean.
:ijX observation in i-th block and level j.
:r number of blocks.
© 2001. D. A. Menascé. All Rights Reserved.
38
A B C Dblock 1 11.0 12.0 18.0 11.0 program 1block 2 13.0 14.0 19.0 12.0 program 2block 3 17.0 18.4 23.4 16.5 program 3block 4 14.0 14.9 20.0 12.5 program 4block 5 15.0 16.0 21.0 13.5 program 5
Page Replacement Algorithm
Grand Mean = 15.61SST = (11.0-15.61)2+(13.0-15.61)2+…+(15.0-15.61)2+
…(11.0-15.61)2+(12.0-15.61)2+…+(13.5-15.61)2
= 232.44

20
© 2001. D. A. Menascé. All Rights Reserved.
39
ANOVA Model for Randomized Block Design
Total Variation (SST)df = n - 1
Among GroupVariation (SSA)
df = c - 1
Among-BlockVariation (SSBL)
df = r-1Random Variation (SSE)
df = (r-1)(c-1)
SST = SSA+SSBL+SSE
Note: n = r x c
© 2001. D. A. Menascé. All Rights Reserved.
40
SSA (Sum of Squares Among Group)
( )2
1.∑
=−=
c
jj XXrSSA
where
:1. r
X
X
r
iij
j
∑== group mean.
21
© 2001. D. A. Menascé. All Rights Reserved.
41
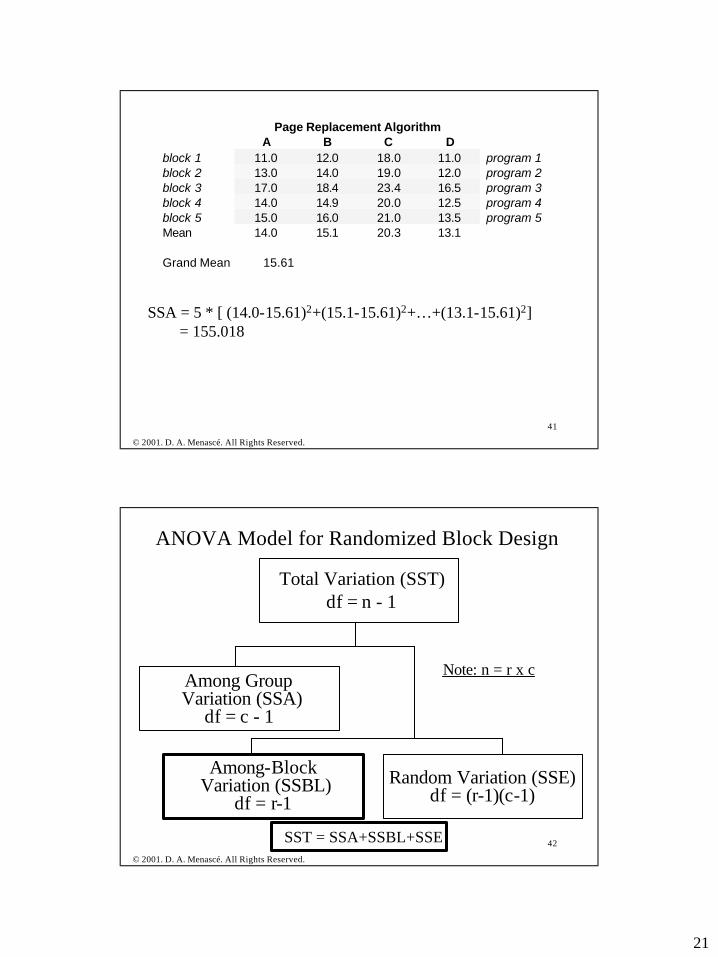
A B C Dblock 1 11.0 12.0 18.0 11.0 program 1block 2 13.0 14.0 19.0 12.0 program 2block 3 17.0 18.4 23.4 16.5 program 3block 4 14.0 14.9 20.0 12.5 program 4block 5 15.0 16.0 21.0 13.5 program 5Mean 14.0 15.1 20.3 13.1
Grand Mean 15.61
Page Replacement Algorithm
SSA = 5 * [ (14.0-15.61)2+(15.1-15.61)2+…+(13.1-15.61)2]= 155.018
© 2001. D. A. Menascé. All Rights Reserved.
42
ANOVA Model for Randomized Block Design
Total Variation (SST)df = n - 1
Among GroupVariation (SSA)
df = c - 1
Among-BlockVariation (SSBL)
df = r-1Random Variation (SSE)
df = (r-1)(c-1)
SST = SSA+SSBL+SSE
Note: n = r x c

22
© 2001. D. A. Menascé. All Rights Reserved.
43
SSBL (Sum of Squares Among Blocks)
( )2
1.∑
=−=
r
ii XXcSSBL
where
:1. c
X
X
c
jij
i
∑== block mean.
© 2001. D. A. Menascé. All Rights Reserved.
44
A B C D Meanblock 1 11.0 12.0 18.0 11.0 program 1 13.0block 2 13.0 14.0 19.0 12.0 program 2 14.5block 3 17.0 18.4 23.4 16.5 program 3 18.8block 4 14.0 14.9 20.0 12.5 program 4 15.4block 5 15.0 16.0 21.0 13.5 program 5 16.4Mean 14.0 15.1 20.3 13.1
Grand Mean 15.61
Page Replacement Algorithm
SSBL = 4 * [(13.0-15.61)2+(14.5-15.61)2+…+(16.4-15.61)2]= 76.133

23
© 2001. D. A. Menascé. All Rights Reserved.
45
ANOVA Model for Randomized Block Design
Total Variation (SST)df = n - 1
Among GroupVariation (SSA)
df = c - 1
Among-BlockVariation (SSBL)
df = r-1Random Variation (SSE)
df = (r-1)(c-1)
SST = SSA+SSBL+SSE
Note: n = r x c
© 2001. D. A. Menascé. All Rights Reserved.
46
SSE (Random Error)
( )2
1 1..∑∑
= =+−−=
c
j
r
iijij XXXXSSE
24
© 2001. D. A. Menascé. All Rights Reserved.
47
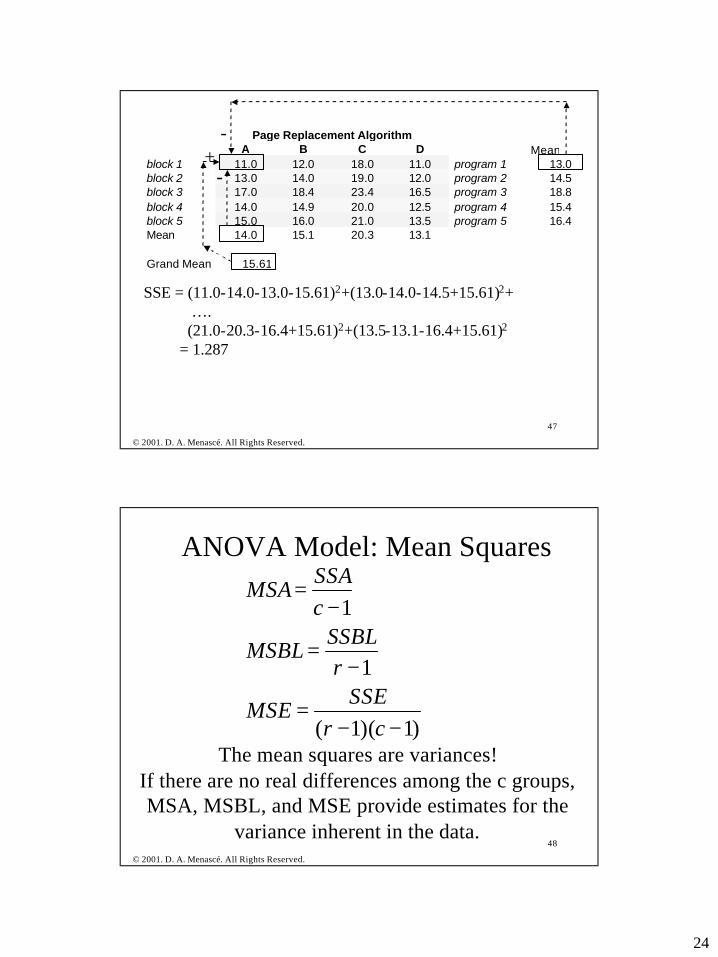
SSE = (11.0-14.0-13.0-15.61)2+(13.0-14.0-14.5+15.61)2+….(21.0-20.3-16.4+15.61)2+(13.5-13.1-16.4+15.61)2
= 1.287
A B C D Meanblock 1 11.0 12.0 18.0 11.0 program 1 13.0block 2 13.0 14.0 19.0 12.0 program 2 14.5block 3 17.0 18.4 23.4 16.5 program 3 18.8block 4 14.0 14.9 20.0 12.5 program 4 15.4block 5 15.0 16.0 21.0 13.5 program 5 16.4Mean 14.0 15.1 20.3 13.1
Grand Mean 15.61
Page Replacement Algorithm
+-
-
© 2001. D. A. Menascé. All Rights Reserved.
48
ANOVA Model: Mean Squares
)1)(1(
1
1
−−=
−=
−=
crSSE
MSE
rSSBL
MSBL
cSSA
MSA
The mean squares are variances!If there are no real differences among the c groups, MSA, MSBL, and MSE provide estimates for the
variance inherent in the data.

25
© 2001. D. A. Menascé. All Rights Reserved.
49
ANOVA Hypothesis Testing
cH .2..10 ...: µµµ ===
equal. are ),...,1( allNot : .1 cjH j =µ
MSEMSAF =F-Test statistic:
The F-test statistic follows an F distribution with (c-1) degreesOf freedom in the numerator and (r-1)(c-1) in the denominator.
FuFH > if Reject 0
© 2001. D. A. Menascé. All Rights Reserved.
50
A B C D Meanblock 1 11.0 12.0 18.0 11.0 program 1 13.0block 2 13.0 14.0 19.0 12.0 program 2 14.5block 3 17.0 18.4 23.4 16.5 program 3 18.8block 4 14.0 14.9 20.0 12.5 program 4 15.4block 5 15.0 16.0 21.0 13.5 program 5 16.4Mean 14.0 15.1 20.3 13.1
Grand Mean 15.61SSA 155.018SSE 1.287SSBL 76.133SST 232.438
MSA 51.67267MSBL 19.03325MSE 0.10725F 481.80
df numer. 3df denom. 12Fu 7.23 (from table)
Page Replacement Algorithm
F > Fu reject Ho
F=MSA/MSE

26
© 2001. D. A. Menascé. All Rights Reserved.
51
Anova: Two-Factor Without Replication
SUMMARY Count Sum Average VarianceRow 1 4 52 13 11.333Row 2 4 58 14.5 9.667Row 3 4 75.3 18.825 9.949Row 4 4 61.4 15.35 10.590Row 5 4 65.5 16.375 10.563
Column 1 5 70 14 5Column 2 5 75.3 15.06 5.638Column 3 5 101.4 20.28 4.292Column 4 5 65.5 13.1 4.425
ANOVASource of Variation SS df MS F P-value F crit
Rows (blocks) 76.133 4 19.03325 177.4662 1.46E-10 3.25916Columns (groups) 155.018 3 51.67267 481.79643 9.11E-13 3.4903Error 1.287 12 0.10725
Total 232.438 19
Since the p-value is less than α = 0.05, reject Ho.Since F > F critical, reject Ho.
=MSA/MSE
MSA
MSE
© 2001. D. A. Menascé. All Rights Reserved.
52
Estimated Relative Efficiency (RE)
MSErcMSEcrMSBLr
RE)1(
)1()1(−
−+−=
• Used to assess if blocking results in an increase in precision incomparing the different groups.
MSA 51.67267 RE 38.2MSBL 19.03325MSE 0.10725
SSBL
n-1
• If blocking is not used, we would need 38.2 times as manyobservations to obtain the same precision in comparing the groups.
=
27
© 2001. D. A. Menascé. All Rights Reserved.
53
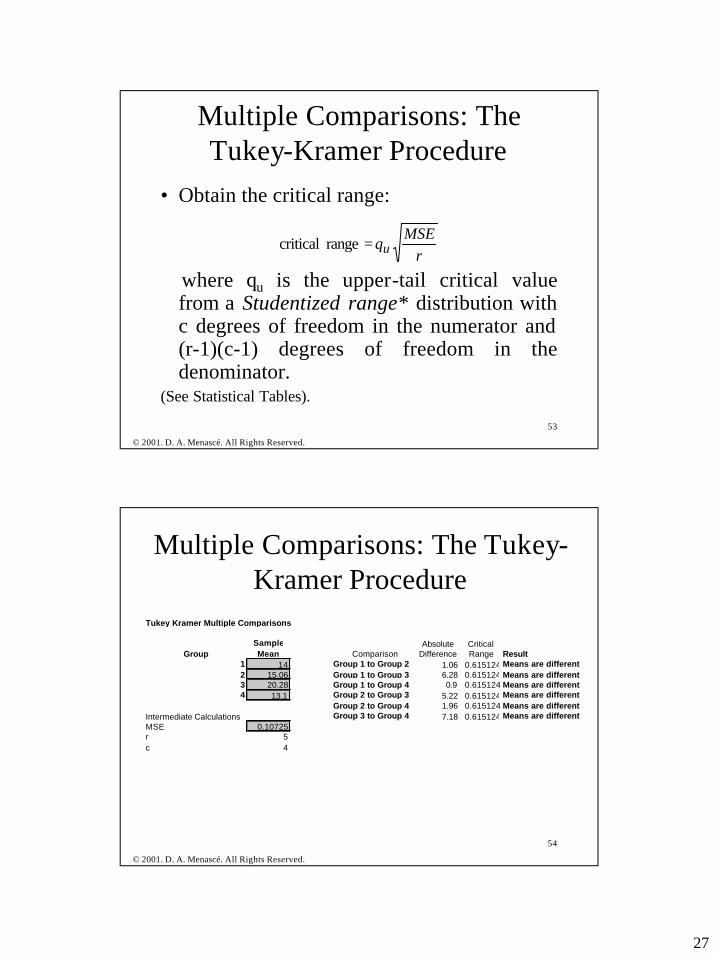
Multiple Comparisons: The Tukey-Kramer Procedure
• Obtain the critical range:
where qu is the upper-tail critical value from a Studentized range* distribution with c degrees of freedom in the numerator and (r-1)(c-1) degrees of freedom in the denominator.
(See Statistical Tables).
rMSE
qu range critical =
© 2001. D. A. Menascé. All Rights Reserved.
54
Multiple Comparisons: The Tukey-Kramer Procedure
Tukey Kramer Multiple Comparisons
Sample Absolute CriticalGroup Mean Comparison Difference Range Result
1 14 Group 1 to Group 2 1.06 0.615124 Means are different2 15.06 Group 1 to Group 3 6.28 0.615124 Means are different3 20.28 Group 1 to Group 4 0.9 0.615124 Means are different4 13.1 Group 2 to Group 3 5.22 0.615124 Means are different
Group 2 to Group 4 1.96 0.615124 Means are differentIntermediate Calculations Group 3 to Group 4 7.18 0.615124 Means are differentMSE 0.10725r 5c 4