design, optimization, and evaluation of integrally ... · design, optimization and evaluation of...
TRANSCRIPT

September 2011
NASA/TP–2011-217178
Design, Optimization and Evaluation of Integrally Stiffened Al 7050 Panel with Curved Stiffeners Wesley C. H. Slemp Virginia Polytechnic Institute and State University, Blacksburg, Virginia R. Keith Bird Langley Research Center, Hampton, Virginia Rakesh K. Kapania Virginia Polytechnic Institute and State University, Blacksburg, Virginia David Havens, Ashley Norris, and Robert Olliffe Lockheed Martin Aeronautics Company, Marietta, Georgia
https://ntrs.nasa.gov/search.jsp?R=20110016508 2018-07-12T00:48:29+00:00Z

NASA STI Program . . . in Profile
Since its founding, NASA has been dedicated to the advancement of aeronautics and space science. The NASA scientific and technical information (STI) program plays a key part in helping NASA maintain this important role.
The NASA STI program operates under the auspices of the Agency Chief Information Officer. It collects, organizes, provides for archiving, and disseminates NASA’s STI. The NASA STI program provides access to the NASA Aeronautics and Space Database and its public interface, the NASA Technical Report Server, thus providing one of the largest collections of aeronautical and space science STI in the world. Results are published in both non-NASA channels and by NASA in the NASA STI Report Series, which includes the following report types:
TECHNICAL PUBLICATION. Reports of
completed research or a major significant phase of research that present the results of NASA programs and include extensive data or theoretical analysis. Includes compilations of significant scientific and technical data and information deemed to be of continuing reference value. NASA counterpart of peer-reviewed formal professional papers, but having less stringent limitations on manuscript length and extent of graphic presentations.
TECHNICAL MEMORANDUM. Scientific
and technical findings that are preliminary or of specialized interest, e.g., quick release reports, working papers, and bibliographies that contain minimal annotation. Does not contain extensive analysis.
CONTRACTOR REPORT. Scientific and
technical findings by NASA-sponsored contractors and grantees.
CONFERENCE PUBLICATION. Collected
papers from scientific and technical conferences, symposia, seminars, or other meetings sponsored or co-sponsored by NASA.
SPECIAL PUBLICATION. Scientific,
technical, or historical information from NASA programs, projects, and missions, often concerned with subjects having substantial public interest.
TECHNICAL TRANSLATION. English-
language translations of foreign scientific and technical material pertinent to NASA’s mission.
Specialized services also include creating custom thesauri, building customized databases, and organizing and publishing research results. For more information about the NASA STI program, see the following: Access the NASA STI program home page at
http://www.sti.nasa.gov E-mail your question via the Internet to
[email protected] Fax your question to the NASA STI Help Desk
at 443-757-5803 Phone the NASA STI Help Desk at
443-757-5802 Write to:
NASA STI Help Desk NASA Center for AeroSpace Information 7115 Standard Drive Hanover, MD 21076-1320

National Aeronautics and Space Administration Langley Research Center Hampton, Virginia 23681-2199
September 2011
NASA/TP–2011-217178
Design, Optimization and Evaluation of Integrally Stiffened Al 7050 Panel with Curved Stiffeners Wesley C. H. Slemp Virginia Polytechnic Institute and State University, Blacksburg, Virginia R. Keith Bird Langley Research Center, Hampton, Virginia Rakesh K. Kapania Virginia Polytechnic Institute and State University, Blacksburg, Virginia David Havens, Ashley Norris, and Robert Olliffe Lockheed Martin Aeronautics Company, Marietta, Georgia
Available from:
NASA Center for AeroSpace Information 7115 Standard Drive
Hanover, MD 21076-1320 443-757-5802
Acknowledgments
The work presented here was funded under NASA Subsonic Fixed Wing Hybrid Body Technologies NRA (NASA NN L08AA02C) with Ms. Karen M. Brown Taminger as the API and Ms. Cynthia Lach as the COTR. We are thankful to both Ms. Taminger and Ms. Lach for their suggestions. The authors would like to thank Mr. John Barnes and Dr. Steve Englestad, both of Lockheed Martin Aeronautics Company of Marietta, GA, for technical discussions. The tests that were conducted at NASA Langley Research Center were sponsored by the Subsonic Fixed Wing project of the Aeronautics Research Mission Directorate. The bulk of this paper was previously published in the AIAA Journal of Aircraft. Appendix C was added to create the current publication to provide a complete archive of the load-strain curves and load-displacement curves for each strain gage and displacement measurement location.
The use of trademarks or names of manufacturers in this report is for accurate reporting and does not constitute an official endorsement, either expressed or implied, of such products or manufacturers by the National Aeronautics and Space Administration.

1
Abstract A curvilinear stiffened panel was designed, manufactured, and tested at the NASA
Langley Research Center in the Combined Load Test Fixture. The panel was optimized for minimum mass subjected to constraints on buckling load, yielding, and crippling or local stiffener failure using a new analysis tool named EBF3PanelOpt. The panel was designed for a combined compression-shear loading configuration that is a realistic load case for a typical aircraft wing panel. The panel was loaded beyond buckling and strains and out-of-plane displacements were extracted from a total of 32 strain gages and 5 linear variable displacement transducers. The VIC-3D system was utilized to obtain full field displacements/strains in the lower half of the stiffened side of the panel. The experimental data were compared with the strains and out-of-plane deflections from a high fidelity nonlinear finite element analysis. The experimental data were also compared with linear elastic finite element results of the panel/test-fixture assembly. The numerical results indicated that the panel buckles at the linearly elastic buckling eigenvalue predicted for the panel/test-fixture assembly. The out-of-plane displacement measured by the VIC-3D system compared well both qualitatively and quantitatively with the nonlinear finite element solution in the post-buckling regime. Furthermore, the experimental strains prior to buckling compared well with both the linear and nonlinear finite element model. For the post-buckling regime, the nonlinear model compared well at some locations and poorly at others.
1 Introduction Topology optimization methods for continuum structures have increased in popularity in recent
years. With these approaches, both two and three dimensional optimal solid designs can be obtained without the traditional trial and error decision making process that design engineers have used for decades. Bendsoe and Kikuchi developed the theoretical foundation for the topology optimization methodology in 1988 (ref.1). The first commercial software was developed and released in 1994 and utilized the topology optimization approach (ref.2).
A critical limitation of the topology optimization approach is its computational intensity. The Density Method uses the density of each element as the design variable (ref. 3). Thus, the method can be impractical for everyday design. Furthermore, the manufacturability of the optimal design is not guaranteed. The design engineer must transfer the optimal design solution to a practical solution. In addition, difficulties arise when imposing constraints on buckling (ref. 4). The problem arises from numerical difficulties in the presence of low material density. To overcome this difficulty, a two step optimization was proposed using topology optimization to minimize compliance while placing a constraint on mass (ref. 4). In the second step, a size optimization was performed on the resulting topology.
Stiffened plate or shell structures are widely used in the aerospace, automobile and ship industries. Optimization of isogrid-stiffened panels and shells has been performed for many years. A software tool (PANDA2) was developed to obtain minimum weight designs for metallic or composite panels with isogrid stiffeners subjected to buckling constraints (ref. 5). Optimization of the size and placement of isogrids of straight stiffeners for buckling load and natural frequency have been studied (ref. 6). Because the geometry is mostly defined a priori, the number of design variables is small relative to topology optimization. Traditional aircraft structures have straight stiffening members like spars, ribs,

2
stringers, longerons and stiffeners of uniform thicknesses which are riveted to fuselage/wing panels using to traditional manufacturing process. However, recent new metallic manufacturing processes such as friction stir welding (FSW) (ref. 7) and electron beam freeform fabrication (EBF3) (ref. 8) allow the design engineer to consider a more broad design space. Moreover, the topology optimization method often results in curved geometries (e.g., the fillet problem in ref. 1). Therefore, considering a design space in which stiffeners can take a curvilinear profile rather than linear may result in a reduction in mass for the same structural design requirements.
The benefits of unitized structures can be summarized as (a) reduced part count, manufacturing cycle time, and fabrication cost; (b) added design flexibility, weight savings, inspectability, and resistance to fatigue and corrosion; (c) enhanced automation, improved ergonomics and reduced work; and (d) increased determinant assembly opportunities, improved fit and reduced rework (ref. 9). Experts also pointed out that the use of unitized structure is expected to grow exponentially by the year 2020 (ref. 10). An integrally stiffened fuselage concept was developed in which analyses and experimental tests demonstrated equal or better performance than conventional designs with regard to weight and structural integrity, while achieving a significant reduction in manufacturing cost (ref. 11).
A new analysis tool, EBF3PanelOpt (ref. 12-15), is being developed for design and optimization of complex multifunctional aircraft structural concepts with application toward pressurized non-circular fuselage structures within hybrid wing/body vehicles where complex structural load cases are not well characterized using current design databases. EBF3PanelOpt is a tool for optimization of stiffened plate and shell structures in which stiffeners are not limited by traditional manufacturing techniques. Utilizing curved stiffeners broadens the design space without substantially adding to the computational cost of the optimization. While the tool is much more computationally efficient than topology optimization techniques in that there are very few design variables, the design space is much larger than traditional techniques that rely on linear stiffener grids. EBF3PanelOpt is being developed to exploit emerging additive manufacturing processes that offer the ability to efficiently fabricate complex structural configurations. The ultimate goal is to enhance aircraft performance and environmental responsibility through reductions in weight, emissions, and cabin noise, and to integrate functions such as acoustic damping, adaptive active aerodynamic controls, and aeroelastically tailored structures.
The tool development is being conducted under a NASA Research Announcement (NRA) contract at Virginia Polytechnic Institute and State University with support and aircraft manufacturing expertise provided through a subcontract with Lockheed Martin Aeronautics Company. The work is complementary to electron beam freeform fabrication (EBF3) additive manufacturing research activities at NASA Langley Research Center (LaRC).
This paper describes the initial phases of development of the EBF3PanelOpt tool. The tool was used to design and optimize a baseline structural panel with curved stiffeners. In the case of this baseline panel, the optimization was based on minimum mass subjected to constraints on buckling load, yielding, and crippling or local stiffener failure under a combination of compression and shear loads to evaluate the capability of the tool to handle complex loading conditions. The optimized panel design was used to fabricate an integrally-machined test panel using aluminum alloy 7075-T851. The panel was tested in the NASA LaRC Combined Loads Test Fixture (CLTF) (ref. 16) under a combined compression-shear loading case. The test results were compared against a linear finite element analysis (FEA) of the test fixture/panel assembly through which EBF3PanelOpt obtains the optimization constraints and a conventional high fidelity nonlinear FEA. The test results and analyses were used to assess the strengths
3
and weaknesses of the EBF3PanelOpt tool for the next iteration of its development as a tool for structural panel design and optimization.
2 EBF3PanelOpt Framework A framework has been developed by researchers at Virginia Polytechnic Institute and State
University (Virginia Tech) for design optimization of curvilinear stiffened panels under in-plane and transverse loading (ref.12-15). The framework named EBF3PanelOpt is an object-oriented script written in PYTHON that interfaces with MSC.Patran, and MSC.Nastran to perform finite element analysis on a panel with curvilinear, blade-type stiffeners and returns the mass of the panel and constraints on yielding, buckling, and crippling or local failure of the panel.
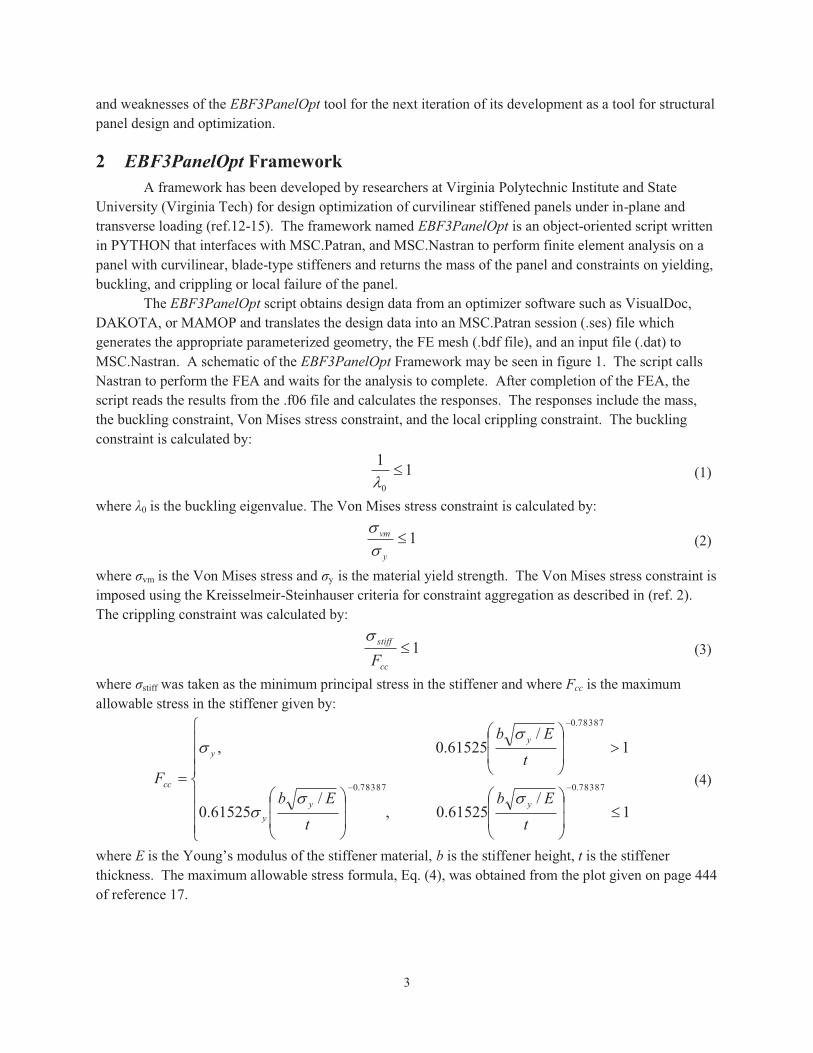
The EBF3PanelOpt script obtains design data from an optimizer software such as VisualDoc, DAKOTA, or MAMOP and translates the design data into an MSC.Patran session (.ses) file which generates the appropriate parameterized geometry, the FE mesh (.bdf file), and an input file (.dat) to MSC.Nastran. A schematic of the EBF3PanelOpt Framework may be seen in figure 1. The script calls Nastran to perform the FEA and waits for the analysis to complete. After completion of the FEA, the script reads the results from the .f06 file and calculates the responses. The responses include the mass, the buckling constraint, Von Mises stress constraint, and the local crippling constraint. The buckling constraint is calculated by:
11
0
��
(1)
where λ0 is the buckling eigenvalue. The Von Mises stress constraint is calculated by:
1�y
vm
��
(2)
where σvm is the Von Mises stress and σy is the material yield strength. The Von Mises stress constraint is imposed using the Kreisselmeir-Steinhauser criteria for constraint aggregation as described in (ref. 2). The crippling constraint was calculated by:
1�cc
stiff
F�
(3)
where σstiff was taken as the minimum principal stress in the stiffener and where Fcc is the maximum allowable stress in the stiffener given by:
���
�
���
�
�
�
�
��
�
�
��
�
�
�
��
�
���
�
1 /
61525.0 ,/
61525.0
1 /
61525.0 ,
78387.078387.0
78387.0
tEb
tEb
tEb
Fyy
y
yy
cc
���
��
(4)
where E is the Young’s modulus of the stiffener material, b is the stiffener height, t is the stiffener thickness. The maximum allowable stress formula, Eq. (4), was obtained from the plot given on page 444 of reference 17.
4
Figure 1. Schematic of EBF3PanelOpt Framework.
2.1 Parametric Modeling of the Panel A key ingredient to EBF3PanelOpt is the ability to specify the geometry in a parametric fashion
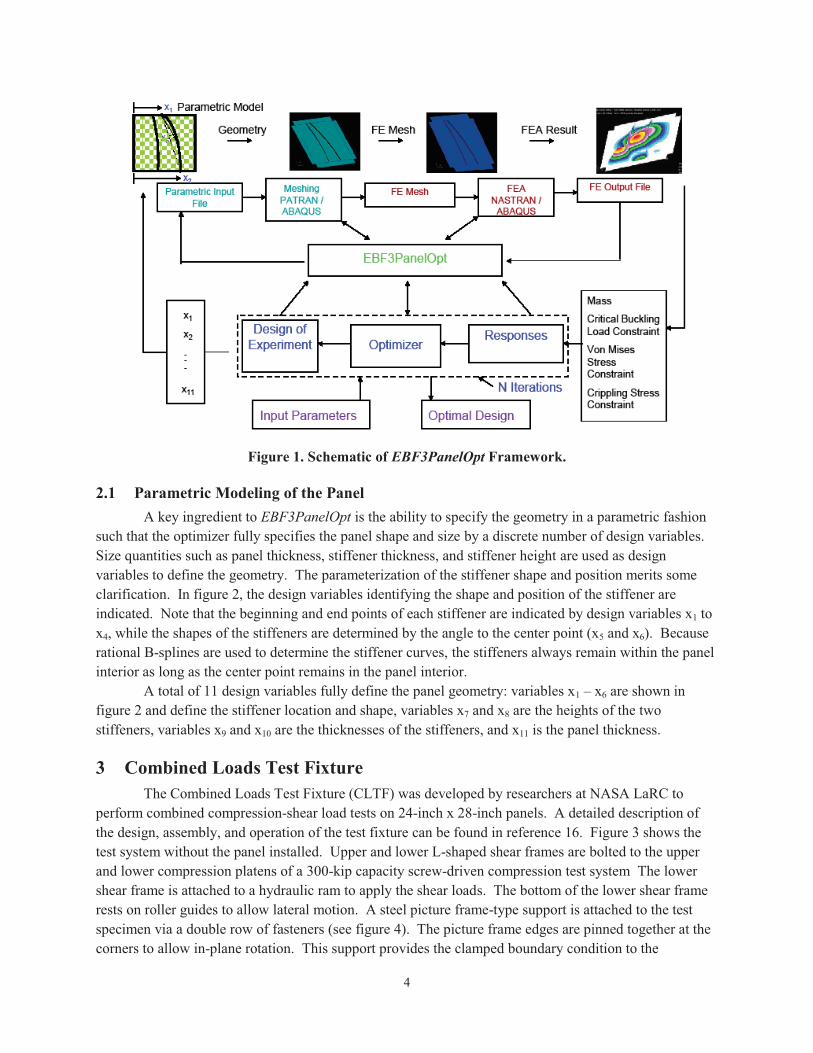
such that the optimizer fully specifies the panel shape and size by a discrete number of design variables. Size quantities such as panel thickness, stiffener thickness, and stiffener height are used as design variables to define the geometry. The parameterization of the stiffener shape and position merits some clarification. In figure 2, the design variables identifying the shape and position of the stiffener are indicated. Note that the beginning and end points of each stiffener are indicated by design variables x1 to x4, while the shapes of the stiffeners are determined by the angle to the center point (x5 and x6). Because rational B-splines are used to determine the stiffener curves, the stiffeners always remain within the panel interior as long as the center point remains in the panel interior.
A total of 11 design variables fully define the panel geometry: variables x1 – x6 are shown in figure 2 and define the stiffener location and shape, variables x7 and x8 are the heights of the two stiffeners, variables x9 and x10 are the thicknesses of the stiffeners, and x11 is the panel thickness.
3 Combined Loads Test Fixture The Combined Loads Test Fixture (CLTF) was developed by researchers at NASA LaRC to
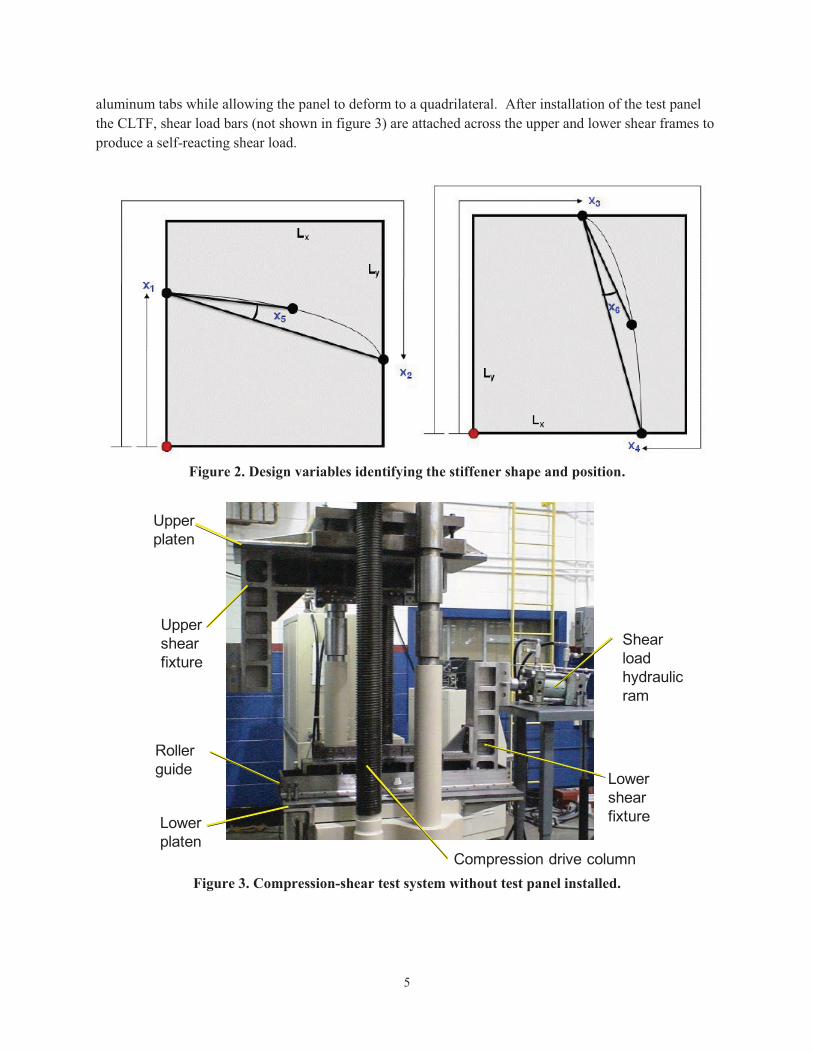
perform combined compression-shear load tests on 24-inch x 28-inch panels. A detailed description of the design, assembly, and operation of the test fixture can be found in reference 16. Figure 3 shows the test system without the panel installed. Upper and lower L-shaped shear frames are bolted to the upper and lower compression platens of a 300-kip capacity screw-driven compression test system The lower shear frame is attached to a hydraulic ram to apply the shear loads. The bottom of the lower shear frame rests on roller guides to allow lateral motion. A steel picture frame-type support is attached to the test specimen via a double row of fasteners (see figure 4). The picture frame edges are pinned together at the corners to allow in-plane rotation. This support provides the clamped boundary condition to the
5
aluminum tabs while allowing the panel to deform to a quadrilateral. After installation of the test panel the CLTF, shear load bars (not shown in figure 3) are attached across the upper and lower shear frames to produce a self-reacting shear load.
Figure 2. Design variables identifying the stiffener shape and position.
Upper shear fixture
Compression drive column
Lower shear fixture
Upper platen
Lower platen
Roller guide
Shear load hydraulic ram
Figure 3. Compression-shear test system without test panel installed.

6
Figure 4. Picture frame support mounted on a generic test panel.
4 Panel Design and Optimization A 24-inch x 28-inch curvilinear stiffened panel was designed using the EBF3PanelOpt software
and VisualDoc Optimization software. The particle swarm optimization (PSO) was used to estimate the global minimum mass while satisfying constraints on buckling, crippling, and yielding. The VisualDoc optimization parameters for the PSO algorithm used for the analysis are provided in table 1. For the details regarding the definition of the parameters, please see (ref. 18).
Table 1. VisualDoc Optimization parameters for PSO optimization (ref. 18).
Inertia weight parameter 1.40 Local optimum trust parameter, C1 1.50 Global optimum trust parameter, C2 2.50 Number of particles 20 Maximum number of iterations 70 Minimum number of iterations 5 Absolute objective convergence 10-6
Relative objective convergence 10-3 Absolute design variable convergence 10-6 Relative design variable convergence 10-3
To assess the ability of the tool to design panels for complex loading conditions, a combined
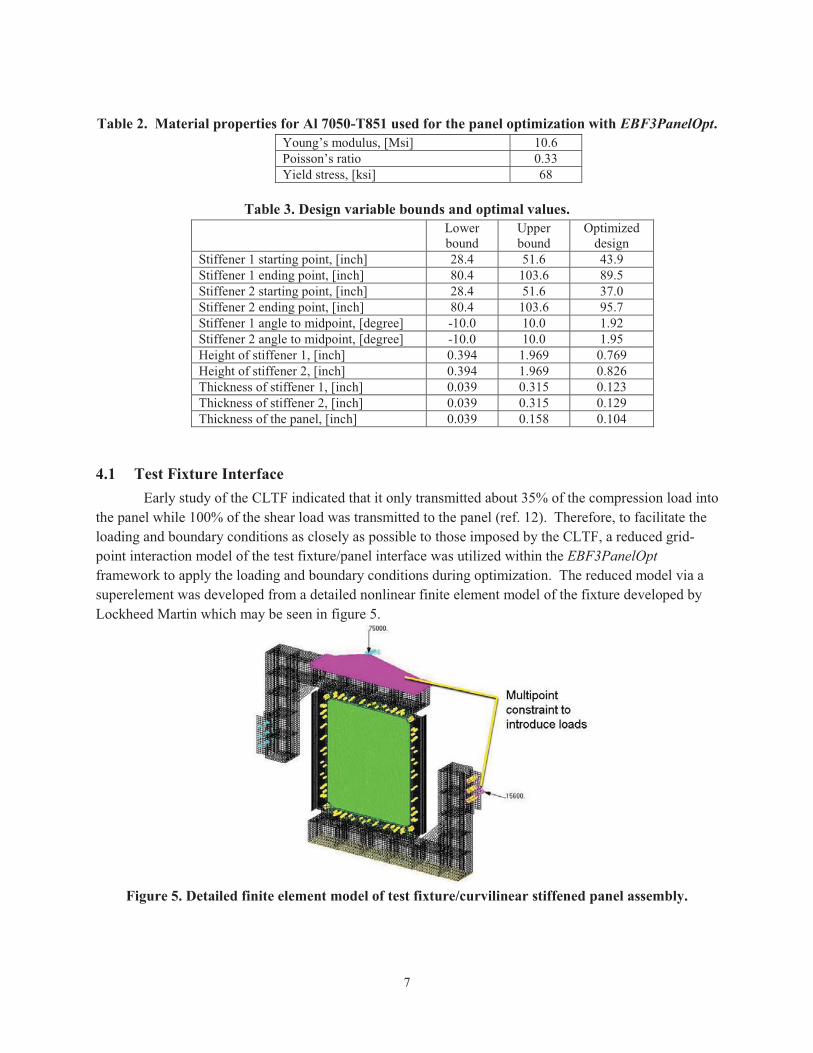
compression-shear loading condition was selected. The overall panel size was selected based on the capability of the CLTF test system. The panel was designed for a limit load of 42 kips in compression and 9.7 kips in shear (4.35 lb compression per 1 lb shear) against buckling, crippling, and yielding. The material properties of the aluminum alloy used in the panel optimization are shown in table 2. Table 3 lists the optimal design variables along with the lower and upper bounds placed on each variable during the optimization.
7
Table 2. Material properties for Al 7050-T851 used for the panel optimization with EBF3PanelOpt.
Young’s modulus, [Msi] 10.6 Poisson’s ratio 0.33 Yield stress, [ksi] 68
Table 3. Design variable bounds and optimal values.
Lower bound
Upper bound
Optimized design
Stiffener 1 starting point, [inch] 28.4 51.6 43.9 Stiffener 1 ending point, [inch] 80.4 103.6 89.5 Stiffener 2 starting point, [inch] 28.4 51.6 37.0 Stiffener 2 ending point, [inch] 80.4 103.6 95.7 Stiffener 1 angle to midpoint, [degree] -10.0 10.0 1.92 Stiffener 2 angle to midpoint, [degree] -10.0 10.0 1.95 Height of stiffener 1, [inch] 0.394 1.969 0.769 Height of stiffener 2, [inch] 0.394 1.969 0.826 Thickness of stiffener 1, [inch] 0.039 0.315 0.123 Thickness of stiffener 2, [inch] 0.039 0.315 0.129 Thickness of the panel, [inch] 0.039 0.158 0.104
4.1 Test Fixture Interface Early study of the CLTF indicated that it only transmitted about 35% of the compression load into
the panel while 100% of the shear load was transmitted to the panel (ref. 12). Therefore, to facilitate the loading and boundary conditions as closely as possible to those imposed by the CLTF, a reduced grid-point interaction model of the test fixture/panel interface was utilized within the EBF3PanelOpt framework to apply the loading and boundary conditions during optimization. The reduced model via a superelement was developed from a detailed nonlinear finite element model of the fixture developed by Lockheed Martin which may be seen in figure 5.
Figure 5. Detailed finite element model of test fixture/curvilinear stiffened panel assembly.
8
4.2 Nonlinear finite element model A nonlinear finite element model (FEM) of the CLTF was developed by Lockheed Martin
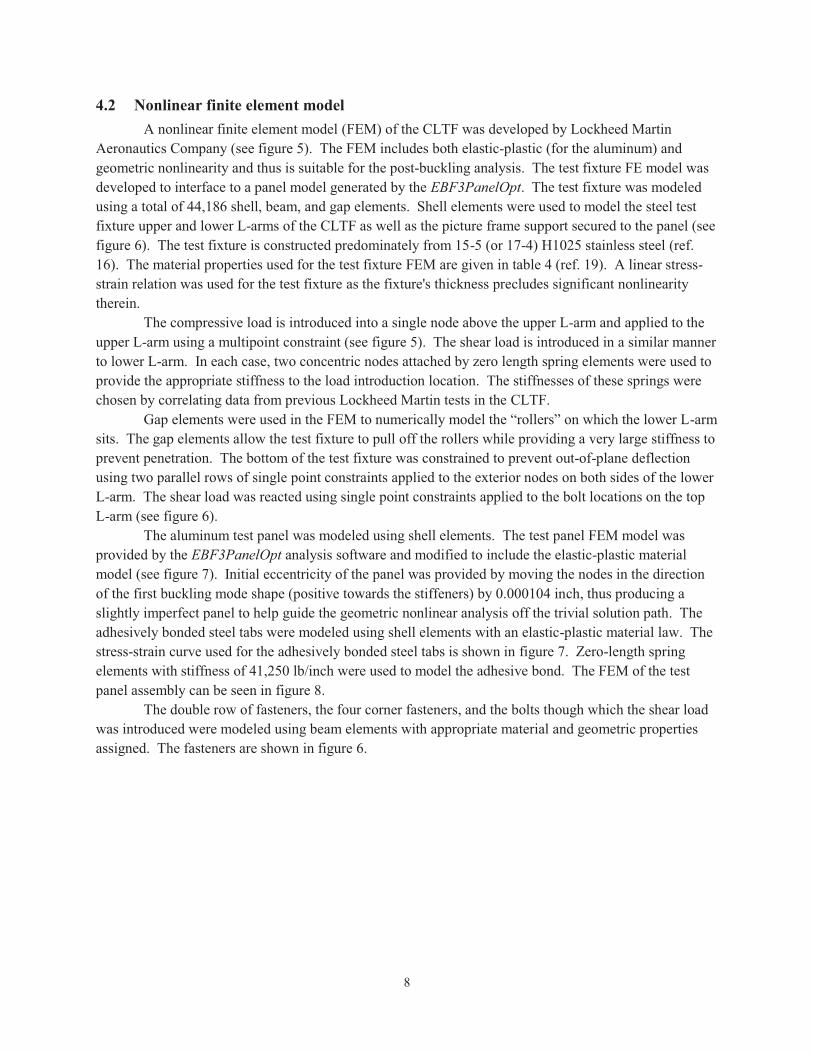
Aeronautics Company (see figure 5). The FEM includes both elastic-plastic (for the aluminum) and geometric nonlinearity and thus is suitable for the post-buckling analysis. The test fixture FE model was developed to interface to a panel model generated by the EBF3PanelOpt. The test fixture was modeled using a total of 44,186 shell, beam, and gap elements. Shell elements were used to model the steel test fixture upper and lower L-arms of the CLTF as well as the picture frame support secured to the panel (see figure 6). The test fixture is constructed predominately from 15-5 (or 17-4) H1025 stainless steel (ref. 16). The material properties used for the test fixture FEM are given in table 4 (ref. 19). A linear stress-strain relation was used for the test fixture as the fixture's thickness precludes significant nonlinearity therein.
The compressive load is introduced into a single node above the upper L-arm and applied to the upper L-arm using a multipoint constraint (see figure 5). The shear load is introduced in a similar manner to lower L-arm. In each case, two concentric nodes attached by zero length spring elements were used to provide the appropriate stiffness to the load introduction location. The stiffnesses of these springs were chosen by correlating data from previous Lockheed Martin tests in the CLTF.
Gap elements were used in the FEM to numerically model the “rollers” on which the lower L-arm sits. The gap elements allow the test fixture to pull off the rollers while providing a very large stiffness to prevent penetration. The bottom of the test fixture was constrained to prevent out-of-plane deflection using two parallel rows of single point constraints applied to the exterior nodes on both sides of the lower L-arm. The shear load was reacted using single point constraints applied to the bolt locations on the top L-arm (see figure 6).
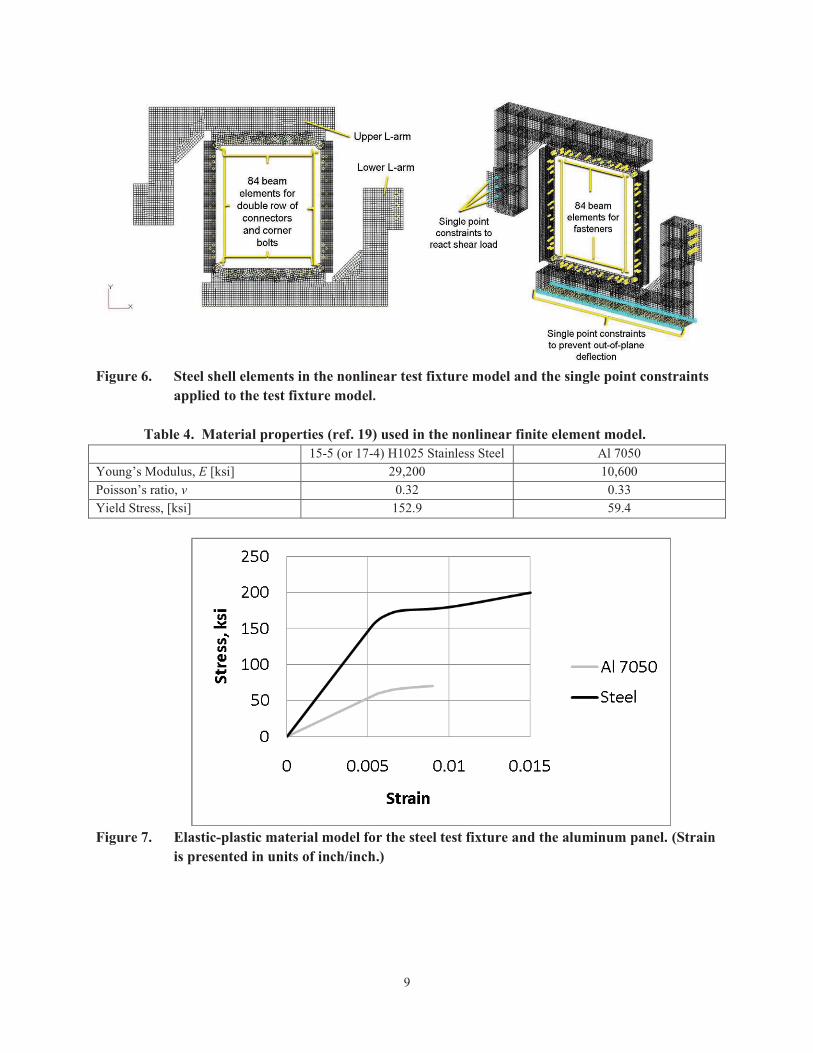
The aluminum test panel was modeled using shell elements. The test panel FEM model was provided by the EBF3PanelOpt analysis software and modified to include the elastic-plastic material model (see figure 7). Initial eccentricity of the panel was provided by moving the nodes in the direction of the first buckling mode shape (positive towards the stiffeners) by 0.000104 inch, thus producing a slightly imperfect panel to help guide the geometric nonlinear analysis off the trivial solution path. The adhesively bonded steel tabs were modeled using shell elements with an elastic-plastic material law. The stress-strain curve used for the adhesively bonded steel tabs is shown in figure 7. Zero-length spring elements with stiffness of 41,250 lb/inch were used to model the adhesive bond. The FEM of the test panel assembly can be seen in figure 8.
The double row of fasteners, the four corner fasteners, and the bolts though which the shear load was introduced were modeled using beam elements with appropriate material and geometric properties assigned. The fasteners are shown in figure 6.
9
Figure 6. Steel shell elements in the nonlinear test fixture model and the single point constraints
applied to the test fixture model. Table 4. Material properties (ref. 19) used in the nonlinear finite element model.
15-5 (or 17-4) H1025 Stainless Steel Al 7050 Young’s Modulus, E [ksi] 29,200 10,600 Poisson’s ratio, ν 0.32 0.33 Yield Stress, [ksi] 152.9 59.4
Figure 7. Elastic-plastic material model for the steel test fixture and the aluminum panel. (Strain
is presented in units of inch/inch.)
10
Figure 8. Model of Al 7050 panel with bonded steel tabs modeled using linear spring elements.
Initial numerical experiments with the nonlinear test fixture model indicated that the FEM of the
test fixture interface used by EBF3PanelOpt incorrectly predicted the buckling load by a substantial amount. The correlated test fixture model was used to extract a grid point interaction model superelement which would better facilitate the load introduction to the panel in EBF3PanelOpt. Furthermore, the adhesively bonded steel tabs were modeled in the version of EBF3PanelOpt used to design the panel using concentric elements sharing nodes. While the test fixture had geometric spaces between the tabs along the vertical edges, the model in EBF3PanelOpt had no spaces. Therefore, the steel tabs carried much of the load and resulted in a substantially higher predicted buckling load. When the modeling discrepancy was noticed, the panel model/test fixture interface in EBF3PanelOpt was modified to completely remove the steel tabs. The design limit loads of 42 kips compression and 9.7 kips in shear (4.35 lb compression per 1 lb shear) were modified, noticing that the new model predicted the onset of buckling at a load of 25 kips in compression and 5.2 kips in shear (4.8 lb compression per 1 lb shear). The test plan was modified to load at the corrected load ratio of 4.8 lb compression per 1 lb shear.
5 Panel Manufacturing Prior to manufacturing the baseline optimized panel, a smaller scale risk-reduction panel was
constructed which featured variable height curvilinear T-stiffeners (see figure 9). This panel was produced to validate the manufacturing process for integrally machined, thin-skinned, stiffened panels. The size of this panel was approximately 16-inch by 16-inch with 1.5-inch tall stiffeners at their peak height. Several manufacturability design features were reexamined after coordinating with the machine shop and receiving quotes including fillet radii and manufacturability stiffness to height ratio. The alloy chosen for the initial manufacturability and test panel was Al 7050 heat treated to a T-7451 condition. The material was received as 2-inch thick plate stock and high speed machined to the specified geometry. The completed panel was inspected to insure that the required tolerances were satisfied and that the panel remained flat on the non-stiffened side. All tolerances were met.

11
Figure 9. Illustration of risk reduction coupon manufactured by Lockheed Martin to verify the
integral machining process. Once the risk reduction panel was completed, the solid model of the baseline curvilinear stiffened
panel was converted to a detailed CAD file in CATIA V5 by Lockheed Martin. The geometry was modified to include fillets at the panel/stiffener intersections. The 24-inch x 28-inch panel was extended to include 2.94 inch x 24 inch tabs along the top and bottom edges with the bolt pattern specified by the CLTF (see figure 10). 2.25 inch x 28 inch tabs were also included along the left and right edge of the panel. While the panel had thickness of 0.104 inch, the tabs were required to be 0.25 inch to facilitate the interface between the CLTF and panel. A thickness taper was included to reduce the thickness from 0.25 inch to 0.104 inch. The geometry was also modified to include stiffener run-outs at the ends.
The baseline optimized test article was then machined. The test panel used blade stiffeners as opposed to the T-stiffeners used in the risk reduction panel. This panel was also machined from 2-inch thick plate stock and all required tolerances were met.
After the panel was machined and inspected, 4340 steel tabs conforming to the NASA combined loading fixture drawings (ref. 16) were adhesively bonded using Hysol EA9394 with 0.005-inch diameter glass micro-balloons added for bond-line thickness control. These bonds were cured at room temperature to prevent any residual thermal expansion stresses at the bond-line. The panel was then crated and shipped to NASA LaRC for testing. The completed panel is shown in figure 10.

12
Figure 10. Picture of the Al 7050 test panel with bonded steel tabs.
6 Combined Load Compression-Shear Test A combined load compression-shear test was conducted at NASA LaRC on the panel using the
CLTF. Linear variable displacement transducers (LVDTs) were attached to three corners of the top compression platen to measure panel end shortening and one LVDT was attached to the shear fixture to measure shear displacement.
A total of 32 strain gages were attached to the panel. Six of the gages were 0°/45°/90° rosettes and 26 of the gages were uniaxial gages aligned parallel to the compression load direction. A description of the strain gage locations is provided in appendix A. The stiffened side of the panel was spray-painted with a speckled pattern to facilitate strain and displacement measurements using a VIC-3D automated stereophotogrammetic technique. The panel was installed into the CLTF. The lateral shear load hydraulic ram was attached to the CLTF's lower shear frame. The LVDT support brackets and 5 LVDTs

13
were installed into the test system and attached to the smooth side of the panel to measure out-of-plane displacement. A description of these LVDT locations is provided in appendix B.
The data acquisition system was configured to scan and record all of the instrumentation at a rate of 1 scan per second. The load, displacements, and select strain gages were monitored on a real-time display during the test. The VIC-3D system was configured to obtain full-field stereophotogrammetic displacement/strain measurements on the lower half of stiffened side of panel. In addition to the VIC-3D cameras, a video camera was set up to record panel behavior during the test.
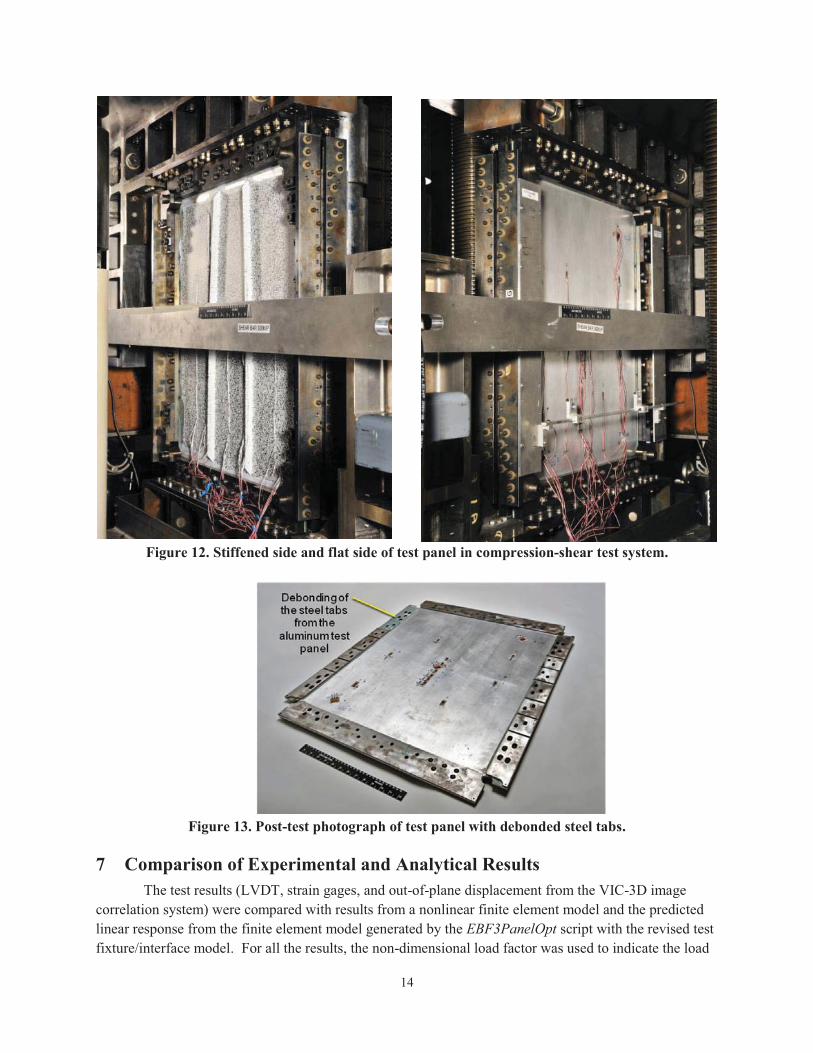
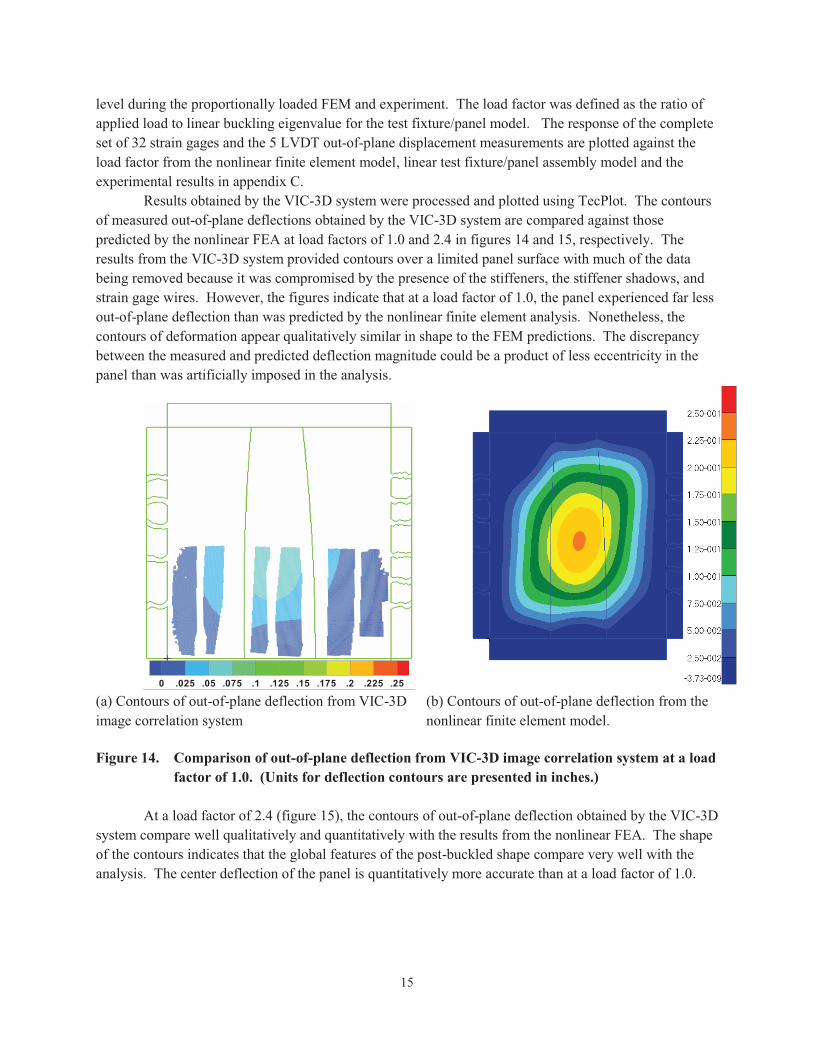
Figure 11 shows the test system with the panel installed and ready for testing. Figure 12 shows the stiffened side and flat side of the panel in the test system. The test system was configured to apply compression load and shear load simultaneously at a compression-shear load ratio of 4.8. The compression load rate of 4,000 lbs/min was used. Two preliminary tests were conducted up to a maximum compression load of 5,000 lbs to insure that all of the instrumentation was operational and that the compression-shear load ratio was correct. The data acquisition and VIC-3D systems were started and compression/shear load application was initiated. The panel was loaded to approximately 60,000 lbs in compression at which point there was a sharp reduction in load and a loud noise. It was assumed that this was a panel structural failure event. The test was stopped and the load was removed from the panel. Following the load removal, it was discovered that the panel had not been permanently deformed and that the load drop-off and noise events were associated with several of the steel tabs debonding from the panel (see figure 13).
Self-reactingshear load bar
Shear load hydraulic ram
Testpanel
CombinedLoadtestfixture
Figure 11. Compression-shear test system with test panel installed.
14
Figure 12. Stiffened side and flat side of test panel in compression-shear test system.
Figure 13. Post-test photograph of test panel with debonded steel tabs.
7 Comparison of Experimental and Analytical Results The test results (LVDT, strain gages, and out-of-plane displacement from the VIC-3D image
correlation system) were compared with results from a nonlinear finite element model and the predicted linear response from the finite element model generated by the EBF3PanelOpt script with the revised test fixture/interface model. For all the results, the non-dimensional load factor was used to indicate the load
15
level during the proportionally loaded FEM and experiment. The load factor was defined as the ratio of applied load to linear buckling eigenvalue for the test fixture/panel model. The response of the complete set of 32 strain gages and the 5 LVDT out-of-plane displacement measurements are plotted against the load factor from the nonlinear finite element model, linear test fixture/panel assembly model and the experimental results in appendix C.
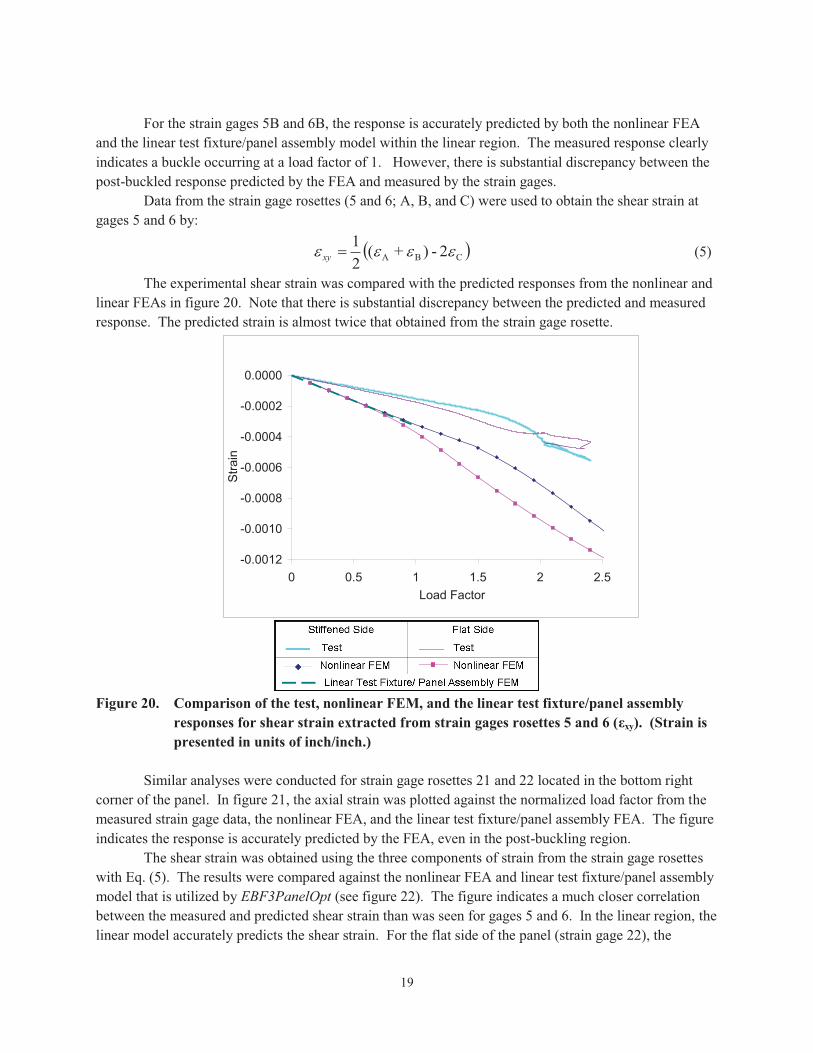
Results obtained by the VIC-3D system were processed and plotted using TecPlot. The contours of measured out-of-plane deflections obtained by the VIC-3D system are compared against those predicted by the nonlinear FEA at load factors of 1.0 and 2.4 in figures 14 and 15, respectively. The results from the VIC-3D system provided contours over a limited panel surface with much of the data being removed because it was compromised by the presence of the stiffeners, the stiffener shadows, and strain gage wires. However, the figures indicate that at a load factor of 1.0, the panel experienced far less out-of-plane deflection than was predicted by the nonlinear finite element analysis. Nonetheless, the contours of deformation appear qualitatively similar in shape to the FEM predictions. The discrepancy between the measured and predicted deflection magnitude could be a product of less eccentricity in the panel than was artificially imposed in the analysis.
(a) Contours of out-of-plane deflection from VIC-3D image correlation system
(b) Contours of out-of-plane deflection from the nonlinear finite element model.
Figure 14. Comparison of out-of-plane deflection from VIC-3D image correlation system at a load
factor of 1.0. (Units for deflection contours are presented in inches.)
At a load factor of 2.4 (figure 15), the contours of out-of-plane deflection obtained by the VIC-3D system compare well qualitatively and quantitatively with the results from the nonlinear FEA. The shape of the contours indicates that the global features of the post-buckled shape compare very well with the analysis. The center deflection of the panel is quantitatively more accurate than at a load factor of 1.0.
0 .025 .05 .075 .1 .125 .15 .175 .2 .225 .25

16
0 0.05 0.1 0.15 0.2 0.25 0.3 0.35 0.4 0.45 0.5
(a) Contours of out-of-plane deflection from VIC-3D image correlation system
(b) Contours of out-of-plane deflection from the nonlinear finite element model.
Figure 15. Comparison of out-of-plane deflection from VIC-3D image correlation system at a load factor of 2.4. (Units for deflection contours are presented in inches.)
The measured out-of-plane deflection was plotted against the normalized load factor in figure 16
for LVDT 7 and in figure 17 for LVDT 9. The LVDT locations are summarized in appendix B. The results from the nonlinear finite element analysis and the results from the linear test fixture/panel assembly model are included for comparison. Note that the test results clearly indicate the panel initially buckled at a load factor near 1, indicated by a dramatic increase in deflection over a small range of load factor. In general, the deflection predicted by FEA is higher than the measured deflection. The deflection predicted by the linear test fixture/panel assembly model compares fairly well within the linear region.
Results from the remaining three LVDTs are compared against the nonlinear finite element analysis results and the linear test fixture/panel assembly model results in appendix C. The trends are comparable to those presented in figures 16 and 17.
The results from each of the 32 strain gages were plotted against the load factor in appendix C. The results from 0° strain gages 5A and 6A are compared in figure 18 and from 90° strain gages 5B and 6B are compared in figure 19. Note that gages 5 and 6 are located just below the center of the panel on the stiffened and flat side of the panel, respectively (see table A1 and figure A1 in appendix A). Within the linear region, the predicted strain compares very well with that measured by the gages for the 0° gages. The response predicted by the linear test fixture/panel assembly model is indistinguishable from the measured strain; however, the post-buckled response of the nonlinear analysis is substantially different from the measured response. The strain on the flat side (gage 6A) of the panel compares very well; however, the finite element analysis predicts substantially greater bending than seen by the experiment.

17
0
0.05
0.1
0.15
0.2
0.25
0.3
0.35
0.0 0.5 1.0 1.5 2.0 2.5Load Factor
Dis
plac
emen
t (in
)
Figure 16. Comparison of the test, nonlinear FEM, and the linear test fixture/panel assembly
model responses for LVDT 7 (positive deflection is measured towards the stiffeners).
0
0.1
0.2
0.3
0.4
0.5
0.6
0.7
0.0 0.5 1.0 1.5 2.0 2.5Load Factor
Dis
plac
emen
t (in
)
Figure 17. Comparison of the test, nonlinear FEM, and the linear test fixture/panel assembly
model responses for LVDT 9 (positive deflection is measured towards the stiffeners).

18
-0.0024
-0.0020
-0.0016
-0.0012
-0.0008
-0.0004
0.0000
0.0 0.5 1.0 1.5 2.0 2.5Load Factor
Stra
in
Figure 18. Comparison of the test, nonlinear FEM, and the linear test fixture/panel assembly
responses for axial strain gages 5A and 6A (εyy). (Strain is presented in units of inch/inch.)
0.0000
0.0004
0.0008
0.0012
0.0016
0.0 0.5 1.0 1.5 2.0 2.5Load Factor
Stra
in
Figure 19. Comparison of the test, nonlinear FEM, and the linear test fixture/panel assembly
responses for strain gages 5B and 6B oriented perpendicular to the direction of the dominate compressive loading (εxx). (Strain is presented in units of inch/inch.)
19
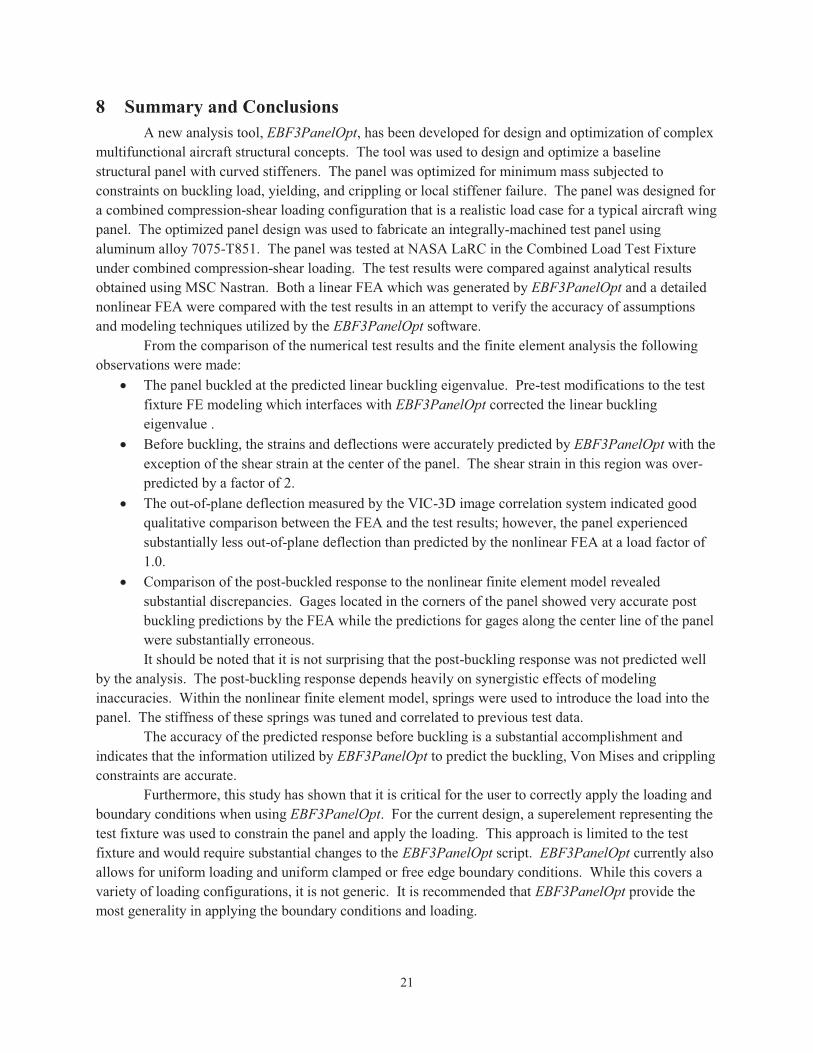
For the strain gages 5B and 6B, the response is accurately predicted by both the nonlinear FEA
and the linear test fixture/panel assembly model within the linear region. The measured response clearly indicates a buckle occurring at a load factor of 1. However, there is substantial discrepancy between the post-buckled response predicted by the FEA and measured by the strain gages.
Data from the strain gage rosettes (5 and 6; A, B, and C) were used to obtain the shear strain at gages 5 and 6 by:
� �CBA 2-)+(21 ���� �xy (5)
The experimental shear strain was compared with the predicted responses from the nonlinear and linear FEAs in figure 20. Note that there is substantial discrepancy between the predicted and measured response. The predicted strain is almost twice that obtained from the strain gage rosette.
-0.0012
-0.0010
-0.0008
-0.0006
-0.0004
-0.0002
0.0000
0 0.5 1 1.5 2 2.5Load Factor
Stra
in
Figure 20. Comparison of the test, nonlinear FEM, and the linear test fixture/panel assembly
responses for shear strain extracted from strain gages rosettes 5 and 6 (εxy). (Strain is presented in units of inch/inch.)
Similar analyses were conducted for strain gage rosettes 21 and 22 located in the bottom right
corner of the panel. In figure 21, the axial strain was plotted against the normalized load factor from the measured strain gage data, the nonlinear FEA, and the linear test fixture/panel assembly FEA. The figure indicates the response is accurately predicted by the FEA, even in the post-buckling region.
The shear strain was obtained using the three components of strain from the strain gage rosettes with Eq. (5). The results were compared against the nonlinear FEA and linear test fixture/panel assembly model that is utilized by EBF3PanelOpt (see figure 22). The figure indicates a much closer correlation between the measured and predicted shear strain than was seen for gages 5 and 6. In the linear region, the linear model accurately predicts the shear strain. For the flat side of the panel (strain gage 22), the

20
nonlinear FEA and the test response are nearly indistinguishable. However, for the stiffened side of the panel (strain gage 21), the measured response is substantially different from the predicted response in the post buckling region.
-0.007-0.006-0.005-0.004-0.003-0.002-0.0010.0000.0010.0020.003
0.0 0.5 1.0 1.5 2.0 2.5Load Factor
Stra
in
Figure 21. Comparison of the test, nonlinear FEM, and the linear test fixture/panel assembly
responses for axial strain gages 21A and 22A (εyy). (Strain is presented in units of in/in.)
-0.0030
-0.0025
-0.0020
-0.0015
-0.0010
-0.0005
0.0000
0.0005
0.0010
0 0.5 1 1.5 2 2.5Load Factor
Stra
in
Figure 22. Comparison of the test, nonlinear FEM, and the linear test fixture/panel assembly
responses for shear strain extracted from strain gages rosettes 21 and 22 (εxy). (Strain is presented in units of in/in.)
21
8 Summary and Conclusions A new analysis tool, EBF3PanelOpt, has been developed for design and optimization of complex
multifunctional aircraft structural concepts. The tool was used to design and optimize a baseline structural panel with curved stiffeners. The panel was optimized for minimum mass subjected to constraints on buckling load, yielding, and crippling or local stiffener failure. The panel was designed for a combined compression-shear loading configuration that is a realistic load case for a typical aircraft wing panel. The optimized panel design was used to fabricate an integrally-machined test panel using aluminum alloy 7075-T851. The panel was tested at NASA LaRC in the Combined Load Test Fixture under combined compression-shear loading. The test results were compared against analytical results obtained using MSC Nastran. Both a linear FEA which was generated by EBF3PanelOpt and a detailed nonlinear FEA were compared with the test results in an attempt to verify the accuracy of assumptions and modeling techniques utilized by the EBF3PanelOpt software.
From the comparison of the numerical test results and the finite element analysis the following observations were made:
� The panel buckled at the predicted linear buckling eigenvalue. Pre-test modifications to the test fixture FE modeling which interfaces with EBF3PanelOpt corrected the linear buckling eigenvalue .
� Before buckling, the strains and deflections were accurately predicted by EBF3PanelOpt with the exception of the shear strain at the center of the panel. The shear strain in this region was over-predicted by a factor of 2.
� The out-of-plane deflection measured by the VIC-3D image correlation system indicated good qualitative comparison between the FEA and the test results; however, the panel experienced substantially less out-of-plane deflection than predicted by the nonlinear FEA at a load factor of 1.0.
� Comparison of the post-buckled response to the nonlinear finite element model revealed substantial discrepancies. Gages located in the corners of the panel showed very accurate post buckling predictions by the FEA while the predictions for gages along the center line of the panel were substantially erroneous. It should be noted that it is not surprising that the post-buckling response was not predicted well
by the analysis. The post-buckling response depends heavily on synergistic effects of modeling inaccuracies. Within the nonlinear finite element model, springs were used to introduce the load into the panel. The stiffness of these springs was tuned and correlated to previous test data.
The accuracy of the predicted response before buckling is a substantial accomplishment and indicates that the information utilized by EBF3PanelOpt to predict the buckling, Von Mises and crippling constraints are accurate.
Furthermore, this study has shown that it is critical for the user to correctly apply the loading and boundary conditions when using EBF3PanelOpt. For the current design, a superelement representing the test fixture was used to constrain the panel and apply the loading. This approach is limited to the test fixture and would require substantial changes to the EBF3PanelOpt script. EBF3PanelOpt currently also allows for uniform loading and uniform clamped or free edge boundary conditions. While this covers a variety of loading configurations, it is not generic. It is recommended that EBF3PanelOpt provide the most generality in applying the boundary conditions and loading.

22
9 References
1. Bendsoe, M. and Kikuchi, N., “Generating Optimal Topologies in Optimal Design using a Homogenization Method,” Computer Methods in Applied Mechanics and Engineering, 71, pp. 197–224, 1988.
2. Schramm, U. and Zhou, M., “Recent Developments in the Commercial Implementation of Topology Optimization,” IUTAM Symposium on Topological Design Optimization of Structures, Machines and Materials: Solid Mechanics and Its Applications, Vol. 137, Part 6, 2006, pp. 239-248, DOI 10.1007/1-4020-4752-5_24.
3. Bendsoe, M. and Sigmund, O., Topology Optimization: Theory, Methods, and Applications. Springer-Verlag, Berlin, 2003.
4. Schramm, U. and Zhou, M., Tang, P.S., and Harte, C., “Topology Layout of Structural Designs and Buckling,” 10th AIAA/ISSMO Multidisciplinary Analysis and Optimization Conference, Albany, New York, Aug. 30-1, 2004, AIAA-2004-4636.
5. D. Bushnell, “PANDA2 — Program for Minimum Weight Design of Stiffened, Composite, Locally Buckled Panels,” Computers and Structures Vol. 25, 1987, pp. 469–605.
6. W. Akl, A. El-Sabbagh, A. Baz, “Optimization of the Static and Dynamic Characteristics of Plates with Isogrid Stiffeners,” Finite Elements in Analysis and Design, Vol. 44, No. 8, May 2008, Pages 513-523, DOI: 10.1016/j.finel.2008.01.015.
7. Nicholas, E. D., “Developments in the Friction-Stir Welding of Metals,” ICAA-6: 6th International Conference on Aluminum Alloys, 1998.
8. Taminger, K. M. B., Hafley, R. A., and Dicus, D. L., “Solid Freeform Fabrication: An Enabling Technology for Future Space Missions,” Keynote Lecture for 2002 International Conference on Metal Powder Deposition for Rapid Manufacturing Metal Powder Industries Federation, San Antonio, TX, April 8-10, 2002, pp. 51-56.
9. Chan, K., Harter, J., Grandt, A. F., and Honeycutt, K., “Enhanced Crack Growth Methodology and Analyses for Unitized Structures,” Ninth Joint FAA/DoD/NASA Conference on Aging Aircraft, Atlanta, GA, 6–9 March 2006.
10. Renton, W. J., Olcott, D., Roeseler, W., Batzer, R., Baron, W., and Velicki, A., “Future of Flight Vehicle Structures (2000–2023),” Journal of Aircraft, Vol. 41, No. 5, 2004, pp. 986–997. doi:10.2514/1.4039.
11. Pettit, R. G., Wang, J. J., and Toh, C., “Validated Feasibility Study of Integrally Stiffened Metallic Fuselage Panels for Reducing Manufacturing Costs,” NASA CR-2000-209342, The Boeing Company, Long Beach, CA.
12. Gurav, S. P. and Kapania, R. K., “Development of Framework for the Design Optimization of Unitized Structures,” 50th AIAA/ASME/ASCE/AHS/ASC Structures, Structural Dynamics, and Materials Conference, Palm Springs, CA, May 4-7, 2009, AIAA2009-2186.
13. Joshi, P., Mulani, S. B., Kapania, R. K. and Shin, Y. S., "Optimal Design of Unitized Structures with Curvilinear Stiffeners Using Response Surface Methodology", AIAA-2008-2304, 49th

23
AIAA/ASME/ASCE/AHS/ASC Structures, Structural Dynamics, and Materials Conference and the 16th AIAA/ASME/AHS Adaptive Structures Conference, Schaumburg, IL, Apr. 7-10, 2008.
14. Joshi, P., Mulani, S. B., Gurav, S. P., and Kapania, R. K., "Design Optimization for Minimum Sound Radiation from Point-Excited Curvilinearly Stiffened Panel", 50th AIAA/ASME/ASCE/AHS/ASC Structures, Structural Dynamics, and Materials Conference and the 17th AIAA/ASME/AHS Adaptive Structures Conference, Palm Springs, California, May 4-7, 2009, AIAA-2009-2649.
15. Dang, T. D., Kapania, R. K. and Gurav, S. P., “Optimization of Unitized Structures under Damage Tolerance Constraints,” 50th AIAA/ASME/ASCE/AHS/ASC Structures, Structural Dynamics, and Materials Conference and the 17th AIAA/ASME/AHS Adaptive Structures Conference, Palm Springs, California, May 4-7, 2009, AIAA-2009-2550.
16. Baker, D.J., “Combined Load Test Fixture,” NASA Technical Memorandum TM-2010-216211, March 2010.
17. Niu, M.C.Y., ed. Airframe Stress Analysis and Sizing. 2nd. Hong Cong: Conmilit Press, 1997.
18. Venter, G. and Sobieszczanski-Sobieski, J. “Particle Swarm Optimization,” 43rd AIAA/ASME/ASCE/AHS/ASC Structures, Structural Dynamics, and Materials Conference, Denver, CO, April 22-25, 2002, AIAA2002-1235.
19. “Metallic Materials and Elements for Aerospace Vehicle Structures,” Department of Defense Handbook, MIL-HDBK-5J, January 31, 2003.
24
Appendix A
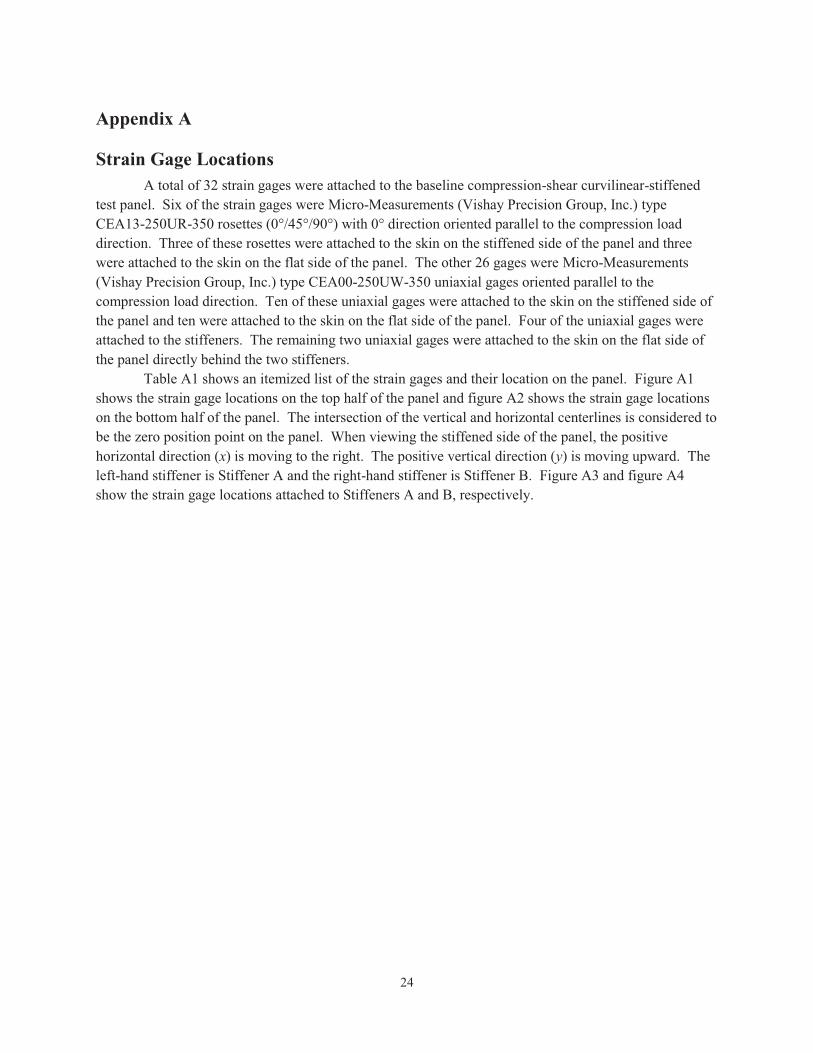
Strain Gage Locations A total of 32 strain gages were attached to the baseline compression-shear curvilinear-stiffened
test panel. Six of the strain gages were Micro-Measurements (Vishay Precision Group, Inc.) type CEA13-250UR-350 rosettes (0°/45°/90°) with 0° direction oriented parallel to the compression load direction. Three of these rosettes were attached to the skin on the stiffened side of the panel and three were attached to the skin on the flat side of the panel. The other 26 gages were Micro-Measurements (Vishay Precision Group, Inc.) type CEA00-250UW-350 uniaxial gages oriented parallel to the compression load direction. Ten of these uniaxial gages were attached to the skin on the stiffened side of the panel and ten were attached to the skin on the flat side of the panel. Four of the uniaxial gages were attached to the stiffeners. The remaining two uniaxial gages were attached to the skin on the flat side of the panel directly behind the two stiffeners.
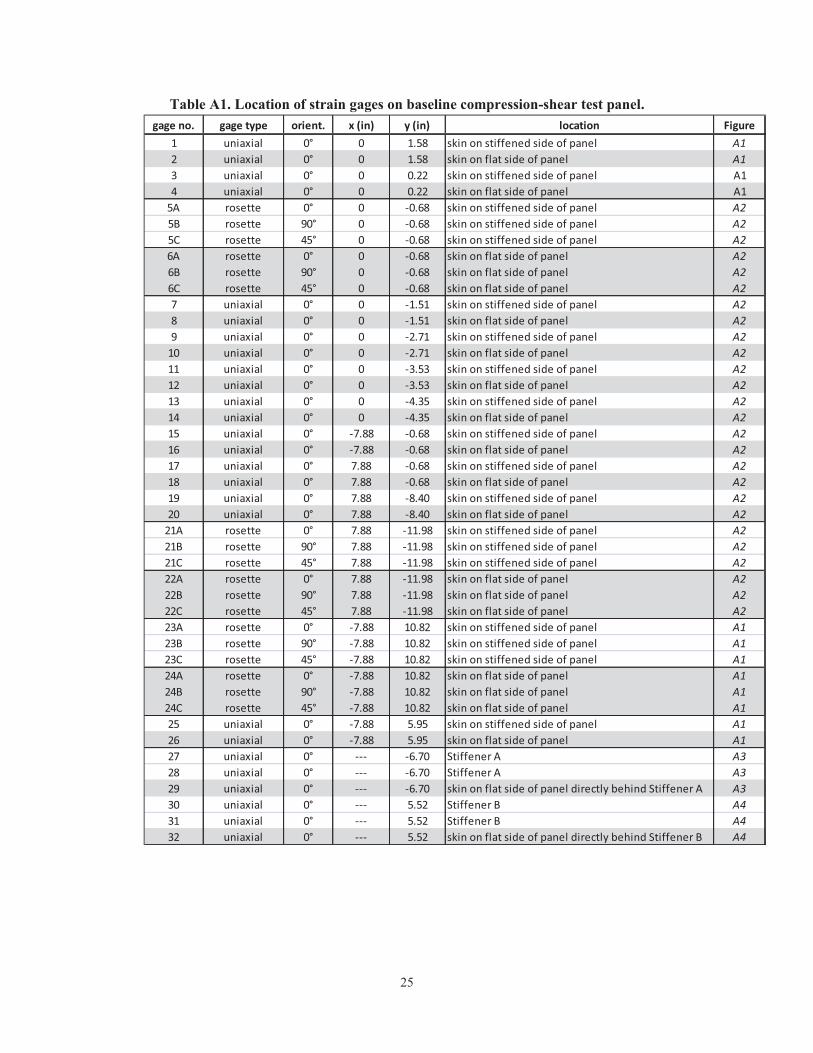
Table A1 shows an itemized list of the strain gages and their location on the panel. Figure A1 shows the strain gage locations on the top half of the panel and figure A2 shows the strain gage locations on the bottom half of the panel. The intersection of the vertical and horizontal centerlines is considered to be the zero position point on the panel. When viewing the stiffened side of the panel, the positive horizontal direction (x) is moving to the right. The positive vertical direction (y) is moving upward. The left-hand stiffener is Stiffener A and the right-hand stiffener is Stiffener B. Figure A3 and figure A4 show the strain gage locations attached to Stiffeners A and B, respectively.
25
Table A1. Location of strain gages on baseline compression-shear test panel. gage no. gage type orient. x (in) y (in) location Figure
1 uniaxial 0° 0 1.58 skin on stiffened side of panel A12 uniaxial 0° 0 1.58 skin on flat side of panel A13 uniaxial 0° 0 0.22 skin on stiffened side of panel A14 uniaxial 0° 0 0.22 skin on flat side of panel A1
5A rosette 0° 0 -0.68 skin on stiffened side of panel A25B rosette 90° 0 -0.68 skin on stiffened side of panel A25C rosette 45° 0 -0.68 skin on stiffened side of panel A26A rosette 0° 0 -0.68 skin on flat side of panel A26B rosette 90° 0 -0.68 skin on flat side of panel A26C rosette 45° 0 -0.68 skin on flat side of panel A27 uniaxial 0° 0 -1.51 skin on stiffened side of panel A28 uniaxial 0° 0 -1.51 skin on flat side of panel A29 uniaxial 0° 0 -2.71 skin on stiffened side of panel A2
10 uniaxial 0° 0 -2.71 skin on flat side of panel A211 uniaxial 0° 0 -3.53 skin on stiffened side of panel A212 uniaxial 0° 0 -3.53 skin on flat side of panel A213 uniaxial 0° 0 -4.35 skin on stiffened side of panel A214 uniaxial 0° 0 -4.35 skin on flat side of panel A215 uniaxial 0° -7.88 -0.68 skin on stiffened side of panel A216 uniaxial 0° -7.88 -0.68 skin on flat side of panel A217 uniaxial 0° 7.88 -0.68 skin on stiffened side of panel A218 uniaxial 0° 7.88 -0.68 skin on flat side of panel A219 uniaxial 0° 7.88 -8.40 skin on stiffened side of panel A220 uniaxial 0° 7.88 -8.40 skin on flat side of panel A2
21A rosette 0° 7.88 -11.98 skin on stiffened side of panel A221B rosette 90° 7.88 -11.98 skin on stiffened side of panel A221C rosette 45° 7.88 -11.98 skin on stiffened side of panel A222A rosette 0° 7.88 -11.98 skin on flat side of panel A222B rosette 90° 7.88 -11.98 skin on flat side of panel A222C rosette 45° 7.88 -11.98 skin on flat side of panel A223A rosette 0° -7.88 10.82 skin on stiffened side of panel A123B rosette 90° -7.88 10.82 skin on stiffened side of panel A123C rosette 45° -7.88 10.82 skin on stiffened side of panel A124A rosette 0° -7.88 10.82 skin on flat side of panel A124B rosette 90° -7.88 10.82 skin on flat side of panel A124C rosette 45° -7.88 10.82 skin on flat side of panel A125 uniaxial 0° -7.88 5.95 skin on stiffened side of panel A126 uniaxial 0° -7.88 5.95 skin on flat side of panel A127 uniaxial 0° --- -6.70 Stiffener A A328 uniaxial 0° --- -6.70 Stiffener A A329 uniaxial 0° --- -6.70 skin on flat side of panel directly behind Stiffener A A330 uniaxial 0° --- 5.52 Stiffener B A431 uniaxial 0° --- 5.52 Stiffener B A432 uniaxial 0° --- 5.52 skin on flat side of panel directly behind Stiffener B A4

26
Figure A1. Location of strain gages on top half of test panel.
Figure A2. Location of strain gages on bottom half of test panel.
Figure A3. Location of strain gages on Stiffener A.
(Gages aligned along stiffener length)
27
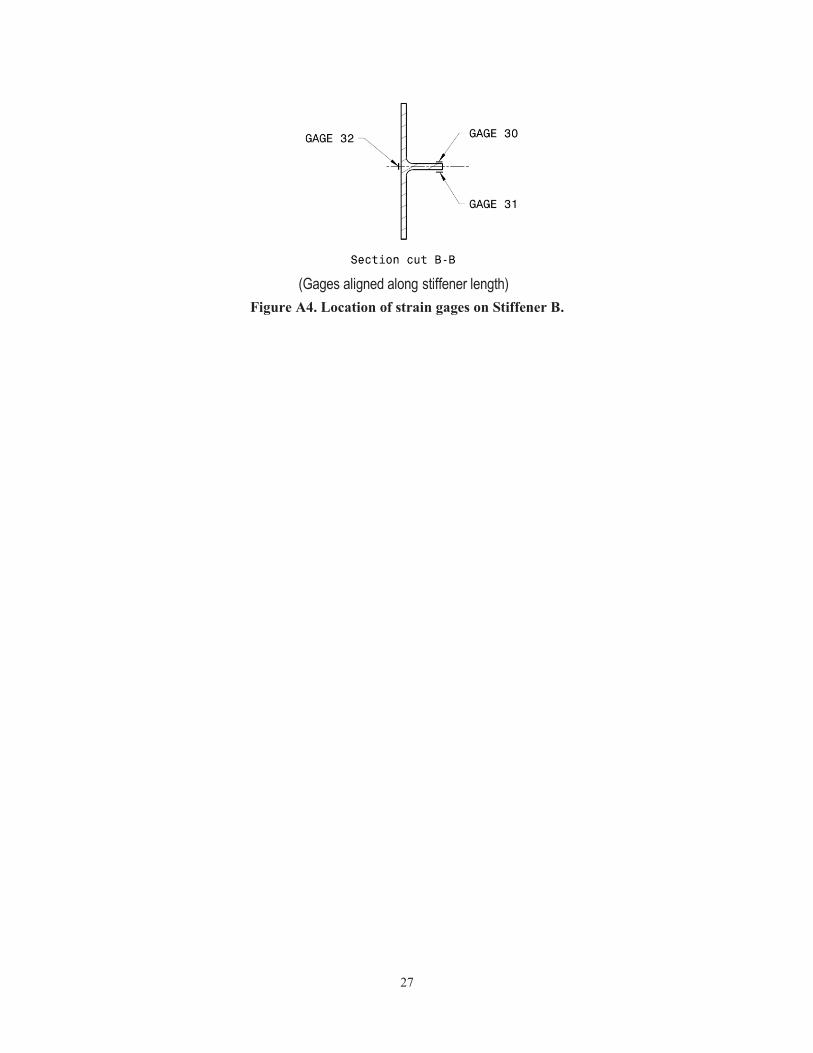
Figure A4. Location of strain gages on Stiffener B.
(Gages aligned along stiffener length)
28
Appendix B
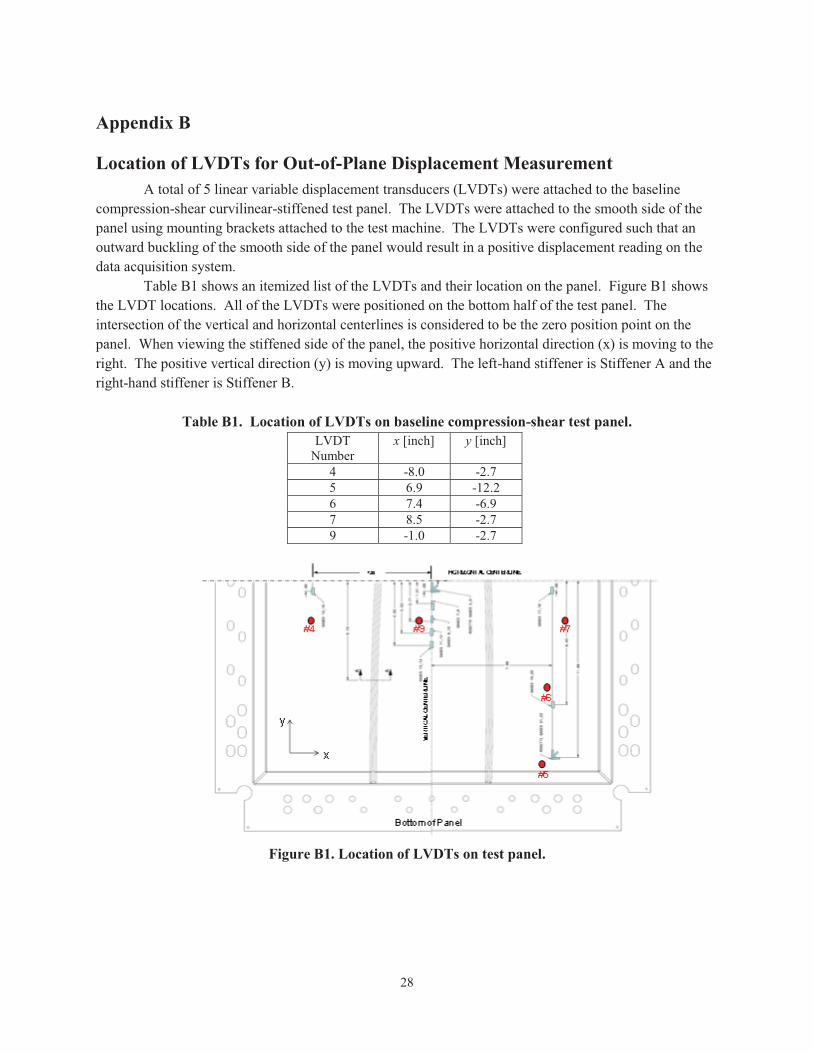
Location of LVDTs for Out-of-Plane Displacement Measurement A total of 5 linear variable displacement transducers (LVDTs) were attached to the baseline
compression-shear curvilinear-stiffened test panel. The LVDTs were attached to the smooth side of the panel using mounting brackets attached to the test machine. The LVDTs were configured such that an outward buckling of the smooth side of the panel would result in a positive displacement reading on the data acquisition system.
Table B1 shows an itemized list of the LVDTs and their location on the panel. Figure B1 shows the LVDT locations. All of the LVDTs were positioned on the bottom half of the test panel. The intersection of the vertical and horizontal centerlines is considered to be the zero position point on the panel. When viewing the stiffened side of the panel, the positive horizontal direction (x) is moving to the right. The positive vertical direction (y) is moving upward. The left-hand stiffener is Stiffener A and the right-hand stiffener is Stiffener B.
Table B1. Location of LVDTs on baseline compression-shear test panel.
LVDT Number
x [inch] y [inch]
4 -8.0 -2.7 5 6.9 -12.2 6 7.4 -6.9 7 8.5 -2.7 9 -1.0 -2.7
Figure B1. Location of LVDTs on test panel.

29
Appendix C
Supplemental Data from Strain Gages and the Out-of-Plane LDVTs The results from each LDVT and strain gage are plotted below. For the strain gage rosettes, the
shear strain was deduced from the 0°, 90° and 45° components as described in the text. Refer to appendix A for strain gage locations and appendix B for out-of-plane LVDT locations.
-0.08-0.07-0.06-0.05-0.04-0.03-0.02-0.01
00.01
0.0 0.5 1.0 1.5 2.0 2.5Load Factor
Dis
plac
emen
t (in
)
Figure C1. Comparison of the test, nonlinear FEM, and the linear test fixture/panel assembly
responses for LVDT 4 (positive deflection is measured towards the stiffeners).

30
00.020.040.060.08
0.10.120.140.160.18
0.0 0.5 1.0 1.5 2.0 2.5Load Factor
Dis
plac
emen
t (in
)
Figure C2. Comparison of the test, nonlinear FEM, and the linear test fixture/panel assembly
responses for LVDT 5 (positive deflection is measured towards the stiffeners).
0
0.05
0.1
0.15
0.2
0.25
0.3
0.0 0.5 1.0 1.5 2.0 2.5Load Factor
Dis
plac
emen
t (in
)
Figure C3. Comparison of the test, nonlinear FEM, and the linear test fixture/panel assembly
responses for LVDT 6 (positive deflection is measured towards the stiffeners).

31
-0.0020
-0.0016
-0.0012
-0.0008
-0.0004
0.0000
0.0 0.5 1.0 1.5 2.0 2.5Load Factor
Stra
in
Figure C4. Comparison of the test, nonlinear FEM, and the linear test fixture/panel assembly
responses for axial strain gages 1 and 2 (εyy). (Strain is presented in units of inch/inch.)
-0.0020
-0.0016
-0.0012
-0.0008
-0.0004
0.0000
0.0 0.5 1.0 1.5 2.0 2.5Load Factor
Stra
in
Figure C5. Comparison of the test, nonlinear FEM, and the linear test fixture/panel assembly
responses for axial strain gages 3 and 4 (εyy). (Strain is presented in units of inch/inch.)

32
-0.0024
-0.0020
-0.0016
-0.0012
-0.0008
-0.0004
0.0000
0.0 0.5 1.0 1.5 2.0 2.5Load Factor
Stra
in
Figure C6. Comparison of the test, nonlinear FEM, and the linear test fixture/panel assembly
responses for axial strain gages 7 and 8 (εyy). (Strain is presented in units of inch/inch.)
-0.0016
-0.0012
-0.0008
-0.0004
0.0000
0.0 0.5 1.0 1.5 2.0 2.5Load Factor
Stra
in
Figure C7. Comparison of the test, nonlinear FEM, and the linear test fixture/panel assembly
responses for axial strain gages 8 and 9 (εyy). (Strain is presented in units of inch/inch.)
33
-0.0024
-0.0020
-0.0016
-0.0012
-0.0008
-0.0004
0.0000
0.0 0.5 1.0 1.5 2.0 2.5Load Factor
Stra
in
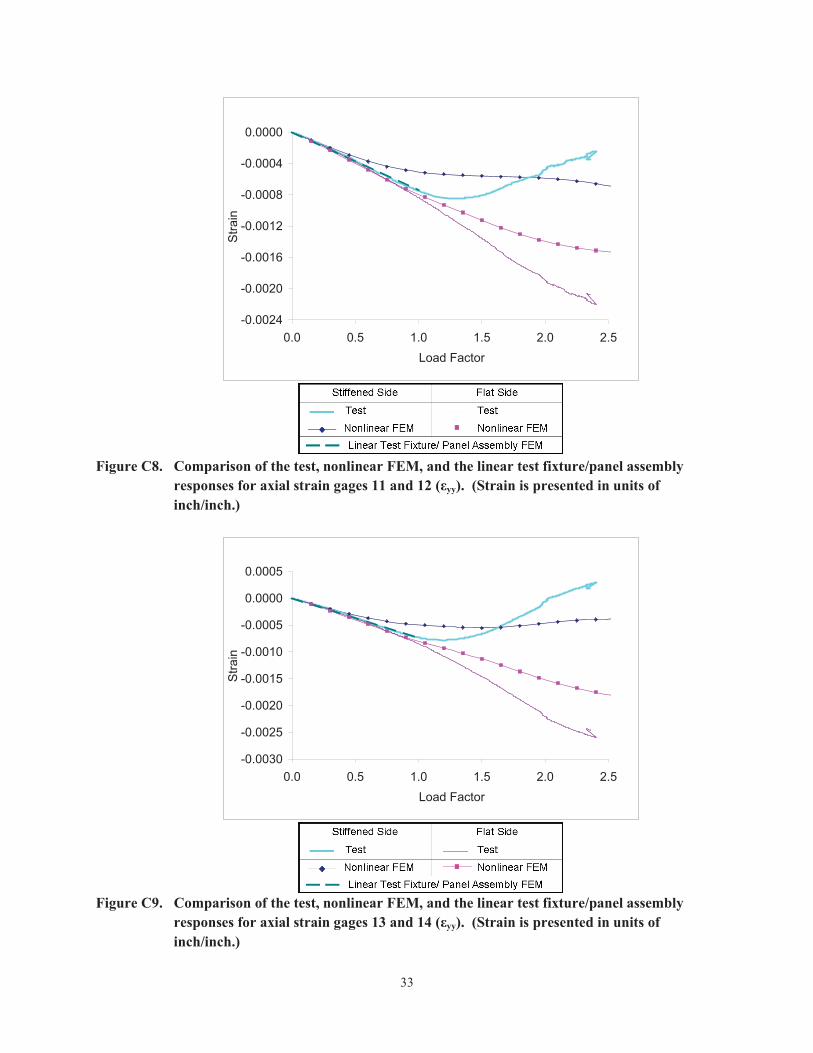
Figure C8. Comparison of the test, nonlinear FEM, and the linear test fixture/panel assembly
responses for axial strain gages 11 and 12 (εyy). (Strain is presented in units of inch/inch.)
-0.0030
-0.0025
-0.0020
-0.0015
-0.0010
-0.0005
0.0000
0.0005
0.0 0.5 1.0 1.5 2.0 2.5Load Factor
Stra
in
Figure C9. Comparison of the test, nonlinear FEM, and the linear test fixture/panel assembly
responses for axial strain gages 13 and 14 (εyy). (Strain is presented in units of inch/inch.)

34
-0.0035
-0.0030
-0.0025
-0.0020
-0.0015
-0.0010
-0.0005
0.0000
0.0005
0.0010
0.0 0.5 1.0 1.5 2.0 2.5Load Factor
Stra
in
Figure C10. Comparison of the test, nonlinear FEM, and the linear test fixture/panel assembly
responses for axial strain gages 15 and 16 (εyy). (Strain is presented in units of inch/inch.)
-0.0040
-0.0030
-0.0020
-0.0010
0.0000
0.0010
0.0020
0.0 0.5 1.0 1.5 2.0 2.5Load Factor
Stra
in
Figure C11. Comparison of the test, nonlinear FEM, and the linear test fixture/panel assembly
responses for axial strain gages 17 and 18 (εyy). (Strain is presented in units of inch/inch.)

35
-0.0040
-0.0030
-0.0020
-0.0010
0.0000
0.0010
0.0020
0.0 0.5 1.0 1.5 2.0 2.5Load Factor
Stra
in
Figure C12. Comparison of the test, nonlinear FEM, and the linear test fixture/panel assembly
responses for axial strain gages 19 and 20 (εyy). (Strain is presented in units of inch/inch.)
0.0000
0.0005
0.0010
0.0015
0.0020
0.0025
0.0 0.5 1.0 1.5 2.0 2.5Load Factor
Stra
in
Figure C13. Comparison of the test, nonlinear FEM, and the linear test fixture/panel assembly
responses for strain gages 21 and 22 perpendicular to the direction of the dominant compressive loading (εxx). (Strain is presented in units of inch/inch.)

36
-0.0050
-0.0040
-0.0030
-0.0020
-0.0010
0.0000
0.0010
0.0020
0.0 0.5 1.0 1.5 2.0 2.5Load Factor
Stra
in
Figure C14. Comparison of the test, nonlinear FEM, and the linear test fixture/panel assembly
responses for axial strain gages 23 and 24 (εyy). (Strain is presented in units of inch/inch.)
-0.0005
0.0000
0.0005
0.0010
0.0015
0.0020
0.0025
0.0 0.5 1.0 1.5 2.0 2.5Load Factor
Stra
in
Figure C15. Comparison of the test, nonlinear FEM, and the linear test fixture/panel assembly
responses for strain gages 23 and 24 perpendicular to the direction of the dominant compressive loading (εxx). (Strain is presented in units of inch/inch.)
37
-0.0008
-0.0006
-0.0004
-0.0002
0.0000
0.0002
0.0004
0.0006
0.0008
0 0.5 1 1.5 2 2.5Load Factor
Stra
in
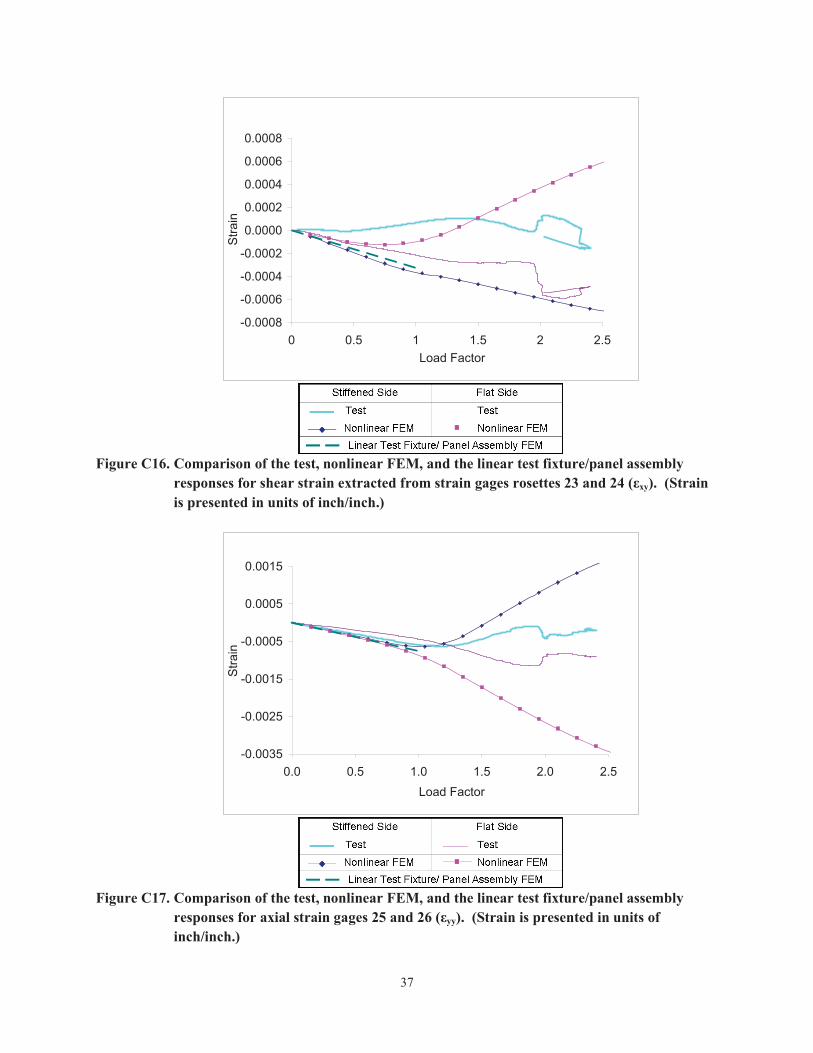
Figure C16. Comparison of the test, nonlinear FEM, and the linear test fixture/panel assembly
responses for shear strain extracted from strain gages rosettes 23 and 24 (εxy). (Strain is presented in units of inch/inch.)
-0.0035
-0.0025
-0.0015
-0.0005
0.0005
0.0015
0.0 0.5 1.0 1.5 2.0 2.5Load Factor
Stra
in
Figure C17. Comparison of the test, nonlinear FEM, and the linear test fixture/panel assembly
responses for axial strain gages 25 and 26 (εyy). (Strain is presented in units of inch/inch.)
38
-0.001
0.000
0.001
0.002
0.003
0.004
0.005
0.006
0.007
0.0 0.5 1.0 1.5 2.0 2.5Load Factor
Stra
in
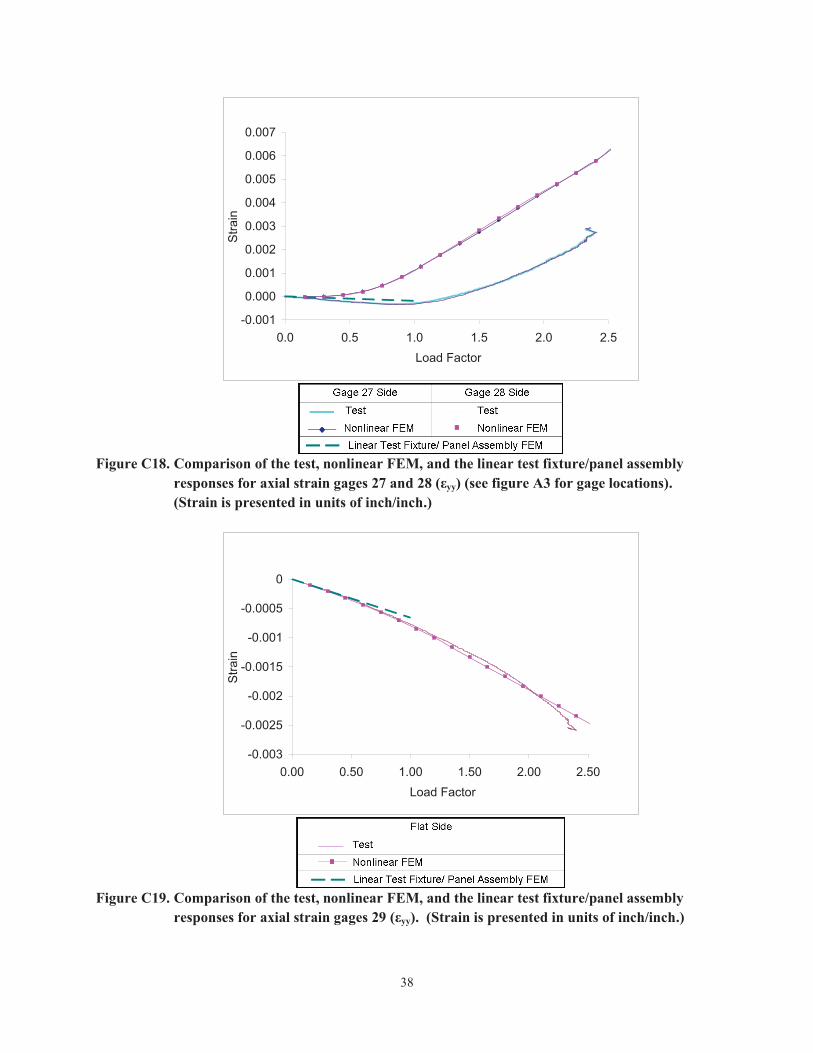
Figure C18. Comparison of the test, nonlinear FEM, and the linear test fixture/panel assembly
responses for axial strain gages 27 and 28 (εyy) (see figure A3 for gage locations). (Strain is presented in units of inch/inch.)
-0.003
-0.0025
-0.002
-0.0015
-0.001
-0.0005
0
0.00 0.50 1.00 1.50 2.00 2.50Load Factor
Stra
in
Figure C19. Comparison of the test, nonlinear FEM, and the linear test fixture/panel assembly
responses for axial strain gages 29 (εyy). (Strain is presented in units of inch/inch.)

39
-0.001
0.000
0.001
0.002
0.003
0.004
0.005
0.0 0.5 1.0 1.5 2.0 2.5Load Factor
Stra
in
Figure C20. Comparison of the test, nonlinear FEM, and the linear test fixture/panel assembly
responses for axial strain gages 30 and 31 (εyy) (see figure A4 for gage locations). (Strain is presented in units of inch/inch.)
-0.0035
-0.003
-0.0025
-0.002
-0.0015
-0.001
-0.0005
0
0.00 0.50 1.00 1.50 2.00 2.50Load Factor
Stra
in
Figure C21. Comparison of the test, nonlinear FEM, and the linear test fixture/panel assembly
responses for axial strain gages 32 (εyy). (Strain is presented in units of inch/inch.)
REPORT DOCUMENTATION PAGE Form ApprovedOMB No. 0704-0188
2. REPORT TYPE Technical Publication
4. TITLE AND SUBTITLE
Design, Optimization and Evaluation of Integrally Stiffened Al 7050 Panelwith Curved Stiffeners
5a. CONTRACT NUMBER
6. AUTHOR(S)
Slemp, Wesley C. H.; Bird, R. Keith; Kapania, Rakesh K.; Havens, David; Norris, Ashley; Olliffe, Robert
7. PERFORMING ORGANIZATION NAME(S) AND ADDRESS(ES)NASA Langley Research CenterHampton, VA 23681-2199
9. SPONSORING/MONITORING AGENCY NAME(S) AND ADDRESS(ES)National Aeronautics and Space AdministrationWashington, DC 20546-0001
8. PERFORMING ORGANIZATION REPORT NUMBER
L-20075
10. SPONSOR/MONITOR'S ACRONYM(S)
NASA
13. SUPPLEMENTARY NOTES
12. DISTRIBUTION/AVAILABILITY STATEMENTUnclassified UnlimitedSubject Category 39 Availability: NASA CASI (443) 757-5802
19a. NAME OF RESPONSIBLE PERSON
STI Help Desk (email: [email protected])
14. ABSTRACT
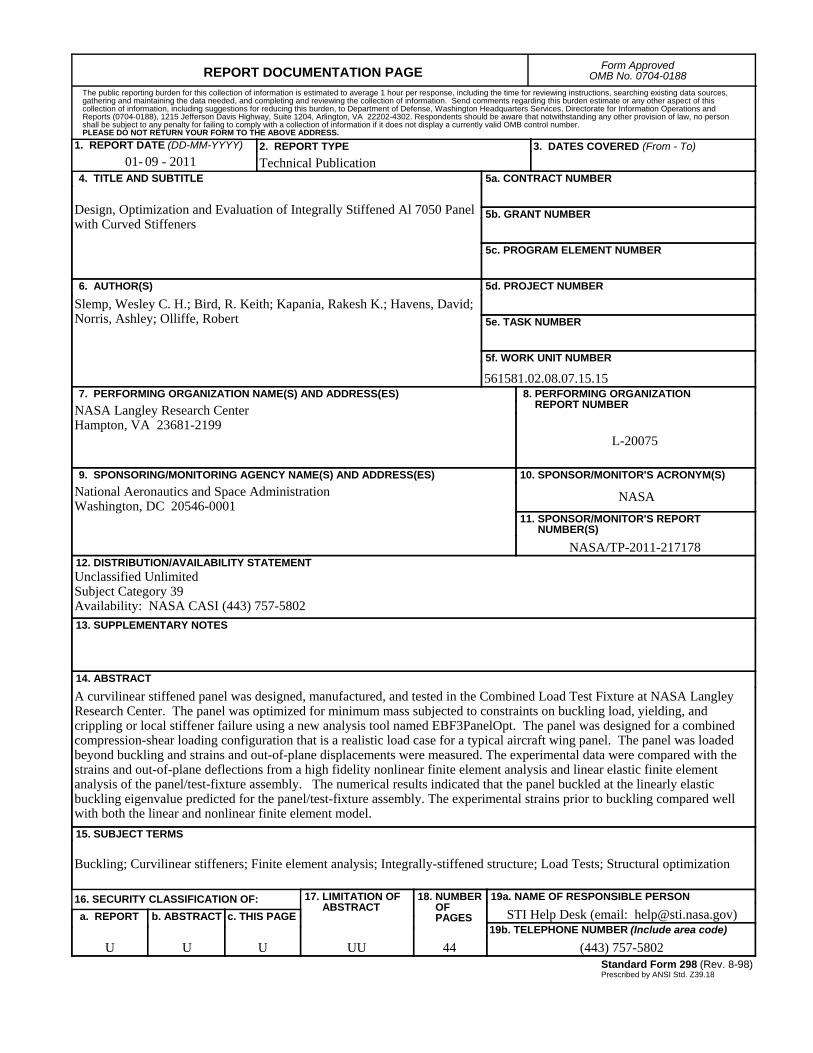
A curvilinear stiffened panel was designed, manufactured, and tested in the Combined Load Test Fixture at NASA Langley Research Center. The panel was optimized for minimum mass subjected to constraints on buckling load, yielding, and crippling or local stiffener failure using a new analysis tool named EBF3PanelOpt. The panel was designed for a combined compression-shear loading configuration that is a realistic load case for a typical aircraft wing panel. The panel was loaded beyond buckling and strains and out-of-plane displacements were measured. The experimental data were compared with the strains and out-of-plane deflections from a high fidelity nonlinear finite element analysis and linear elastic finite element analysis of the panel/test-fixture assembly. The numerical results indicated that the panel buckled at the linearly elastic buckling eigenvalue predicted for the panel/test-fixture assembly. The experimental strains prior to buckling compared well with both the linear and nonlinear finite element model.15. SUBJECT TERMS
Buckling; Curvilinear stiffeners; Finite element analysis; Integrally-stiffened structure; Load Tests; Structural optimization
18. NUMBER OF PAGES
4419b. TELEPHONE NUMBER (Include area code)
(443) 757-5802
a. REPORT
U
c. THIS PAGE
U
b. ABSTRACT
U
17. LIMITATION OF ABSTRACT
UU
Prescribed by ANSI Std. Z39.18Standard Form 298 (Rev. 8-98)
3. DATES COVERED (From - To)
5b. GRANT NUMBER
5c. PROGRAM ELEMENT NUMBER
5d. PROJECT NUMBER
5e. TASK NUMBER
5f. WORK UNIT NUMBER
561581.02.08.07.15.15
11. SPONSOR/MONITOR'S REPORT NUMBER(S)
NASA/TP-2011-217178
16. SECURITY CLASSIFICATION OF:
The public reporting burden for this collection of information is estimated to average 1 hour per response, including the time for reviewing instructions, searching existing data sources, gathering and maintaining the data needed, and completing and reviewing the collection of information. Send comments regarding this burden estimate or any other aspect of this collection of information, including suggestions for reducing this burden, to Department of Defense, Washington Headquarters Services, Directorate for Information Operations and Reports (0704-0188), 1215 Jefferson Davis Highway, Suite 1204, Arlington, VA 22202-4302. Respondents should be aware that notwithstanding any other provision of law, no person shall be subject to any penalty for failing to comply with a collection of information if it does not display a currently valid OMB control number.PLEASE DO NOT RETURN YOUR FORM TO THE ABOVE ADDRESS.
1. REPORT DATE (DD-MM-YYYY)09 - 201101-