designation survey ii addendum report combustion ...€¦ · oak ridge institute for science and...
TRANSCRIPT

. /
,111 DESIGNATION SURVEY ADDENDUM REPORT II COMBUSTION ENGINEERING SITE
*I WINDSOR, CONNECTICUT
111 E. W. ABELQUIST
Prepared for the Office of Environmental Restoration U.S. Department of Energy
I-
II
I- .:jj;jiE// .:::=::::: .ipij!li’
,:::i::.:. ..::I::::/. ,:ii~iiiiai, ..‘iiiiiiiiii!!liiii~~~~,~:~:. ~i!i.~iii~‘:‘-’
+g?’ gg;; ,- ZY
:i/
.:;i” .:!! .:::a
.(/i?j i:/i;jl? I!kr
‘-:~i~jg~;...,.;,
..,::&Si! :(j)//ji//(!: 3.. :jijiiiiiiqi:wi l~,.
,,v..::;:~/j~B/; g#;$ .;::::::::::! :::::::::: ::j/j j/i; :(/;;I
. . :/:jij;
,:j:,i/; ::::::: ,i/j//:j
;igg;ij iii:::: ,;(iii$
:::::i:ii. ,,,,,, :i.;ifi;iuij;; ,,:,: ii ,,::::::::::::
.:zy,:l::...
Lb. .::i:::. .,:.:::;:. ](i:iii:;!! :.:::::::p “‘.‘j?‘~ fix&$ .ii .:::i
.::i;;!jg#ggi& i///jjji_
,:j!jlili~l,:fir,~::,~,. $*g!$
,:: ////:::a::: :::,‘ii”Z jj/j/:/ji:. $ iiggip~,;.,
.i~~llflii$%!is~....:zL ....-y
;& ;i ::::ii:i ii:::::: .:::::::: ::::::i. :::u::: .:::::i: .::::::.: .:::xl:::
.‘~;‘~~;~~ii~;~iiiiiii;. .t...................... :r ,:::::_::i.:-
.:;;i. ....
,,,,,,__,: ;:i,l,‘;iii, ,:iiiiijiiiiiii.iiiq$ :::.:: ;::: .::i::::: ii::::. .:::::. ::::: iii. :/’

ORISE 96/G-l 7
DESIGNATION SURVEY ADDENDUM REPORT
COMBUSTION ENGINEERING SITE WINDSOR, CONNECTICUT
Prepared by
E. W. Abelquist
Environmental Survey and Site Assessment Program Environmental and Health Sciences Division
Oak Ridge Institute for Science and Education Oak Ridge, TN 3783 l-01 17
Prepared for the
Office of Environmental Restoration U.S. Department of Energy
FINAL REPORT
JULY 1996
This report is based on work performed under contract number DE-AC05-760R00033 with the U.S. Department of Energy.
Combustion Engineering Site - July 30,19!X h \essap\reporrs\wlndsor\windsor.002
_._-_I __-.. .- _. _ --

The Oak Ridge Institute for Science and Education (ORISE) was established by the U.S. Department of Energy to undertake national and international programs in science and engineering education, training and management systems, energy arxl environment systems, ad medical sciences. ORISE and its programs are operated by Oak Ridge Associated Universities (ORAU) through a management and operating contract with the U.S. Department of Energy. Established in 1946, ORAU is a consortium of 89 colleges and universities.
NOTICES
The opinions expressed herein do not necessarily reflect the opinions of the sponsoring institutions of Oak Ridge Associated Universities.
This report was prepad as an account of work sponsored by the United States Government. Neither the United States Government nor the U.S. Department of Energy, nor any of their employees, makes any warranty, expressed or implied, or assumes any legal liability or responsibility for the accuracy, completeness, or usefulness of any information, apparatus, product, or process disclosed, or represents that its use would not infringe on privately owned rights. Reference herein to any specific commercial product, process, or service by trade name, mark, manufacturer, or otherwise, does not necessarily constitute or imply its endorsement or recommendation, or favor by the U.S. Government or any agency thereof. The views and opinions of authors expressed herein do not necessarily state or reflect those of the U.S. Government or any agency thereof.
- . . . _ -I__ _ ._ I . - -

DESIGNATION SURVEY ADDENDUM REPORT
COMBUSTION ENGINEERING SITE WINDSOR, CONNECTICUT
Prepared by: E. W. Abelquist, Assistanfirogram Director
Date: 7/31/x2
Environmental Survey and SiteAssessment Program
Reviewed by: T. J. Vitkus, Survey Projects Manager Environmental Survey and Site Assessment Program
Reviewed by: Date: R. D. Condra, Technical Resources Manager
713 (17~
Environmental Survey and Site Assessment Program
Reviewed by: 7P6=+2 A.T. Payne, Administrative Services Manager Quality Assurance/Health & Safety Manager Environmental Survey and Site Assessment Program
Reviewed by: W.?I!.. Beck, Program Director
Date:
Environmental Survey and Site Assessment Program
Combustion Engmeaing Site - July 30. 1996 h \essap\reports\winbor\wlndror.002
-_ - __.. --- __- __-__ __-.-

ACKNOWLEDGMENTS
The author would like to acknowledge the significant contributions of the following staff members:
LABORATORY STAFF
ILLUSTRATOR
T. D. Herrera
CombustionEngineering Site _ July 30, 1996 h:\ersap\reporcs\windsor\wlndsor.002
-. - ~--- “_- --- ll__--- --.~---.
R. D. M. J. S. T.
Condra Laudeman Shipley
CLERICAL STAFF
D. K. T. S. K. E.
Ash Fox Waters

TABLE OF CONTENTS
List of Figures ................
List of Tables ..................
Abbreviations and Acronyms ......
PAGE
. . . . . . . . . . . . . . . . . . . . . . . . . . . . . . . . . . . . . ii
. . . . . . . . . . . . . . . . . . . . . . . . . . . . . . . . . .
. . . . . . . . . . . . . . . . . . . . . . . . .
Introduction and Site History . . . . . _ . . . . . . . . . . . . . . . . . . . . .
Site Description .....................
Objective ..........................
Document Review ...................
Procedures .....................
Findings and Results ...............
Comparison of Results with Guidelines .
Summary.. ......................
References .......................
Appendices:
.............
.............
.............
.............
..............
..............
..............
. .
........... 3
........... 4
............ 5
... ....... 111
....... iv
....... 1
....... 2
....... 3
. . . . . . .
. .
. .
........................ 9
....................... 10
. . . . . . . . . . . . . . . . . . . . . . . . . . . . . . . . . . . . . . 46
Appendix A: Major Instrumentation
Appendix B: Analytical Procedures
Combustion Engineering SIU - July 30. I996 i

FIGURE 1:
FIGURE 2:
FIGURE 3:
FIGURE 4:
FIGURE 5:
FIGURE 6:
FIGURE 7:
FIGURE 8:
FIGURE 9:
FIGURE 10:
FIGURE 11:
FIGURE 12:
FIGURE 13:
FIGURE 14:
FIGURE 15:
FIGURE 16:
FIGURE 17:
FIGURE 18:
FIGURE 19:
FIGURE 20:
FIGURE 21:
LIST OF FIGURES
PAGE
Location of the Combustion Engineering Site-Windsor, Connecticut ...... 11
Plot Plan of the Combustion Engineering Site-Windsor, Connecticut ...... 12
Building 3, Drains-Measurement and Sampling Locations ............... I 3
Building 3, High Bay, West Wall-Measurement and Sampling Locations 14
Building 3, East Wall-Measurement and Sampling Locations ............ 15
Building 3, West Wall Above Crane Rail-Measurement and Sampling Locations ............................................. 16
Building 3, North Wall-Measurement and Sampling Locations ........... 17
Building 6, Basement-Measurement and Sampling Locations ............ 18
Waste Storage Pad Area-Measurement and Sampling Locations .......... 19
Drum Burial Pit-Measurement and Sampling Locations ................ 20
Grounds North of Building 3-Measurement and Sampling Locations ...... 21
Septic Field-Measurement and Sampling Locations ................... 22
Sewage Treatment Facility-Measurement and Sampling Locations ........ 23
Trash Piles on Site Brook Bank-Measurement and Sampling Locations .... 24
Sewer Line Manholes-Measurement and Sampling Locations ............ 25
Site Brook-ORISE Sampled Locations ............................. 26
Site Brook-KAPL Sampled Locations Near Plant Discharge ............. 27
Site Brook-KAPL Sampled Locations Middle of Brook ................ 28
Site Brook-KAPL Sampled Locations Near Farmington River ........... 29
Argonne National Laboratory Sampling Locations for Environmental Samples .......................................... 30
Argonne National Laboratory Sampling Locations at the Site Brook ......... 3 1
Combustion Engineering Site - July 30. I596 ii h,\eJsap~eports\windsor\windsor.002

TABLE 1:
TABLE 2:
TABLE 3:
TABLE 4:
TABLE 5:
TABLE 6:
TABLE 7:
TABLE 8:
TABLE 9:
LIST OF TABLES
PAGE
Uranium Concentrations in Miscellaneous Samples . . . 32
Uranium Concentrations in Soil Samples - Waste Storage Pad Area . 33
Uranium Concentrations in Soil Samples - Drum Burial Pit and Other Site Areas . . . . . . . . . . . 34
Uranium Concentrations in Sediment Samples from Manhole Access Locations . . . . . 35
Uranium Concentrations in Sediment Samples from Site Brook and Outfall to Small Pond . . . . . . . . . 36
Isotopic Uranium Concentrations . . . . . . . . . . . . . . . . . . . . . 37
Radionuclide Concentrations in Site Brook Sediment Samples (KAPL) . . . 39
Isotopic Uranium Concentrations in Site Brook Sediment Samples (KAPL) . 44
Samples Collected by Argonne National Laboratory at the Combustion Engineering Site . . . . . . . . . . . . . . 45
.-
I- . . .
Combustmn Enginccnng See - July 30. 19% 111 h.\essap\rcpons\windsor\windror.002
_--...- -~ ---- -..--- __ .-. _.. . .-. --.-

.-
.-.. :; cm2 cpm DOE DOE-EM
DOE-OR0 ESSAP EU FSRD ft2 FUSRAP h ha HEU KAPL kg km m m2 MDC N2i.I NIST NRC ORISE ORNL PCvg
ABBREVIATIONS AND ACRONYMS
Atomic Energy Commission Argonne National Laboratory centimeter Combustion Engineering square centimeter counts per minute U.S. Department of Energy Office of Environmental Restoration and Waste Management
DOE Oak Ridge Operations Environmental Survey and Site Assessment Program enriched uranium Former Sites Restoration Division square feet Formerly Utilized Sites Remedial Action Program hour hectare highly enriched uranium Knolls Atomic Power Laboratory kilogram kilometer meter square meter minimum detectable concentration sodium iodide National Institute of Standards and Technology Nuclear Regulatory Commission Oak Ridge Institute for Science and Education Oak Ridge National Laboratory picocuries per gram
Combustmn Engmccrrng Site - July 30. 1996 iv h:\es~p\repolis\wlndsor\windsor.002
-_-. .- __-- sx; -.. .-

DESIGNATION SURVEY ADDENDUM REPORT
COMBUSTION ENGINEERING SITE WINDSOR, CONNECTICUT
INTRODUCTION AND SITE HISTORY
Combustion Engineering (CE) has operated a facility in Windsor, Connecticut as part of its efforts
as a contractor for the Atomic Energy Commission (AEC), predecessor agency of the Department
ofEnergy (DOE), on nuclear reactor and fuel projects. Beginning in 1955 and continuing for over
a decade, CE served as a direct contractor to the AEC and as a subcontractor to other firms for a
number of projects involving the use of highly enriched uranium (HEU) provided by the AEC. The
uranium furnished for use at the CE facility varied from about 5% to over 90% enrichment of U-235
(USDOE 1993).
In the late 1950’s, CE constructed a Naval reactor prototype under contract with the ABC on a
portion of CE property. The CE site was later subdivided, with the 4-hectare (ha) Naval reactor
prototype site becoming a U.S. government property. CE retained ownership of the remainder of the
property. The Naval reactor prototype is now shutdown and defueled and is maintained by Knolls
Atomic Power Laboratory (KAPL) under contract with the Department of Energy Office of Naval
Reactors. CE also currently operates a nuclear fuel manufacturing facility licensed by the Nuclear
Regulatory Commission (NRC), number SNM-1067, on the Windsor site.
The portions of the Windsor site formerly used for the ABC included Buildings 3, 5 and 6, the related
drainpipes and sewer lines, the waste storage pad area, and the drum burial site. Specifically, DOE’s
authority at the CE site is limited only to the following: (1) Building 3; (2) other facilities or areas
associated exclusively with Building 3 (i.e., sewer lines); or (3) contamination that is exclusively high-
enriched uranium (i.e., enriched to more than 20 percent in the isotope uranium-235). In addition,
DOE has authority to address Co-60 or other radionuclides in the Site Brook as a result of the
operations of the Naval reactor prototype.
.-
*- Combustmn Engineenng Site - July 30. I996 h:\essaplepo~\wlndsor\wlndror 002
--- ..~. -- _-_.__ I -

_,/s‘a
. -
.a
( I -
- - . -
The Environmental Survey and Site Assessment Program (ESSAP) of the Oak Ridge Ins titute of
Science and Education (ORISE) performed a designation survey at the Combustion Engineering s ite
in November 1993 (ORISE 1994). The interior designation survey activities cons is ted of alpha, beta
and gamma scans of the floors , walls , drains and equipment, measurements of total and removable
activity, and misce llaneous sampling. The exterior survey activities cons is ted of gamma scans of the
outdoor areas, and so il and misce llaneous sampling.
Results of the designation survey identified several interior and exterior locations as containing highly
enriched uranium (greater than 20% enrichment in the U-235 isotope)-including a floor drain
location, pipe insu lation wrap in the Drop Tube Furnace Test ing area, and the north wall and
Vault Room within Building 3. The exterior areas inc lude the waste s torage pad area, drum burial
pit, grounds north of Building 3, Site Brook bank, sewer and indus trial lines , and the Site Brook
(ORISE 1994).
The Department of Energy’s (DOE) O ffice of Environmental Restoration and W aste Management
(EM) requested that the current radiologica l condition of the CE s ite be re-evaluated, based on an
additional review of the ex is ting data and in preparation of characterization survey planning.
Additional activities subsequent to the publication of the designation survey report have inc luded a
technica l report on the dis tribution coefficients of uranium and Co-60 (ANL 1996) and the analy s is
ofover 120 sediment samples co llec ted from the Site Brook by KAPL in 1991. These 120 samples
were taken to increase KAPL’s information on the quantity and dis tribution of radioactivity in the Site
Brook originating from the Naval reactor prototype. This report discusses the updated radiologica l
condition for the CE s ite, and provides summarized information to ass is t in the planning for further
characterization activities at the CE s ite.
SITE DESCRIPTION
The CE s ite, cover ing approximately 445 hectares (1100 acres), is located on Day Hill Road in a
mixed indus trial and residential area approximately 5 k ilometers southwest of Bradley International
Airport (Figure 1). Interstate 91 runs to the east ofthe s ite and the Site Brook runs east to west on
the north end of the s ite and joins the Farmington River northwest of the s ite. The s ite is comprised
Combustion Engmeering Site - July 30. 1996 2 h,\crsap~epo~\windsor\wlndror 002

of more than a dozen buildings with several smaller support facilities (Figure 2). The site is also
characterized by various wooded areas and three ponds.
The waste storage pad area is an approximately 110 m x 220 m plot of land, lightly wooded with a
mildly sloping terrain, located at the interior of the site. The drum burial pit, approximately five times
smaller in area than the waste storage pad area, is characterized by level terrain situated between two
steep embankments.
I- Uranium fuel fabrication was historically performed in Buildings 3, while Building 5 was similarly
used for AEC contract work. Buildings 3 and 5 are currently used to support research and
development projects. Building 6 served as a waste dilution and pumping facility for the liquid
streams from Buildings 3 and 5. Two sewer lines discharged material from Building 6, one to the
sewage treatment facility and the other to the Site Brook.
OBJECTIVE
The objective of this re-evaluation was to provide updated information on the radiological conditions
of the CE site-relative to uranium with an enrichment of not less than 20% in the U-235 isotope.
Additionally, radionuclide analyses of over 120 sediment samples from the Site Brook-collected in
1991 by KAPL-provided a data set to further characterize the uranium contamination in the Site
Brook. The results of this revised data will be used by DOE/EM and DOE contractors to provide
a basis for further characterization of the CE site, where further actions under FUSRAP may be
warranted.
a- DOCUMENT REVIEW
ESSAP reviewed the site background information provided by the DOE (USDOE 1993), and the
technical report provided by ANL (ANL 1996).
Combustion Engmeering Site - July 30, 1996 3 h.\eunp\repo~s\wln~or\wln&or.002
. .._ - ____-- . *.v

PROCEDURES
^-
mm..
I-
e-
4-
-.-
During the period from November 15 through 18, 1993, ESSAP performed a designation survey of
the Combustion Engineering Site. The survey was in accordance with a survey plan dated
November 12, 1993 submitted to and approved by the DOE (ORISE 1993). ORISE prepared a
designation survey report that provided the survey procedures and results of this survey (ORISE
1994). On May 10, 1996, ESSAP received 121 sediment samples from the Site Brook which had
been collected by KAPL personnel in 1991. This report summarizes the results of the designation
survey, analytical results of sediment samples collected from the Site Brook by KAPL in 199 1, and
sample results obtained by ANL. A coding scheme using colors and symbols was developed to
graphically present the sample results according to total uranium concentration and % U-235
enrichment:
Total Uranium Concentration
< 50 pCi/g - green
> 50 and < 100 pCi/g - blue
> 100 pCi/g - red
% U-235 Enrichment
< 8% - octagon (0)
> 8 and < 15% - triangle (A)
> 15 and < 20% - square (0)
120% - diamond (0)
This coding scheme may be used to quickly identify those building locations and exterior areas that
DOE has authority to remediate under FUSRAP.
SAMPLEANALYSISANDDATAINTERPRETATION
Samples and survey data were returned to the ESSAP Oak Ridge laboratory for analyses and
interpretation. Ninety-five (95) soil and miscellaneous samples from the 1993 designation survey,
as well as the 121 additional KAPL sediment samples, were dried and then analyzed by gamma
spectrometry. Spectra were reviewed for U-235 and U-238, and any other identifiable photopeaks.
Three of the KAPL sediment samples were also analyzed for Ni-63. Thirty-six (36) of the samples
from the 1993 designation survey were also analyzed by alpha spectrometry, as were twenty-two (22)
of the KAPL sediment samples. Samples were selected for alpha spectrometry analyses based on
Combustmn Engineering Site - July 30, 1996 4 h.\ersapLeporrJ\windsor\windror.002
l-l_ .-_. .- .~

, -
I-
.-
_ -
th e resul ts o f g a m m a spect rometry- to p rov ide b e tte r es t imates o f th e % E U a n d to ta l u r a n i u m
c o n c e n trat ion. So i l a n d m isce l laneous s a m p l e s resul ts w e r e repor ted in uni ts o f p icocur ies pe r g r a m
@ X /g) d ry w e i g h t. T h e p e r c e n t U - 2 3 5 e n r i c h m e n t w a s ca lcu la ted by d iv id ing th e U - 2 3 4 , U - 2 3 5 , a n d
U - 2 3 8 activity c o n c e n trat ions by the i r respect ive speci f ic activi t ies, a n d d e te rm in ing th e rat io o f th e
U - 2 3 5 isotop ic w e i g h t to th e to ta l u r a n i u m w e i g h t. S p e c i f ically,
% E U = U - 2 3 5 1 2 .1 4 E 6 U - 2 3 5 1 2 .1 4 E 6 + U - 2 3 8 1 3 .3 3 E S + U - 2 3 4 1 6 .1 9 E P '
w h e r e U - 2 3 5 , U - 2 3 8 , a n d U - 2 3 4 a re th e activity c o n c e n trat ions in pCi /g, a n d th e numer i ca l va lues
a re th e respect ive speci f ic act iv i t ies fo r e a c h isotope. For s a m p l e s th a t w e r e on ly ana l yzed by g a m m a
spect rometry , th e U - 2 3 4 w a s es t imated b a s e d o n a n a s s u m e d U - 2 3 4 to U - 2 3 5 rat io o f 2 4 . Th is rat io
w a s b a s e d o n th e ana lys is o f 5 8 s a m p l e s by a l p h a spect rometry . It shou ld b e n o te d th a t b a c k g r o u n d
s u b tract ion o n s a m p l e s w a s n o t per fo rmed; wh ich m a y a ffect th e repor ted va lues fo r % E U a n d to ta l
u r a n i u m c o n c e n trat ions. A d d i tio n a l in fo rmat ion conce rn ing ma jo r ins t rumenta t ion a n d analy t ica l
p rocedu res is p rov ided in A p p e n d i c e s A a n d B .
F INDINGS A N D R E S U L T S
T h e analy t ica l resul ts fo r th e fo l l ow ing a reas a re p r e s e n te d in Tab les 1 th r o u g h 9 . Tab les 1 th r o u g h
5 a n d 7 p rov ide g a m m a spect romet ry d a ta , wh i le Tab les 6 a n d 8 p rov ide isotop ic u r a n i u m resul ts
f rom a l p h a spect rometry . Tab le 9 p r e s e n ts th e analy t ica l resul ts repor ted by A N L (1996) . T h e a l p h a
a n d g a m m a spect romet ry resul ts a re d i scussed consecut ive ly fo r e a c h si te a r e a .
INTERIOR
U r a n i u m c o n c e n trat ions in m isce l laneous s a m p l e s (i.e., res idue, fibe rg lass insulat ion, p a i n t, e tc.)
co l lec ted f rom dra ins, s u m p s , wa l ls a n d floo rs a re p r e s e n te d in Tab les 1 a n d 6 . T h e to ta l u r a n i u m
c o n c e n trat ions in th r e e Bu i l d i ng 3 d ra in res idue s a m p l e s (d ra in # ‘s 2 th r o u g h 4 ) w e r e less th a n 4 7
pCi /g, wi th co r respond ing U - 2 3 5 e n r i c h m e n ts less th a n a p p r o x i m a te ly 4 % (Tab le 1). A l p h a
spect romet ry ana lys is o f d ra in res idue s a m p l e # l resu l ted in a to ta l u r a n i u m c o n c e n trat ion o f 1 3 ,1 9 0
pCi /g a n d a U - 2 3 5 e n r i c h m e n t o f 4 4 % (Tab le 6). R e fe r to F igu re 3 fo r th e g raph ica l representa t ion
Combus t ion Eng inee r i ng S i te - July 30. 1 9 9 6 5 h: \essnp lepo~\w lndsor \wmdsor .002
..,. I -..- ___- .

ofthe % U-235 enrichment and total uranium concentration in Building 3 drains. The total uranium
activity in the fiberglass sample from the Building 3 west wall location #3 was approximately
1,600 pCi (Table l), with a corresponding U-235 enrichment of approximately 0.68%. The total
uranium concentration in one sample of pipe insulation wrap in the Drop Tube Furnace Testing Area
was 2,500 pCi/g, with a corresponding U-235 enrichment of approximately 20% (Table 1). Alpha
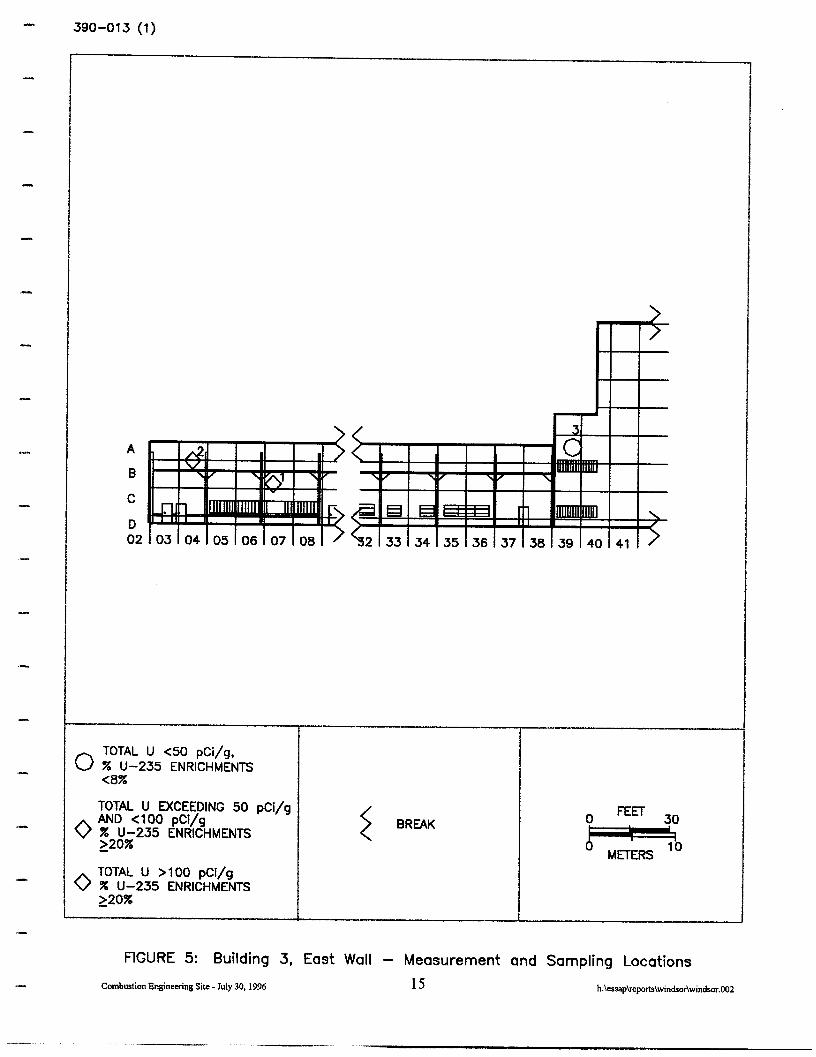
spectrometry analyses, performed on 6 fiberglass samples from Building 3 east, south, and west walls
(Figures 4, 5, and 6), resulted in total uranium concentrations ranging from 1.60 to 60 1.33 pCi/g, and
corresponding U-235 enrichments ranging from 0.59% to 38% (Table 6).
Alpha spectrometry analysis on two paint samples from the Building 3 north wall and Vault Room
wall (Figure 7) resulted in total uranium concentrations of 43.8 and 864 pCi/g, and corresponding
U-235 enrichments of 46% and 32%, respectively (Table 6).
The total uranium concentration in an equipment residue sample in the basement of Building 6 was
11,000 pCi/g, with a corresponding U-235 enrichment of about 4% (Table 1). Alpha spectrometry
analyses of floor residue and a sediment sample from the sump resulted in total uranium
concentrations of 9,760 and 13,850 pCi/g, respectively, with a U-235 enrichments of 9.9 and 13%
(Table 6). Refer to Figure 8.
EXTERIOR
Uranium Concentrations in Soils
Uranium concentrations in soil samples, collected both randomly and from locations of elevated direct
radiation, are summarized in Tables 2, 3 and 6. The total uranium concentrations in the waste storage
pad area ranged from c4.0 to 54,000 pCi/g (Table 2) and corresponding U-235 enrichments ranged
from 0.80% to 86% (Table 2). Alpha spectrometry analysis, performed on 11 samples from the waste
storage pad area (Figure 9), resulted in total uranium concentrations ranging from 21.02 to 2,430
pCi/g, and corresponding U-235 enrichments ranging from 23% to 65% (Table 6).
Combustion Engincenng Site - July 30. 19% 6 h:\essap\repons\wlndsor\wmdror ~2
I I . . . _ ~____ __. .~ . - - -_ -

The total uranium concentrations in the drum burial pit (Figure 10) ranged from < 3.6 to 16,000 pCi/g
(Table 3) and corresponding U-235 enrichments of 1.4 to 82% (Table 3). Alpha spectrometry
analysis, performed on 3 samples from the drum burial pit, resulted in total uranium concentrations
of25.5, 345 and 917 pCi/g, and corresponding U-235 enrichments of 33%, 53% and 58% (Table 6).
The total uranium concentrations in grounds north of Building 3 (Figure 11) ranged from < 5.2 to
3,700 pCi/g, and U-235 enrichments of 0.57, 6.0, and 74 (Table 3). Alpha spectrometry analysis,
performed on 3 samples from the grounds north of Building 3, resulted in total uranium
concentrations of 39.1, 601 and 768 pCi/g, and corresponding U-235 enrichments of 3.7%, 39% and
36% (Table 6).
Alpha spectrometry analysis of the 3 sediment samples from the site brook bank (Figure 14) resulted
in a total uranium concentrations of 418, 967, and 24,090 pCi/g, and corresponding U-235
enrichments of 27%, 86% and 17% (Table 6). Much of the uranium contamination on the site brook
bank appeared to be associated with partially buried clam shells. Additional laboratory analysis was
performed to evaluate the quantity of uranium activity separately for both the clam shell fraction and
the soil fraction. The percentage ofU-235 in the soil component ranged from 63% to 93%, and from
7% to 37% in the clam shell component.
The total uranium concentrations in the septic field (Figure 12) and sewage treatment facility grounds
(Figure 13) ranged from < 3.8 to 40 pCi/g, with corresponding U-235 enrichments less than 1.9%
(Table 3).
Uranium Concentrations in Miscellaneous SamnleS
Uranium concentrations in sediment samples collected from manhole access locations to sewer and
industrial lines (Figure 15) are summarized in Tables 4 and 6. The total uranium concentrations in
these samples ranged from < 3.1 to 97,000 pCi/g, % U-23 5 enrichments ranged from 0.61 to 74%
(Table 4). Alpha spectrometry analysis, performed on 4 samples from the manhole access locations,
resulted in total uranium concentrations ranging from 334 to 4,900 pCi/g, and corresponding U-235
enrichments ranging from 8.0% to 55% (Table 6).
Combustion Engineering Sac _ July 30. 1996 7 h:\esssplcpo~\wlndsor\wlndsor 002

The total uranium concentrations in residue samples collected from the Building 3 roof vents were
<74 pCi/g (Table l), with corresponding U-235 enrichments less than 2.4%.
The U-235 activity on the buried piece of plastic near the drum burial pit was 307,400 pCi (Table l),
with a corresponding U-23 5 enrichment of approximately 7 1%.
Uranium Concentrations in Site Brook Samnles
Uranium concentrations in sediment samples collected by ORISE from the site brook (Figure 16) and
outfall to the Small Pond are summarized in Tables 5 and 6. The total uranium concentrations in
these samples ranged from c3.5 to 440 pCi/g, % U-235 enrichments ranged from 1.5 to 11.0%
(Table 5). Alpha spectrometry analysis of the Site Brook location #8 sediment sample resulted in a
total uranium concentration of 16,740 pCi/g and a U-235 enrichment of 58% (Table 6).
Uranium concentrations in sediment samples collected by KAPL from the Site Brook (Figures 17
through 19) are summarized in Tables 7 and 8. Uranium concentrations in excess of natural
concentrations are detectable from the vicinity of the CE outfalls into the brook to the mouth of the
brook in the Farmington River. The total uranium concentrations in these samples ranged from ~0.4
to 1009 pCi/g (Table 7) with corresponding U-235 enrichments ranging from 0 to 66.12% (Table 7).
Of the 121 sediment samples analyzed, only 5 samples exhibited U-235 enrichments greater than
20%. Alpha spectrometry analyses of 22 sediment samples from the Site Brook resulted in total
uranium concentrations of 1.51 to 1080 pCi/g, and U-235 enrichments ranging from 0.89 to 48.16%
(Table 8).
Cobalt-60 and Nickel-63 Concentrations in Site Brook Samr>les
Along with uranium present from CE operations, Co-60 has been detected in the Site Brook. This
Co-60 is due to discharges of water prior to 1979 containing small amounts of residual radioactivity
from a government-owned Naval reactor prototype. Ni-63 is commonly found in association with
Co-60 from Naval reactors.
Combustion Engincenng Sac - July 30, 1996 8 h ~essap\rcponc\w1ndsor\wmdror.00~
--- “._ -...- -

,-
Co-60 concentrations in the 12 1 brook sediment samples provided by KAPL (Figures 17 through 19)
ranged from CO. 1 pCi/g to 46.9 pCi/g (Table 7). Ni-63 analysis was performed on the three
sediment samples with the highest concentration of Co-60. The Ni-63 results were 26.7 i 1.5 pCi/g,
13.2 f 1.3 pCi/g and 7.2 f 1.2 pCi/g, for samples S7, SC6, and S27, respectively.
Results of samples collected by ANL are shown in Table 9 (Figures 20 and 21). These results are
consistent with those obtained by OFUSE.
COMPARISON OF RESULTS WITH GUIDELINES
DOE is authorized to perform remediation at locations where the uranium contamination exceeds
20% U-235 enrichment and the total uranium concentration exceeds the residual surface
contamination or soil guideline.
The site-specific soil guideline for enriched uranium will be determined pursuant to DOE Order
5400.5 (USDOE 1990).
Analyses of miscellaneous samples collected from interior areas identified the following locations
within Building 3 as contaminated with EU: drain location #1 (Figure 3), east wall (Figure 5), pipe
insulation wrap in the Drop Tube Furnace Testing Area (Figure 6) and the north wall and Vault
Room (Figure 7). The sediment sample collected from the Building 6 sump, while containing
significant quantities of uranium contamination, did not exceed the 20% U-235 enrichment action
level.
Analyses of soil and sediment samples collected from outdoor areas identified the following locations
as contaminated with EU: waste storage pad area (Figure 9) drum burial pit (Figure IO), grounds
north of Building 3 (Figure 1 l), Site Brook bank (Figure 14) sewer and industrial linesat manhole
access locations (Figure 15) and the Site Brook (Figures 16 through 18).
Designation survey activities did not identify EU contamination at any locations within Building 5,
on the grounds of the septic field or sewage treatment facility, on any roof surfaces or vents, or the
outfall to the Small Pond (ORISE 1994).
Combustion Engineering Sac . July 30. 1996 9 h:\eszap\reporu\wlndsor\windsor 002
-- I.” ___--...

SUMMARY
/-
At the request of the U.S. Department of Energy, the Oak Ridge Institute for Science and Education’s
Environmental Survey and Site Assessment Program re-evaluated the current radiological condition
of the CE site, based on a review and summary of the available data. Additional activities subsequent
to the publication of the designation survey report (ORISE 1994) have included a technical report
on the distribution coefficients of uranium and Co-60 (ANL 1996) and the analysis of 121 sediment
samples collected from the Site Brook by the Knolls Atomic Power Laboratory (KAPL) in 199 1.
The Department of Energy is authorized to perform remediation at locations where the uranium
contamination exceeds 20% U-235 enrichment and the total uranium concentration exceeds the
residual surface contamination or soil guideline. The designation survey has identified several interior
and exterior locations where these criteria appear to be satisfied. The interior areas include drain
location #l, east wall location #2, pipe insulation wrap in the Drop Tube Furnace Testing area, and
the north wall and Vault Room wall within Building 3. The exterior areas include the waste storage
pad area, drum burial pit, grounds north ofBuilding 3, Site Brook bank, sanitary sewer and industrial
drain lines, and the Site Brook.
Combustion Engmecring Site . July 30, 1996 10 h:~esrap\reporu\w1n&sor\wlnbor.00?
----- “. -_..--_ ~-..~

CEF7 (X)
.-
1-
CONNECTICUT \x
COMBUSTION ENGINEERING .I
G 84
NOT TO SCALE
FIGURE 1: Location of the Combustion Engineering Site - Windsor, Connecticut
Combuhon Engineering Sac . July 30, 19% 11 *-
-__..-- -.---.___--______ __-

CEF8 (1)
N
\ ROADWAYS
0 # BUILDING NUMBER
WATER 0
FEET
0 METERS
300
FIGURE 2: Plot Plan of the Combustion Engineering Site - Windsor, Connecticut
Combustion Engineering Site - July 30. 1996 12 h:\cssap\rcports\windsor\windsor.00?
.- -----
-.
_-_ .--_--- .---- “(I

,-
,.-
BLDG. 3A
0 TOTAL U <50 pCi/g, % U-235 ENRICHMENTS <8X
TOTAL U >lOO pCi/g X U-235 ENRICHMENTS ~20%
FIGURE 3: Building 3,
Combustion Engineering Site - July 30.1996
BLDG. 3
2 BREAK
.
’ METERS l5
Drains - Measurement and Sampling Locations 13 h:\essaplcpolts\windo~windsor.O02

390-012 (1)
J
H
G
F
0
0
0 TOTAL U <50 pCi/g, % U-235 ENRICHMENTS <8X
FIGURE 4: Building 3, High Bay, West Wall - Measurement and Sampling Locations
Combustion Engineering Site _ My 30.1996 14 h:\essap\reports\windsor\windsor.O02
I -
.-
A
B
C
D 0 2
0 T O T A L U < 5 0 pCi/g, % U - 2 3 5 E N R I C H M E N T S < 8 %
T O T A L U E X C E E D ING 5 0 pCi /g
0 A N D < l 0 0 pCi /g % U - 2 3 5 E N R I C H M E N T S 2 2 0 %
0 T O T A L U > l O O pCi /g % U - 2 3 5 E N R I C H M E N T S 1 2 0 %
2 B R E A K O &
’ M E IE R S lo
FIG U R E 5 : Bu i l d i ng 3 , E a s t W a ll - M e a s u r e m e n t a n d S a m p l i n g L o c a tio n s
Combus t ion Eng inee r i ng S i te - July 30 .1996 1 5 h: \essap\ repor ts \windsor .O02
*)_-- ---_. . _.-.

,-
..a.
.-
.-
--...
TOTAL U <50 pCi/g, A % U-235 ENRICHMENTS
BEIWEEN 8 AND 15%
0 TOTAL U >lOO pCi/g, % U-235 ENRICHMENTS <8X
0 TOTAL U >lOO pCi/g % U-235 ENRICHMENTS 220%
2 BREAK
FEEr 30
k? 10
FIGURE 6: Building 3, West Wall Above Crane Rail - Measurement and Sampling Locations
Combustion Engineering Site - July 30,1996 16 h:\essap\reports\windsor\windsor.002
. _-“-~ * ..- .- --__

RQPNMLKJHGFED
I 0’
I O2
INSIDE DOOR, ON VAULT
ROOM WALL
0 TOTAL U <50 pCi/g % U-235 ENRICHMENTS 220%
0 TOTAL U >lOO pCi/g % U-235 ENRICHMENTS 220%
FIGURE 7: Building 3, North Wall - Measurement and Sampling Locations
Combustion Engineering Site _ July 30, 1996 17 h:\essap\reparts\windsor\win&or.002
---- . . --~~~

390-001 (1)
SUMP SLUDGE STORAGE
e 0
0 12 --
0
3 0
E 0
0 0 iiuil 0 0
PUMP
TOTAL U >100 pCi/g, A 56 U-235 ENRICHMENTS
BETWEEN 8 AND 15%
0 TOTAL U >100 pCi/g, % U-235 ENRICHMENTS <8X
3 0
A
0
0 0
1
0 !I Hoi&UP
TANKS
N
&l-IL
i
0 FEm 18
FIGURE 8: Building 6, Basement - Measurement and Sampling Locations
Combustion Engineering Site - July 30.1996 18 h:\essap~eports\windsor\windsor.002

(O-15 cm) (15-30 cm)
0 TOTAL U <50 pCi/g, % U-235 ENRICHMENTS <8%
TOTAL U <50 pCi/g, n % U-235 ENRICHMENTS
BEIWEEN 8 AND 15%
0 TOTAL U <50 pCi/g % U-235 ENRICHMENTS 120% - FENCE
0 TOTAL U EXCEEDING 50 pCi/g 0 FEEr 90 AND <lOO pCi/g % U-235 ENRICHMENTS 220% 0-0
METERS 0 TOTAL U >I 00 pCi/g
% U-235 ENRICHMENTS 120%
FIGURE 9: Waste Storage Pad Area - Measurement and Sampling Locations Combustion Engineering Site - July 30.1996 19 h:\essap\reports\windsor\windsar.OOZ

,-
I-
,-
*-
..n..
a -
m?-
(O-15 cm)
(15-30 cm)
+J TOTAL U <50 pCi/g. % U-235 ENRICHMENTS <8%
0 TOTAL U <50 pCi/g % U-235 ENRICHMENTS 220%
0 TOTAL U >lO O pCi/g % U-235 ENRICHMENTS 220%
0 TREE
-:., ‘.Z.
0 : .:.: EXCAVATION :::
FIGURE 10: Drum Burial Pit - Measurement and Sampling Locations
Combustion Engineering Site - July 30, 1996 20 h:\essap\rrports\windsor\windsor.OOZ

I -
1 2 3 4 5 8 7 8 9 1 0
. . . . . . . . . . . . . . . . . . . .
; ; f ................ i.. ...................... i.. ...................... i .......................
j j j
................. i.. ..................... i.. ...................... . .......................
i
1
.j
;I
i
t
f
.f
.:
s
B
A
I B U ILDING 3
3 T O T A L U < 5 0 pCi /g % U - 2 3 5 E N R I C H M E N T S ~ 8 %
3 T O T A L U > l 0 0 pCi /g % U - 2 3 5 E N R I C H M E N T S 1 2 0 %
F
0 E
\ O U T - F A L L
D T O S M A L I P O N D
- F E N C E
’ M E T E R S lo
FIG U R E 1 1 : G r o u n d s Nor th o f Bu i l d i ng 3 - M e a s u r e m e n t a n d S a m p l i n g L o c a tio n s
Combus t ion Eng inee r i ng S i te - July 30 .1996 2 1 h: \essap\ repor ts \windsor \windsor .W2 * m m
.-- --.. -_ .- -.

390-005 (2)
/-
,-
,-
MONITOR WELL
I
BRUSH AND TREES
I t ‘I ‘_,
OPEN GRASS AREA
MANHOLE -
BRUSH AND
TREES
o(O-15 cm)
15-30 cm)
0 30-45 cm)
0 TOTAL U ~50 pCi/g, % U-235 ENRICHMENTS ~8% NOT TO SCALE
FlQJRE 12: Septic Field - Measurement and Sampling Locations Combustion Engineering Site - July 30, 1996 22 h:\essap\reports\windsor\windsor.002

s,- 390-006 (X)
N
0 TOTAL U <50 pCi/g % U-235 ENRICHMENTS <8X
’ METERS ‘I5
FIGURE 13: Sewage Treatment Facility - Measurement and Sampling Locations
Combustion Engineering Site - July 30,1996 23 h:\euap\repo~\windo~w~~or.002
-_-... -~ - -~ .-___ -___ .,

SITE BROOK
BURIED IN SIDE OF HILL
0 TOTAL U >I 00 pCi/g % U-235 ENRICHMENTS 220%
TOTAL U >lOO pCi/g 0 % U-235 ENRICHMENTS
BEIWEEN 15 AND 20%
NOT TO SCALE
FIGURE 14: Trash Piles on Site Brook Bank - Measurement and Sampling Locations
Combustion Engineering Site - July 30. 1996 24 h:\essap\reports\windsor\windsor.O02

390-008 (2)
SEWAGE TREATMENT
- -
0 TOTAL U <50 pCi/g, N % U-235 ENRICHMENTS <8X
0 TOTAL U >lOO pCi/g, % U-235 ENRICHMENTS <8% \ ROADWAYS
0 TOTAL U >I 00 pCi/g 0 # BUILDING NUMBER % U-235 ENRICHMENTS 120%
n TOTAL U >lOO pCi/g % U-235 ENRICHMENTS BETWEEN 8 AND 15%
E3 WATER 0
FIGURE 15: Sewer Line Manholes - Measurement and Sampling Locations
Combustion Engineering Site - July 30, 1996 25 h:\essap\reports\windsor\win~or.O02
_-_- “.-

w-o\ n SPICLWAY
Y COMBUSTlON ENGINEERING
SITE OUTFALLS
i WINDSOR SITE OUTFALL
I .
0 TOTAL U <50 pCi/g, % U-235 ENRICHMENTS <8%
TOTAL U EXCEEDING 50 pCi/g, 0 AND <lOO pCi/g
% U-235 ENRICHMENTS <8% TOTAL U >lOO pCi/g,
A 7U-;;;5 8Et4Ftl;H~;;TS 0
0 TOTAL U >I 00 pCi/g % U-235 ENRICHMENTS 220%
FEET 900 O- ’ MEIERS 3oo
FIGURE 16: Site Brook - ORISE Sampled Locations
Combustion Engineering Site - July 30, 1996 26 h:\essap\reports\windsor\windsor.O02

390-O 16 (3)
INSERT 1
MOUTH OF THE BRO COMBUSTION ENGINEERING
SITE OUTFALLS -w-w---------
L--------------,-,-,---------------------------J c:i: REFERENCE STAKE LOCATIONS -
0 TOTAL U 40 pCi/g, % U-235 ENRICHMENTS <8X
N
TOTAL U <SO pCi/g, A % U-235 ENRICHMENTS 0 TOTAL U >lOO pCi/g,
% U-235 ENRICHMENTS <8% BETWEEN 8 AND 15% TOTAL U >l 00 pCi/g,
0 TOTAL U EXCEEDING 50 pCi/g, A % U-235 ENRICHMENTS AND <lOO pCi/g BElWEEN 8 AND 15% % U-235 ENRICHMENTS <8X
TOTAL U EXCEEDING 50 pCi/g, A AND <loo pCi/g
0 TOTAL U >lOO pCi/g % U-235 ENRICHMENTS 220% 0 FEEr 900
% U-235 ENRICHMENTS BEIWEEN 8 AND 15%
bo
FIGURE 17: Site Brook - KAPL Sampled Locations Near Plant Discharge
Combustion Engineering Site - July 30, 1996 27 h:\essap\reporrs\windsor\windsor.O02
___-. - .-___ “.” ._I_

.-
FARI&;TON
/
10
lb9
9
10 104 100
$I
INSERT 1 ------____
A2 i COMBUSTION ENGINEERING
MOUTH OF THE BROOK (SEE INSERT 1)
WlNDS:R SITE OUTFALL i I
------------ _f :p REFERENCE STAKE LOCATIONS
0 TOTAL U <50 pCi/g, % U-235 ENRICHMENTS ~8%
TOTAL U <50 pCi/g, A % U-235 ENRICHMENTS
BETWEEN 8 AND 15% 0 TOTAL U >l 00 pCi/g, % U-235 ENRICHMENTS <8%
TOTAL U EXCEEDING 50 pCi/g, A AND <loo pCi/g
TOTAL U >lOO pCi/g,
% U-235 ENRICHMENTS A %&+;5 8ENiil;Hy;;TS
D BEIWEEN 8 AND 15%
TOTAL U EXCFEDING 50 pCi/g 0 TOTAL U >lOO pCi/g
% U-235 ENRICHMENTS ,20X 0 FEET 900
0-O
FIGURE 18: Site Brook - KAPL Sampled Locations Middle Of Brook
Combustion Engineering Site - July 30. 1996 28 h:\essap\reports\windsor\windsor.O02
_-. ..-- --_- --^_- .-.-..--

390-O 18 (3)
r ----
0 TOTAL U <50 pCi/g, % U-235 ENRICHMENTS <8X
TOTAL U <50 pCi/g, A % U-235 ENRICHMENTS
BETWEEN 8 AND 15%
TOTAL U EXCEEDING 50 pCi/g, A AND <IO0 pCi/g
% U-235 ENRICHMENTS BRWEEN 8 AND 15%
I COMBUSTION ENGINEERING
SITE OUTFALLS
/ WINDSOR SITE OUTFALL
6 REFERENCE STAKE LOCATIONS
N
GIL
f
0 FEEr 900
60
FIGURE 19: Site Brook - KAPL Sampled Locations Near Farmington River
Combustion Engineering Site _ July 34 1996 29 h:\essap\reports\windsor\windsor.O02

.-
iv @3# ANL SAMPLE NUMBER
\ ROADWAYS 73k
0 % BUILDING NUMBER t FEET
WATER 0
MfiERS 300
FIGURE 20: Argonne National Laboratory Sampling Locations for Environmental Samples
Combustion Engineering Site - July 30. 1996 30 h \essapLepo~\wlndsor\windsor.00?
I- _-. ___--

390-020 (x)
FARMINGTON
COMBUSTION ENGINEERING SITE OUTFALLS
WINDSOR SITE OUTFALL
’ METERS 3oo
FIGURE 21 : Argonne National Laboratoy Sampling Locations at the Site Brook
Combustion Engineering Site - July 30, 1996 31 h.Lssap\rcpolir\wtndsor\wlndsar.002

i i i i i I i I I 1 1 i 1 I D t 1 I
,o ii E C. s Pi B. 1.
g
2 c .E
z
is
TABLE 1
URANIUM CONCENTRATlONS IN MISCELLANEOUS SAMPLES COMBUSTION ENGINEERING SITE
WINDSOR, CONNECTICUT
Location
Building 3
Drain #2
Drain #3
Drain #4 Roof Vent, 3rd from N. End
Roof Vent, 7th from N. End
Drop Tube Furnace #l
W. Wall #3 Building 6
Near Pump Stand Drum Burial Pit
Adjacent to Surface Soil #2
Sample Type Figure No. Uranium Concentrations (?Ci/g) % U-235
U-235 U-238 Total U’ Enrichment
Residue 3 Cl.3 14.9 f 9.3b 47 1.3
Residue 3 0.4*0.1 2.1 1.8 f 12 2.9
Residue 3 0.6 0.1 f 2.2 1.5 f 17 4.0
Residue N/A c2.3 Cl7 74 2.1
Residue N/A 0.8 f 0.3 5.0 3.7 f 25 2.4
Pipe Insulation 6 97.8 f 5.9
Fiberglass 6 <35” 780 f 490’ 1,600 0.68
Residue 8 385.5 f 6.5 1418 k47 11,000 I 4.0
Plastic 11 307,400 f 2,800’ < 1 9,000c 7.8E6 71
4 .3- B “Total uranium concentration based on an assumed U-234 to U-235 ratio of 24. 2 c
bUncertainties represent the 95% confidence level, based on counting statistics only.
; ‘Units of pCi/sample.
P 8 f.J

TABLE 2
URANIUM CONCENTRATIONS IN SOIL SAMPLES WASTE STORAGE PAD AREA
COMBUSTION ENGINEERING SITE WINDSOR, CONNECTICUT
Depth of Location Sample
(cm)
Waste Storage Pad Area=
Grid F3 o-15
F3 15-30
F3 30-45
Uranium Concentrations (pCi/g) % U-235
U-235 U-238 Total Ub Enrichment
0.4 f 0.1” 1.9 f 1.5 12 3.1
co.1 Cl.5 4.0 1.0
co.1 1.9 f 1.7 4.4 0.80
Au I o-15 I 16.6 f 0.4 I c2.7 (4207 48
EEO 1 o-15 41.8 f 0.6 I 5.8 rt 2.5
cc5 1 o-15
cc5 1 15-30
A6 I o-15
03 1 o-15
2169.0 f 9.0 I <72
1,100 52
54,000 82
1,900 69
7,900 81
18.000 81
~33 1 15-30 1 247.1 * 2.4 I cl6 6.200 70
E6 o-15 98.6 f 0.8 c4.9 2,500 75
H8 15-30 co.1 1.6* 1.0 4.1 0.95
D8 o-15 358.2 f 1.6 c8.7 I 9,000 86
L9 15-30 0.9 f 0.1 Cl.4 24 9.0
“Refer to Figure 9. bTotal uranium concentration based on an assumed U-234 to U-235 ratio of 24. ‘Uncertainties represent the 95% confidence level, based only on counting statistics.
Combustvm Engmcermg Site - July 30. 1996 33 h \essnpi~epo~s\w~ndror\w~ndsor.DO?

, I -
1 -
.-
T A B L E 3
U R A N IUM C O N C E N T R A T IO N S IN S O IL S A M P L E S D R U M B U R IA L P IT A N D O T H E R S ITE A R E A S
C O M B U S T IO N E N G I N E E R I N G S ITE W I N D S O R , C O N N E C T ICUT
D e p th o f L o c a tio n S a m p l e
U r a n i u m C o n c e n trat ions (pCi /g) % U - 2 3 5
(cm) U - 2 3 5 U - 2 3 8 T o ta l U ” E n r i c h m e n t
D r u m Bur ia l P ith
L o c a tio n 1 o - 1 5 C O .1 Cl .1 3 .6 1 .4
3 1 5 - 3 0 2 3 .9 f 0 .4 " c3.3 6 0 0 5 3
( ins ide d rum) 5 o - 1 5 6 2 0 .1 zk 2 .5 2 0 .6 f 8 .9 1 6 ,0 0 0 8 2
6 O - 3 0 3 0 .1* 0 .5 c3.4 7 6 0 5 7
G r o u n d s Nor th o f Bu i l d i ng 3 ”
L o c a tio n 2 1 5 - 3 0 0 .7 f 0 .1 1 .7* 1 .1 1 9 6 .0
3 o - 1 5 1 4 8 .0 f 1 .1 c7.7 3 ,7 0 0 7 4
4 o - 1 5 co.1 2 .7 f 1 .3 5 .2 0 .5 7
S e p tic F ie ld’
L o c a tio n 1 o - 1 5 co. 1 1 .3 f 1 .8 3 .8 1 .2
1 1 5 - 3 0 co.3 c4.0 1 2 1 .1
1 3 0 - 4 5 co.2 c2.5 7 .5 1 .2
S e w a g e Trea tment Faci l i ty a n d S l u d g e P i les’
L o c a tio n 1 o - 1 5 co. 1 Cl .8 4 .3 0 .8 5
2 o - 1 5 co.1 Cl .4 3 .9 1 .1
3 o - 1 5 co.2 cl .8 6 .8 1 .7 4 o - 1 5 1 3 * 0 3 9 5 rt 5 .4 4 0 1 .9
“T o ta l u r a n i u m c o n c e n trat ion b a s e d o n a n a s s u m e d U - 2 3 4 to U - 2 3 5 rat io o f 2 4 . b R e fe r to F igu re 1 0 . “Uncer ta in t ies represen t th e 9 5 % c o n fid e n c e level , b a s e d on ly c o u n tin g statistics. d R e fe r to F igu re 1 1 . ‘R e fe r to F igu re 1 2 . d e fe r to F igu re 1 3 .
Combus t ion Eng inee r i ng Si te . July 30. 1 9 9 6 3 4 h \cssnpvepor ts \wlndsor \ rv indror .001
.^ . . I ___ ” ---

TABLE 4
URANIUM CONCENTRATIONS IN SEDIMENT SAMPLES FROM MANHOLE ACCESS LOCATIONS
COMBUSTION ENGINEERING SITE WINDSOR, CONNECTICUT
Location
Manholes”
1
2
3
4
5
7
8
10
12
13
14
15
Uranium Concentrations (pCi/g) O/u U-235 U-235 U-238 Total Ub Enrichment
co.2 2.4 * 1.6’ 7.4 1.3
co. 1 0.6 * 0.9 3.1 2.5
co.2 c2.3 7.3 1.3
1.0 f 0.1 2.1 f 1.1 27 6.8
co.1 2.5 * 1.3 5.0 0.61
565.5 f 1.9 64.7 f 9.8 14,000 57
co.1 cl.6 4.1 0.95
co.2 1.3 * 1.1 6.3 2.3
349.9 * 4.1 1727 zk 58 10,000 3.0
3868*39 <210 97,000 74
146.3 f 3.8 459 i 43 4,100 4.7
0.3 32 0.1 1.8 i 0.9 9.3 2.5
“Refer to Figure 15. bTotal uranium concentration calculated based on an assumed U-234 to U-235 ratio of 24. ‘Uncertainties represent the 95% confidence level, based only on counting statistics.
Comburm Engmecnng SW _ July 30. I!396 35 h \cssap‘rcporu\w,ndsor\w1n~r.002
---- .---.~. --.-.-_

.-
.-
TABLE 5
URANIUM CONCENTRATIONS IN SEDIMENT SAMPLES FROM SITE BROOK AND OUTFALL TO SMALL POND
COMBUSTION ENGINEERING SITE WINDSOR, CONNECTICUT
Location Uranium Concentrations (pCi/g) % U-235
U-235 U-238 Total U” Enrichment
Site Brookb
1 co.1 Cl.0 3.5 1.5
2 co.1 1.2* 1.1” 3.7 1.3
3 co. 1 1.3 f 0.8 3.8 1.2
4 0.1 f 0.1 0.5 * 0.7 3.0 3.0
5 10.9 f 0.6 11.3 14.8 280 13
6 1.5 f 0.1 3.4 f 1.2 41 6.4
7 16.7* 1.0 21 f 10 440 11
9 2.3 f 0.2 8.6 * 2.9 66 4.0
10 1.0 f 0.1 2.0 f 1.7 27 7.2
Outfall to Small Pondd
Outfall co.1 Cl.0 3.5 1.5
“Total uranium concentration based on assumed U-234 to U-235 ratio of 24. bRefer to Figure 16. The results for Location #8 are shown in Table 6. ‘Uncertainties represent the 95% confidence level, based only on counting statistics. dRefer to Figure 11.
Combustion Engmeering SW - July 30. 1996 36 h \essapvepo~\win~or\wlndror 002

i
6 3 is f. s F e. 3. g w -. 0’ 2 q .F
2
?I
5 Is- I 2 a 3 c i -. i ,.I
I i i I I i I I f i 1 1 1 f i
TABLE 6
ISOTOPIC URANIUM CONCENTRATIONS COMBUSTION ENGINEERING SITE
WINDSOR, CONNECTICUT
I 1 I
Location Figure Uranium Concentrations (pCi/g) % U-235 No. U-234 U-235 U-238 Total U’ Enrichment
Bldg 3, Drain #I 1 3 12,640 f 250h 465 f 55 91*22 13,190&260 44
Bldg 3, High Bay, W. Wall 4 0.95 f 0.13 0.02 * 0.04 0.63 kOo.10 1.60~0.16 0.59
Bldg 3, E. Wall #1 5 48.13 f 0.65 1.72kO.14 1.10*0.10 50.95 f 0.67 20
Bldg 3, E. Wall #2 5 577.42 f 9.57 19.16* 1.98 4.75 f 0.89 601.33 f 9.82 38
Bldg 3, E. Wall #3 5 1.28rtO.11 0.05 f 0.02 0.73 f 0.08 2.06%0.13 0.94
Bldg 3, Drop Tube Furnace #2 6 10.48 f 0.35 0.46 f 0.08 0.50 f 0.08 11.44 f 0.37 12
Bldg 3, S. Wall N/A 1.30*0.12 0.07 f 0.3 0.91 f 0.10 2.28 f 0.16 1.1
Bldg 3, N. Wall #l 7 782 f 24 61.3 f 7.6 20.0f3.8 864 f 25 32
Bldg 3, N. Wall #2 7 42.0 f 1.8 1.53 *0.39 0.28hO.16 43.8k 1.8 46
Bldg 6, N.E. Comer Floor 8 8,910*460 351*47 499+53 9,760*460 9.9
Bldg 6, Sump 8 12,780*410 512*92 554*85 13,850 f 430 13
Waste Storage Pad AA5, 15-30 cm 9 51.8* 1.2 2.49*0.29 0.81*0.15 55.1 1.2 f 32
Waste Storage Pad A6, 15-30 cm 9 70.2* 1.3 3.17f0.32 0.6OkO.12 74.Ok 1.4 45
Waste Storage Pad E6, 15-30 cm 9 41.87hO.97 2.00% 0.24 0.86 0.14 f 44.7* 1.0 27
Waste Storage Pad EEO, 15-30 cm 9 l,ll9*25 39.65 5.3 15.0*2.9 1,173 *25 29
Waste Storage Pad D8, 15-30 cm 9 611*11 22.1 f 2.4 3.69* 0.90 636+12 48
Waste Storage Pad H4,0- 15 cm 9 319*26 12.9*2.4 2.12hO.86 334*27 49
Waste Storage Pad H4, 15-30 cm 9 57.7*2.2 2.05 *0.47 1.06* 0.30 60.8*2.2 23
Waste Storage Pad H8,0- 15 cm 9 436*27 15.8jz2.7 2.32 0.90 f 454h27 51
Waste Storage Pad K6, 15-30 cm 9 19.68 f 0.68 1.07UIo.!8 0.27 0.08 f 21.02kO.70 38

i i i I I 1 1 i I I 9 I I 9 i t I i I
TABLE 6 (Continued)
ISOTOPIC URANIUM CONCENTRATIONS COMBUSTION ENGINEERING SITE
WINDSOR, CONNECTICUT
Location Figure Uranium Concentrations (pCi/g) % U-235 No. U-234 U-235 U-238 Total U” Enrichment
Waste Storage Pad K6, O-l 5 cm 9 2,330 f 160 89* 16 7.4 f 4.0 2,430 f 160 65
Waste Storage Pad L9,0- 15 cm 9 70.4 f 7.2 3.7 1.2 f 1.04 0.59 % 75.2 f 7.3 36
Drum Burial Pit #2,0-l 5 cm 10 882 f 21 31.2*4.5 3.5 f 1.3 917*22 58
Drum Burial Pit #3, O-l 5 cm IO 328 z!z 28 15.1 *2.8 2.02 f 0.84 345 f 28 53
Drum Burial Pit #4,0- 15 cm 10 23.5 f 1.6 1.48 0.46 f 0.48 f 0.23 25.5 1.7 f 33
N. ofBldg3 #I, O-15 cm 11 712*20 44.0 5.7 f 12.0 f 2.6 768+21 36
N. of Bldg 3 #2,0- 15 cm 11 31.1 f 1.5 1.61 0.39 f 6.42 If: 0.69 39.1 l 1.7 3.7
N. of Bldg 3 #5 11 568 f 34 27.1 3.6 * 6.6* 1.5 601 f 34 39
Site Brook Bank #I I4 929 f 74 37* 10 0.9* 1.5 967 f 75 86
Site Brook Bank #2,0- I5 cm I4 15,450*320 4,860 200 f 3,780 f 160 24,090 f 4 10 I7
Site Brook Bank #3 14 387 f 33 22.0 3.5 f 9.1 * 1.9 418*33 27
Manhole #6, Old Industrial Line 15 4,680 f 170 185i38 36* 15 4,900 f 170 44
Manhole #9, Industrial 15 1,989 f 87 71 19 f 8.8 5.8 f 2,069 f 89 55
Manhole #1 I, Industrial I5 355*33 14.5 2.9 f 25.6 f 3.9 395 f 33 8.0
Manhole #I 6, Industrial 15 310* 14 11.5 k3.0 11.8k22.7 334* 14 I3
Site Brook #8 16 16,160*370 525 75 f 59*22 16,740 f 380 58 5. g “Total uranium concentrations based on the sum of U-234, U-235 and U-238 concentrations, 8 IJ bUncertainties represent the 95% confidence level, based only on counting statistics.
z i I! t 2 a ii 2 lj-

TABLE 7
RADIONUCLIDE CONCENTRATIONS IN SITE BROOK SEDIMENT SAMPLES (KAPL) COMBUSTION ENGINEERING SITE
WINDSOR, CONNECTICUT
KAPL ORISE Radionuclide Concentration (pCi/g)
Iddy e Sample ’ Co-60b Co-60’ % U-235
ID U-235 U-238 Total U’ (1173 keV) Enrichmenr
(1332 keV)
Sl 39os117 0.00 0.73 f 0.76” 0.7 0.11 0.00 0.0 s2 39OSOOl 0.00 0.37 f 0.78 0.4 0.16 0.00 0.0 s3 39OSOO2 0.00 0.63 St 0.78 0.6 0.17*0.11 0.17*0.11 0.0 s4 39osoo3 0.00 0.35 f 0.86 0.4 0.25 0.00 0.0 s5 39osoo4 0.00 0.80* 0.71 0.8 0.37 * 0.16 0.49 f 0.14 0.0
S6 39osoo5 0.00 1.07* 1.74 1.1 5.78 * 0.73 4.77 l 0.72 0.0 I I I I I
0.00 ( 6.19* 1.99 1 6.2 t 46.67 * 1.92 1 46.90 i 1.88 1 0.0
s9 1 39OSOO8
0.00 0.71 i22.15 0.7 29.63 * 1.53 28.81 f 1.48 0.0
0.00 1.33 f 1.92 1.3 5.33 f 0.68 5.92 * 0.69 0.0
0.00 3.72 f 2.79 3.7 13.43 f 1.26 13.02 f 1.17 0.0 0.30 f 0.12 4.36 f 1.53 11.8 1.81 f0.31 1.84*0.33 1.04 Sll 39osoo9 I
SC11 39os102 0.00 0.92 f 0.92 0.9 0.25 0.00 0.0
s12 39OSOlO 0.00 2.61 * 1.26 2.6 2.23 rfr: 0.43 2.44 0.39 f 0.0
s14 39OSOll 0.00 1.89 * 1.29 1.9 1.39 * 0.33 0.87 f 0.30 0.0 s15 39oso12 0.00 2.79 f 1.73 2.8 5.09 + 0.82 5.24 f 0.70 0.0
I I I I
1 1 1 1 1 I
S16 39OSO13 0.00 2.76* 1.03 2.8 0.88*0.22 1 1.02*0.18 0.0 II SC16B 39OS103 0.72iO.10 11.99* 1.37 30.0 0.54 * 0.3 1 0.74 0.21 f 0.92
SC16T 39os104 0.00 5.62 f 1.54 5.6 2.10*0.45 1.69 f 0.37 0.0
s17 39oso14 0.95 f 0.22 5.67 f 2.53 29.4 4.11 iO.76 4.44 f 0.8 1 2.54
S18 39OSO15 0.25 f 0.11 2.97 f 1.47 9.3 8.70 f 0.69 7.98 f 0.68 1.32
s19 39OSO16 4.97 * 0.29 15.33 f 2.61 139.6 13.95 * 1.12 13.12 f 1.08 4.80
Combustion Engmcering Sk - July 30, I596 39
_. --_-__

TABLE 7 (Continued)
,-
,-
RADIONUCLIDE CONCENTRATIONS IN SITE BROOK SEDIMENT SAMPLES (KAPL) COMBUSTION ENGINEERING SITE
WINDSOR, CONNECTICUT
s34 39OSO28 5.04 f 0.19 2.61 k 1.22 128.6 0.74 A 0.3 1 0.40 f 0.18 23.04 s35 39oso29 7.53 f 0.33 16.94 f 2.75 205.2 4.89 * 0.73 4.97 f 0.71 6.47 S36 39OSO30 2.05 f 0.16 3.69 f 1.10 54.9 1.28 f 0.35 1.07 f 0.27 7.95 s37 39OSO3 1 2.44 * 0.14 3.19* 1.02 64.2 0.72 f 0.25 0.70 * 0.2 1 10.61 S38 39OSO32 4.22 zt 0.26 7.93 f 1.91 113.3 2.07 f 0.42 2.30 * 0.42 7.64 s39 39OSO33 0.56 l 0.08 1.76* 1.16 15.7 0.24 0.00 4.69
11 S40 i 39OSO34 i 3.87hO.20 i 1.34& 1.17 i 8 I I
7.0 0.29 0.00 2.59 I s41 39OSO35 3.87 f 0.20 4.01 f 1.51 100.7 1.93 f 0.46 2.09 f 0.39 13.04 S42 39OSO36 0.96 f 0.07 2.38 f 0.97 26.4 0.35 zk 0.16 0.32*0.13 5.90
SC42B 390s 106 0.00 0.88 f 0.62 0.9 0.10 0.00 0.0 I I I I I
1 I I
SC42T 39OS107 1 0.48 zk 0.08 1 2.01 i 0.98 1 14.0 0.23 0.00 I 3.57 II s43 39OSO37 8.72 f 0.41 16.27 f 3.28 234.3 5.15kO.87 5.17 * 0.77 7.69
s44 39OSO38 7.53 f 0.28 12.64 f 2.23 200.8 3.47 f 0.56 3.53 f 0.46 8.47 , s45 39OSO39 0.31 f 0.06 0.56 f 0.71 8.3 0.17 0.00 7.94
S46 39oso40 0.51 f 0.09 1.67* 1.10 14.3 0.37 f 0.21 0.37*0.15 4.51 s47 39OSO41 0.82 f 0.06 1.62 f 0.69 22.2 0.44 f 0.16 0.38 zt 0.13 7.32 S48 39OSO42 0.80 f 0.07 1.11 i0.69 21.1 0.73 f 0.18 0.59*0.17 10.10
1 I
s49 39OSO43 0.36 f 0.07 1.12*0.93 10.2 0.29 0.00 4.81 s50 39OSO44 0.24 f 0.08 1.58 f 0.75 7.5 0.23 0.00 2.30
II I I I I I I I
s51 1 39OSO45 ) 0.21 f 0.05 1 1.03 f 0.82 1 6.2 0.17 0.00 3.06 II
Combustmn Engmeenng Site - July 30. 1996 40
-

,I
,-
.-
TABLE 7 (Continued)
RADIONUCLIDE CONCENTRATIONS IN SITE BROOK SEDIMENT SAMPLES (KAPL) COMBUSTION ENGINEERING SITE
W INDSOR, CONNECTICUT
Combustion Engrneermg Sac - July 30. 1996 41 h \ersap\reports\w1ndsor\u,indsor.M)2
.- - ---..

TABLE 7 (Continued)
RADIONUCLIDE CONCENTRATIONS IN SITE BROOK SEDIMENT SAMPLES (KAPL) COMBUSTION ENGINEERING SITE
WINDSOR, CONNECTICUT
<- Combwtmn Engmeering Site - July 30, 1996 42 h \essnp~ecports\w~ndror\wrndFor 002
__ _-_-__ I” .* ---

. -
.-
2 -
I-
+ -
.-
a -
*-
T A B L E 7 ( C o n tin u e d )
R A D IO N U C L IDE C O N C E N T R A T IO N S IN S ITE B R O O K S E D IM E N T S A M P L E S ( K A P L ) C O M B U S T IO N E N G I N E E R I N G S ITE
W I N D S O R , C O N N E C T ICUT
II l+ !:!J IE $
1 S lO O I3 9 o s o 9 3 1 1 S lO l 1 3 9 o s o 9 4 1 1 s 1 0 2 I 3 9 o s o 9 5
1 1 S 1 0 6 1 3 9 O S O 9 9
U - 2 3 5
Rad ionuc l i de C o n c e n trat ion (pCi /g)
U - 2 3 8 T o ta l U ’ C o - 6 0 b ( 1 1 7 3 keV )
C o - b o b ( 1 3 3 2 keV )
% U - 2 3 5 En r i chmen l
0 .0 0 1 .4 7 f 0 .6 9 1 .5 0 .1 5 0 .0 0 0 .0 0 .0 0 1 .11*0 .75 1 .1 0 .1 0 0 .0 0 0 .0 0 .0 0 0 .5 2 k 0 .7 4 0 .5 0 .1 3 0 .0 0 0 .0
I
0 .5 6 * 0 .1 0 1 .7 2 k 1 .1 7 1 5 .6 0 .3 4 f 0 .2 1 0 .2 8 f 0 .1 8 4 .7 9 0 .0 0 1 .4 6 = t 1 .1 4 1 .5 0 .1 9 0 .0 0 0 .0
4 .3 4 f 0 .3 0 6 .7 5 f 2 .4 6 1 1 5 .2 3 .0 5 f 0 .6 9 2 .8 1 f 0 .6 5 9 .0 9 2 .10*0 .14 3 .2 2 f 1 .2 0 5 5 .6 2 .0 8 f 0 .3 4 1 .77*0 .31 9 .2 0
I
0 .1 5 f 0 .0 6 0 .2 8 zk 0 .7 7 4 .0 0 .2 2 0 .0 0 7 .7 3 1 .4 8 + 0 .1 3 1 .96* 1 .2 1 3 8 .9 0 .8 8 f 0 .2 7 0 .8 5 It 0 .2 3 1 0 .5 0
‘T o ta l u r a n i u m ca lcu la ted by m u l tip l y ing U - 2 3 5 c o n c e n trat ion by 2 5 (to a c c o u n t fo r U - 2 3 4 c o n c e n trat ion) a n d a d d i n g U - 2 3 8 c o n c e n trat ion.
bA l l s a m p l e s w e r e decay-cor rec ted to s a m p l e co l lec t ion d a te (g/91). Uncer ta in t ies represen t th e 9 5 % c o n fid e n c e level , b a s e d on ly o n c o u n tin g statistics. ‘refer to F igures 1 7 th r o u g h 1 9 . ‘S a m p l e s cons is ted o f th e to p two inches o f s e d i m e n t. S o m e d e e p e r s a m p l e s w e r e co l lec ted a n d a re l abe led S C . T h e d e e p e r s a m p l e s w e r e e i ther s ix o r twe lve i nches d e e p . T h e twe lve inch d e e p s a m p l e s w e r e spl i t in to a to p s a m p l e a n d a b o tto m s a m p l e .
C o m b u s t m n E n g m c c r m g S a c . July 30, 1 9 % 4 3 h \e r~~pLeporu \w1ndsor \w lndsor .00 : ,
--... _ _ _ - ---.

TABLE 8
,-
I-
,-
‘-
I-
.-
ISOTOPIC URANIUM CONCENTRATIONS IN SITE BROOK SEDIMENT SAMPLES (KAPL) COMBUSTION ENGINEERING SITE
WINDSOR, CONNECTICUT
KAPL IIYd Sample ID Uranium Concentration (pCi/g)
U-238 U-235 % U-235
U-234 Total U” Enrichmen
Sll 39osoo9 4.53 f 0.45b 0.26 f 0.10 5.41 f 0.51 10.2 1 0.69 f 0.89
s17 39oso14 4.00 f 0.4 1 0.67 f 0.15 15.4 * 1.2 20.0 1.3 * 2.54
s19 39OSO16 11.1* 1.1 3.58 * 0.54 92.3 i 6.7 106.9 6.8 f 4.80
s21 39OSO18 5.30 f 0.53 0.55*0.15 12.9 * 1.1 18.8 1.2 f 1.59
s29 39oso24 4.49 * 0.65 4.11 *0.67 93.6 i 7.4 102.2 f 7.4 12.46
s30 39oso25 5.51 f 0.69 3.13 *0.53 84.0 f 6.2 92.6 * 6.2 8.12
s31 39OSO26 0.26 f 0.09 0.11 f 0.07 3.31 *to.41 3.68 f 0.42 6.17
s34 39OSO28 3.83 * 0.54 6.97 f 0.85 204 f 14 215 * 14 22.02
s37 39oso3 1 2.50 f 0.30 1.65 * 0.25 47.7 f 3.3 51.8*3.3 9.30
s40 39oso34 0.69 f 0.13 0.08 f 0.05 3.llItO.34 3.88 f 0.37 1.77
s41 39oso35 3.64 * 0.52 3.05 f 0.5 1 79.2 f 6.2 85.9 f 6.2 11.52
s50 39oso44 1.83 * 0.23 0.20 f 0.07 3.11 f 0.32 5.14 * 0.40 1.67
s54 39OSO48 1.54 * 0.3 1 2.27 f 0.42 66.8 f 5.0 70.6 *5.1 18.62
s70 39OSO64 6.9 f 1.6 4.95 1.3 132* 18 143 * 18 9.84
S88 39OSO8 1 1.01 *0.16 0.18 f 0.07 2.99 l 0.32 4.17 f 0.37 2.70
s105 ) 39OSO98 1 4.27*0.55 1 3.04*0.49 1 86.6i5.9 1 93.9i6.0 1 9.96
S106 39oso99 2.64 f 0.45 1.83 * 0.40 39.4*3.1 43.8 i3.2 9.73
s107 390s 100 0.35 f 0.09 0.10 f 0.06 1.93 f 0.24 2.38 f 0.26 4.26
SC42B 390s 106 0.53 f 0.12 0.07 * 0.05 0.91 f 0.16 1.51 * 0.21 2.01
SC6 39OS116 3.16 f 0.36 0.19 f 0.08 4.23 f 0.45 7.58 f 0.58 0.93
S28 39os119 1.56*0.76 9.4 f 2.2 234 f 25 245 f 25 48.16
s75 1 39os121 1 11.1*3.0 35.6 f 6.5 1040* 110 1080*110 1 33.19
Total uranium concentrations based on sum of U-234, U-235, and U-238 concentrations. ‘- bTJncertainties represent the 95% confidence level, based only on counting statistics.
‘Xefer to Figures 17 through 19. dSamples consisted ofthe top two inches of sediment. Some deeper samples were collected and are labeled SC. The deeper
Ye samples were either six or twelve inches deep. The twelve inch deep samples were split into a top sample and a bottom sample.
.- Combustion Engmeermg Site - July 30. 1996 44 h \esMpLepo~\wlndsor~~lndsor 002

TABLE 9
,-
,-
.-
I”..
a-
.-
*-
SAMPLES COLLECTED BY ARGONNE NATIONAL LABORATORY AT THE
COMBUSTION ENGINEERING SITE” WINDSOR, CONNECTICUT
Sample Numberb
1
2
Matrix
Soil
Soil
Uranium Concentration (pCi/g)
U-238 U-235 U-234
0.375 f 0.024 NaturaY 0.375 f 0.024
0.506 f 0.018 Natural 0.506 f 0.018
% U-235 Enrichment
Natural
Natural
3 Soil 0.435 f 0.044 1.670* 0.170 59.2 f 6.0 37*7
4 Soil 3.67 f 0.39 20.0 1.0 l 774io 46i6
Water (Suspended solids) 1.56 f 0.06 0.017 f 0.003 2.70 f 0.10 0.2 * 0.1
6 Sediment 0.657 * 0.069 0.159 * 0.021 5.85 f 0.61 3.6* 0.9
7 Water 0.110 f O.OOgd 0.005 f O.OOld 0.160 f O.OOgd 0.7 * 0.1
1 8 I Sediment I 2.01 * 0.20 1 0.774* 0.077 1 30.1* 3.0 1 6*1 I
9 Sediment 3.97io.15 1.96*0.11 63.3 i 0.6 7.1 f 0.6
10 Sediment 0.395 i 0.032 0.154 f 0.020 6.03 f 0.13 5.7* 1
11 Water 0.130*0.011d 0.022 * 0.004d 0.752 A 0.022d 2.5 * 0.8
12 Soil 0.325 f 0.030 0.054 f 0.012 2.24 f 0.08 2.4 * 0.7
I 13 I Soil I 0.395 f 0.040 l 0.17 f 0.03 1 6.1OiO.34 I 6*2 I
14 Organic Soil 1 l.O* 0.6 147i2 549oi 10 68*4
15 Soil 0.543 * 0.048 2.13 iO.10 73.5 f 0.6 38i4
16 I Water and Sludge I 0.886 f 0.069 1 0.249 f 0.036 I 9.19io.40 4*1 I “From ANL,May 1996 Report-Estimation ofUranium and Co-60 Distribution Coefficients and Uranium-235 Enrichment at the Combustion Engineering Company Site in Windsor, Connecticut.
‘Xefer to Figures 20 and 2 1. “Natural uranium has 0.007 U-235 by mass total uranium. dUnits are in pCiL
Combustmn Engmeermg Site. July 30. 1996 45 h \cssJpLcpons\windsor\wln~or.~~
- _I__ . . .-

.-
.-
1-
.-
I-
.-
*-
I-
REFERENCES
Argonne National Laboratory (ANL1996). Estimation of Uranium and Co-60 Dis tribution Coeffic ients and Uranium-235 Enrichment at the Combustion Engineering Company Site in W indsor, Connecticut, Argonne, IL; May 1996.
Oak Ridge Ins titute for Science and Education (ORISE). Designation Survey Plan for the Combustion Engineering Site, W indsor, Connecticut. Oak Ridge, TN; November 12, 1993.
?ak Ridge Ins titute for Science and Education (ORISE). Designation Survey Combustion Engineering Sate, W indsor, Connecticut. Oak Ridge, TN; April 1994.
U.S. Department of Energy (USDOE). Radiation Protection of the Public and the Environment. DOE Order 5400.5. W ashington, D.C.; February 8, 1990.
U.S. Department ofEnergy, memorandum from A. W illiams to file, “Tentative Authority Determination - Combustion Engineering Site, W indsor, Connecticut,” June 22, 1993.
Combustion Engmeermg Site - July 30, 19% 46 h \crsnpLepo~~\windsor\u,ln~or 002

APPENDIX A
MAJOR INSTRUMENTATION
Combutmn Engincermg Site - July 30. 1996 h \essap\reporis\wlndsor\winLor.00? I-
~--. _ l_ l l “-. -- ___- -. ._

.-
_I
.-
.I
.a
.-
.-
*“m
^I
APPENDiX A
MAJOR INSTRUMENTATION
The display of a specific product is not to be construed as an endorsement of the product or its manufacturer by the author or their employers,
LABORATORY ANALYTICAL INSTRUMENTATION
Alpha Spectrometry System Tennelec Electronics Model (Tennelec, Oak Ridge, TN) Used in conjunction with: Surface Barrier and Ion Implanted Detectors (Canberra, Meriden, CT and Tennelec, Oak Ridge, TN) and Multichannel Analyzer 3 100 Vax Workstation (Canberra, Meriden, CT)
High Purity Extended Range Intrinsic Detectors Model No: ERVDS30-25 195 (Tennelec, Oak Ridge, TN) Used in conjunction with: Lead Shield Model G-l 1 (Nuclear Lead, Oak Ridge, TN) and Multichannel Analyzer 3 100 Vax Workstation (Canberra, Meriden, CT)
High-Purity Germanium Detector Model GMX-23 195-S 23% Eff (EG&G ORTEC, Oak Ridge, TN) Used in conjunction with: Lead Shield Model G- 16 (Gamma Products, Palos Hills, IL) and Multichannel Analyzer 3 100 Vax Workstation (Canberra, Meriden, CT)
Low Background Gas Proportional Counter Model LB-5 100-W (Oxford, Oak Ridge, TN)
Combustion Engmeermg Sik - July 30, 1996 A-l h \cssap’veports\wmdror’ wmdsor.00~

,-
*-
,-
APPENDIX B
ANALYTICAL PROCEDURES
Combwion Engmecring Sk - July 30, 1996

“-
I-
.-
. . . m
)-
I-
,*-
A P P E N D IX B
A N A L Y T ICAL P R O C E D U R E S
S a m p l e s o f so l id m a ter ia ls (soi l , s e d i m e n t, debr is , res idues, a n d const ruct ion m a ter ia l ) w e r e dr ied, m ixed, c rushed, a n d /o r h o m o g e n i z e d as necessary , a n d a por t ion sea led in a O S -l i ter Mar ine l l i b e a k e r o r o the r appropr ia te c o n ta iner . T h e q u a n tity p l aced in th e b e a k e r w a s c h o s e n to r e p r o d u c e th e ca l ib ra ted c o u n tin g g e o m e try. N e t m a ter ia l w e i g h ts w e r e d e te r m i n e d a n d th e s a m p l e s c o u n te d us ing intr insic g e r m a n i u m d e tectors c o u p l e d to a pu l se h e i g h t ana lyze r system. B a c k g r o u n d a n d C o m p to n st r ipping, p e a k search, p e a k i d e n tif ication, a n d c o n c e n trat ion ca lcu la t ions w e r e pe r fo rmed us ing th e c o m p u ter capabi l i t ies inheren t in th e ana lyze r system. A ll p h o to p e a k s assoc ia ted wi th th e rad ionuc l ides o f conce rn w e r e rev iewed fo r cons is tency o f activity. E n e r g y p e a k s u s e d fo r d e te rm in ing th e act iv i t ies o f rad ionuc l i des o f conce rn w e r e :
C o - 6 0 1 .1 7 3 M e V a n d 1 .3 3 2 M e V U - 2 3 5 0 .1 4 3 M e V or 0 .1 8 6 M e V
U - 2 3 8 0 .0 6 3 M e V or 0 .0 9 3 M e V f rom Th-234*
*Secu la r equ i l i b r ium a s s u m e d . S p e c tra w e r e a lso rev iewed fo r o the r i d e n tifia b l e p h o to p e a k s .
Soi l , s e d i m e n t a n d m isce l laneous s a m p l e s w e r e c rushed, h o m o g e n i z e d a n d ana l yzed fo r isotop ic u r a n i u m . S a m p l e s w e r e d isso lved by p o tass ium fluo r i de a n d pyrosu l fa te fus ion a n d th e e l e m e n ts o f interest w e r e prec ip i ta ted wi th b a r i u m sulfate. B a r i u m sul fate prec ip i ta te w a s red isso lved a n d th e speci f ic e l e m e n ts o f interest w e r e ind iv idua l ly s e p a r a te d by l iqu id- l iqu id ext ract ion a n d re-prec ip i ta ted wi th a ce r i um fluo r i de carr ier . T h e prec ip i ta te w a s th e n c o u n te d us ing sur face bar r ie r a n d i on imp lan ted d e tectors (Oxford a n d Canber ra ) , a l p h a spec t rometers (Tenne lec a n d Canber ra ) , a n d a m u l t i channe l ana lyze r (Canber ra ) .
N I C K E L - R E A N A L Y S E S
Nicke l w a s s e p a r a te d f rom th e in ter fer ing t ransi t ion e l e m e n ts by a n a n i o n e x c h a n g e c o l u m n te c h n i q u e a n d th e n w a s e lu ted wi th 8 M HCl wh i le zinc, cobal t , m a n g a n e s e a n d i ron r e m a i n a b s o r b e d . Fur ther pur i f icat ion w a s ach ieved us ing th e h igh ly speci f ic d i m e thy l g l yox ime ( D M G ) prec ip i ta t ion in a s l ight ly
Combus t ion Eng inee r i ng S i te _ July 30. 1 9 9 6 B -l h. \essap\ lcporu\wrndsor \windror .002
- . -_ * .s -_- -

.-
.-
alkaline media followed by extraction in chloroform. The nickel was then back extracted in 1M HC 1 and the chemical recovery was quantitated using spiked duplicates. Ni-63 activity was then determined using a liquid scintillation counter.
UNCERTAINTIES AND DETECTION LIMITS
The uncertainties associated with the analytical data presented in the tables of this report represent the 95% confidence level for that data. These uncertainties were calculated based on both the gross sample count levels and the associated background count levels. Additional uncertainties, associated with sampling and measurement procedures, have not been propagated into the data presented in this report.
When the activity was determined to be less than the MDC of the measurement procedure, the result was reported as less than MDC. Because of variations in background levels, measurement efficiencies, the detection limits differ from sample to sample and instrument to instrument.
x-
CALIBRATION AND QUALITY ASSURANCE
Analytical and field survey activities were conducted in accordance with procedures fi-om the following documents of the Environmental Survey and Site Assessment Program:
l Survey Procedures Manual, Revision 7.1 (September 1993) l Laboratory Procedures Manual, Revisions 8 and 9 (September 1993 and January 1995) l Quality Assurance Manual, Revision 6 (July 1993)
The procedures contained in these manuals were developed to meet the requirements of DOE Order 5700.6C and ASMENQA-1 for Quality Assurance and contain measures to assess processes during their
performance.
Calibration of all field and laboratory instrumentation was based on standards/sources, traceable to MST, when such standards/sources were available. In cases where they were not available, standards of an industry recognized organization were used.
“..
Combustion Engineering Site - July 30. 1996 B-2 h \esssp\rcprts\wlndsor\windsor 002

Quality control procedures include:
l Daily instrument background and check-source measurements to confirm that equipment operation is within acceptable statistical fluctuations.
l Participation in EPA and EML laboratory Quality Assurance Programs.
l Training and certification of all individuals performing procedures.
l Periodic internal and external audits.
1-
/-
.-
e.. .
^-
.a
aI
^m.
*-
w . .
..- Combustion Engmeermg Site _ July 30, 1996 B-3 h \csr*lp\reports\w~ndsor\w~ndsor 002
-~--_ x..