designing adaptive, diagnostic math assessments for ... · designing adaptive, diagnostic math...
TRANSCRIPT
Designing Adaptive, Diagnostic Math Assessments for Individuals With and Without Visual Disabilities
January 2006 RR-06-01
ResearchReport
Valerie J. Shute
Edith Aurora Graf
Eric G. Hansen
Research & Development

Designing Adaptive, Diagnostic Math Assessments for
Individuals With and Without Visual Disabilities
Valerie J. Shute, Edith Aurora Graf, and Eric G. Hansen
ETS, Princeton, NJ
January 2006

As part of its educational and social mission and in fulfilling the organization's nonprofit charter
and bylaws, ETS has and continues to learn from and also to lead research that furthers
educational and measurement research to advance quality and equity in education and assessment
for all users of the organization's products and services.
ETS Research Reports provide preliminary and limited dissemination of ETS research prior to
publication. To obtain a PDF or a print copy of a report, please visit:
http://www.ets.org/research/contact.html
Copyright © 2006 by Educational Testing Service. All rights reserved.
ETS and the ETS logo are registered trademarks of Educational Testing Service.

Abstract
This report summarizes the design and development of an adaptive e-learning prototype for
middle school mathematics for use with both sighted and visually disabled students. Adaptation
refers to the system’s ability to adjust itself to suit particular characteristics of the learner. The
main parts of the report describe the system’s theoretical foundation, architecture, models, and
adaptive algorithm. We also review approaches for making assessment systems accessible to
students with visual disabilities. Finally, we conclude with a summary of upcoming studies in
relation to important research questions concerning micro- and macroadaptation. Using a design
approach like the one described in this report may set a new precedent for environments that
adapt to support student learning based on larger sets of incoming abilities and disabilities than
have been considered previously.
Key words: Accessibility, Bayesian networks, diagnostic assessment, evidence-centered design,
evidence model, mathematics cognition, macroadaptation, microadaptation, proficiency model,
student model, summative assessment, task model
i
Acknowledgments
This material is based upon work supported by the National Science Foundation under Grant No.
0313202. A version of this report appears as a book chapter with the following citation:
Shute, V. J., Graf, E. A., & Hansen, E. (2005). Designing adaptive, diagnostic math assessments
for sighted and visually-disabled students. In L. PytlikZillig, R. Bruning, & M.
Bodvarsson (Eds.), Technology-based education: Bringing researchers and practitioners
together. Greenwich, CT: Information Age Publishing.
1 The authors would like to acknowledge the various and substantial contributions
to the Adaptive Content for Evidence-Based Diagnosis (ACED) project by Larry Casey, Russell
Almond, David Williamson, Steve Landau, Jody Underwood, Peggy Redman, Malcolm Bauer,
Robert Mislevy, Daniel Eignor, Buz Hunt, Christy Lyon, Kim Fryer, Sarah Ohls, and Richard
Holborow. In addition, we are grateful for the contributions from the New Jersey middle school
math teachers who assisted us with content issues.
ii

Table of Contents 2 Page
Project Overview ............................................................................................................................ 1
Motivation for Focusing on Mathematics....................................................................................... 2
Theoretical Foundation of the Research .................................................................................. 3
Microadaptation....................................................................................................................... 7
Macroadaptation ...................................................................................................................... 7
General ACED Architecture ........................................................................................................... 8
Evidence-Centered Design (ECD)........................................................................................... 9
Student Model........................................................................................................................ 10
Evidence Model ..................................................................................................................... 11
Tasks and Task Models ......................................................................................................... 12
Adaptive Algorithm............................................................................................................... 13
Specific ACED Models................................................................................................................. 15
Domain Analysis ................................................................................................................... 16
Domain Modeling.................................................................................................................. 17
ACED Evidence Model ......................................................................................................... 19
ACED Task Model ................................................................................................................ 22
Item Models and Automatic Item Generation in ACED ....................................................... 22
Macroadaptation in ACED ........................................................................................................... 24
Audio and Tactile Accommodations ..................................................................................... 25
The Talking Tactile Tablet (TTT) ......................................................................................... 26
A Recent Study of the Talking Tactile Tablet ....................................................................... 27
Summary and Future Directions ................................................................................................... 28
References..................................................................................................................................... 30
Notes ............................................................................................................................................. 35
iii
List of Tables
Page
Table 1. Alignment of Adaptation Type by Learner/System Feature............................................ 8
Table 2. Example Descriptions of Proficiencies Used in the ACED System Prototype ............. 20
Table 3. Evidence Rules Specified for Two Sample Proficiencies, at Each Level
of Mastery ................................................................................................................ 21
Table 4. An Example of an Item Model and Two Items, Simplified From a Real
ACED Model ........................................................................................................... 24
iv

List of Figures
Page
Figure 1. Example of a simple linear graph................................................................................... 5
Figure 2. Simplified ECD framework.......................................................................................... 10
Figure 3. The four-process model. ............................................................................................... 16
Figure 4. The student model used in ACED (Graf, 2003). .......................................................... 19
Figure 5. Overlay example for Talking Tactile Tablet. ............................................................... 27
v

We cannot direct the wind but we can adjust the sails. —Anonymous
The broad purpose of the research described in this report is to provide a foundation and
framework for the design of adaptive programs that will be accessible to students with
disabilities and will help all students learn better. We chose middle school mathematics as the
initial content area for the research because of its particular challenges. Starting in middle school,
U.S. students are less likely to master the material, and the content becomes both more visual (as
students learn to interpret and construct graphs) and more abstract (as students learn to interpret
and represent algebraic expressions). The increasingly visual nature of the content provides a
distinct disadvantage for students who are interested in math but have visual disabilities. New
technologies provide opportunities to improve accommodations in instruction and assessment for
students with visual disabilities.
This report begins with an overview of our National Science Foundation (NSF) funded
project, which focuses on ways to improve mathematics understanding and performance for
middle school students, especially those with visual disabilities. The overview includes the
motivation for and theoretical foundation of our research, along with a brief description of two
kinds of adaptation. Next, we describe the general architecture, or assessment design framework,
underlying our prototype system. This is followed by a more detailed description of the various
models in the system, which include student, evidence, and task models. We conclude the system
description with a summary of an adaptive algorithm we are using to select appropriate content
to present to a particular learner. Following the system description, we review approaches for
making assessment systems accessible to students with visual disabilities, focusing on a
particular technology solution. Finally, we end with a summary of our upcoming studies in
relation to important research questions.
Project Overview
We have just completed the first year of a 3-year NSF research grant that will evaluate
the benefits of adaptation1 on learning outcome, efficiency, and enjoyment. The culmination of
our first-year efforts is an e-learning2 prototype system called ACED (Adaptive Content for
Evidence-based Diagnosis). ACED is a diagnostic system that applies an evidence-centered
design (ECD) approach for task3 development. It also uses an adaptive algorithm for task
selection. This system provides assessment services, adaptive e-learning, and diagnostic reports
at various levels, from general/coarse to more specific/refined in terms of the construct under
1
examination. For example, a more general (coarse-grain) construct is “understands sequences as
patterns,” and a more specific (finer-grain) one is “can generate a recursive rule for a geometric
sequence.”
Currently, ACED delivers eighth-grade mathematics content related to sequences as
patterns. The content covers arithmetic, geometric, and other simple progressions and includes a
large pool of diagnostic assessment tasks that are designed to target student misconceptions. We
envision that teachers will use the system in the classroom to assess student understanding of this
portion of the eighth-grade mathematics curriculum. For instance, teachers might use the system
in the middle of the unit to gauge student progress and/or at the conclusion of instruction for
summative purposes. Students will eventually be able to use the system at home to further
support learning.
During the past year, we focused our design and development efforts on building the
system—its architecture, assessments, and adaptive capabilities. In addition, we have sought to
ensure that alteration of the system to accommodate visual limitations neither invalidates nor
renders ineffective the assessment and learning of the content. Before going into details about the
ACED system, we first provide the motivation for choosing middle school mathematics as the
subject area and grade level, followed by the theoretical foundation of the prototype system.
Motivation for Focusing on Mathematics
In the United States, student difficulties in mathematics seem to emerge in middle school.
For example, the Trends in International Mathematics and Science Study (TIMSS) results
indicate that U.S. fourth graders perform above the international average in mathematics
(National Center for Educational Statistics, 2001; Office of Educational Research and
Improvement [OERI], 2001). However, U.S. eighth-grade students perform at or below the
international average; by the end of high school, U.S. students perform far below the
international average (International Study Center at Boston College, 1998; OERI). This
downward trend suggests that once they have covered arithmetic, U.S. students are not
progressing as quickly in math as students in many other industrialized nations. In order to
address the difficulties where they appear to begin, we decided to develop the ACED content
around eighth-grade level mathematics material. We now turn our attention to the theoretical
foundation of the research and how it informed the system design.
2

Theoretical Foundation of the Research
Our ACED prototype was built on the premise that actively solving problems and
receiving timely, diagnostic feedback enhances student learning. We also believe that presenting
alternative representations of the same concept (in tasks, examples, and so forth) can often
augment comprehension as well as accommodate various disabilities. Finally, we believe that
adjusting learning environments and/or content to suit student needs can substantially improve
learning. Each of these will now be discussed in more detail.
Timely, diagnostic feedback. By the time the results of high-stakes accountability tests are
disseminated, it is often too late to effect change in the classroom to address weak areas or
misconceptions. ACED tasks have been constructed to not only provide feedback about the
correctness of the response, but also to provide guidance on areas of misconception. Consider the
following ACED-like task, which asks the student to find the common difference in an
arithmetic sequence: 4, 7, 10, 13. Suppose the student types in 16 as the answer. The diagnostic
feedback says, “Nice try, but incorrect. You typed the next number in the sequence, but you
should have typed in the common difference, which is 3.” This kind of feedback across multiple
tasks can help students overcome procedural errors and areas of misconceptions. Furthermore,
summary data provided to the teacher can allow him or her to modify the instructional approach
and suggest further work for the student based on problem areas. The feedback can thus be used
by students to guide self-study and by teachers to guide instruction. Over the long term, such an
approach should help students understand the material better and improve their performance on
high-stakes tests (Mory, 2004).
Content transformation and meaning equivalence. When transforming content from one
format (e.g., pictorial to another such as auditory), it is important to provide representations that
convey the same meaning. This is to ensure that no student is unfairly advantaged or
disadvantaged because of the format of the assessment task. The notion of providing equivalent
representations is central to the requirement of the World Wide Web Consortium’s (W3C) Web
Content Accessibility Guidelines that Web content authors provide text equivalents, sometimes
called “text descriptions,” for nontext content (images, audio, video, animations; Chisholm,
Vanderheiden, & Jacobs, 1999; see also IMS Global Learning Consortium, 2002).
Text equivalents are important because they can be rendered in several different ways,
including as visually displayed text, audio, and braille. Furthermore, audio presentation may be
carried out by having the text description read aloud via a live reader, prerecorded audio, or
3
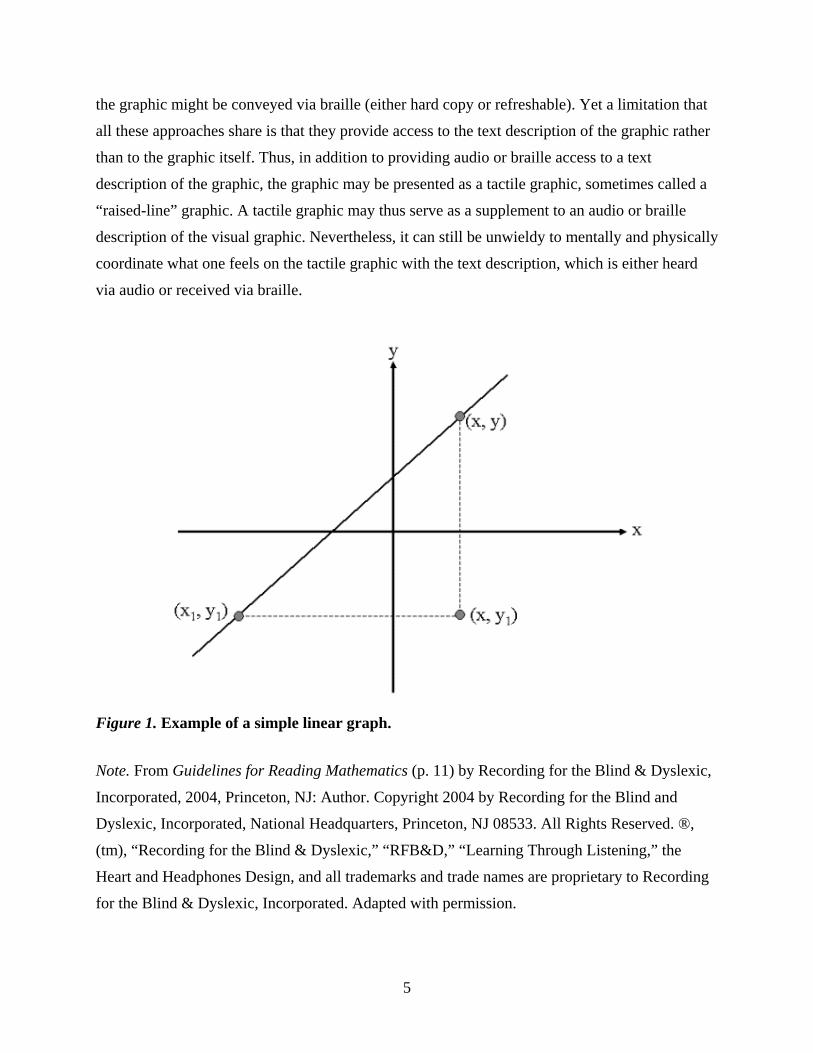
synthesized speech. Consider the use of a text description rendered in audio to convey the
meaning of a graph (visual) for a person who is blind. It has been noted that, “A picture is worth
a thousand words” (attributed to Napoleon Bonaparte). However, this can pose a real problem for
individuals who are blind. For example, an extended audio stream interpretation of a complex
graphic may exceed certain of the test taker’s cognitive capacities. See Figure 1, which shows a
simple linear graph from Recording for the Blind and Dyslexic [RFB&D] (2004). The text
equivalent of this graph is as follows:
This figure shows a straight line drawn on a two-axis system, with a horizontal axis
labeled X and a vertical axis labeled Y. All four quadrants are shown. The line begins in
the third quadrant and moves upward and to the right; it crosses the negative X-axis,
passes through the second quadrant, crosses the positive Y-axis, and ends in the first
quadrant. Three points are shown, two on the line and one in the fourth quadrant. The
point on the line in the first quadrant is labeled X, Y; the point on the line in the third
quadrant is labeled X-sub-one, Y-sub-one. The point in the fourth quadrant is labeled X,
Y-sub-one. In addition, two dashed line segments are shown, one that drops vertically
from the point X, Y and connects it to the point X, Y-sub-one and one that moves
horizontally to the right from the point X-sub-one, Y-sub-one and connects it to the point
X, Y-sub-one. This forms a right triangle with the solid line as a hypotenuse, the
horizontal dashed line as base, and the vertical dashed line as side. (p. 11)4
Imagine how many words would be needed if axes were numbered, and it was a
nonlinear relationship. Such complicating factors would make the graph all the more difficult to
communicate.
Navigating back and forth within the audio presentation can be cumbersome, whether the
student must ask a live reader to repeat portions of the presentation or navigate a prerecorded
audio presentation from an audiocassette. Some improvements might be obtained through a
synthesized speech rendition of the text description and by allowing the student to control the
rate of speech and to navigate through the content in different ways (e.g., sentence by sentence,
or word by word). A prerecorded audio presentation might similarly be an improvement over
audiocassette if it provides similar navigation capabilities, such as through digital talking book
technology (DAISY Consortium, 2004). If the student reads braille, then the text description of
4
the graphic might be conveyed via braille (either hard copy or refreshable). Yet a limitation that
all these approaches share is that they provide access to the text description of the graphic rather
than to the graphic itself. Thus, in addition to providing audio or braille access to a text
description of the graphic, the graphic may be presented as a tactile graphic, sometimes called a
“raised-line” graphic. A tactile graphic may thus serve as a supplement to an audio or braille
description of the visual graphic. Nevertheless, it can still be unwieldy to mentally and physically
coordinate what one feels on the tactile graphic with the text description, which is either heard
via audio or received via braille.
Figure 1. Example of a simple linear graph.
Note. From Guidelines for Reading Mathematics (p. 11) by Recording for the Blind & Dyslexic,
Incorporated, 2004, Princeton, NJ: Author. Copyright 2004 by Recording for the Blind and
Dyslexic, Incorporated, National Headquarters, Princeton, NJ 08533. All Rights Reserved. ®,
(tm), “Recording for the Blind & Dyslexic,” “RFB&D,” “Learning Through Listening,” the
Heart and Headphones Design, and all trademarks and trade names are proprietary to Recording
for the Blind & Dyslexic, Incorporated. Adapted with permission.
5
Clearly, there are many opportunities to make graphical mathematics content more
accessible and more usable to individuals who are blind. As discussed later, this project explores
a promising avenue for enhancing the accessibility and usability of graphical content.
Aptitude-treatment interactions (ATI). The third theoretical premise underlying ACED
emphasizes our general quest, which is to explore innovative ways to improve mathematics
learning for all students—both sighted and visually impaired. However, it is unlikely that a one-
size-fits-all approach will optimize learning for all students, since the pictures that are so useful
for sighted students may not even be perceptible to their visually impaired counterparts. Thus,
aptitude-treatment interaction (ATI) research is relevant. In this research, aptitude is broadly
defined as any individual characteristic that accounts for the level of student performance in a
given environment, and treatment refers to the variations in the pace, format, or style of
instruction (see Cronbach & Snow, 1977). This research suggests that different treatments may
be more or less suited to different combinations of student characteristics. For example, if we
know a person has visual problems but can hear adequately, and we have equivalent content in
both visual and auditory formats, the ATI recommends delivering the content in the auditory
format for that person. Again, the general purpose of our research is to customize instructional
content to match different learner characteristics.
There are basically two main ways to customize content—in terms of what to present
(microadaptation) and how to best present it (macroadaptation). As previously noted, in broad
terms, adaptation refers to the customization of instructional material (e.g., content selection,
sequencing, and format) to suit different student characteristics. This has been a fairly elusive
goal among educators for some time (e.g., Bloom, 1968; 1984; Cronbach & Snow, 1977; Tobias,
1994). Recent advances in cognitive science and technology are making it more attainable,
however (e.g., Shute, Lajoie, & Gluck, 2000). For example, technology has advanced to the point
where we can begin to implement laboratory-based adaptive instructional techniques on the
Internet (e.g., differential sequencing of content depending on learners’ needs).
The power of e-learning comes from the wide range of capabilities that technologies
afford. One capability is the design and development of assessments and instructional content
that adapts to learners’ needs and/or preferences. Other effective technology interventions
include simulations of dynamic events, extra practice opportunities on emergent skills, and
alternative multimedia options—particularly those that allow greater access for individuals with
disabilities. More details on customization via micro- and macroadaptation are provided next.
6
Microadaptation
One way that content can be customized is through what is called microadaptation, the
real-time selection of content in response to a learner’s inferred knowledge and skill state.
Microadaptation occurs during the learning process and is sometimes referred to as domain-
dependent adaptation. According to the theoretical perspective that supports the use of
microadaptation (see Table 1), decisions about content selection should be made based on
performance and subsequent inferences of students’ knowledge and skill states, compared with
the level they should have achieved when instruction is complete. For instance, suppose a student
incorrectly solved a rather difficult assessment task relating to a particular concept or skill.
Several options may be indicated, such as presenting new instructional material on the concept or
administering a slightly easier assessment task that taps the same proficiency, to see the extent of
the problem. Alternatively, additional practice or remedial instruction may be warranted. When it
seems the student has mastered a given topic, he or she is guided to a new part of the curriculum.
Macroadaptation
Another approach to adapting content is through macroadaptation—the customization of
content in line with more stable learner qualities, such as cognitive or perceptual abilities. In
contrast with microadaptation, macroadaptive decisions are domain-independent and based on
learner information that is usually, but not always, collected before instruction begins (see Shute,
1993; Snow, 1992, for more on this topic). Macroadaptation relates to decisions about the format
and/or sequence of the content presented to the learner. Relevant learner information (e.g.,
cognitive, perceptual, personality, or learning style) is initially collected from the student.
Subsequently, these data are used to make informed decisions regarding the type of content or
instructional environment best suited to the individual. For a review of some specific
macroadaptive examples from the literature, see Shute et al. (2000).
The two forms of adaptation are not necessarily incompatible and may, in fact, improve
learning even more when combined. Microadaptation is typically applied to the problem of what
to present and when to present it, while macroadaptation is applied to the issue of how it should
be presented. Regarding the former, we use a microadaptive algorithm intended to select the
assessment task that provides the most information about a particular learner at any point in time.
Regarding the latter, we have identified a promising assistive technology (macroadaptation) to
present math content to students with visual disabilities. Both will be discussed in more detail
7
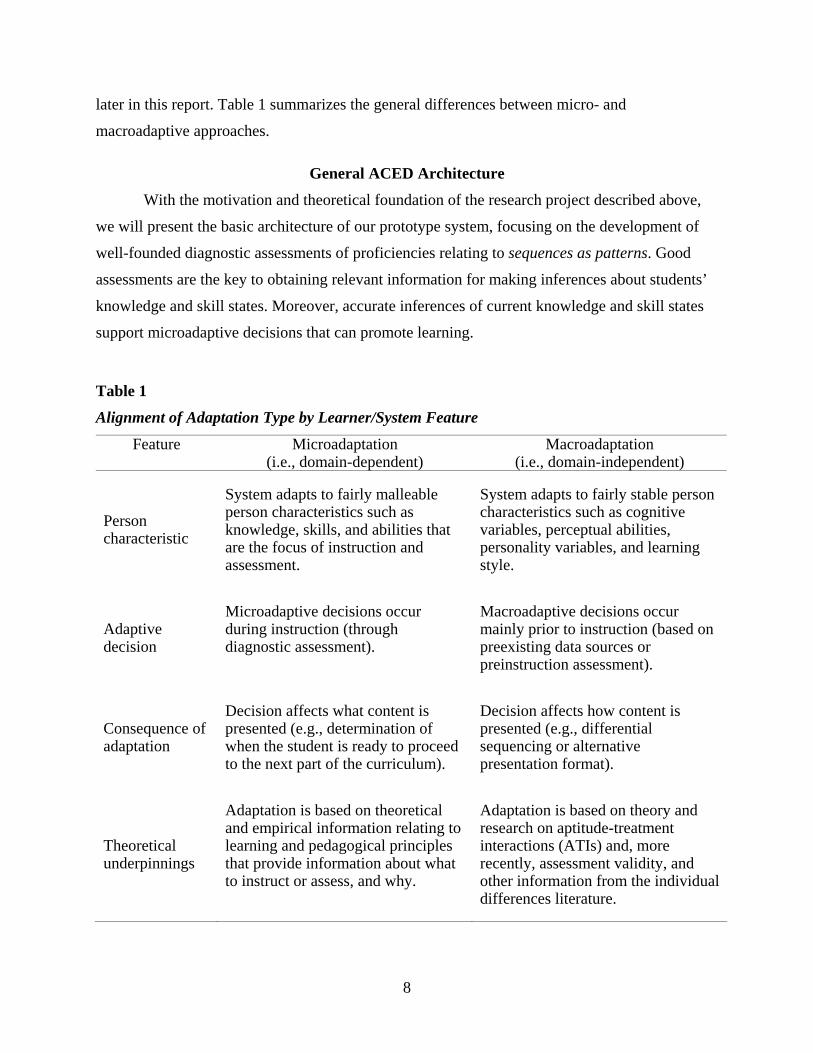
later in this report. Table 1 summarizes the general differences between micro- and
macroadaptive approaches.
General ACED Architecture
With the motivation and theoretical foundation of the research project described above,
we will present the basic architecture of our prototype system, focusing on the development of
well-founded diagnostic assessments of proficiencies relating to sequences as patterns. Good
assessments are the key to obtaining relevant information for making inferences about students’
knowledge and skill states. Moreover, accurate inferences of current knowledge and skill states
support microadaptive decisions that can promote learning.
Table 1
Alignment of Adaptation Type by Learner/System Feature
Feature Microadaptation (i.e., domain-dependent)
Macroadaptation (i.e., domain-independent)
Person characteristic
System adapts to fairly malleable person characteristics such as knowledge, skills, and abilities that are the focus of instruction and assessment.
System adapts to fairly stable person characteristics such as cognitive variables, perceptual abilities, personality variables, and learning style.
Adaptive decision
Microadaptive decisions occur during instruction (through diagnostic assessment).
Macroadaptive decisions occur mainly prior to instruction (based on preexisting data sources or preinstruction assessment).
Consequence of adaptation
Decision affects what content is presented (e.g., determination of when the student is ready to proceed to the next part of the curriculum).
Decision affects how content is presented (e.g., differential sequencing or alternative presentation format).
Theoretical underpinnings
Adaptation is based on theoretical and empirical information relating to learning and pedagogical principles that provide information about what to instruct or assess, and why.
Adaptation is based on theory and research on aptitude-treatment interactions (ATIs) and, more recently, assessment validity, and other information from the individual differences literature.
8
This section begins with an overview of ECD (e.g., Mislevy, Steinberg, & Almond,
2003), a framework that consists of three theoretical models that work in concert. The models
represent inferences about what a student knows and does not know, based on evidence or
performance data from assessment tasks. Later in the report, we will present the models as they
have been developed for ACED.
Evidence-Centered Design (ECD)
The architecture underlying the ACED diagnostic assessment system is ECD, developed
by Mislevy and colleagues (e.g., Mislevy, Almond, Yan, & Steinberg, 1999; Mislevy et al.,
2003). In general, ECD is an attempt to obtain clear answers to three basic assessment questions:
(a) What do you want to say about persons taking the assessment? (b) What observations
(behaviors or work products) would provide the best evidence for what you want to say? (c)
What kinds of tasks allow you to make the necessary observations or collect pertinent evidence?
For a simple illustration, suppose you wanted to measure your students’ knowledge of U.S. state
capitals. Evidence of high proficiency would be a given student correctly listing the names of all
capital cities, per state. This evidence could be obtained orally, on paper, or via computer, using
free recall or matching tasks. The ensuing score on this assessment would be interpreted in
relation to preestablished scoring rules.
To apply the ECD framework in the design of assessment tasks, a subject matter expert
(e.g., a teacher or test developer) begins by creating three models: (a) the student model, defining
the range and relationships of the knowledge and skills to be measured; (b) the evidence model,
specifying the performance data associated with this knowledge and these skills, for varying
levels of mastery; and (c) the task model, spelling out the features of task performance situations
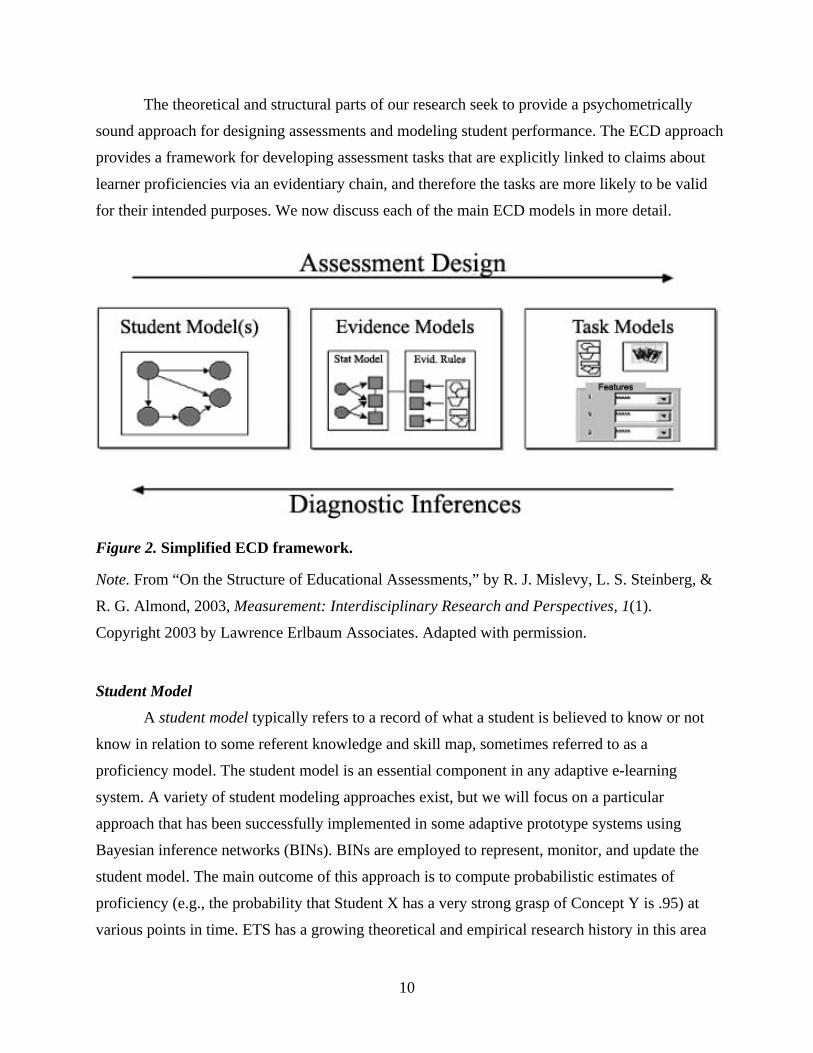
that will elicit relevant evidence. Figure 2 shows the relationships among ECD’s main models.
Assessment design flows conceptually from left to right, although in practice it is less linear and
more iterative. Conversely, diagnosis (or inference) flows in the opposite direction; that is, a
diagnostic assessment task is administered, and the action(s) that a student takes during the
solution process provides the evidence that is analyzed by the evidence model. The results of this
analysis are data (e.g., scores) communicated to the student model, which in turn updates the
relevant proficiencies. In ACED, an adaptive algorithm (not shown in Figure 2) is invoked to
select a new task to present based on the updated student model values. The cycle repeats until
the tasks are completed, time has run out, mastery has been achieved, or some other termination
criterion has been met.
9
The theoretical and structural parts of our research seek to provide a psychometrically
sound approach for designing assessments and modeling student performance. The ECD approach
provides a framework for developing assessment tasks that are explicitly linked to claims about
learner proficiencies via an evidentiary chain, and therefore the tasks are more likely to be valid
for their intended purposes. We now discuss each of the main ECD models in more detail.
Figure 2. Simplified ECD framework.
Note. From “On the Structure of Educational Assessments,” by R. J. Mislevy, L. S. Steinberg, &
R. G. Almond, 2003, Measurement: Interdisciplinary Research and Perspectives, 1(1).
Copyright 2003 by Lawrence Erlbaum Associates. Adapted with permission.
Student Model
A student model typically refers to a record of what a student is believed to know or not
know in relation to some referent knowledge and skill map, sometimes referred to as a
proficiency model. The student model is an essential component in any adaptive e-learning
system. A variety of student modeling approaches exist, but we will focus on a particular
approach that has been successfully implemented in some adaptive prototype systems using
Bayesian inference networks (BINs). BINs are employed to represent, monitor, and update the
student model. The main outcome of this approach is to compute probabilistic estimates of
proficiency (e.g., the probability that Student X has a very strong grasp of Concept Y is .95) at
various points in time. ETS has a growing theoretical and empirical research history in this area
10
(e.g., Mislevy & Gitomer, 1996; Mislevy et al., 1999; Mislevy et al., 2003). A Bayesian
approach to student modeling can be used in an e-learning system to inform microadaptive
decisions—by enabling the system to choose the “best” piece of content to present next. In the
ACED case, this is the most helpful and informative assessment task.
Evidence Model
We next describe the evidence model in relation to the observable features of students’
work products (or behaviors) that constitute evidence about proficiencies, which are represented
as nodes or variables in the student model. According to Mislevy, Steinberg, and Almond
(1999a, p. 4), evidence models attempt to answer two questions: (a) What behaviors or
performances reveal targeted proficiencies? and (b) What is the connection between those
behaviors and the student model variable(s)? Basically, an evidence model lays out the argument
about why and how the observations in a given task situation (i.e., student performance data)
constitute evidence about student model variables. For instance, what do we know about a
student’s knowledge of U.S. state capitals if she can freely recall 40 of the 50 state capitals? Is
that performance better or worse than matching 48 capitals to their appropriate state? Evidence
models help to shed light on questions like these.
There are two parts to the evidence model: (a) evidence rules, which spell out how the
results of a given performance should be extracted from (or identified in) a given work product,5
and the (b) statistical submodel, which expresses how the observable variables (squares in Figure
2) depend on, or link to, student model variables (circles in Figure 2). Evidence rules emphasize
how the student performs or responds, while statistical submodels link the extracted data back to
targeted proficiencies denoting what the student knows and how well she is believed to know it.
A given work product may yield one or potentially several observable variables. For
instance, suppose a student wrote a short essay. The essay becomes the work product for a
writing assessment task and could be evaluated in terms of various proficiencies, such as
spelling, grammar, syntax, or semantics. These proficiencies could be assessed and updated
individually or considered together as a more general writing skills proficiency. The evidence
rules, then, would differ—to focus on individual or holistic rubrics. An example of a holistic
evidence rule for highly proficient writing could be something like, The essay is clear and
concise, with perfect spelling; and no grammar, syntax, or semantic errors present.
Evidence models thus represent the conceptual glue, or evidentiary chain, between tasks
and proficiencies. Furthermore, an evidence model must share the same work-product
11

specifications as the task model. That is, what the student produces in the task situation and what
the evidence rules examine must be the same thing. We now turn our attention to the task model.
Tasks and Task Models
Tasks are the most obvious part of an assessment, and their main purpose is to elicit
evidence (observables) about proficiencies (unobservables) (see Mislevy, Steinberg, & Almond,
1999b for more on this topic). A task model provides a framework for describing the situations in
which students act, in terms of (a) the variables used to describe key features of tasks (e.g.,
content, difficulty), (b) the presentation format (e.g., directions, stimuli, prompts), and (c) the
specific work or response products (e.g., answers, work samples). As such, task specifications
establish what the student will be asked to do; what kinds of responses are permitted; what types
of formats are available; and other considerations, such as whether the student will be timed,
allowed to use tools (e.g., calculators, dictionaries, word processors), and so forth. Multiple task
models can be employed in a given assessment.
Different task models produce different tasks, which can vary along a number of
dimensions (e.g., media type and difficulty level). For example, following are three levels of
difficulty, defining three tasks, in the student model variable: “Find the common difference in an
arithmetic sequence.”
EASY—Find the common difference for the following arithmetic sequence:
1, 7, 13, 19, 25, . . . Enter your answer here _______
INTERMEDIATE—Find the common difference for the following arithmetic sequence:
0.00, 0.49, 0.98, 1.47, 1.96, . . . Enter your answer here _______
DIFFICULT—Find the common difference for the following arithmetic sequence:
0.03, 0.95, 1.87, 2.79, 3.71, . . . Enter your answer here _______
Note that the relationship between student model variables and tasks such as those listed
above is as follows: Student model variables represent the concepts or skills currently under
focus. The online manifestations of those variables are the assessment tasks with which students
interact and that elicit evidence about the variables. Thus student model variables are assessed
(and their states inferred) in relation to learners’ performance on relevant tasks.
12
Adaptive Algorithm
Having summarized the different models making up ECD, we now focus on
accomplishing adaptivity in the ACED system. As mentioned, our student model is represented
as a Bayesian inference network (BIN), and in our application all student model variables have
probabilities for each of three states of proficiency level: low, medium, and high. For example,
consider a student who is struggling with a specific concept or skill (e.g., knows U.S. state
capitals). She may have the following probability distribution assigned to this variable: low (p =
.85), medium (p = .10), high (p = .05). Furthermore, if knowing each state and its capital were
targeted as important, there would be 50 more nodes represented (i.e., one per state, residing
under the parent node: knows U.S. state capitals).6 Each variable has its own probability
distribution. In the more general case, we can interpret the example distribution as, “It is likely
this student currently does not know all of the U.S. state capitals.”
Such probability distributions are dynamic—they are a function of the current, specific
performance data (evidence) that feeds back to update the student model. Maintaining an updated
record of proficiency levels can help determine proper interventions. For example, students
performing lower than expectations (low) may benefit from remedial instruction; students
performing consistently with expectations (medium) may need to continue practicing the current
skill/concept; and those performing higher than expectations (high) may be ready to move to
more advanced material. But this is still rather vague, so we sought a more concrete way for the
system to select the next, most suitable task to present to a learner at a given point in time.
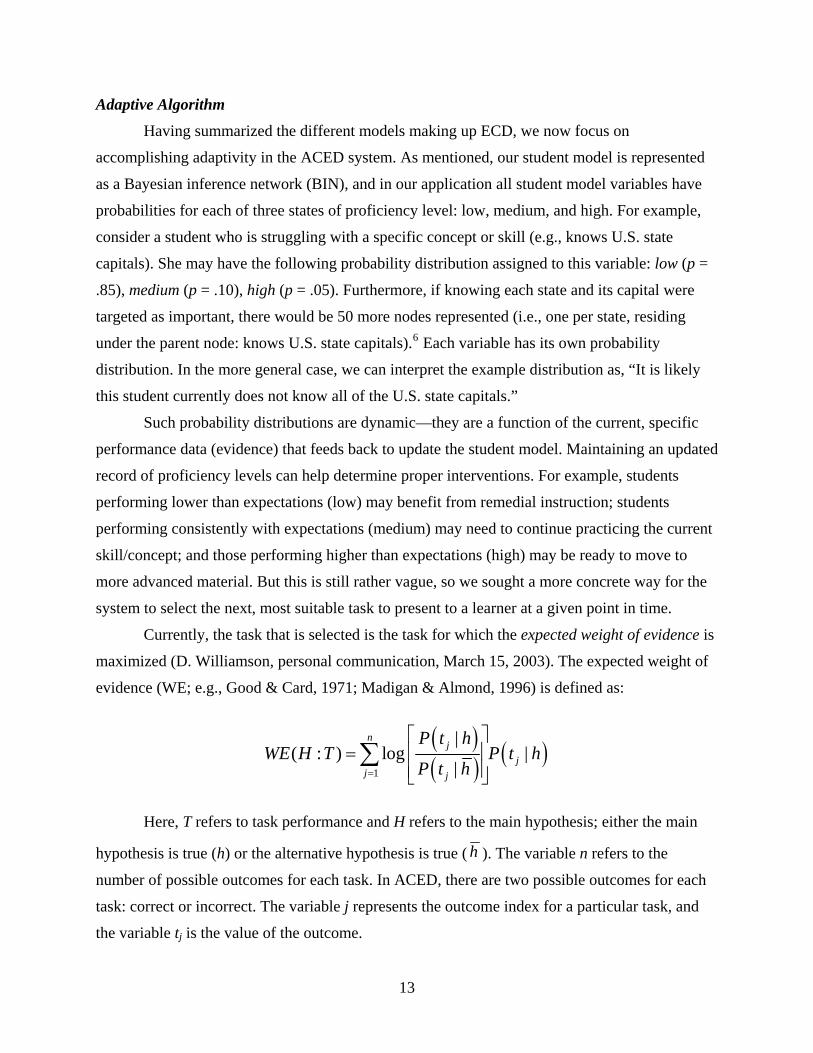
Currently, the task that is selected is the task for which the expected weight of evidence is
maximized (D. Williamson, personal communication, March 15, 2003). The expected weight of
evidence (WE; e.g., Good & Card, 1971; Madigan & Almond, 1996) is defined as:
( )( ) ( )
1
|( : ) log |
|
nj
jj j
P t hWE H T P t h
P t h=
⎡ ⎤⎢ ⎥=⎢ ⎥⎣ ⎦
∑
Here, T refers to task performance and H refers to the main hypothesis; either the main
hypothesis is true (h) or the alternative hypothesis is true ( h ). The variable n refers to the
number of possible outcomes for each task. In ACED, there are two possible outcomes for each
task: correct or incorrect. The variable j represents the outcome index for a particular task, and
the variable tj is the value of the outcome.
13
The weight of evidence for a particular task outcome is the log-odds ratio of the
probability that a particular outcome will occur given that the hypothesis is true, to the
probability that the same outcome will occur given that the alternative hypothesis is true. Thus,
the expected weight of evidence, WE (H : T), for a particular task is the average weight of
evidence across possible task outcomes (Madigan, Mosurski, & Almond, 1997).
Going back to the earlier example, suppose you are a teacher at a school in New Jersey
and have just finished a short instructional unit on U.S. state capitals. You believe that you did a
good job and that most of the students should demonstrate high levels of proficiency on tasks
assessing relevant content. You are ready to move on, and thus your hypothesis of interest (h) is
that your students are high on their state capital proficiencies, and the alternative hypothesis ( h )
is that they are not high. Teachers specify their hypothesis of interest in advance, via a pull-down
menu in ACED, as it pertains to their students who will be using the system. The alternative
hypothesis is simply the inverse of the main hypothesis.
Now suppose that you have an assessment consisting of tasks covering the material you
want your students to have acquired. Each student takes the assessment, one task at a time. At the
end of each task, there are just two possible outcomes—either the student solved it correctly or
incorrectly (tj = 1 or 0). Imagine also that you have a rank-ordered list of difficulty levels for all
of the tasks, based on familiarity, frequency, and/or saliency data. Suppose that for your
population of students, an easy item would be to identify Trenton as New Jersey’s state capital.
Some difficult items may be to identify the capitals of South Dakota and Kentucky. If you really
wanted to know if it was time to move on to another topic or stay with state capitals a little
longer, would you administer the “What is the state capital of New Jersey?” question first or
something harder? Clearly, asking a really easy question that everyone answers correctly does
not shed new light on a student’s proficiency level. But what is the best level of difficulty? And
if you administer a difficult item and a student solves it incorrectly, should you give another
difficult item or an easier one? Our adaptive algorithm helps to answer these types of questions.
On the basis of each outcome event and in conjunction with the difficulty of the current
task and the current values in the student model (unique, per student), the WE is calculated for the
remaining set of assessment tasks. The next task selected is that which has the highest WE value,
providing the most information in relation to a specific hypothesis (Madigan & Almond, 1996).
Because our first year focused primarily on building the system, we do not have any data
as to its efficacy at this time. However, we do have some preliminary data suggesting that our
14

adaptive algorithm is, indeed, functioning as intended. To test its functionality, we created a
variety of simulated (but realistic) student profiles with different patterns of response histories to
see what task the system would select based on various performances. To illustrate, one
simulation consisted of the hypothesis that “the student is high” in relation to a set of
proficiencies. We created a simulated student who was characterized as having had problems
acquiring the material, as evidenced by poor performance. For instance, the simulated student
received a difficult item in relation to a particular proficiency and failed to solve it correctly. The
next task that was selected (via the WE calculation) was one representing the same proficiency,
but represented by an easier task. Using our earlier illustration, this would be similar to a student
being asked to recall the capital of South Dakota in response to an open-ended prompt. Upon
failing to do so, the student would then be asked an easier, forced-choice variant, such as,
“Which of these three cities is the capital of South Dakota: (a) San Francisco, (b) Pierre, (c)
Baltimore?” Our simulated data, in conjunction with other profiles across 10-20 trials, indicate
that the algorithm appears to be working as intended. The system will be pilot tested on real
students in the second year of the project.
In summary, the WE approach is appealing because it is multidimensional, dynamic, and
flexible. That is, this approach works with multidimensional Bayes nets, allowing estimation of a
variety of student model variables (rather than being limited to a single, general proficiency).
Also, the model evolves over time, updating its variable estimates in response to actual
performance data. Finally, this approach allows one to specify a hypothesis of interest as
opposed to requiring a default or fixed hypothesis. All this is accomplished by the following WE
cycle: Calculate WE, select task (i.e., that with the highest WE), administer task, collect
evidence, score response, update student model (BIN), and return to the first step (i.e., calculate
new WE). This continues until a termination criterion is met (e.g., threshold is exceeded, time
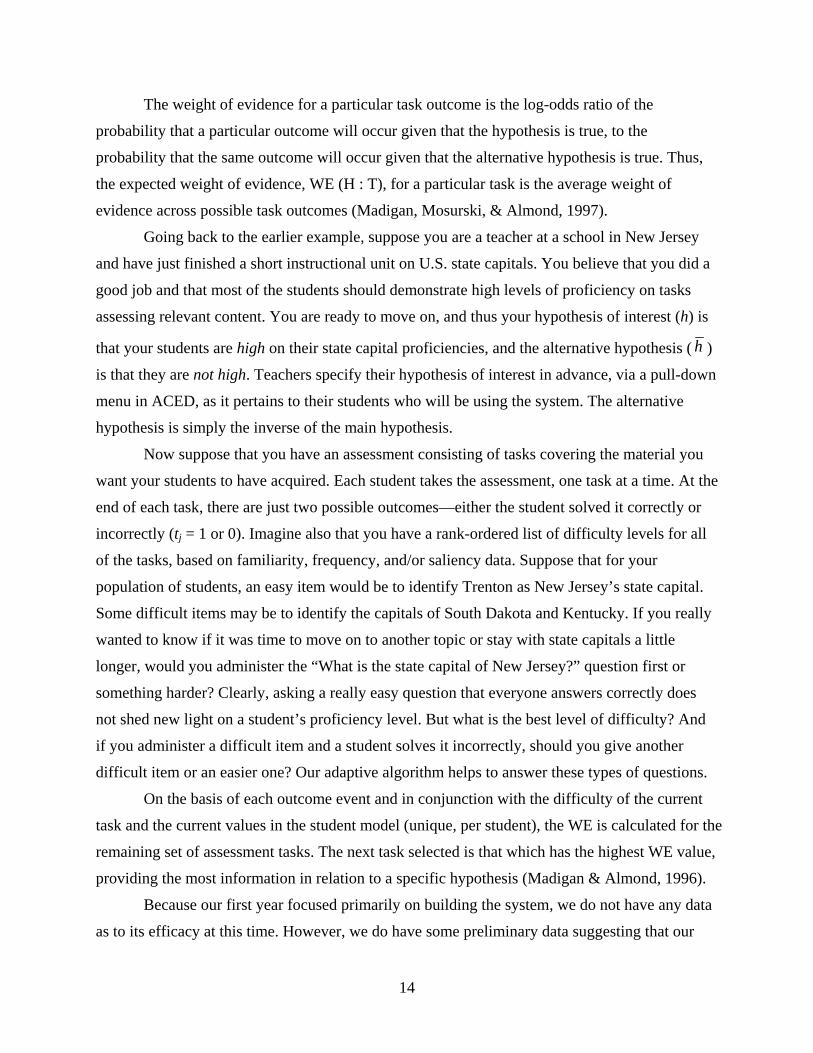
runs out, or tasks are finished). This cycle is based on the basic flow of events represented in the
four-process model (Almond, Steinberg, & Mislevy, 2002) shown in Figure 3.
Specific ACED Models
Having set up the infrastructure for the ACED system, we now focus our attention on
populating it with content. Two preliminary and important stages characterize the design of an
ECD-based assessment: domain analysis and domain modeling (Mislevy et al., 1999a). Domain
analysis is the process of identifying, collecting, organizing, and representing the relevant
information in a domain, based on knowledge captured from domain experts, underlying theory,
15
supplementary material, and so on. During domain modeling, the designers establish
relationships among the student proficiencies, the evidence for the proficiencies, and the kinds of
tasks that elicit relevant evidence. Graphic representations and schema are typically used to
convey complex relationships. These are discussed in more detail, below, specifically in relation
to the ACED prototype.
Figure 3. The four-process model.
Note. From “Enhancing the Design and Delivery of Assessment Systems: A Four Process
Architecture” by R. G. Almond, L. S. Steinberg, and R. J. Mislevy, 2002, The Journal of
Technology, Learning and Assessment, 1(5). Copyright 2002 by The Journal of Technology,
Learning, and Assessment (ISSN 1540-2525). Adapted with permission.
Domain Analysis
As mentioned, during the domain analysis phase, designers consider the range of
constructs that may be measured by the assessment (Mislevy et al., 1999b). In order to identify
the relevant constructs, designers consult with expert practitioners and refer to supporting
materials. Furthermore, research articles and state and national testing standards are often
valuable sources. Practical requirements and constraints are also considered in this phase. During
the domain analysis phase of the ACED project, we first consulted with a small team of four
16
eighth-grade mathematics teachers (the expert practitioners). We told the team that we intended
to build an assessment for the purpose of diagnostic instruction and needed their expertise in
order to select some appropriate eighth-grade mathematics content. One practical constraint was
that since we were designing the unit for a prototype system, we planned to limit the scope of the
assessment to 2-3 weeks worth of material, which corresponds to the approximate length of time
that most teachers will spend on a classroom unit of instruction.
After proposing several options, the team selected sequences as patterns as a topic for the
assessment. Most of the teachers on the team were working in the state of New Jersey, and they
indicated that several New Jersey state standards address sequences, and that the material works
well as part of a 2–3 week classroom unit of instruction. Subsequent discussion focused on
prerequisites for the unit, as well as the organization of the requisite skills. We discussed
pedagogical approaches, sample tasks, and the use of supplementary materials in designing such
a unit. Further, we discussed what kinds of proficiencies would be appropriate to include on a
pretest or an interim test designed for a unit on sequences. The teachers mentioned that in
designing a unit they use the textbook as a resource, and they gather material from the Web.
During the domain analysis phase, and following this phase as we were reviewing the
model, we consulted a number of sources, including national standards (National Assessment
Governing Board, 2002; National Council of Teachers of Mathematics, 2000), the New Jersey
state standards (New Jersey Department of Education, 2004), and a number of algebra and pre-
algebra textbooks (Bellman et al., 2001; Brown, Dolciani, Sorgenfrey, & Cole, 2000; Burton et
al., 1999; Collins et al., 2001; Lappan, Fey, Fitzgerald, Friel, & Phillips, 2002; Price, Rath,
Leschensky, Malloy, & Alban, 1997).7
Domain Modeling
After we were satisfied with the breadth and depth of proficiencies pulled from the various
sources, we began the next phase: domain modeling. According to Mislevy et al. (1999a):
In the domain modeling phase, the designers use information from the domain analyses to
establish relationships among proficiencies, tasks, and evidence. They explore different
approaches and develop high-level sketches that are consistent with what they have
learned about the domain so far. They can create graphic representations and schema to
convey these complex relationships, and may develop prototypes to test their
assumptions. (p. 3)
17

During the first part of the domain modeling phase for the sequences unit, we focused on
developing schema to approximate what would later become the student model. Following our
discussions with teachers and our reviews of the standards and textbooks, we began to identify
the key proficiencies and how they should be linked and organized. At first, we only listed the
proficiencies; later we organized them into an outline. Finally, we created graphic
representations in Microsoft Word, Microsoft Visio, and ETS’s Portal (e.g., Mislevy, Steinberg,
& Almond, 2000) where we could easily move, add, or delete proficiencies (nodes in our graph)
and change the links among them. We considered different options for global as well as local
structures. After many revisions, we defined the student model that we would ultimately use in
our ACED prototype system.
Once the student model was established, defining the evidence and task models was
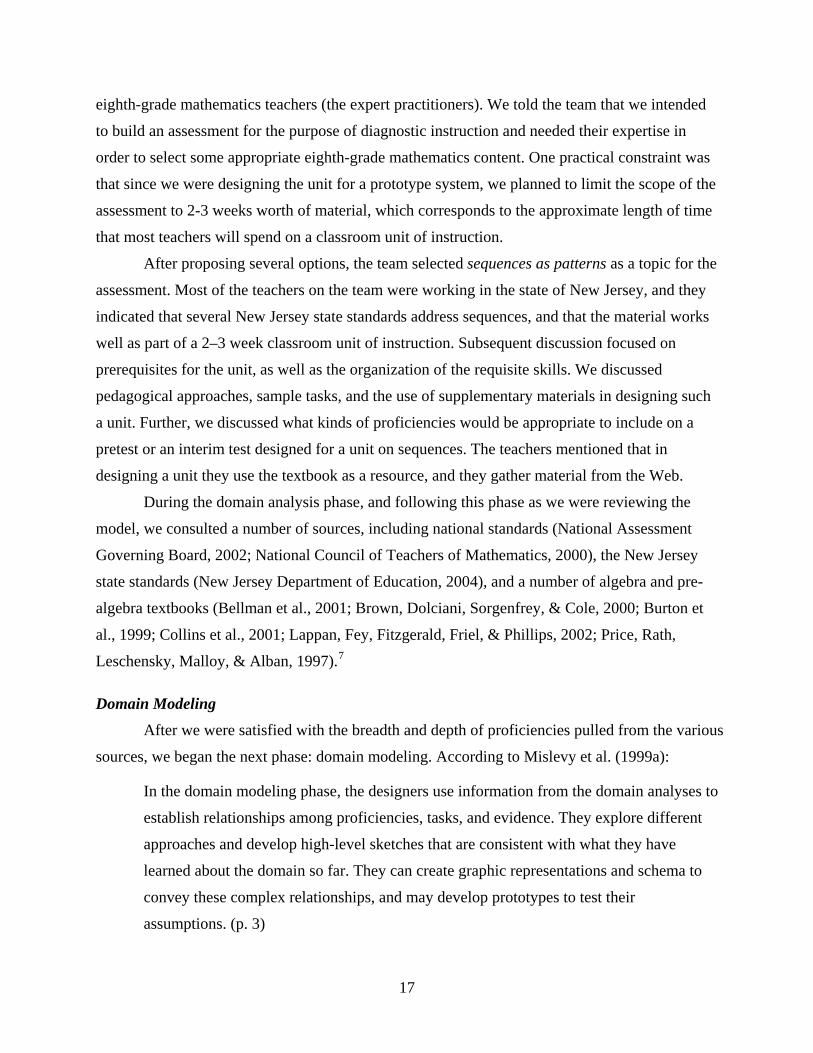
straightforward, albeit time-consuming, given the number of proficiencies specified. Figure 4
shows the student model used in ACED, and three features are immediately apparent. First, the
model is hierarchical; each child node has only one parent node. Second, the root node that
represents the proficiency, sequences as patterns, has three child nodes, each corresponding to a
different sequence type. Third, the proficiencies under each sequence type are identical, with the
exception that there is no analog for common difference (arithmetic) or common ratio
(geometric) in other recursive sequences. This is because the other recursive sequences
proficiency is more broadly defined; it pertains to sequences taught at the eighth-grade level that
may be recursively defined but are neither arithmetic nor geometric. Examples include the
Fibonacci numbers, triangular numbers, and simple repeating patterns.
Brief descriptions of some of the student proficiencies are given in Table 2. As part of the
development of the student model, claims were also specified. Three levels of mastery (low,
medium, and high) are associated with each student variable. For each level of each student
model variable, there is a claim that describes what the student should know and be able to do.
Because the set of claims is extensive, we do not show all of the claims here, but the following is
an example of a claim for a student with a high level of proficiency at finding explicit formulas
for geometric sequences (i.e., the node labeled explicit in the geometric branch of the student
model, Figure 4): “The student can correctly generate or recognize the explicit formula for the
nth term in a geometric sequence. The student can do this in more challenging situations, for
example, when the signs of the terms in the sequence are alternating or when the starting term
and the common ratio are unequal.”
18
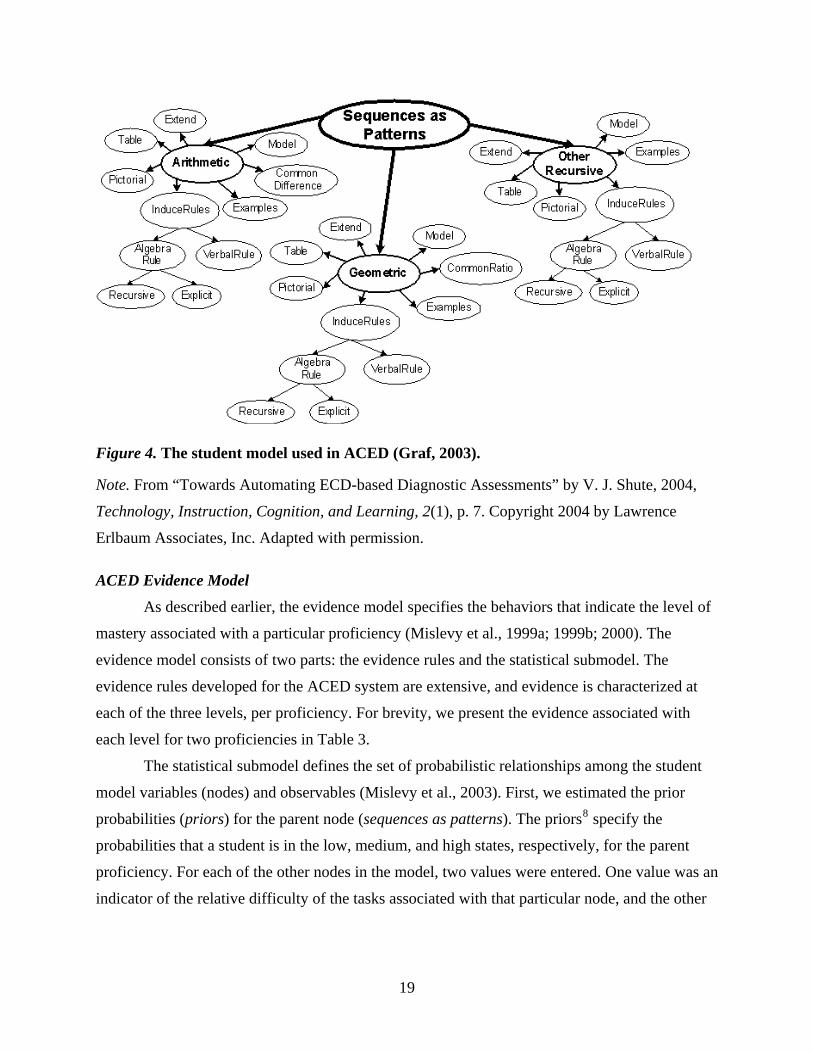
Figure 4. The student model used in ACED (Graf, 2003).
Note. From “Towards Automating ECD-based Diagnostic Assessments” by V. J. Shute, 2004,
Technology, Instruction, Cognition, and Learning, 2(1), p. 7. Copyright 2004 by Lawrence
Erlbaum Associates, Inc. Adapted with permission.
ACED Evidence Model
As described earlier, the evidence model specifies the behaviors that indicate the level of
mastery associated with a particular proficiency (Mislevy et al., 1999a; 1999b; 2000). The
evidence model consists of two parts: the evidence rules and the statistical submodel. The
evidence rules developed for the ACED system are extensive, and evidence is characterized at
each of the three levels, per proficiency. For brevity, we present the evidence associated with
each level for two proficiencies in Table 3.
The statistical submodel defines the set of probabilistic relationships among the student
model variables (nodes) and observables (Mislevy et al., 2003). First, we estimated the prior
probabilities (priors) for the parent node (sequences as patterns). The priors8 specify the
probabilities that a student is in the low, medium, and high states, respectively, for the parent
proficiency. For each of the other nodes in the model, two values were entered. One value was an
indicator of the relative difficulty of the tasks associated with that particular node, and the other
19
was a correlation that indicated the strength of the relationship between the node and its parent
(R. Almond, personal communication, October 4, 2004).
Table 2
Example Descriptions of Proficiencies Used in the ACED System Prototype
Tree level
Name in tree
Full name Description
1 Arithmetic Solve problems with arithmetic sequences
A student with this set of proficiencies can work with arithmetic sequences at the eighth-grade level. An arithmetic sequence is defined by a starting term a1 and a common difference, d. The terms of an arithmetic sequence are as follows: a1, a1 + d, a1 + 2d, a1 + 3d, …, a1 + (n-1)d (e.g., see Beyer, 1984, p. 8).
2 Pictorial Represent pictorial patterns as sequences (arithmetic, geometric, other recursive)
A student with this set of proficiencies can interpret a graphic (e.g., a succession of patterns of dots) as a sequence of a particular type.
3 Algebra rule
Generate a rule for a sequence as a function or expression (arithmetic, geometric, other recursive)
A student who has this skill can express rules of generating terms in a sequence algebraically; the rule in this case takes the form of an algebraic expression.
4 Explicit Generate a formula for the nth term of a sequence (arithmetic, geometric, other recursive)
A student with this proficiency can use an algebraic expression to represent the nth term of a sequence. For example, 5 + 2(n – 1) is an explicit rule for the nth term of an arithmetic sequence with an initial term of 5 and a common difference of 2. In general, an explicit rule for the nth term of an arithmetic sequence is: an = a1 + (n - 1)d (d is the common difference) and an explicit rule for the nth term of a geometric sequence is: an = a1r
n-1 (r is the common ratio) [e.g., see Beyer, 1984, p. 8].
20

These judgments were transformed to produce a set of conditional probability tables, one
table for each node except for the root node. Since each node had three levels associated with it,
each conditional probability table had nine probability estimates (three parent node levels
multiplied by three child node levels). A probability estimate was in each cell. For example, a
cell in the table associated with the model node under arithmetic sequences would indicate the
probability (expressed as a value between 0 and 1.0) for high-level proficiency for model given
medium-level proficiency for arithmetic. Generally speaking, students with high proficiency
levels were considered most likely to be able to solve both difficult and simple tasks, while
students with low proficiency levels were considered most likely to be able to solve only easy
tasks.
Table 3
Evidence Rules Specified for Two Sample Proficiencies, at Each Level of Mastery
Evidence rules by proficiency level Proficiency High Medium Low
Represent pictorial patterns as arithmetic sequences
The student can produce a pattern that represents an arithmetic sequence, can recognize arithmetic sequences represented as pictorial patterns, and can recognize the equivalence between numeric and pictorial representations.
The student recognizes that the pictorial patterns have mathematical significance but cannot consistently explain how or why.
The student does not infer any mathematical significance from the pictorial patterns.
Generate and justify examples of geometric sequences
The student can generate geometric sequences. If a list of terms is given, all terms in the sequence are correct. If a formula is given, it is well formed and correctly specifies an appropriate example.
The student generates something that may be a sequence but not necessarily a geometric sequence, or generates a sequence that is geometric but has some incorrect terms due to arithmetic errors, or generates a formula that is close to expressing the correct sequence.
The student generates something that does not express a sequence at all or generates a sequence that does not include a multiplicative operation as at least part of the rule.
21
ACED Task Model
The task model provides a specification of the kinds of tasks that measure the behaviors
described in the evidence model (Mislevy et al., 1999a; 1999b). The task model describes the
features for each kind of task included in an assessment. For example, it might describe different
item types included in an assessment, the nature of the stimulus (if present), the stem, and the
options (if any). The task model also describes how the student will respond to each type of task.
For example, a multiple-choice item requires the student to select an option, while a numeric
entry item requires a student to enter a number. The following is an example item from ACED:
“Find the missing terms in the following arithmetic sequence: 4.68, ___, ___, 13.74, 16.76,
19.78.” The item type, the nature of the stem, and the number of responses are all examples of
task model variables that are included in the ACED task model specification. The example item
is a numeric entry item, since the student enters numbers rather than selects an option. Two
responses are required, one for each blank. The stem consists of both numbers and text, but no
graphics. All of the items in ACED are either numeric entry or multiple-choice formats. The
stem always includes words, but might also include numbers, pictures, and tables.
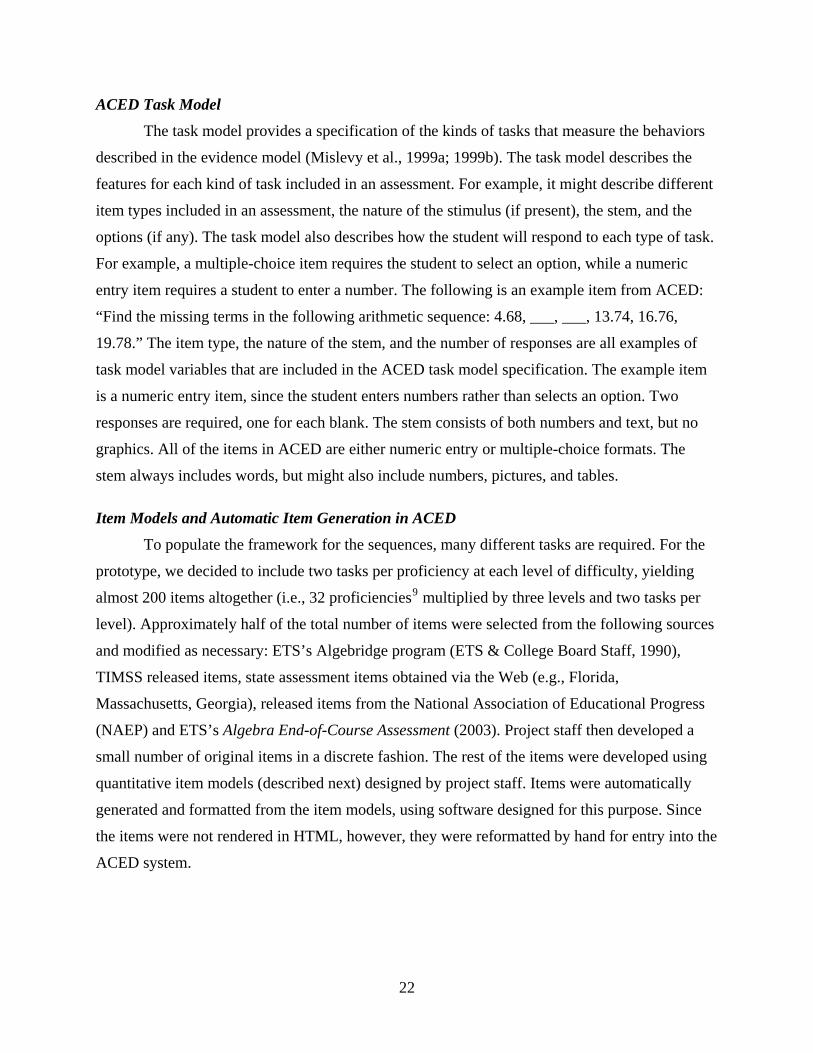
Item Models and Automatic Item Generation in ACED
To populate the framework for the sequences, many different tasks are required. For the
prototype, we decided to include two tasks per proficiency at each level of difficulty, yielding
almost 200 items altogether (i.e., 32 proficiencies9 multiplied by three levels and two tasks per
level). Approximately half of the total number of items were selected from the following sources
and modified as necessary: ETS’s Algebridge program (ETS & College Board Staff, 1990),
TIMSS released items, state assessment items obtained via the Web (e.g., Florida,
Massachusetts, Georgia), released items from the National Association of Educational Progress
(NAEP) and ETS’s Algebra End-of-Course Assessment (2003). Project staff then developed a
small number of original items in a discrete fashion. The rest of the items were developed using
quantitative item models (described next) designed by project staff. Items were automatically
generated and formatted from the item models, using software designed for this purpose. Since
the items were not rendered in HTML, however, they were reformatted by hand for entry into the
ACED system.
22

As cited in Bejar (2002), the term item model was introduced by LaDuca, Templeton,
Holtzman, and Staples and refers to classes of content-equivalent items. A quantitative item
model is a specification for a set of items that share a common mathematical structure. Ideally an
item model captures an underlying problem structure, or schema (Singley & Bennett, 2002).
Items in a model may also share formats, variables, and mathematical constraints, and a set of
item models may be used to define the task model for an assessment. The variables in a
quantitative item model specify the range of permissible values that may replace the variable in
an individual item. The constraints in a quantitative item model define and restrict the
mathematical relationships among the variables. The number of items described by an item
model may vary, depending on how the variables and constraints have been defined.
Once an item model is defined, it is possible to automatically generate the instances that
it describes (Bejar, 1993). An item model may be programmed into software that generates the
instances (Singley & Bennett, 2002). In addition to providing an organized structure for item
development, an automatic approach to item generation confers considerable practical
advantages (Bejar et al., 2002), because the generating software can perform the necessary
computations and can format the items automatically. For ACED, we used ECD as the guiding
framework to inform the structure of item models.
Table 4 shows a simplified example of an item model developed for ACED, together
with two items that might be generated from the model. This item model would generate easy
items that link to the extend node under arithmetic sequences. A more detailed account of how
models were used to generate instances for the ACED program will be presented in Graf and
Shute (2004).
This concludes the discussion of the design and development of the ACED prototype,
focusing on microadaptation. We now turn our attention to the macroadaptive part of the system
that will be developed and tested over the next 2 years. Our initial focus will be on visual
disabilities and the accommodations thereof. We begin the section with a discussion of the
importance of validity in the design of an assessment system, especially one that includes
macroadaptation. We also review some of the more important accessibility features, as they
relate to different disabilities. Finally, we describe one particular accommodation that we plan to
use in the next phase of ACED research—the Talking Tactile Tablet (TTT; see
http://www.touchgraphics.com).
23
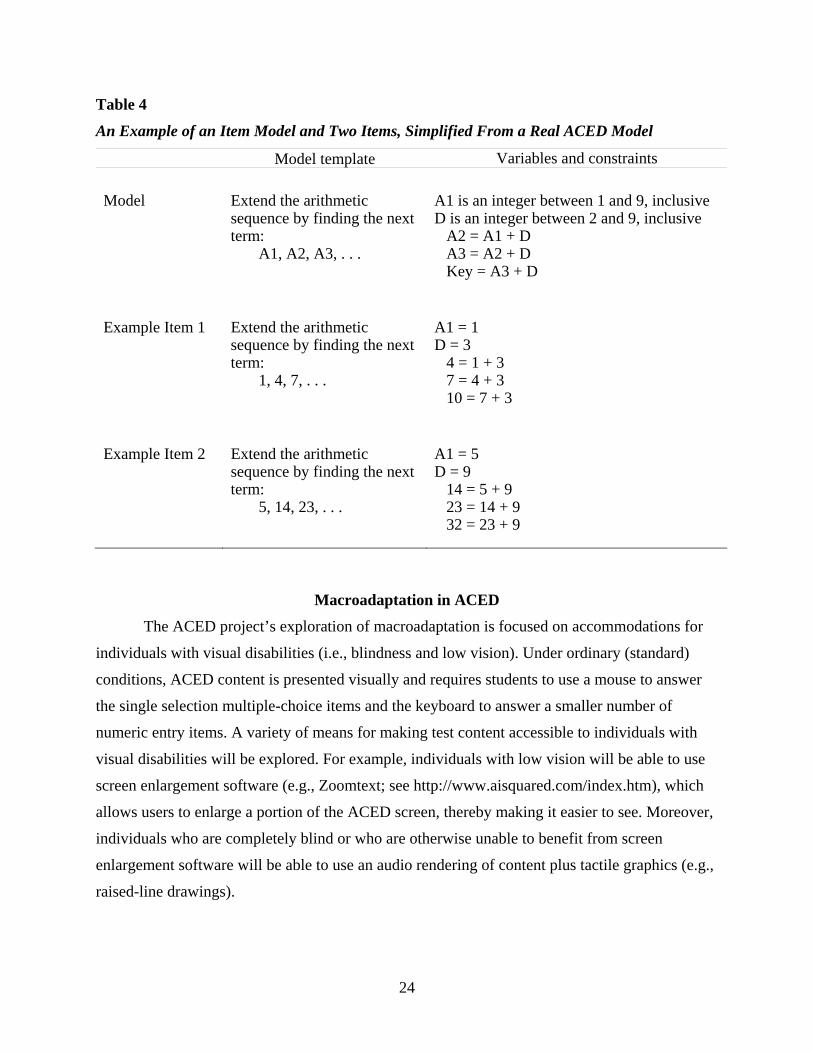
Table 4
An Example of an Item Model and Two Items, Simplified From a Real ACED Model
Model template Variables and constraints
Model Extend the arithmetic sequence by finding the next term: A1, A2, A3, . . .
A1 is an integer between 1 and 9, inclusive D is an integer between 2 and 9, inclusive A2 = A1 + D A3 = A2 + D Key = A3 + D
Example Item 1 Extend the arithmetic sequence by finding the next term: 1, 4, 7, . . .
A1 = 1 D = 3 4 = 1 + 3 7 = 4 + 3 10 = 7 + 3
Example Item 2 Extend the arithmetic sequence by finding the next term: 5, 14, 23, . . .
A1 = 5 D = 9 14 = 5 + 9 23 = 14 + 9 32 = 23 + 9
Macroadaptation in ACED
The ACED project’s exploration of macroadaptation is focused on accommodations for
individuals with visual disabilities (i.e., blindness and low vision). Under ordinary (standard)
conditions, ACED content is presented visually and requires students to use a mouse to answer
the single selection multiple-choice items and the keyboard to answer a smaller number of
numeric entry items. A variety of means for making test content accessible to individuals with
visual disabilities will be explored. For example, individuals with low vision will be able to use
screen enlargement software (e.g., Zoomtext; see http://www.aisquared.com/index.htm), which
allows users to enlarge a portion of the ACED screen, thereby making it easier to see. Moreover,
individuals who are completely blind or who are otherwise unable to benefit from screen
enlargement software will be able to use an audio rendering of content plus tactile graphics (e.g.,
raised-line drawings).
24

This exploration focuses primarily on the usability of specific accommodations. It should
be noted that usability is but one important issue bearing on the validity of the scores obtained
under accommodated conditions.10 For example, it is clearly important to ensure that an
accommodation is usable and overcomes one or more accessibility barriers. But it is also
important to ensure that an accommodation does not provide an unfair advantage for the person
that receives the accommodation (Bennett, 1995; Heath & Hansen, 2002; IMS Global Learning
Consortium, 2002; Thompson, Johnstone, & Thurlow, 2002; Thompson, Thurlow, Quenemoen,
& Lehr, 2002). For example, allowing a person with a math-related disability (e.g., dyscalculia)
to use an electronic calculator on a math test may make the test accessible and usable. However,
if the test is intended to measure mental computation, then the electronic calculator
accommodation will tend to provide an unfair advantage for that person, thereby potentially
invalidating the results. The relatively low number of individuals with disabilities involved in
this study does not permit us to directly examine certain aspects of validity (e.g., relationships
between assessment scores and external criteria). Still, we seek to place our exploration of
accommodation within a validity framework that can be helpful in later studies without this
limitation. Specifically, we use an ECD-based validity framework that pays close attention to
evidentiary argument; careful attention to the definition of the construct (e.g., skills or abilities
that are or are not part of what one intends to measure) is a key aspect of this approach.11
Our intention with the ACED sequences as patterns assessment is to measure cognitive
abilities (e.g., reasoning and knowledge of various sequences), rather than assessing the senses of
sight, hearing, or touch. This suggests that it is not unreasonable, for example, to provide
accommodations that reduce or eliminate the requirements for sight (imposed by the visually
displayed text and graphics under standard testing conditions) and instead rely on other
capabilities (e.g., hearing and touch) when delivering test content.12, 13
Audio and Tactile Accommodations
Typical audio rendering of content is often termed a read-aloud accommodation, because
it involves reading the content aloud to the student. The audio method may be implemented via a
live human reader, prerecorded human audio, or synthesized speech. In any case, the audio
rendering typically reads aloud text content (i.e., straight text) but can also read aloud nontext
content, such as images, audio, and video/animations. As discussed earlier, nontext content is
translated into text equivalents, which seek to convey the same meaning, but through text
(Chisholm et al., 1999; see also IMS Global Learning Consortium, 2002). An audio rendering of
25

a math test may also include specially scripted descriptions of math expressions and tables. If the
audio rendering has been crafted to convey all necessary content, a person who is blind could use
it without relying on tactile graphics. However, it is often easier to understand graphical material
(pictures, graphs, etc.) when the audio descriptions are supplemented with tactile graphics.
Ordinary tactile graphics are typically printed or pressed onto paper or plastic and can be felt
with the fingertips. The tactile graphics may include braille labels.14
Currently, we are planning to use a hybrid method of access that combines both tactile
graphics and audio in a single interactive system. This method, which may be termed audio-
tactile graphics,15 allows the student to touch a specific location on the tactile graphic and then
hear a description of that location. The student can quickly navigate from location to location,
hearing as much or as little of the description as desired. Such audio-tactile graphics may
facilitate access to graphics-intensive content. Following is a description of the TTT system for
audio-tactile graphics.
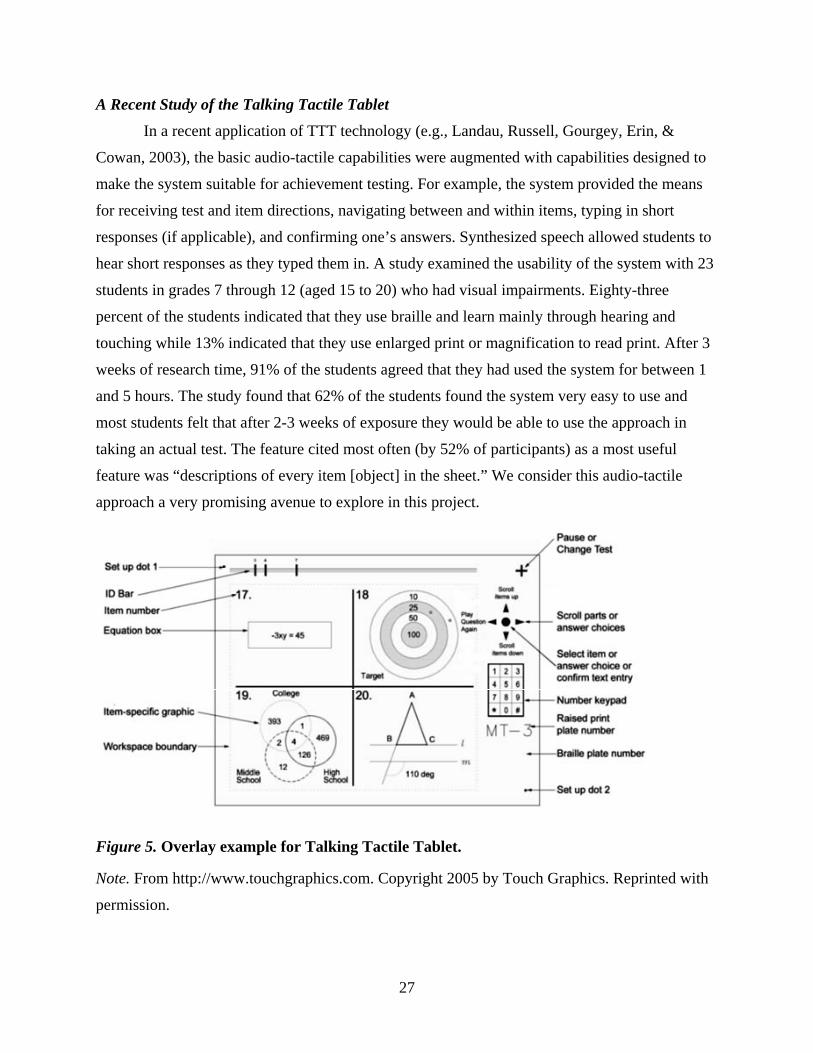
The Talking Tactile Tablet (TTT)
The TTT provides a mix of audio (read-aloud), tactile, and visual modification
capabilities, which may be particularly useful for test content that uses graphics, tables, and math
expressions as they are often difficult to convey via words alone. To develop a TTT application,
one develops a tactile graphic, a sheet of hard plastic that uses raised lines and textures to
represent points, lines, and regions of a graphic (see Figure 5). A special printing process is also
used to print the graphical material on the tactile graphic, which can help individuals with some
sight. Some features of the graphic may be labeled with braille. The tactile graphic is then placed
on a touch-sensitive tablet that is controlled by an external personal computer. A content author
then specifies in software the active regions on the graphic and maps each active region to one or
more prerecorded audio segments. For example, when using the TTT the student could press on
the angle depicted in the lower-right corner of Figure 5 and hear the words 110 degrees in
prerecorded audio. This allows a person who has a visual impairment (or another disability that
impairs processing of visually-rendered content) to receive specific and interactive audio
descriptions of content that would ordinarily be presented only visually. The TTT system allows
students to navigate through the test and to select their answers using tactile (raised-line) controls
on the tablet. The keyboard on the laptop is necessary only when answering short, constructed-
response items.
26
A Recent Study of the Talking Tactile Tablet
In a recent application of TTT technology (e.g., Landau, Russell, Gourgey, Erin, &
Cowan, 2003), the basic audio-tactile capabilities were augmented with capabilities designed to
make the system suitable for achievement testing. For example, the system provided the means
for receiving test and item directions, navigating between and within items, typing in short
responses (if applicable), and confirming one’s answers. Synthesized speech allowed students to
hear short responses as they typed them in. A study examined the usability of the system with 23
students in grades 7 through 12 (aged 15 to 20) who had visual impairments. Eighty-three
percent of the students indicated that they use braille and learn mainly through hearing and
touching while 13% indicated that they use enlarged print or magnification to read print. After 3
weeks of research time, 91% of the students agreed that they had used the system for between 1
and 5 hours. The study found that 62% of the students found the system very easy to use and
most students felt that after 2-3 weeks of exposure they would be able to use the approach in
taking an actual test. The feature cited most often (by 52% of participants) as a most useful
feature was “descriptions of every item [object] in the sheet.” We consider this audio-tactile
approach a very promising avenue to explore in this project.
Figure 5. Overlay example for Talking Tactile Tablet.
Note. From http://www.touchgraphics.com. Copyright 2005 by Touch Graphics. Reprinted with
permission.
27

Summary and Future Directions
The general goal of the research described in this report is to create an intervention that
supports and enhances middle school students learning math concepts and skills. In designing the
ACED system, one important challenge we faced was how to effectively present mathematics
content to students who are blind or who have low vision. Sixty-seven percent of students with
blindness or low vision are placed in inclusive classrooms (Rothberg & Wlodkowski, 2000).
Ideally, these students should be participating in lessons and activities alongside their
nondisabled peers. But, as noted earlier, math content can be difficult to convey without using
visual representations. Beginning in middle school, students are increasingly exposed to more
complex mathematical elements, including expressions and equations, diagrams, tables, and
graphs. As the complexity of visual content increases, so does the challenge of presenting it to
students with visual disabilities. While auditory descriptions may suffice for simple graphs and
diagrams, tactile media, perhaps in the form of audio-tactile graphics, may be better for more
complicated mathematical elements.16
We have accomplished our first-year goals for the ACED project. Some of the main
activities included meeting with teachers for input on content, completing the design and
development of the prototype infrastructure, designing and testing the adaptive algorithm,
designing and fleshing out the various ECD-based models (student, evidence, and task) and
creating and/or modifying the full set of diagnostic assessment tasks (about 180 tasks
representing about 30 different proficiencies). We also reviewed the various assistive technology
options and literature on accommodations, specifically for low vision and blind students,
although others (e.g., deaf and learning-disabled persons) may also be accommodated with
ACED.
In the first and second years of this grant, we plan to analyze the general contribution of
microadaptation to learning as well as continue to test, refine, and combine macroadaptations
(e.g., text-to-speech, screen magnification, tactile graphics) to improve the accessibility and
usability of ACED for students with visual disabilities. Thus our upcoming plans include two
related strands of research. One strand will examine the relative contribution of microadaptation
on about 100 sighted and low-vision students, in terms of learning variables. The other strand,
involving students who are blind or otherwise visually disabled, will test and refine adaptations
(e.g., text-to-speech, screen magnification, tactile graphics) to improve the accessibility and
usability of the ACED system for students with disabilities.
28

In conclusion, we are committed to pursuing policies of inclusion to the highest degree
possible that are consistent with the purposes and resources of the research. Findings from both
studies (experimental and usability) are expected to highlight important information, such as the
progress of the project in making the content accessible. We also expect, in the future, to be able
to address issues regarding the feasibility and limitations of this approach, as we implement and
test in larger trials. We hope that the approach described in this report for designing, developing,
and interpreting assessments will provide a useful precedent for environments that adapt to
support student learning based on larger sets of students’ incoming abilities and disabilities.
29

References
Algebra end-of-course assessment. (2003). Princeton, NJ: ETS.
Almond, R. G., Steinberg, L. S., & Mislevy, R. J. (2002). Enhancing the design and delivery of
assessment systems: A four process architecture. The Journal of Technology, Learning
and Assessment, 1(5). Retrieved August 10, 2004, from
http://www.bc.edu/research/intasc/jtla/journal/pdf/v1n5_jtla.pdf
American Educational Research Association, American Psychological Association, & National
Council on Measurement in Education. (1999). Standards for educational and
psychological testing. Washington, DC: American Educational Research Association.
Bejar, I. I. (1993). A generative approach to psychological and educational measurement. In N.
Fredericksen, R. J. Mislevy, & I. I. Bejar (Eds.), Test theory for a new generation of tests
(pp. 323–359). Hillsdale, NJ: Lawrence Erlbaum.
Bejar, I. I. (2002). Generative testing: From conception to implementation. In S. Irvine & P.
Kyllonen (Eds.), Item generation for test development (pp. 199–218). Mahwah, NJ:
Lawrence Erlbaum Associates Publishers.
Bejar, I. I., Lawless, R. R., Morley, M. E., Wagner, M. E., Bennett, R. E., & Revuelta, J. (2002).
A feasibility study of on-the-fly item generation in adaptive testing (GRE Professional
Rep. No. 98-12P, ETS RR-02-23). Princeton, NJ: ETS.
Bellman, A., Bragg, S. C., Chapin, S. H., Gardella, T. J., Hall, B. C., Handlin, W. G., et al.
(2001). Algebra: Tools for a changing world. Upper Saddle River, NJ: Prentice Hall.
Bennett, R. E. (1995). Computer-based testing for examinees with disabilities: On the road to
generalized accommodation (ETS RM-95-1). Princeton, NJ: ETS.
Beyer, W. H. (1984). CRC standard mathematical tables (26th ed.). Boca Raton, FL: CRC Press.
Bloom, B. S. (1968). Learning for mastery. Evaluation Comment, 1(2), 1–12.
Bloom, B. S. (1984). The 2-sigma problem: The search for methods of group instruction as
effective as one-to-one tutoring. Educational Researcher, 13(6), 4–16.
Brown, R. G., Dolciani, M. P., Sorgenfrey, R. H., & Cole, W. L. (2000). Algebra: Structure and
method, Book 1. Evanston, IL: McDougall Littell.
Burton, G., Maletsky, E. M., Bright, G. W., Helton, S. M., Hollis, L. Y., Johnson, H. C., et al.
(1999). Math advantage (Middle School III). Orlando, FL: Harcourt Brace & Company.
30

Chisholm, W., Vanderheiden, G., & Jacobs, I. (Eds.). (1999). Web content accessibility
guidelines 1.0 (W3C recommendation 5-May-1999). Retrieved July 13, 2005, from
http://www.w3.org/TR/WAI-WEBCONTENT.
Collins, W., Cuevas, G., Foster, A. G., Gordon, B., Moore-Harris, B., Rath, J., et al. (2001).
Glencoe algebra 1: Integration, applications, connections. New York: Glencoe/McGraw-
Hill.
Cronbach, L., & Snow, R. (1977). Aptitudes and instructional methods: A handbook for research
on interactions. New York: Irvington.
DAISY Consortium. (2004). Frequently asked questions - General. Retrieved August 20, 2004,
from http://www.daisy.org/about_us/g_faq.asp
ETS, & College Board Staff. (1990). Algebridge: Attacking word problems successfully.
Providence, RI: Janson Publications.
Good, I. J., & Card, W. (1971). The diagnostic process with special reference to errors. Method
of Inferential Medicine, 10, 176–188.
Graf, E. A. (2003, September 25). Designing a proficiency model and associated item models for
an 8th grade mathematics unit on sequences. Paper presented at the ETS Cross Division
Math Forum, Princeton, NJ.
Graf, E. A., & Shute, V. J. (2004). Using an item modeling approach to develop mathematics
assessment items for an 8th-grade unit on sequences. Manuscript in preparation.
Hansen, E. G., & Mislevy, R. J. (2004). Toward a unified validity framework for ensuring access
to assessments by individuals with disabilities and English language learners. Paper
presented at the annual meeting of the National Council on Measurement in Education
(NCME), San Diego, CA. Retrieved October 27, 2004, from ETS Web site:
http://www.ets.org/research/dload/NCME_2004-Hansen.pdf
Hansen, E. G., Mislevy, R. J., & Steinberg, L. S. (2003). Evidence-centered assessment design
and individuals with disabilities. In E. G. Hansen (Organizer), Assessment design and
diverse learners: Evidentiary issues in disability, language, and non-uniform testing
conditions. Symposium presented at the annual meeting of the National Council on
Measurement in Education, Chicago, IL. Retrieved October 27, 2004, from the ETS Web
site: http://www.ets.org/research/dload/ncme03-hansen.pdf
31

Hansen, E. G., Mislevy, R. J., & Steinberg, L. S. (in press). Evidence-centered assessment design
for reasoning about testing accommodations in NAEP reading and math. Princeton, NJ:
ETS.
Hansen, E. G., Mislevy, R. J., Steinberg, L. S., Lee, M. J., & Forer, D. C. (in press). Accessibility
of tests for individuals with disabilities within a validity framework. System: An
International Journal of Educational Technology and Applied Linguistics.
Heath, A., & Hansen, E. (2002). Guidelines for accessible testing and assessment. In IMS Global
Learning Consortium (Ed.), IMS guidelines for developing accessible learning
applications. Retrieved August 6, 2004, from
http://ncam.wgbh.org/salt/guidelines/sec9.html
IMS Global Learning Consortium. (2002). IMS guidelines for developing accessible learning
applications (ver. 1.0 white paper). Retrieved September 9, 2002, from
http://imsproject.org/accessibility/ accv1p0/imsacc_guidev1p0.html
International Study Center at Boston College. (1998). Third International Mathematics and
Science Study (TIMSS) highlights from the final year of secondary school. Retrieved
November 10, 2004, from http://timss.bc.edu/timss1995i/HiLightC.html
Landau, S., Russell, M., Gourgey, K., Erin, J., & Cowan, J. (2003). Use of the talking tactile
tablet in mathematics testing. Journal of Visual Impairment and Blindness, 97(2), 85–96.
Lappan, G., Fey, J. T., Fitzgerald, W. M., Friel, S. N., & Phillips, E. D. (2002). Connected
mathematics. Glenview, IL: Prentice Hall.
Madigan, D., & Almond, R. G. (1996). On test selection strategies for belief networks. In D.
Fisher & H.-J. Lenz (Eds.), Learning from data: AI and statistics IV (pp. 89–98). New
York: Springer-Verlag.
Madigan, D., Mosurski, K., & Almond, R. G. (1997). Graphical explanation in belief networks.
Journal of Computational and Graphical Statistics, 6(2), 160–181.
Mislevy, R. J., Almond, R. G., Yan, D., & Steinberg, L. S. (1999). Bayes nets in educational
assessment: Where do the numbers come from? In K. B. Laskey & H. Prade (Eds.),
Proceedings of the fifteenth conference on uncertainty in artificial intelligence (pp. 437–
446). San Francisco, CA: Morgan Kaufmann.
Mislevy, R. J., & Gitomer, D. H. (1996). The role of probability-based inference in an intelligent
tutoring system. User-Modeling and User-Adapted Interaction, 5, 253–282.
32
Mislevy, R. J., Steinberg, L. S., & Almond, R. G. (1999a). Evidence-centered assessment design.
Retrieved October 5, 2004, from http://www.education.umd.edu/EDMS/
mislevy/papers/ECD_overview.html
Mislevy, R. J., Steinberg, L. S., & Almond, R. G. (1999b). On the roles of task model variables
in assessment design (CSE Technical Rep. No. 500). Retrieved October 4, 2004, from
UCLA Center for the Study of Evaluation Web site:
http://www.cse.ucla.edu/CRESST/Reports/TECH500.pdf
Mislevy, R. J., Steinberg, L. S., & Almond, R. G. (2000). Evidence-centered assessment design:
A submission for the NCME Award for Technical or Scientific Contributions to the Field
of Educational Measurement. Retrieved November 12, 2004, from National Council on
Measurement in Education Web site: http://www.ncme.org/about/awards/mislevy.html
Mislevy, R. J., Steinberg, L. S., & Almond, R. G. (2003). On the structure of educational
assessments. Measurement: Interdisciplinary Research and Perspectives, 1(1), 3–62.
Mory, E. H. (2004). Feedback research review. In D. Jonassen (Ed.), Handbook of research on
educational communications and technology (pp. 745-783). Mahwah, NJ: Erlbaum.
National Assessment Governing Board. (2002). Mathematics framework for the 2003 National
Assessment of Educational Progress. Retrieved November 1, 2004, from
http://www.nagb.org/pubs/math_framework/toc.html
National Center for Educational Statistics. (2001). Highlights from the Third International
Mathematics and Science Study-Repeat (TIMSS-R). Retrieved November 11, 2004, from
http://nces.ed.gov/pubsearch/pubsinfo.asp?pubid=2001027
National Council of Teachers of Mathematics. (2000). Principles and standards for school
mathematics. Reston, VA: Author.
National Research Council. (2004). Keeping score for all: The effects of inclusion and
accommodation policies on large-scale educational assessment. Washington, DC: The
National Academies Press.
New Jersey Department of Education. (2004). New Jersey core curriculum content standards for
mathematics. Retrieved October 5, 2004, from
http://www.state.nj.us/njded/cccs/s4_math.htm
Office of Educational Research and Improvement. (2001). Statistical highlights of student
achievement. Retrieved October 5, 2004, from the U.S. Department of Education Web
site: http://www.ed.gov/offices/OERI/casl/casl_stats.pdf
33

Price, J. E., Rath, J. N., Leschensky, W., Malloy, C., & Alban, Y. (1997). Glencoe pre-algebra:
An integrated transition to algebra and geometry (Teacher's wraparound edition). New
York: Glencoe/McGraw-Hill.
Recording for the Blind & Dyslexic, Incorporated. (2004). Guidelines for reading mathematics.
Princeton, NJ: Author.
Rothberg, M., & Wlodkowski, T. (2000). Making educational software accessible: Design
guidelines including math and science solutions. Retrieved November 12, 2004, from
http://ncam.wgbh.org/cdrom/guideline2000/
Shute, V. J. (1993). A comparison of learning environments: All that glitters... In S. P. Lajoie &
S. J. Derry (Eds.), Computers as cognitive tools (pp. 47–74). Hillsdale, NJ: Lawrence
Erlbaum Associates.
Shute, V. J. (2004). Towards automating ECD-based diagnostic assessments. Technology,
Instruction, Cognition, and Learning, 2(1), 1–18.
Shute, V. J., Lajoie, S. P., & Gluck, K. A. (2000). Individualized and group approaches to
training. In S. Tobias & J. D. Fletcher (Eds.), Training and retraining: A handbook for
business, industry, government, and the military (pp. 171-207). New York: Macmillan.
Singley, M. K., & Bennett, R. E. (2002). Item generation and beyond: Applications of schema
theory to mathematics assessment. In S. Irvine & P. Kyllonen (Eds.), Item generation for
test development (pp. 361-384). Mahwah, NJ: Lawrence Erlbaum Associates.
Snow, R. E. (1992). Aptitude theory: Yesterday, today, and tomorrow. Educational Psychologist,
27(1), 5–32.
Thompson, S. J., Johnstone, C. J., & Thurlow, M. L. (2002). Universal design applied to large
scale assessments (NCEO Synthesis Rep. No. 44). Retrieved October 27, 2003, from the
National Center on Educational Outcomes Web site:
http://education.umn.edu/NCEO/OnlinePubs/Synthesis44.html
Thompson, S. J., Thurlow, M. L., Quenemoen, R. F., & Lehr, C. A. (2002). Access to computer-
based testing for students with disabilities (NCEO Synthesis Rep. No. 45). Retrieved
February 6, 2004, from the National Center on Educational Outcomes Web site:
http://education.umn.edu/NCEO/OnlinePubs/Synthesis45.html
Tobias, S. (1994). Interest, prior knowledge, and learning. Review of Educational Research,
64(1), 37-54.
34
Notes
1 In general, adaptation (or adaptive capability) refers to the system’s ability to adjust itself to
suit particular characteristics of the learner while adaptable (not the focus here) refers to
applications that can be configured by a user.
2 The term e-learning used in this report stands for electronic learning and refers to the delivery
of any instructional or training program by means of interactive computer-based technologies,
especially where networking or distance communications are involved (e.g., distance learning
or Web-based learning).
3 The term task refers to the question, which elicits or prompts an answer or response. The terms
task and item are often used interchangeably in this report.
4 The text is reprinted with permission from Recording for the Blind and Dyslexic, Incorporated,
National Headquarters, Princeton, NJ 08533, © 2004. All Rights Reserved. ®, (tm),
“Recording for the Blind & Dyslexic,” “RFB&D,” “Learning Through Listening,” the Heart
and Headphones Design, and all trademarks and trade names are proprietary to Recording for
the Blind & Dyslexic, Incorporated.
5 In Figure 2, within the Evidence Models box, there are two smaller boxes: Stat Model (on the
left) and Evid. Rules (on the right). In the small box labeled Evid. Rules, the squiggly figures
represent actual behaviors, which are linked to specific observables denoted as shaded boxes.
6 In addition, there can be other levels in between the individual states and the global (parent)
node. For example, theoretically, one could be interested in assessing students’ knowledge of
state capitals by region (e.g., “mid-Atlantic states,” “New England states”). The student model
would reflect this hierarchy, and evidence would be collected and “rolled up” to answer
questions at different levels.
7 The organizational structure and vocabulary used in the texts varies. Some texts cover
arithmetic sequences in chapters on addition and subtraction and geometric sequences in
chapters on multiplication and division, while other texts include distinct chapters on
arithmetic sequences, geometric sequences, and other common types of sequences. Glencoe's
Pre-Algebra text (Price et al., 1997) and the Math Advantage text (Burton et al., 1999) fall
into the latter category. Furthermore, the term sequence is not used in all the texts. Some texts
35
refer to patterns, while others discuss arithmetic sequences in the context of linear growth and
decay and geometric sequences in the context of exponential growth and decay.
8 In cases where we do not know in advance the prior distribution, we assign values of about 1/3
for each of the three possible states (.33, .33, .34).
9 In Figure 4, the 32 proficiencies represent the children of the following main nodes of
Sequences as Patterns, Arithmetic, Geometric, and Other Recursive sequences.
10 Validity is arguably the preeminent technical consideration in the development of assessments
of any kind. The Standards for Educational and Psychological Testing have defined validity
as the “degree to which accumulated evidence and theory support specific interpretations of
test scores entailed by proposed uses of a test” (American Educational Research Association,
American Psychological Association, & National Council on Measurement in Education,
1999, p. 184).
11 For a more in-depth ECD-based analysis of the impact of accessibility features on validity, see
work by Hansen, Mislevy, and Steinberg (Hansen & Mislevy, 2004; Hansen, Mislevy, &
Steinberg, 2003; Hansen, Mislevy, & Steinberg, in press; Hansen, Mislevy, Steinberg, Lee, &
Forer, in press; see also National Research Council, 2004, pp. 103-122).
12 Another relevant piece of evidence for this assertion is the fact that we do not consider the
ability to decode (decipher words from characters) to be part of “knowledge of sequences.” If
decoding were defined as being an essential part of that construct, then use of an audio
accommodation would threaten the validity of the assessment. Specifically, the audio
presentation reads whole words at a time, thereby reducing or eliminating need for the student
to demonstrate their decoding ability.
13 Of course, ensuring valid assessment result depends on many other factors as well, such as
having adequate practice and familiarization materials and adequate time. We do not view the
ability to work quickly as an essential part of the construct of “understand[ing] sequences as
patterns.” Furthermore, we recognize that a person who is blind and using tactile or audio-
tactile graphics is likely to require more testing time than a nondisabled person receiving the
test under standard conditions. Thus, we believe extra testing time to be an appropriate testing
accommodation.
36

14 Hard-copy braille versions of all test content is another access method. Yet many individuals
who are blind do not read braille or have very limited braille literacy.
15 Generally, an audio-tactile graphic system may be programmed to invoke any other system
event at the touch of the user.
16 Tactile graphics and braille are critical in making such content accessible to deaf-blind
students (Rothberg & Wlodkowski, 2000).
37