designing cell phone games - gro · writing and editing: jennifer knudsen, ken rafanan, phil vahey,...
TRANSCRIPT


Designing Cell Phone Games
Copyright <D 2006 by SRI International.
This material is based upon work supported by the National Science Foundation (NSF-O437861)Any opinions, findings, and conclusions or recommendations expressed in this publication arethose of the author(s) and do not necessarily reflect the views of the National ScienceFoundation.
The project is a collaboration among
Center for Technology in LearningSRI InternationalPrincipal Investigator: Jeremy Roschelle
The Charles A. Dana Center at the University of Texas, AustinCo-Principal Investigator: Bill Hopkins
University of Massachusetts, Dartmouth
Co-Principal Investigator: Stephen Hegedus
The University of Texas at AustinCo-Principal Investigator: Susan Empson
Virginia Polytechnic Institute and State UniversityCo-Principal Investigator: Deborah Tatar
Writing and Editing: Jennifer Knudsen, Ken Rafanan, Phil Vahey, Gucci EstrellaEditing and Document Management: Ken Rafanan, Gucci Estrella, Rebecca Moniz, Meredith IttnerDesign: Ken Rafanan, Lynne Peck TheisEditorial Advice: Jeremy Roschelle, Deborah Tatar, Bill Hopkins, Jim KaputThis unit is inspired by and based on the work and ideas of Jim Kaput.

Contents
Unit Overview TN1
Lesson Plan Day 1Working at TexStar GamesCell Phone Games and DesignYari, The Yellow School BusOur First Cell Phone Game
TN31234
TN46
Lesson Plan Day 2
Controlling Characters with Graphs: Texas Road Rally
TN51016
Lesson Plan Day 3Controlling Characters with EquationsOne to Another
TN6151620
Lesson Plan Day 4Controlling Characters with Equations (question 5)One to AnotherBetter Games
TN?24
Lesson Plan Day 5Wendella's Journey: Moving at Different Speeds
Lesson Plan Day 6Money Matters
TN829
TN93334
Lesson Plan Day 7
Mathematically Speaking: Graphs to KnowCrab Velocity
TN1038
Lesson Plan Day 8Wolf and Red Riding Hood
TNLesson Plan Day 9Secrets of Average Rate RevealedProblem SolvingProblems From the TexStar Lunchroom
TN124652
Lesson Plan Day 10
Mathematically Speaking-Linear Relationships: Proportional and NonproportionalTexStar Games: Going Full-Time
11404244

Unit Overview-
This unit focuses on linear functions. It places them in a context of proportion and nonproportionalfunctions. It shows how linear functions can be used to model situations and solve problems involvinga constant rate of change: from motion to money. Informal uses of slope concepts are introduced tocompare rates visually (steeper Ifaster connection, for example). It also explores methods for writingequations based on situations, tables and graphs and the connection among them.
TEKS Addressed(1) Within a well-balanced mathematics curriculum, the primary focal points at Grade 8 are using basicprinciples of algebra to analyze and represent proportional and non proportional relationships andusing probability to describe data and make predictions.
(2) Throughout mathematics in Grades 6-8, students build a foundation of basic understandings innumber, operation, and quantitative reasoning; patterns, relationships, and algebraic thinking;geometry and spatial reasoning; measurement; and probability and statistics. Students use concepts,algorithms, and properties of rational numbers to explore mathematical relationships and to describeincreasingly complex situations. Students use algebraic thinking to describe how a change in onequantity in a relationship results in a change in the other; and they connect verbal, numeric, graphic,and symbolic representations of relationships.
(8.3) Patterns, relationships, and algebraic thinking. The student identifies proportionalrelationships in problem situations and solves problems. The student is expected to:
(A) compare and contrast proportional and non proportional relationships; and
(8) estimate and find solutions to application problems involving percents and proportionalrelationships such as similarity and rates.
(8.4) Patterns, relationships, and algebraic thinking. The student makes connections amongvarious representations of a numerical relationship. The student is expected to generate a differentrepresentation given one representation of data such as a table, graph, equation, or verbal
description.(8.5) Patterns, relationships, and algebraic thinking. The student uses graphs, tables, andalgebraic representations to make predictions and solve problems. The student is expected to:
(A) estimate, find, and justify solutions to application problems using appropriate tables, graphs,
and algebraic equation...
(8.2) Number, operation, and quantitative reasoning. The student selects and uses appropriateoperations to solve problems and justify solutions. The student is expected to:
(0) use multiplication by a constant factor (unit rate) to represent proportional relationships; forexample, the arm span of a gibbon is about 1.4 times its height, a = 1.4h.
TN 1Designing Cell Phone Games: An 8th Grade Unity on Linear Functions-Teacher Notes

MaterialsStudent workbooks
Computers, at least one for every 2-3 students, with SimCalc software installed. Internet acce~ss is not
required.
Computer with large display for teacher
Straight edges
Helpful: colored pencils, graph paper, calculators
Computer UseWhole class discussions... 1 computer with large display visible to all
Group Work... 1 computer for every 2-3 students
Homework Dependent on activity
The ideal is to have a set of computers in your classroom (laptops are ok) that you can set up forgroupwork and put aside during whole class discussions. A computer lab can be used.
Before the first class, run the software (SimCalc Mathworlds) as if you were a student. Take note ofhow long it takes to load the program and where students can locate the user files. If you wantstudents to save their work, give them instructions on where they can store their files.
General Teaching Tips.Encourage explanations of ans.wers. When students give number answers, ask, "How do you
know that?"
.Promote inquiry. Encourage other students to ask questions of each other when anotherexplanation does not make sense.
.Balance whole class work with individual and group work. Students need both. Sometimes ithelps to start with open-ended work where they have to figure out what to do. But, if they don'tknow how to start AT ALL, some whole class work first can help.
.Let students do more talking than you do. Even in whole class mode, let students answer thequestions and challenge the arlswers others give.
.Make sure you specify the time for whole class discussion so you don't have to try to pry kidsaway from using the computers.
.Allocate additional time for students to become familiar with the MathWorlds software duringthe first class.
.Adjust your pace to the needs of your students. The pacing guides presented in subsequentpages do not take into consideration specific needs and constraints in some classrooms.
Using this Teacher Guide.Suggested lesson plan pages precede student activity pages.
.Student activity pages have hand-written answers and are keyed to the lesson plan.
.Extension activities are also inc:luded in some notes.
Designing Cell Phone Games: An 8th Grade Unity on Linear Functions-Teacher Notes TN 2

Lesson Plan Day 1
Big Ideas.Context of the unit: the mechanics and business of cell phone game design, such as how to
design components of a game and computing salary and savings.
.Motion can be represented on a graph of time vs distance.
.Idealized motion on a time-distance graph appears as a straight line. (HINT: This is a stepping
stone to averages.)
."Steeper" lines represent higher speeds.
Notes
Working at TexStar Games
Cell phone Games and Design
1. Have students read the text aloud.2. Ask questions to make sure they understand the basic context.3. Explain that in this unit, we do the math to set up the games. We won't see the final game, but
students should imagine how it might work. Students also learn about how and how muchmoney game designers make.
4. Wherever possible, the numbers in this unit are realistic. We got them from real designers and
design companies.5. If possible, show a real cell phone game in the "moving character" genre. This is the kind of
game we are developing in this unit.6. Introduce the SimCalc software.
a. Walk students through opening the student files and saving their work, if applicable.b. Point out the 4 windows available: simulation, table, graph and equation.c. Remind them that the sheet with quick commands is in their workbook.
Yari, the Yellow School Bus1. Ask students: If you give a wheeled toy a push across the room, when will it go fastest?
Slowest?2. After watching the movie, elicit "changing speed."3. Have students graph a number of points using the stop action buttons on the movie.
Our First Cell phone Game1. Emphasize: Rita, the new character, is a SIMULATION of the real toy in the movie. We simplify
the motion so that we can work with line graphs.2. For Question 1: Students should make the connection between total distance, total time and
speed. This is probably familiar territory.3. For Question 2: Focus on the whole line, i.e., set of points. Get a qualitative explanation.
a. Standard: "As the graph builds, the y axis shows the same number as the "ruler" in the
simulation."b. More sophisticated, optional: "the line is slanting up because as the bus moves along
both time and distance get bigger (are increasing.)"4. For Question 3: Using the table, build correspondence between overall speed and the rate
distance/time at EVERY point on the line. This begins building the idea of constant rate.
TN 3Designing Cell Phone Games: An 8th Grade Unity on Linear Functions-Teacher Notes

Welcome to the headquarters of TexStar Games, Inc
We make games for cell phones-teens love them!
Other game design companies are cutting into our business so we need to make
improvements. That's why you have been hired.
To make TexStar Games more competitive you will
.Use mathematics to analyze our game designs; for example, determine how to
make characters move across the screen.
.Analyze our business.
This will require a lot of mathematics. Now's the time to learn it! With the materials
in this book, you will learn about functions, both proportional and nonproportional.
You will also learn the "real truth" about average rates. And you will understand the
connections between tables, graphs, and algebraic expressions. Don't worry, it will all
be clear by the time you are done!
All this math will help us in our business, but you will also use it in later math classes
and in your life. Keep that in mind as we move ahead.
Designing Cell Phone Games 1
A few facts about cell phone game design
will help you in this unit.
Electronic games-on cell phones, onconsoles, on computers-all must bedesigned (created) by a team of people.The team works together, but there aredifferent jobs to do.
Designers come up with ideas for gamesand rules for how the game will work. A
designer must think about how realisticthe game is and what rules will make the
game fun and just difficult enough. Math
is used in doing this.
Programmers take the ideas and turn
them into games. They use mathematics
and logic to write programs.
Artists make the images you see on the
phone as you play. They must use math
to think about how big to make the
images on the screen and how much
room their art will take up.
Business staff make sure the business is running smoothly. They are in charge of things
like employee salaries and tracking how much money the company is saving and
spending.
Cell phone designers, programmers, and artists get paid for their work in different
ways. Sometimes all these people work for a company like TexStar Games, and they
get a paycheck every month. Other times, the programmers, designers, and artists
work on their own and get paid for each piece of work they do.
The cell phone business is growing, and it's likely that more designers, programmers
and artists will be needed in the future. Knowing math helps.
2 Designing Cell Phone Games

Yari, The Yellow School Bus
TexStar Games is working with a traditional windup toy company
to design new games for younger kids. We need to analyze the
motion of the real toy. Then we can make our cell phone version.
Our partner's best selling toy is Yari, The Yellow School Bus.
1. Watch the movie of the actual windup toy -Yari, The Yellow
School Bus-moving along a centimeter ruler. Open the file
Yari.swt. Run it several times. Answer the following:
A. How many centimeters (cm) did Van travel? 100 em
B. How many seconds did Van travel? 10 Jlee..6()d,.r
C. Using A & B, calculate Yari's speed (how fast Yaritraveled) for this trip. 100 om 10 am
-, neCilii:: ~I 11"'e(!1JYJ4rD. Explain how your answers for A, B, and Care
related.
2A. In the movie, when did Yari go
fastest? (circle )Beginning End
2B. In the movie, when did Yari go
slowest? (circle your answer.
Beginning Middle
3. Using the movie and stop action, fill in the table and make the graph.
seconds1
2
3
4
5
7
10
cm
.s~«3aT
M83~
Designing Cell Phone Games 3

Our First Cell Phone Game
Our programmer has made our first cell phone game. It has a picture of Rita, The Red
School Bus, which is used in the game.
We want to compare the motion of the classic windup toy Yari to our character in the
cell phone game named Rita, The Red School Bus.
1. Open the Java MathWorlds file named FirstGame1.smw. Use the play button to
watch the trip of the character in the simulation and the graph. Run the simulation
as many times as you need to answer the following.
A. How many centimeters (cm) did Rita travel?
B. How many seconds did Rita travel?
C. What was the Rita's speed?
2. Using step and play, watch how the graph builds as the character moves. Explain
how the graph and the simulation are related.
-When the 9raph \r'how~ Cl ~'peCi~'C dl".rfanae)
thaI ~ how fbt Rifq ha..r jone in the \p,mulah'Ofl.
3. Complete the table below:
seconds1
2
3
4
5
7
10
/
110r
100
_90
E80U-70
~60C 50/U
.~ 40
"C 30
20
10
0 4 5 6 7 8 9 1011121314
time (seconds)
cm
-1Q:.~~
~~~100
4 Designing Cell Phone Games

4. Describe how
A. the trips of the cell phone character and the real windup toy are the same.
the ~a me d { t fa nce Inamounf hOme.J'ame
B. the trips of the cell phone character and the real windup toy are different.
afthe mDve...r
Designing Cell Phone Games 5

ActivitiesControlling Characters with+ - R d R I",exas, oa air
Big Ideas.Graphs are mathematical representations of relationships such as motion.
.Graphs of motion show characters' start position, speed (relative) and places where charactersmeet.
.For graphs of motion, i.e., time v. distance: the steeper the line, the faster the motion.
Notes I
Introduction
.Road Rally Game-cars move across a map of Texas, city to city, as in a real road rally.Explain that we are making the graphs to control the motion of the cars, setting up the maththat will make the game work.
Question 1 (5 minutes)
.Help students connect distance/time and "slant of line" as two ways to find the speed of a car.
Question 2 (20 minutes)
.Axes labeled for students.
0 Sketch graph mean~ draw the basic shapes. Showing the relative slants of the lines isthe important part. i
0 Speed is position/ time-needs units to be meaningful. Miles per hour, etc.
Question 3 (20 minutes)
.Have students draw graphs in workbooks first, then check in SimCalc. (20 minutes)
0 Each problem has many solutions.
0 Can establish (informal) foundation for slope and y-intercept, and intersection of lines.
0 Can skip E if needed; parallel lines not essential to unit.
EXTENSION: Ask about what parts of a car's motion we can predict by looking at its time vs.distance graph. This summarizes and sets up the next lesson on equations. (5 minutes)
TN4Designing Cell Phone Games: An 8th Grade Unity on Linear Functions-Teacher Notes

Cantrall i ng Characters with Graphs:Texas Road Rally
We need to set up the mathematics
controllers for the new game, Texas Road
Rally. We can use graphs to control motion.
Remember: we'll make the game cool later!
In road rally races, cars compete as they
travel from town to town.
1. Open Roadrally1.smw. It shows the Yellow Rose team car in the Texas Road Rally.
The car starts in El Paso and stops in Big Spring. Run the file, watching the
simulation and graph.
A. When the car stops, how far has it traveled and how much time has passed?
a 50 mi/e..s' J '1 hourl.,f
B. When the car has traveled for one hour, how far has it gone?
50 mile~C. How fast is this car going? Explain how you know in two ways. Think about your
answers to A and B or use other ideas.
50 m,'/e..r per hour-(D Rec,dif>.fJ from the jraph, yd7..1 con ree thaI the COr 1rQvelt'd.so /11,Ye-r II') I h,tty.
@ 350miJ~ -~ mlJ~ .: 50 mIJe.rjhY' I't'~.sv mph.,hDU~ -I hDUY'
D. Change the speed of the car using the graph window. It still must start in
El Paso and stop in Big Spring. Use the same ideas to find the new speed.
What is the new speed?
< An.rwt.f.C' 1(11/ rorJ buf 'IiIe,!raph fflT'V1Jd 1.('10(141 ()and end of d50 l1J,fe", >
6 Designing Cell Phone Games


3. Below are ideas to use in other games. Please help our programmers by drawing
graphs on the axes provided. Test out your graph using Roadrallytest3.smw. Make
up your own characters for the Green Iguana and Blue Sky team cars. Note: There
is more than one way to draw the graph tor most ot these.
A. Draw a graph of a race in which the Green Iguana and Blue Sky team cars start
at the same position and travel the same distance but at different speeds.
< galY)ple !rn!:Y(U > Ca.r"'C-A\.. Fe-ATU~5:./ Both endpo'nf.r have.
the ,"orne y~~~(.t V'Qlue
('t,y)
/VIIII
E /
/'
,/,.
hours
B. Draw a graph of a race in which the two characters start at the same position
and travel the same amount of time, but Green Iguana is faster than Blue Sky.
Designing Cell Phone Games8
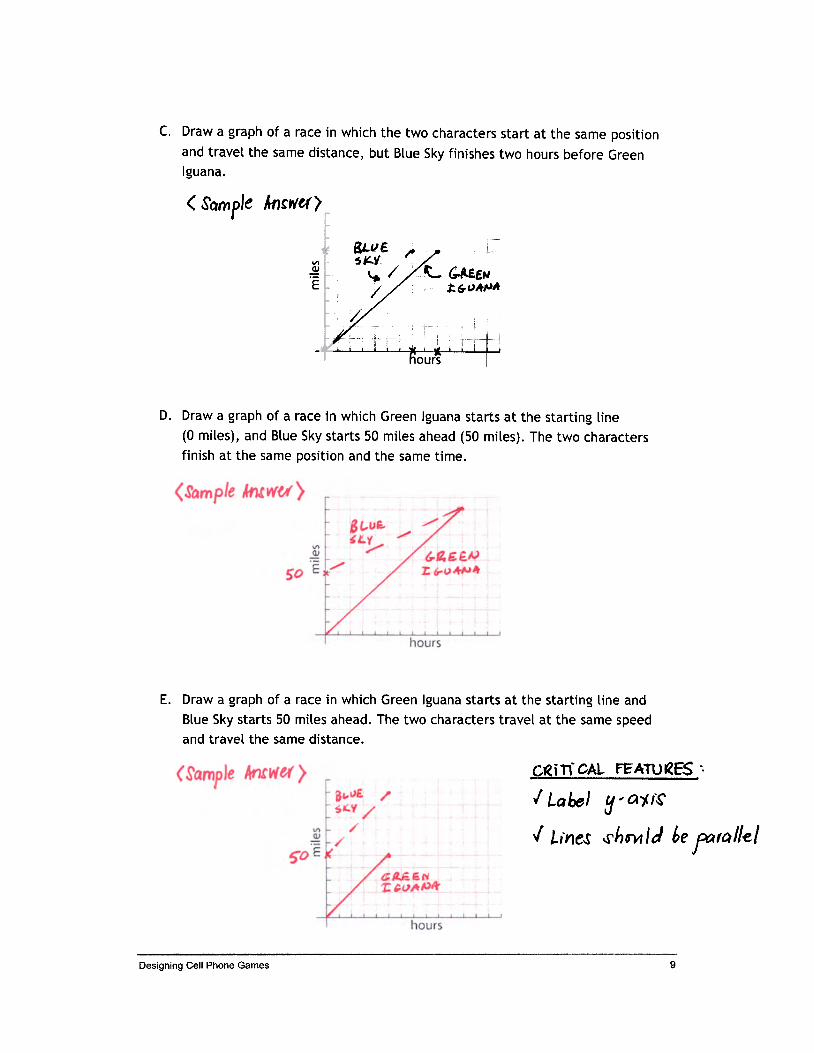
c. Draw a graph of a race in which the two characters start at the same position
and travel the same distance, but Blue Sky finishes two hours before Green
Iguana.
< Sot1rJple Jnrwtt>
'".S!-
'§:
-8
BLIl£ ~S;:"'/ /
I.,./
D. Draw a graph of a race in which Green Iguana starts at the starting line
(0 miles), and Blue Sky starts 50 miles ahead (50 miles). The two characters
finish at the same position and the same time.
E. Draw a graph of a race in which Green Iguana starts at the starting line and
Blue Sky starts 50 miles ahead. The two characters travel at the same speed
and travel the same distance.
c.~in'CAL. fE'ATU~ES'.
f Label y ~ Q'j/~
"Line.! ..rhr"ll1/d be,.F'Ql/el
D'~signing Cell Phone Games 9

Lesson Plan Day 3
Big Ideas.EqlJations, also known as algebraic expressions, are another form of mathematical
representation. Graphs and tables are other forms.
.EqlJations can be written based on tables. (The process will be presented in this activity
.YOlJ can "translate" between graphs, tables and algebraic expressions.
Notes
Controlling Characters with Equat;ons
Introduction
Robot ~~ame: players use remote-control robots to open doors, detonate bombs, etc.
Question 1 (10 minutes)
.Accept all answers; this sets up the process they learn next.
.Students should observe the connection between the table, graph and equation.
.Enc;ourage students to make their best guess on how they can write equations themselves.
Question 2 (25 minutes)
.Guide students as they discover how to write equations from tables.
0 Identify a pattern in the table, relating each pair in a row.
0 Write the rule numerically for several rows.
0 Use variable names to express the pattern algebraically.
~ IMPORTANT NOTE: the method presented above is based on the assumption that the function
represE!nted is a linear one. It doesn't "go crazy" for numbers not on the table.
Question 3 (10 minutes)
.Stul:tents practice the method just developed.
.You can develop more practice items by having students change the lines in the file,
gliderhal.mwQuestion 4 (5 minutes)
.Surnmarize the method for writing equations from tables.
.Ask kids to identify what K represents and the process that the equation represents.
.Rernind students: y = Kx.
Question 5 (Give as homework if there is not enough time.)
.Use this as a challenge or practice. Apply previously learned methods to problem solving.
EXTENISION: Have students draw corresponding graphs and pictures for
.timE~ and position relationship
.non-motion relationship such as money in the bank, expressed as dollars over time
One to Another (homework or ;n class)Practict3 for "translating" between graphs, tables and equations.
TN 5

Activities
Big Ideas.Re~lresentations can be "translated" from one to another: word, graphs, tables, equations.
.y=kx+b, where b t 0 is the commonly reclJgnized notation for linear functions with non-zero
intercepts.
.In motion contexts, b is typically the starting point.
Notes
Controlling Characters with Equations, question 5 and One to Another
.Re\l'iew homework, i.e., question 5 of Controlling Characters with Equations and One toAnother, this by having students' share their solutions and explain why they think they are
right. (10 minutes)
Better Games
Introduction
.Thi!; is another Robot game. Retro-arcade means the robots move in a straight line, facingobstacles.
.Using the same methods as in the previous lessons, students develop equations for linearfun(~tions with non-zero intercept.
Questions 1-2
.Help students connect characters' start position with the number at which the line crosses y-axi~i. (Y-intercept, but unit does not use the term)
Questicln 3
.Help students develop process for writing questions of the form y=mx+b
.Linlc this to processes in earlier lessons.
Question 4
.Students connect graphs and equations directly.
.It's OK to have students make tables to help, if needed.
TN 6Designing Cell Phone Games: An 8th Grade Unity on Linear Functions-Teacher Notes

So far, our graphs of moving characters have shownthe relationship between time and position-wherethe character is at what time.
Equations show that same relationship with numbersand symbols. This means: give us any time, and we
can find the position of the character at that time.
'II'e need to be able to control our characters withgraphs as well as equations (also called algebraice:Kpressions). The equations are so efficient!
Let's work on a game with robots. We need to set up
the mathematics to make our robot move at different
speeds.
1.. Open Shakey.smw, which shows Shakey the Robot.
A. Run the simulation. How fast is Shakey going? How do you know?
L/ Om
40 am In
10 Designing Cell Phone Games


D. Change the graph so that Shakey moves slowly. Write down the table and
equation for each graph. Then make Shakey move fast and write down thenew information. < ANSW~S WiL.\,. "~1()
Slow Shakey
Graph Table Equation
x (seconds) y (cm)
0
1
2
~ 3
4
5seconds 10
Fast Shakey
TableGraph Equation
x (seconds) y (cm)
0
1
2
Ev
3
4
5
seconds 10
Describe how to write an equation if you have the table and graph that go with
it. Use the tables, graphs, and equations above to help you.
If you are not sure yet, just make your best guess.
E
'Wi I.. L.. VAf'l.1(>< AN ~W ~£;
Designing Cell Phone Games12

2. Let's try another way to learn how to write equations from tables. No more
algebra and table windows to help! Open Roberta.smw.
A. First, fill in the p column in the table below.
Fill in the mathematical rule to get p, when you know t.
Roberta
t
(time in
seconds)
Rule to get p p
(positionin cm)
1 st: Describe the pattern in thetime column.
2nd: Describe the pattern in theposition column.O~80
1
2
3
0
8" 3rd: Use those patterns to find
the relationship thatconnects the time and theposition in each row.
~"~~80
4
5
10
~ 8t
B. For every second that Roberta travels, how many centimeters does the robot
move? 8 cm
At what rate does Roberta move?
8 (!m per lI'eoond
How does this rate relate to your rule?
r~ en P, lnuHljOlJ t T/-me..r 8Describe the pattern in the position column.
The CD/umn in(? rtatt.c ,n frJU Jl,plecr 4/ 8Use those patterns to find the relationship that connects the time and the
position in each row.
Po, ertr,y / fl,(J1 i incre4,rec. p i,e;ft4,ft.r ~ 8c. Write the equation that will work for any row that could be in the table.
I p= Bt
Designing Cell Phone Games 13

3. Open Gliderhal.smw. Go through the same steps as in Question 2 to find the
equation for these two robots' motion.
Glider
t (time
in
seconds)
Rule to get p p
(positionin cm)
1 st: Describe the pattern in thetime column.
2nd: Describe the pattern in theposition column.
0 K .?()0
1
2
0
~O40 3rd: Use those patterns to find
the relationship thatconnects the time and theposition in each row.
,()AD
lQQ.elOO
p
3
4
5
10
~e10
t
Hal
t (time
inseconds!Rule to get p
1 st: Describe the pattern in thetime column.
0 ~ '~.6'0 2nd: Describe the pattern in theposition column.
p
(positionin cm)
0!
,~.S
'=~M~
!~IL!
--~Q:-!- ~-;~~.§.~~
P i
1
2
3
4
3rd: Use those patterns to findthe relationship thatconnects the time and theposition in each row.
5
10Equation:
p==-
~ /,1.5t
4. Explain, in your own words, how to use a table to find an equation that represents
a character's motion.
<~MR.~ 114~~) nf')a' ihe rIlle 'HJaf fe/ala i /0 P
Then /(Jr;/-e ~ (ule ,n .r;,mbok "'tiny p=-_-t
14 Designing Cell Phone Games

5. Use what you have learned to help Monica figure out the relationship between her
salary and the time (number of months) she works.
Monica is one of TexStar's best programmers. Every month, she earns a salary
of $8,200. The programming team took the weekend off-they only left us a
blank table to use. So, you have to do most of the work this time.
Make a representation (graph, table, or equation) so that she can choose any
month (where January is month 1) and find out how much she has earned so far
that year.
Equation: 8, ~DO ms --
Designing Cell Phone Games 15

One to Another
You have seen how graphs, equations and tables can each represent a character
moving at a certain speed. Now complete all the representations for each speed or
rate. The axes of each graph are labeled for you.
You can use any variable when writing equations. In "Controlling Characters with
Equations," we used t for time and p for position. In most, we used x and y. Name
your own variable for each situation below. Just make sure that you use the same
variables in your table and equation.
1. A toy robot moves on average 4 centimeters every 2 seconds.
Table Graph Equation
(-c1)0
(seconds)
0
Y=o?~
IIg24! < T46L~ 'iALVf"S .V4rtiAB~~ NAMES wiLL VM.,. ')
-16 ' Designing Cell Phone Games

2. A sloth moves on average ~ meters every ~ second.
Table Graph Equation
t(seconds) ~
0 0
p =.5 t
3060
< T ASLE '/A\.VfS WiLl. V'~71 >
3. An Australian Tiger Beetle runs on average 2.5 meters every ~ seconds.
Table Graph Equation
~(seconds)
!
E-c:0
or;°;;;00..
0 01j:
ti~ (seconds)30 15
VA\..\'~S ~ ¥AtZ.iAroL.f NAMES vlrL.\.. V~~)< TA&lE
Designing Cell Phone Games 17
IS
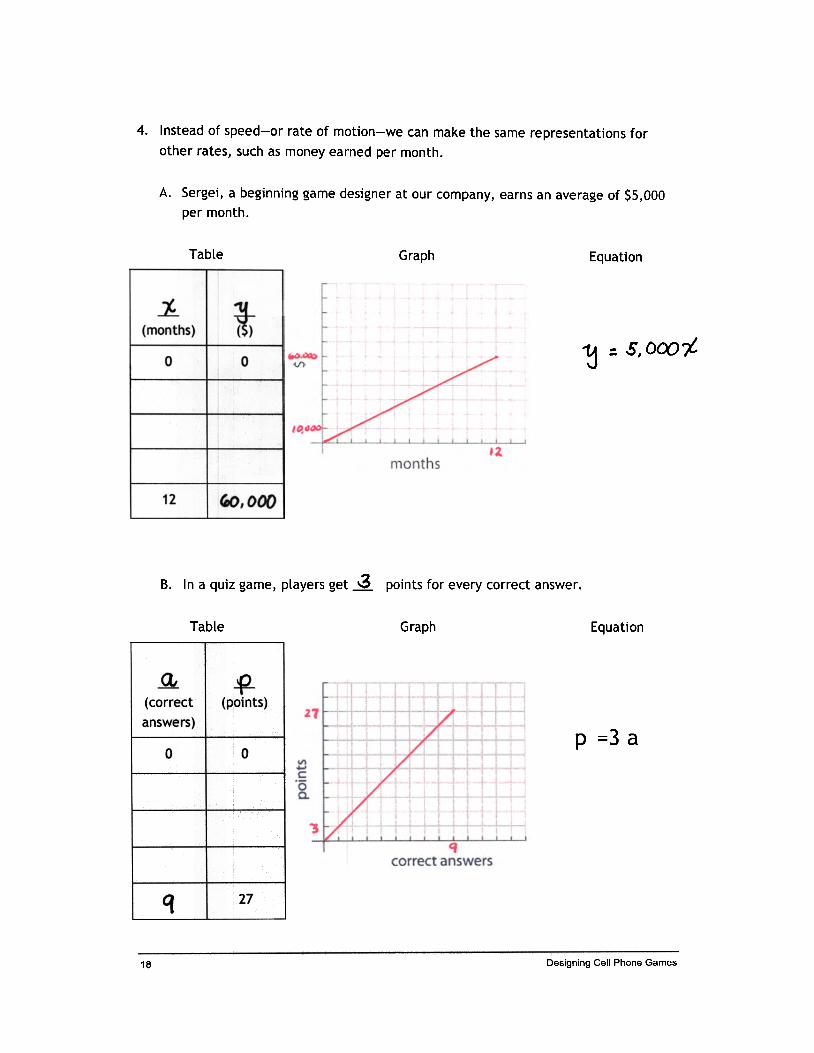
4. Instead of speed-or rate of motion-we can make the same representations for
other rates, such as money earned per month.
A. Sergei, a beginning game designer at our company, earns an average of $5,000
per month.
Table Graph Equation
~(months) ~
1j
= 5, ooo"t0 0
12 (DO,GOV
In a quiz game, players get ~B. points for every correct answer.
Table Graph Equation
~(correct
answers)
~(points)
P =3 a0 0
27'f
Designing Cell Phone Games18

5. A toy car moves A meters every second.
Table Graph Equation
~(m)
-P-(seconds)
0 0
E-c:0'P
'§ 'I0.)
t(
~:
...
./
16 4
time (seconds)
6. A helicopter flies up into the sky at 5 meters per second.
Table Graph Equation
~(m)
~(seconds)
$'000
E-c:0'p.-
V)
0Co
",~ ;I .i i i i i i i i 1"0 i .i .
time (seconds)is 75
19Designing Cell Phone Games

Better Games
We need to make mathematical controls for Reynaldo,Bommakanti, and Geneva, who will be used in a retro arcadegame for cell phones. The equations are more complicatedbecause these characters all start at different places.
Open Better1.smw.
1. Run the simulation. Predict what the graph will look like for
each character's motion, by sketching three lines on the
axes below. Don't forget to label your lines.
Eu
seconds
2. Now open the graph window. Run the file several times. Pay attention to the graph
and the simulation and how they work together.
A. Was your prediction right? Explain why or why not.
< ANS""'~$ 'WiLl. V/I<fJ.'Z( >
B. Where did each character begin its motion? How does the graph represent this?Somma kan-/;i : OCIn j Rt'!jno/c:/(): SOM i Ge/leva :: 10 om,
The graph .soh~-w..,f "",here t4oJ1- eJ,Qra6kr be[l"/l! aI Time 0C. What is the speed of each character?
Bomma:kanol,': 8 OM pe-r Jet i Re;,nQIJo: 6em per .rea; G'tneva: 4',5 am pet m
Which character was fastest? B o-mmakant I'
Which character was second fastest?
Which character was slowest? GemvQ"
D. How did you know which character was fastest?
rk .ritepet' lIne replt.renf~ 'fht {as/(;,( o-nafotfet"20 Designing Cell Phone Games

3. You can find the equations for these characters' movements, using the method we
learned in "Controlling Characters with Equations."
A. Let's start with Reynaldo. We want to find the mathematical rule to get p,
when you know t.
t(time inseconds)
Rule to get p p(positionin cm)
1st: Describe the pattern in thetime column.
a O~, +6 52nd: Describe the pattern in the
position column. II
/185
1
23rd: Use those patterns to find
the relationship thatconnects the time and theposition in each row.
5
10 '5pt~'+5t
B. For every second that Reynaldo travels, how many centimeters does he move?
How does this relate to your rule?
f6r~
C. Write the equation that will work for any row that could be in the table,
The equation for finding pwhen you know tis:
21Designing Cell Phone Games

D. Write the three steps from question 3C in your own words. Use the same steps
for Geneva and Bommakanti to find equations for their motions.
Geneva
I
(tim~ in
second~)
Rule to get p p(positionin cm)
D ~ 4.50 ~ 10 10
3rd:
2
3
4
5
10
t )C 4.5 ...10 p
Equation: T 10
Bommakanti
t(time inseconds);
Rule to get p p(Dosition
in cm) :
1st:
O't80 02nd:1
2
3
4
5
10
t ~t p
Equation: Btp =
22 Designing Cell Phone Games

4. For A-D below, use math to describe the motion for one character only. Do the
following:
Decide on a start position and speed for your character.
Fill in the equation that will go with it.
Sketch the graph that will go with it and label your axes.
Use the file, Better4.smw, to see if you were right. If you were not right,
correct your equation.
A.Start position:
Speed:
B.Start position:
Speed:
Equation: Equation:
-.Start position:
Speed:
D.Start position:
Speed:
Equation: Equation:
< AwS 'Wt~S Will. v~71 >Designing Cell Phone Games 23

Big Ideas.Multi-segment graphs can represent characters rnoving at different speeds.
.Graphs tell a story. Stories can be represented in the form of graphs. In this activity, studentswill learn to write stories from graphs and make graphs for stories.
."Flat" lines represent standing still.
.Lines "slanting downward" represent moving backward.
NotesIntroduction
.The cell phone game Wendella's Journey, which will be about a little dog traveling in a magicforest, slower or faster depending on where she is.
.Make sure students get the three modes of motion: forward slowly, forward faster, stopped
Question 1A (5 minutes)
.If needed, guide students as follows
.take each segment,
.figure out which mode of motion,
.then write a sentence about what happened.
.The story need not contain any numbers; encourage creativity
Question 2 (15 minutes)
.Students find speeds for each segment in a trip.
.Watch for students to develop the following ideas, and have them share with the whole class:
.For the second segment, the speed is 0 because she traveled for 2 minutes and didn't getanywhere (her position did not change)
.For the third segment, reading the coordinates at the endpoint will not work-must finddistance and time by counting boxes or subtracting.
Question 3 (5 minutes)
.Have students predict the motion before running the file.
.Help students build connection between "slanting downward" and moving backward.
* NOTE: Speed is calculated for each direction traveled, but the connection to negative velocity
comes in another activity.
Questions 4, 5 (15 minutes).Students practice connecting stories and graphs and how moving backwards is represented.
EXTENSION: Encourage students to create more stories and graphs, using Wendella or differentcontexts if they can.
TN 7Designing Cell Phone Games: An 8th Grade Unity on Lirlear Functions-Teacher Notes

Wendella's Journey:Moving At Different Speeds-.
In our game, Lost in the Pines, Wendella the
dog makes many journeys through the
magical Lost Pines Woods.
On her journeys,
Wendella moves
-Forward slowly when she is in the
swamp.
-Forward faster when she is on the
road.
Wendella stops and barks for help
when she is in quicksand.
We need many journeys and stories to use in our game. Help us set up the math and
tell the story for each journey. Your work is very important. Remember-you are doing
the math that will make the game work.
1. Open BUT DO NOT RUN the file for Wendella's first journey, Wendella1.smw.
Using the graph for this journey, predict how Wendella will travel. Finish the story
below.
24 Designing Cell Phone Games

2. Here is a different journey that Wendella took.
A. Mark on the graph below, show when Wendella was in the swamp, in the
quicksand, and on the road. Mark the times on the minutes axis.
B. For each line segment in the graph above, find the number of minutes
Wendella traveled, the number of meters she traveled, and her speed. You can
make a table to keep it all organized.
Choose one line segment in the graph-not the first one-and explain how you
found Wendella's speed for that segment.
c.
< AN s-W EVJ.~ 'VII i L. \.. y' /J«<.71 )'

3. Open the file Wendella3.smw for the third journey. The graph is also shown below.
A. Run the file. Wendella does something new here!
Write a story to go with Wendella's journey.
<S~"Z( S'ftOVL.~ iNCLVVE: eACK1'/~v M(9'ttQ~
~~~NCS SltioULP ~5:
B. What did Wendella do 6 minutes after starting this journey?
'V/ tndt lIa 'Wtni 1x~c-k'Vi/ayd..,r
C. How does the graph show this motion?
D. What is her speed between 6 and 8 minutes?
per flJlfJuteJDO
Designing Cell Phone Games26

4. Open the file Wendella4.smw, and do the following.
A. Change the graph so that Wendella goes forward and backward at least twice in
her journey. Run the graph to make sure it works.
B. Record your graph on the axes provided.
C. Write a story to go with this Wendella journey.
< AN~f4V~~ ""ill. \(~7f"
D. One of the programmers doesn't understand what is happening in the graph.
Explain how to use the graph to get Wendella to go backward in her journey.
&hOl,fld in
line ..r/anlu-fhe
27Designing Cell Phone Games

5. We need more journeys and stories. Using Wendella5.smw, make your own graph
showing Wendella's next journey. Sketch the graph on the axes. Write a story to
match your graph.
Story: 'r/iL.L< AN~~~
Designing Cell Phone Games28

50migutes
Big Idea.Multi-segment graphs show varying speeds in motion contexts.
.Multi-segment graphs can also be used in non-motion contexts to show rate of accumulation,for example.
NotesIntroduction
.The new context here is the business of TexStar games.
* NOTE: We use line graphs to represent the charlging balance of an account from month tomonth. The lines connecting the points for the monthly balance are basically meaningless. Butit makes sense to draw the line to show the shape of the graph. This is a common practiceamong both mathematicians and math users such as accountants.
Question 1
.Make sure students understand that balance refE~rs to the amount in the bank account.
.Help students interpret graph and table, highlighl:ing the connection between them.
.Running the file will show the balance changing month by month, which can help studentsmake sense of the graph.
.Keep asking: What is this part like in Wendella?
0 Increasing balance is like moving forward
0 Decreasing balance is like moving backward
Question 2
.Students apply lesson concepts to a new problem.
a Make sure students understand that the graphs show how often the two games are
played.
a Question A is similar to parts of question 1.
a For Question B: Ask for students' interpretation.
a For Question C: Either !~ame can be choEien, but the mathematical defense has tomake sense.
Designing Cell Phone Games: An 8th Grade Unity on Lirlear Functions-Teacher Notes TN 8

Money Matters
We're glad you helped us with some great designs for our cell phone games. But
TexStar Games has to make money too! Please help us with some business problems.
1. We keep a record of how much money we have in the bank. When we make money,
we add it to our bank account. When we spend money, we take it out of our bank
account.
The amount of money (in $) that we have in the bank on any day is called our
bank account balance.
On the last day of each month, we check our bank account balance and we
graph it, comparing month to balance.
Help us understand what happened to our bank account this year.
A. Open the file Bankaccount.smw, which shows our bank account balance over
the past year. Run the simulation to see how the bank account balance
changed from month to month. Using the graph, simulation, and tables, answer
the questions below.
Fill in the graph below.
~~c=~=:;)C)-=
.4-'
~~
j:f ~~."§;~::i!; ~::ftg ~ ~n"\ont:hs
Designing Cell Phone Games 29
1 50 r-
140'1301201101
10090
80:
70160;
I50;
;40'30
20
10
0:::: ~ ::; ~ ::; ~ ::; ::; ~ ::; ~ ::;

Find the following and explain how you know (from the graph, table, or
simulation).
Beginning balance.
toEnding balance.
.( '-5V J ODO
Months in which our balance
decreased.
February, Ih1fjut.!'t}
~e.p/~m he("
Months in which our balance
increased.
J anJ.1ar1:11 MQ'r~h.J JLlne I
.ILl ~, cPtfObe".-;, NbYth1ber I
OecemhuMonths during which the balance did
not change at all.
Month in which the balance was the
highest.
B. Write a sentence or two that describes what happened to our bank account
balance over the year. Make up your own explanations for what might have
happened. For example: The balance decreased between January and
February. This is because we had to pay for a lot of artwork for a new game.
~~ AWS\.tJ~S
C. Our goal was to have $60,000 in our bank account by the end of the year. By
how much did we miss our goal?
j
Designing Cell Phone Games30
Month with highest increase in
balance.

D. Our goal for next year is to end the year with $110,000 in our bank account. We
would like to put the same amount of money in the bank each month.
Complete the graph below to show this.
150140130~20110~OO
90
80
7060
"', .J'-"
40
30
20~O
'--"-.:;:;-~c=tog,.~C>
...r=---:.§.~
'~ ~ ~i ~ -:;~ ti ~ ;011';2;;; ~ ;;; ~ ;;; ~ ;;; ;;; ~ ;;; ~ ;;;~~ ~~!'~~ $~S ~~
months next year
0
E. Use the graph you made to answer the following questions.
How much money do we need to put in the bank each month to reach our goal?
How can we predict what our balance will be each month?
Designing Cell Phone Games 31

2. We have two new games, Texas Road Rally and Planet Eaters. Next month, we
want to start selling just one of them. To help us decide which one to sell, we let
kids in the Electronic Gaming Afterschool Club use our games for 14 days. At the
end of each day, we graphed the total number of times each game had been
played altogether.
1
1'">..ro"Q."UQ)+-'.!Po::)
E::)uuro
Legend
...Texas Road Rally
-Planet Eaters
A About how many times had each game been played after
.!!2C~ RMO «AL.\.",! (1'R;~).1 day? I « I( /3
Pl..ANET fA ~ ( PI:' )
6
4 days? <--'\0 ~O10 days? So
60
14 days?
'0
-10
B Compare the kids' use of the two games over the 14 days.
krcir used f'E for fI1e ..rQnJe f)l.4mb« CJ{ f1'me..r e.qcJ, ~.
Th~ (.fJ'(:d T~r<. a 101 frJore eac-h ~"1 for '/he P-'~ 4 da'lf"')bal- +hey ..tYlWed otown alkrwaYd\f.
tJreral/l the:y UJea ~ mort.C We care about selling games kids really like to play. Using the information in
the graph, advise us: Which game should we start selling next month?
Make your own decision, and defend it with mathematics. (There is no one
right answer.) <S'A"'~i ANSW~'>
a> Choose PE he caUJe. ,i 'WtU UJerl mIre OV"erall.
~ iR.tl. 1V'QJ f'fJDre fo£LI/at'need mDn~ fa.rl.
Designing Cell Phone Games32

ActivitiesMathematically Speaking: Graphs to Know Group work 20 minutes
Crab Velocit y .Grou p work 30 minutes,
Big Ideas.Velocity is speed with direction.
.Negative rates indicate backward motion.
.Position can also be negative, with 0 indicating some defined point such as a start line or waterlevel.
Notes
Graphs to know.Students build rapid graph interpretation skills.
.Help students make the connection between speed in motion context and rate of accumulationin non-motion contexts.
* Remember: each row should have a similarly shaped graph.
EXTENSION: Ask students to create contexts! stories that would yield graphs similar to thosepresented in the activity.
Crab VelocityIntroductionThe crab cell phone game will have crabs moving up and down out of the water, while players tryto catch them. We are creating the graphs and equations to control the motion of the crabs.
Velocity is described in the box. The idea will be developed in the activity.
* Revisit equations from Controlling Characters with Equations, if needed.
Question 1.Highlight for students that the absolute values (need not use the term) of speed and velocity
are the same.
Question 2.Crab2.mw shows five crabs: some are going up; some are going down; some have negative
start positions..Guide students in placing negative start positions in equations. Have students count squares
across the 0 line to get the rate of distance per unit of time-velocity- or m in y=mx+b.
EXTENSION: Have students write equations for the remaining 3 crabs.
Question 3
Practice in class or homework.
TN 9Designing Cell Phone Games: An 8th Grade Unity on Linear Functions-Teacher Notes

In order to understand graphs, it helps to know some "by sight." Sketch a graph for
each of the following movements. Use what you learned in the Wendella game and the
Bank Account activity to think about these more general situations.
An object moving, then speeding up. A bank account with its amount increasing
and then increasing at a higher rate.
'"
time
An object moving forward, then moving
the backward.A bank account's money increasing and
then decreasing.
~
time
An object standing still (not moving). A bank account whose amount is not
changing.
~
time
Designing Cell Phone Games 33

Crab VelOicity
In our other games, characters can move
forward and backward, or up and down. We
already know how to calculate their speed. But
there's a bit more to it than that. Help us learn
how to use velocity in our games.
It's just speed-but with direction!
+ (positive) for up or forward
-(negative) for down or backward
Our crab characters, Karla and Lenny, move up
and down-above the water (on the rocks) and
below it. The water level is at 0 meters.
Positive positions are above the waterline.
Negative positions are below the waterline.
1. Open the file Crab1.smw, run the
simulation, and find
Karla's speed: 0 "=15 m per rea
Lenny's speed: 0.153/4Ir) per «~ m per .re~H
Karla's velocity:
Lenny's velocity: -(). 15 /Y} per teo
34 Designing Cell Phone Games
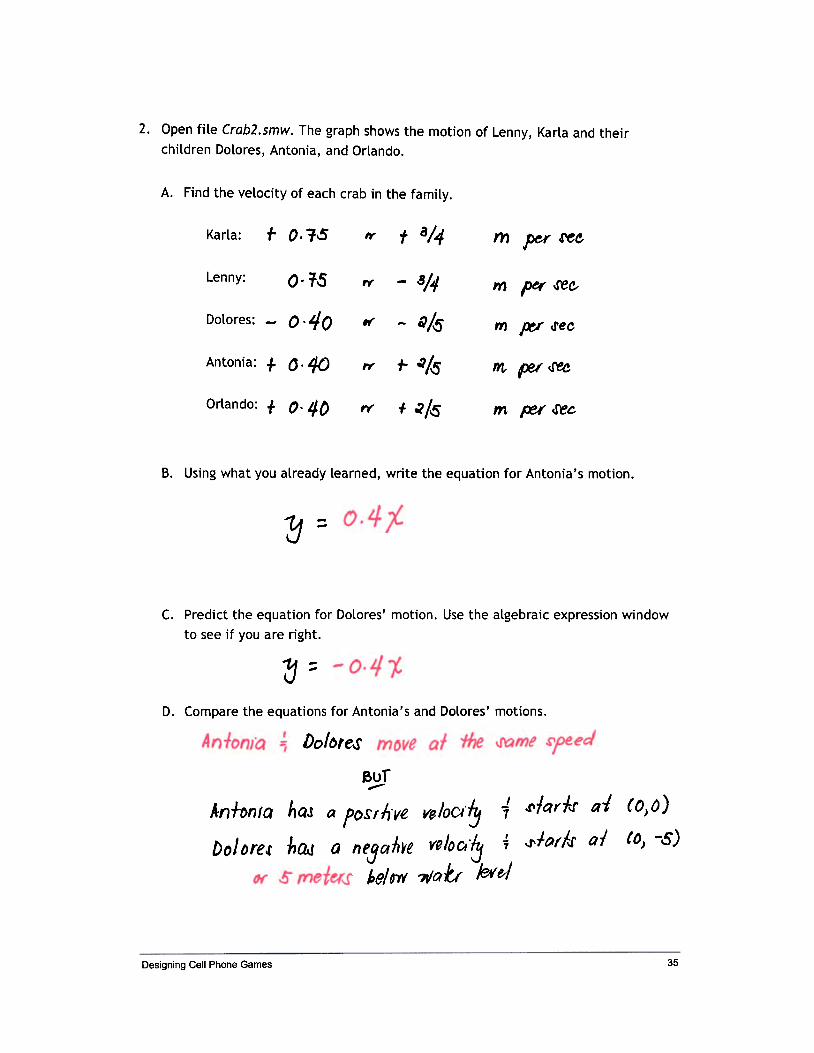
2. Open file Crab2.smw. The graph shows the motion of Lenny, Karla and their
children Dolores, Antonia, and Orlando.
A. Find the velocity of each crab in the family.
t 8/4t 0.1.5Karla: IY 1)') per.re~
Lenny: 0,"+5 -S/J/rf' per 4'e e.-m
Dolores: -0.40-cPA5If 11) ~ 4fec
r ~/..sAntonia: .,. a. 40 ""fJ8f~It'
Orlando: + o. 4tJ + .? "4)" m ~.tec.rY'
B. Using what you already learned, write the equation for Antonia's motion.
3=
C. Predict the equation for Dolores' motion. Use the algebraic expression window
to see if you are right.
~::D. Compare the equations for Antonia's and Dolores' motions.
Dolc)'e~
Bur--.rfQ(f.r 01 (0)0)
(O) -5)
hQJ a fOSlh've Ve!IOCl'~ 4
-a ne!Jah,;e V'BloCl'~ i
bel IT( ?If(~ b- fe¥ eI
AntonIa
.,J't()(f..r 01hQdDol Dre.c
35Designing Cell Phone Games

3. Using Crab3.smw, make a graph for each situation below. Then, sketch the graph
and write an equation for your graph. Remember, the water level is at position O.
< Aw~W~~ 'ViiI..\..- VA-Vl7f ')
36 Designing Cell Phone Games

4. Open TemperatureGauge4.smw. The graph shows the temperature inside TexStar
Games' supercomputer used for running simulations. lane, our supercomputer
technician, can't run a simulation unless the computer's temperature is at least 30
degrees below freezing (-30 degrees Celsius)..
A. Find the speed of the temperature change in the supercomputer.
S' ~ per mlnlile
B. Find the velocity of the temperature change in the supercomputer.
soc
C. If the temperature inside the computer starts at 0 degrees Celsius and the rate
of temperature change stays the same, how long must lane cool the computer
before he can run a simulation? You can change the graph to help you, but you
must keep the rate of temperature change the same.
, rnrnuteJExplain how you got your answer:
rht. -/emp erak1(~ r11UJf 36'~o-h(~~e
30 .~I' mfhU k.:s:--
D. Change the graph so that the starting temperature is 20 degrees Celsius. If the
rate of temperature change stays the same, how long must lane cool the
computer before he can run a simulation!'
'0 mrnu/~
Explain how you got your answer:
< SAMPLE A"'~W~ >
Sf) .C --
Designing Cell Phone Games 37

Lesson Plan Day 8
Activities~
Wolf and Red Riding Hood Group work 50 minutes
Big Ideas.Finding velocity of a character given some conditions.
.No matter how the characters move, if their motions graphs have the same endpoint, theymeet at the same place at the same time.
Notes
Introduction
.Explain that in this activity, students will assume the role of the game tester.
a We are figuring out in advance how to know what the right answer is.
a Players won't have access to our mathematical representations, but they will make it
easy for us.
a Doing math enables players to make strategic decisions that will help them win.
.Read the introductory text that explains the rules of the game.
a RRH and Wolf move across the screen to Grandma's House.
a RRH's speed changes.
a To win, players have to pick a speed for Wolf so that he arrives at Grandma's House at
exactly the same time as RRH.
Question 1 (10 minutes).Ask students to give a story for the trip, with numeric estimations of RRH's velocities.
.Collect different predictions for the Wolf's speed, with a brief explanation of each prediction.
Don't identify the right answer yet..Try different predictions out by setting the speed on the graph and verifying this with the
simulation..Students may notice features of the graph that help: the two lines must intersect at the position
of Grandma's house order to make a winning garne.
Question 2 (10 minutes)
.Help students articulate and practice this idea:
a When the endpoints of the graphs for RRH and Wolf are the same, that means Wolf
and RRH are in the same place at the sarne time.
Question 3 (10 minutes).Help students compare making a winning game from graphs or equations.
.Graphs are easier because you can draw the line and calculate the speed from the line.
* Pointing toward Algebra: this activity deals with simultaneous equations, very informally.
Question 4 (5 minutes)
.Help students develop these insights:a With graphs you can see where the Wolf's line begins and ends. Read the velocity off
the graph once you have set it up.
a With equations, predicting the Wolf's velocity is harder (with the methods we have now.
TN 10

WoLf and Red Riding Hood
We need you to test a new game based on the
fairy tale, Red Riding Hood.
In this game, Red Riding Hood (RRH) and the Wolf
start from Home and move toward Grandma's
House. RRH moves at two velocities during the
journey. The Wolf moves at the same velocity the
whole time.
The Wolf must arrive at Grandma's House at
exactly the same time as RRH. Then he can
devour her.
Help us find the "trick" so that the Wolf always
arrives at exactly the same time as RRH.
Open Wolf1.smw. Use the graph to:1
A. Describe RRH's trip to Grandma's. Include how long it took her to get there and
estimates of her two velocities.
RRIl frareled r,OOm In /()frJlnu!e..rIsf : .3DD /1) in 4 ml"f).f So her reIDC/',!! -wQJ l' =15 11) let" minule;
.?ntl/ : 300 h') III fI /1]1'/)'/ J'O hfJ YeIDCI~ 1'/at fSD m ~ mln",/~
B. Predict the Wolf's velocity so that he and RRH meet at Grandma's, at exactly
the same time. < At-.I$Wms WfL.L. V~"f>
COUE"cr Pr.~jcticPt..\: '0 m
C. Test your prediction by changing the Wolf's graph and running the simulation.
Were you right? Why or why not? Revise until you get it right.
"fI/il-\.-< .#rt.ISW~S
Designing Cell Phone Games38

2. The next round of the game is Wolf2.smw. Again, there are two velocities for RRH,
we need to find the one for the Wolf to catch her at Grandma's House.
A. Use the graph to find the Wolf's velocity.
What is the Wolf's velocity? '15 m \,1)e"mmu/e
B. Explain how to use graphs to find the Wolf's velocity, when you have a graph of
RRH's journey.
The mdpolnl c1( nol{ .rh6Uld fflafch the endpoInt rf I//?H.
Wolf'..r Ifnr. .(')huuld be tl' ..r1fJ!Jle .Jegment.
3. Use Wolf3.smw to predict the Wolf's velocity with an equation.
A. Using the algebraic expression window, predict the Wolf's velocity, check and
revise until you get it right.
What is the Wolf's velocity? 4D m JDGf mlhule
B. Explain how to use equations to find the Wolf's velocity, when you have an
animation of RRH's journey.
(SAMfI.E 1loI~e'()
look 41 'fIJe IoIQI al.f/Qna~ RP.JI 1f"(.:tvelttd 4 d,vrde fhal
bJ Me "h>fal -J1me rhe iraveled'.
4. We can use graphs or equations to find the Wolf's velocity. Explain the advantages
and disadvantages of each.
fGvA'TitJ~.s (;~ ~I\~
AOVANrAGe~: '~D1.f can ;nful prtCI',(e
numAlers
I on~!f1M Kf1DlAJ 'fIlt tI1dfOl"nI) ~,."
JUS! Qr()((i a .rfn"J, le9mentI ~ n1 ~ ~t.r.\ 6'1) ~ I hl4rrJ~ -
+ht number £tfirt 't J t1htrt
~ :' (1I1t",Ot');t
OISArJVAIlirM.cS~ .J jUlJ.r ; ~t:.!i « ~6'U havt "" ~aph R/?J/:r rtJbc,'/r(,s.lt>
~I}f KnIW whert 'w'olfJ e!Jdp6t'l1f "hlWld "-
'* the -iII(ckn(,tS of a Ifnt DQn !ntJ!ct '11)1 thInK'1M afe Dn Q p"r/J-cula, ldllDle hurnbet- 1x11
I "qlM mfJb~ ."1 ~-f[ .d'ghl/yDesigning Cell Phone Games 39

Lesson Plan Day 9
Big Ideas.Average is the single number or rate that could "stand in for" the number or rates being
averaged..If a character travels at several rates, the average of those rates gets the character to the
same place at the same amount of time.
.A graph can be used to find the average rate (velocity) of a character moving at different rates(velocities): draw a line from beginning point to ending point of the characters' graph, then read
that rate from the graph.
NotesSecrets of Average Rate (25 minutes)
Question 1.Remind students of the procedure for finding average that they have already learned in earlier
grades: "add them up and divide" is fine here
Question 2.Expect guess and check or other methods. Let students discover the connection between
average and "one charge" through the activity.For Question 2C: Students are likely to "add thern up and divide" because the question asks
for average..Connect average amount to single amount. These amounts can be thought of as rates, rates of
dollars per game.Question 3: Have students use the same graphs from Wolf and RRH to find RRH's average rate.
* The Wolfs single velocity IS RRH's average velocity. This insight makes it easy to find the
average rate with the graph.
More Problem Solving (15 minutes).Question 1 provides practice for finding average rates from graphs.
.Question 2 uses average rate idea in a problem !;olving/modeling setting.
.Question 3 consists of problems that review earlier activities.
.For the rest: practice in class or give as homework.
Problems From The TexStar Lunchroom (10 minutes)This can be used as homework or an informal assessment/quiz-or in class, if there is time.
.Question 1: Students use a unit rate to solve problems for particular values, and then to createa graph that generalizes. Help them see that the graph provides answers for any amount of
coffee or cups..Question 2: Students practice translating from algebraic symbols to words.
.Question 3: Students practice filling in values in a table representing a proportionalrelationship. This can be surprisingly difficult for some students.
.For the rest: Again, students fill in values for a proportional relationship, but it's given in asomewhat unusual way and students must evaluate each time value to solve a problem.
TN11

We need to use averages a lot in our work. You've already learned about averages in
math class. And, you know something about them in real life. Use what you already
know to find out more about average rate.
1. When playing a game Robots Gone Awry, Deborah gets scores of 70, 87, and 99.
Use what you learned in math class to find her average, or mean score. Explain
how you did it. ~ BS. IS-
B 1 d r~-c;:o". ~ .~ -.> A "e(Q~e /,f i5.-3
-,~ L. :!§.Of ~ !.!.
2. Some game designers get paid for each game they make, charging different
amounts for different games. In January, the designer, Sandra, sold 3 different
games.
Name of the Game Charge for the Game
Lost in the Pines $10,000
$20,000
$6,000
Robots Gone Awry
Texas Road Rally
A. What was total amount of money Sandro was paid in January from selling these
games? j J', 000
--lId., (Jot>
C. What's the average rate (in dollars per gi~me) that Sandro was paid, in January?
Explain how you know, in two different v(ays.
,er !fame
40 Designing Cell Phone Games
B. Sandro would like to charge the same amount for each game. What would he
have to charge for each game, in order to make the same total amount of
monev for Januarv?

3. Speed and velocity are rates, too. Red Riding Hood and the Wolf can help us think
about average rate, using graphs. RRH's average rate is the single rate at which
she could make the same journey in the same amount of time.
A. You've seen these graphs before. Each graph shows RRH moving at two
different rates.
700
650
600
550
SOO
450
400
350
1300,~ 25C
200
150
100
50
0 r I ~ ~ ~ ~ ~ ~ ~ ~ ,'0;' f2minutes
First, RRH moves at ~ meters per
minute for ~ minutes.
Then, she moves at J& meters per
minute for 4- minutes.
Predict: What is her average rate, in
meters per minute? ~ /Y) 18' min
(Hint: What was the Wolf's rate, in
meters per minute?)
First, RRH moves at ~ meters per
minute for -L minutes.
Then, she moves at ~ meters per
minute for ~ minutes.
Predict: What is her average rate, in
meters per minute? ~ m pet mlrJ
(Hint: What was the Wolf's rate, in
meters per minute?)
B. Look at the work you just did in Part A. In a sentence or two, explain the
relationship between RRH's average rate and the Wolf's rate.
41Designing Cell Phone Games

Problem Solving
We still have other problems to solve at TexStar Games! Use all you have learned to
help us with the following problems.
1. Think back to Lost in the Pines. Help us analyze Wendella's journeys and average
rate.
What is Wendella's average rate of
motion (her average speed) on this
journey?
A,
abowi
B. What is Wendella's average rate of
motion (her average speed) on this
journey?
obawf 61 m per mif1
c Wendella went 100 meters through
the swamp in 4 minutes, then 350
meters on the road in 2 minutes.
Using the graph to help you, what
was her average rate, in meters
per minute?
=15 /r) per rrn'n

2 Marissa has worked for TexStar Games for 5 years. For the first 2 years, her salarywas $50,000 per year. Then she got a big raise. For the last 3 years, her salary has
been $70,000 per year.
Marissa says, "So my average yearly salary for these 5 years has been $60,000."
Her supervisor, Tanya, disagrees, "Actually, Marissa's average salary has been
$62,000."
The $2,000 difference matters to them! Explain who is right and why (use the
graph if it helps you).
..
v
~~
J..J.
~ ...50.000
l!'!'!'~'!"1 ...4 5
YcA~S
The su pervl:.to(
" JJO ,oDD., t~', 000 tel f1EIQf'
--5 !jeQr.t
Designing Cell Phone Games 43

1 Our TexStar employees drink a lot of strong coffee while creating our great cell
phone games. We know that with each 1.5-lb. (pound) bag of coffee, we can make
36 cups.
A. How many pounds do we need to make 72 cups? How about 120 cups?
3/b.s ) ,> 6" Ihs
B. If we have 3.5 bags of coffee left, how many cups can we make with it?
C. Make a graph that lets us figure out how many pounds of coffee we need no
matter how many cups we plan to make 'that day.
< ANSW~S -Will.. V~1f
eAS~ "N SCALE ~frJ ')
\bs2. Shanae, the programmer, often writes in math symbols instead of words. She put
up this ad on the company bulletin board:
Dog sitter wanted!
Will pay y dollars, where y = 9x + 20, and x is the number of hours you work.
Explain what Shanae means in words:
Designing Cell Phone Games44

3. Darrell, from the business office, is helping his son sell raffle tickets to raise
money for his school. He's making a chart so that his son can quickly check that hehas the right amount of money for the number of tickets he has sold. Fill in the
missing numbers for him. There is no discourlt for buying a lot of tickets.
Tickets sold
5
Money Collected ($)
I~. 6"025.00
,a,.SO100.«)
10
25
40
4. TexStar's company plane, the SuperNova, can fly at an avera!~e speed of 225 mph.
It has only enough fuel for 3Yz hours of flight.
A. Complete the table below.
City Distance fromDallas
Travel Time Non-stop Flight?(yes or no)
800
580
675
,3. 55 hour..r 1)6
~~
M
~ .68 hour.r
~ .Dr> hlW~'
795 c.3. 5-3 h,ur.r
3- f~ houf-t
Cincinnati, OH
Albuquerque, NM
Chattanooga, TN
Chicago, IL
Athens, GA 780 lief
B. Which cities can the SuperNova fly to non-stop (with only a single tank of fuel)
if it starts in Dallas?
G4
Designing Cell Phone Games 45

Big Idea.Linear relationships can be expressed in the form y=mx+b and are represented as line graphs.
.In proportional linear relationships, b=O and the line goes through the origin. Every pair (x,y) onthe line is in the same ratio.
.In non proportional linear relationships, b (does not equal) 0 and the line cross the y-axis at b.
Though there is a constant rate of change in the equation, m, thE~ pairs (x,y) are not in thesame ratio.
Notes
MathematicaLLy Speaking-Linear ReLationships: ProportionaL and NonproportionaLQuestion 1 (5 minutes)
.Help students establish linear vs. nonlinear by sight for graphs and equations.
.Point out that students will study nonlinear equations more in latE~r years. Here we use them forcontrast with linear.
For Question 2 (10 minutes)
.Students uncover important distinctions between proportional and nonproportionallinearfunctions.
.Help them summarize:
0 When the character starts at 0 and move!; at constant rat43 , there is a proportional
relationship between time and distance--any
0 When the character starts at a place other than zero and moves at a constant rate,there is a nonproportional relationship be1:ween time and (jistance.
0 In a proportional relationship, you can do one operation on any row (both x and y) toget another row. This does not work in a nonproportional relationship.
Question 3 (10 minutes)
Students organize the properties of linear relationships: proportional and nonproportional.
Question 4 (15 minutes)
Students classify some of the relationships they havE~ used in the unit as proportional ornon proportional.
Question 5
Homework to give students practice labeling relation:ships as proportional or nonproportional, givenjust verbal description.
TexStar Games: Going FuLL- Time
.Give students an opportunity to reflect on the unit as a whole. Have them think about the math,but emphasize what they learned.
Designing (~ell Phone Games: An 8th Grade Unity on Linear Functions-Teacher Notes TN 12

Mathematically SpeakingLinear Relationships:
Proportional and Nonproportional--
50 far at Tex5tar Games, we have worked with relationships-for example, time and
money in the bank, time and position of a character. It will help us to know
mathematical terms for some of these different relationships.
Your task: Help us categorize relationships to make our work more efficient.
Linear Relationships Ys. Nonlinear Relationships
1. In this unit, and in the math you will study irl high school, we say:
A linear relationship has a graph that is a single straight line.
Put a check by the representations of linear relationships and explain.
y = X3y = 3x
y = 4x-3
Designing Cell Phone Games46

Linear Relationships: Proportional Ys. Nonprol=lortional
2. Use this memo from Dora to help you think about linear relationships that are
proportional and linear relationships that are NOT proportional. Reply to Dora inthe spaces provided.
Hey -check this out. I have been looking at the nun,bers when a Planet Eater starts from
the Sun (at zero) or some other place.
Table A I worked out the equation as y = 3x and I
noticed a pattern bet'ween the rows here.
Whl~n time is 2, position is 6. Double 2 to get
4, and double 6 to get 12. Sure enough, when
time is 4, position is 12.
2)X2
So jr can use doubling or multiplying to get one
row from another. I think that works for any
two rows in this table.
A. Try it yourself. Choose two rows and
explain how to get one from the other
using multiplication.
B. Would this work with ANY two rows, even
if I kept making n,ew rows for this
character's motion? yes
< 4N~W~S tli~ V'AW,1f>
Why or why not? < .At.JSW~ wi LL. VMl.1f >
Table B shows the relationship between time and position when a character starts at 2
Designing Cell Phone Games 47

3. Dora uncovered two kinds of linear relationships. Fill in the properties of each
below, using the relationship between time and distance in motions to help youthink it through. < ANSW~' ""iLL. V~1f)
Motions starting at some placeother than O.Motions starting at O.
Example equations: Example equations:
+b~=m;t
Example graphs: Example graphs:
We call relationships with these
properties proportional linear
relationships.
We call relationshi~ls with these
properties non proportional linear
relationships.
They have equations where:
you mUlh:p/~ QI1~ ~ value b:!Jq nfArnb~r .ANI~ add another-
nwmber 10 Be f ~, Y value
They have equations where:
Y°'l Ian mullfp"!J any ~ Vq/Hl'
b, a number 1°..fel , y t'Qll4e
They have graphs that: They have graphs that:
.r/Qrf al
48 Designing Cell Phone Games

4. Go back through your workbook and find two proportional linear relationships.
Write a sentence describing the relationship. Fill in the equation, table and graph
for each. < ANC;W~S WiL\.. V ArI."lf >
x y
Graph:
x y
Graph:
49Designing Cell Phone Games

5. Go back through your workbook and find nonproportionallinlear relationships.
Write a sentence describing two of them below. Also, fill in the graph, equation
and table for each.
< A1IJSW~Wi L.\.. "1t(V1.1f)
x y
Graph:
x y
Graph:
Designing Cell Phone Games50

6. label each relationship as proportional or nonproportional. You can use a graph,
table, or equation to help you decide.
A. A toy begins at 0 cm, the "start" line of a race, and moves at a constant rate of
3 cm per second.
Relationship between time and the toy's position?
B. A character starts out 5 cm in front of the "start" line and moves at a constant
rate of 3 cm per second.
Relationship between time and the toy's position?
C. A game designer earns $5,000 per month"
Relationship between number of months on the job and total dollars earned?
D. A game design company has $50,000 in a bank account. They take $4,500 out of
the bank to pay for each animation they need.
Relationship between money in the bank account and the number of
animations paid for?
E. You pay $10 to join the PlayCel1 game cllJb. Then you pay only $1 for each
game you buy.Relationship between total dollars ($) paid and the number of games bought?
7. How did you decide whether a relationship was proportional or nonproportional?
51Designing Cell Phone Games

Your co-workers at TexStar Games were very pleased with what you have done.
You've helped them improve their work, you are such a hard-worker, and you have
also learned the math that is important to future success.
Designing Cell Phone Games52