designing pv incentive programs to promote performance: · pdf filecurrent practice galen...
TRANSCRIPT
CASE STUDIES OF STATE SUPPORT FOR RENEWABLE ENERGY
Berkeley Lab and the Clean Energy States Alliance
October 2006 Final Report under Task 2 of MPO No. DEK-6-66278-01 NREL Technical Monitor: Robert Margolis LBNL-61643 Download other clean energy fund case studies from:
http://eetd.lbl.gov/ea/EMS or
www.cleanenergystates.org
Designing PV Incentive Programs to Promote Performance: A Review of Current Practice Galen Barbose, Ryan Wiser, and Mark Bolinger
Introduction Some stakeholders continue to voice concerns about the performance of customer-sited photovoltaic (PV) systems, particularly because these systems typically receive financial support through ratepayer- or publicly-funded programs. Although much remains to be understood about the extent and specific causes of poor PV system performance, several studies of the larger programs and markets have shed some light on the issue. An evaluation of the California Energy Commission (CEC)’s Emerging Renewables Program, for example, found that 7% of systems, in a sample of 95, had lower-than-expected power output due to shading or soiling (KEMA 2005). About 3% of a larger sample of 140 systems were not operating at all or were operating well below expected output, due to failed equipment, faulty installation workmanship, and/or a lack of basic maintenance. In a recent evaluation of the other statewide PV incentive program in California, the Self-Generation Incentive Program, 9 of 52 projects sampled were found to have annual capacity factors less than 14.5%, although reasons for these low capacity factors generally were not identified (Itron 2005). Studies of PV systems in Germany and Japan, the two largest PV markets worldwide, have also revealed some performance problems associated with issues such as shading, equipment and installation defects, inverter failure, and deviations from module manufacturers’ specifications (Otani et al. 2004, Jahn & Nasse 2004). Although owners of PV systems have an inherent incentive to ensure that their systems perform well, many homeowners and building operators may lack the necessary information and expertise to carry out this task effectively. Given this barrier, and the responsibility of PV incentive programs to ensure that public funds are prudently spent, these programs should (and often do) play a critical role in promoting PV system performance. Performance-based incentives (PBIs), which are based on

Case Studies of State Support for Renewable Energy October 2006
actual energy production rather than the rated capacity of the modules or system, are often suggested as one possible strategy. Somewhat less recognized are the many other program design options also available, each with its particular advantages and disadvantages. To provide a point of reference for assessing the current state of the art, and to inform program design efforts going forward, we examine the approaches to encouraging PV system performance – including, but not limited to, PBIs – used by 32 prominent PV incentive programs in the U.S. (see Table 1).1 We focus specifically on programs that offer an explicit subsidy payment for customer-sited PV installations. PV support programs that offer other forms of financial support or that function primarily as a mechanism for purchasing renewable energy credits (RECs) through energy production-based payments are outside the scope of our review.2 The information presented herein is derived primarily from publicly available sources, including program websites and guidebooks, programs evaluations, and conference papers, as well as from a limited number of personal communications with program staff. The remainder of this report is organized as follows. The next section presents a simple conceptual framework for understanding the issues that affect PV system performance and provides an overview of the eight general strategies to encourage performance used among the programs reviewed in this report. The subsequent eight sections discuss in greater detail each of these program design strategies and describe how they have been implemented among the programs surveyed. Based on this review, we then offer a series of recommendations for how PV incentive programs can effectively promote PV system performance.
1 Hoff (2006) and Greenberg (2006) also examine programmatic approaches to encouraging PV system performance. 2 The DSIRE database (http://www.dsireusa.org/summarytables/financial.cfm?&CurrentPageID=7&EE=1&RE=1) identifies various types of programs offering other forms of financial support for PV, including income tax credits/deductions, sales and property tax exemptions, and low interest loans. DSIRE also identifies 15 programs in the U.S. through which RECs generated by PV systems are purchased via energy-production based payments.
Designing PV Incentive Programs to Promote Performance 2
Case Studies of State Support for Renewable Energy October 2006
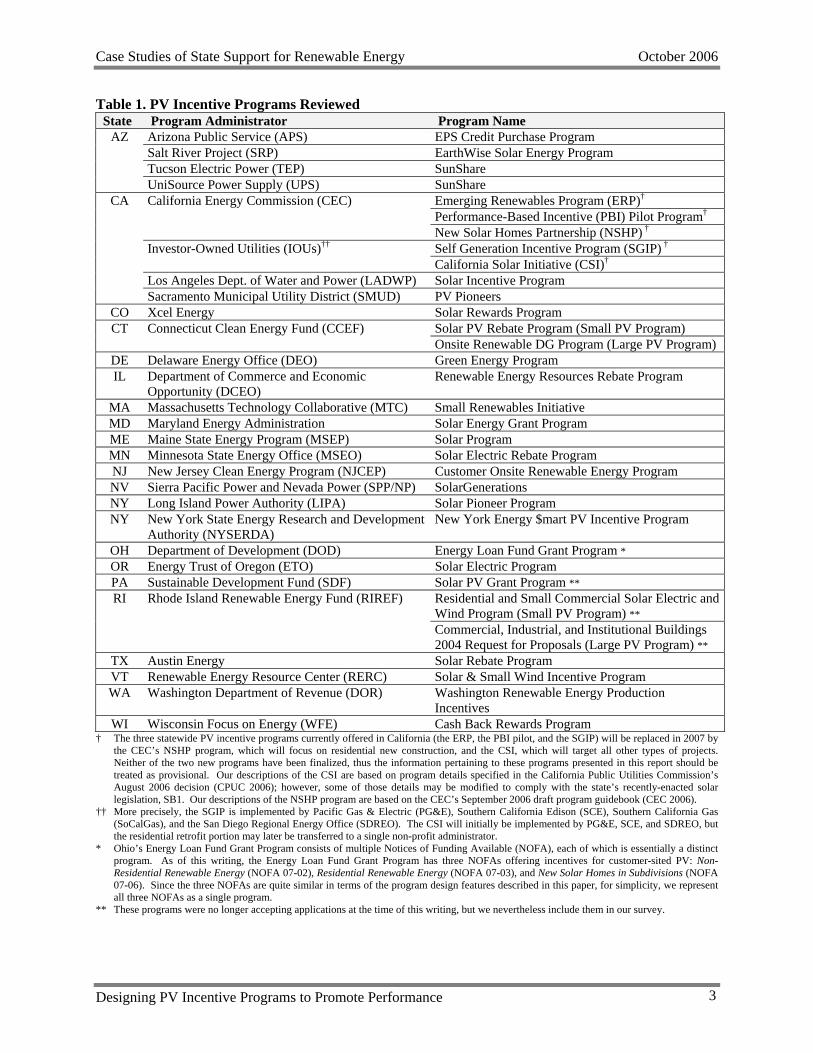
Table 1. PV Incentive Programs Reviewed State Program Administrator Program Name
Arizona Public Service (APS) EPS Credit Purchase Program Salt River Project (SRP) EarthWise Solar Energy Program Tucson Electric Power (TEP) SunShare
AZ
UniSource Power Supply (UPS) SunShare Emerging Renewables Program (ERP)† Performance-Based Incentive (PBI) Pilot Program†
California Energy Commission (CEC)
New Solar Homes Partnership (NSHP) † Self Generation Incentive Program (SGIP) † Investor-Owned Utilities (IOUs)†† California Solar Initiative (CSI)†
Los Angeles Dept. of Water and Power (LADWP) Solar Incentive Program
CA
Sacramento Municipal Utility District (SMUD) PV Pioneers CO Xcel Energy Solar Rewards Program
Solar PV Rebate Program (Small PV Program) CT Connecticut Clean Energy Fund (CCEF) Onsite Renewable DG Program (Large PV Program)
DE Delaware Energy Office (DEO) Green Energy Program IL Department of Commerce and Economic
Opportunity (DCEO) Renewable Energy Resources Rebate Program
MA Massachusetts Technology Collaborative (MTC) Small Renewables Initiative MD Maryland Energy Administration Solar Energy Grant Program ME Maine State Energy Program (MSEP) Solar Program MN Minnesota State Energy Office (MSEO) Solar Electric Rebate Program NJ New Jersey Clean Energy Program (NJCEP) Customer Onsite Renewable Energy Program NV Sierra Pacific Power and Nevada Power (SPP/NP) SolarGenerations NY Long Island Power Authority (LIPA) Solar Pioneer Program NY New York State Energy Research and Development
Authority (NYSERDA) New York Energy $mart PV Incentive Program
OH Department of Development (DOD) Energy Loan Fund Grant Program * OR Energy Trust of Oregon (ETO) Solar Electric Program PA Sustainable Development Fund (SDF) Solar PV Grant Program **
Residential and Small Commercial Solar Electric and Wind Program (Small PV Program) **
RI Rhode Island Renewable Energy Fund (RIREF)
Commercial, Industrial, and Institutional Buildings 2004 Request for Proposals (Large PV Program) **
TX Austin Energy Solar Rebate Program VT Renewable Energy Resource Center (RERC) Solar & Small Wind Incentive Program WA Washington Department of Revenue (DOR) Washington Renewable Energy Production
Incentives WI Wisconsin Focus on Energy (WFE) Cash Back Rewards Program
† The three statewide PV incentive programs currently offered in California (the ERP, the PBI pilot, and the SGIP) will be replaced in 2007 by the CEC’s NSHP program, which will focus on residential new construction, and the CSI, which will target all other types of projects. Neither of the two new programs have been finalized, thus the information pertaining to these programs presented in this report should be treated as provisional. Our descriptions of the CSI are based on program details specified in the California Public Utilities Commission’s August 2006 decision (CPUC 2006); however, some of those details may be modified to comply with the state’s recently-enacted solar legislation, SB1. Our descriptions of the NSHP program are based on the CEC’s September 2006 draft program guidebook (CEC 2006).
†† More precisely, the SGIP is implemented by Pacific Gas & Electric (PG&E), Southern California Edison (SCE), Southern California Gas (SoCalGas), and the San Diego Regional Energy Office (SDREO). The CSI will initially be implemented by PG&E, SCE, and SDREO, but the residential retrofit portion may later be transferred to a single non-profit administrator.
* Ohio’s Energy Loan Fund Grant Program consists of multiple Notices of Funding Available (NOFA), each of which is essentially a distinct program. As of this writing, the Energy Loan Fund Grant Program has three NOFAs offering incentives for customer-sited PV: Non-Residential Renewable Energy (NOFA 07-02), Residential Renewable Energy (NOFA 07-03), and New Solar Homes in Subdivisions (NOFA 07-06). Since the three NOFAs are quite similar in terms of the program design features described in this paper, for simplicity, we represent all three NOFAs as a single program.
** These programs were no longer accepting applications at the time of this writing, but we nevertheless include them in our survey.
Designing PV Incentive Programs to Promote Performance 3

Case Studies of State Support for Renewable Energy October 2006
Overview of Program Design Options for Promoting PV System Performance The amount of electrical energy generated by a PV system over its lifetime is a function of three fundamental parameters: (1) the amount of solar energy incident on the array, (2) the efficiency of the entire system in converting that solar energy into AC electrical power, and (3) the duration of time that the system is in operation, which depends on equipment life and availability. These three fundamental parameters may, in turn, be affected by a wide variety of specific issues related to geographical location, system design, equipment quality, installation workmanship, and maintenance (see Table 2). Table 2. Issues that Affect PV Energy Production
Fundamental Determinants of PV Energy Production Performance Factors Solar Energy Available System Conversion
Efficiency Duration of Operation
Geographical location
Latitude Cloud/fog cover Snowfall Geography
Effects of ambient temperature, solar intensity, and wind speed on array efficiency
Harshness of climate
System design
Panel orientation Shading
Over-sized inverters Effect of mounting
method on cell operating temperature
Reduced array efficiency due to shading
Under-sized inverters
Equipment quality
Inaccurate equipment ratings
Module performance under actual operating conditions
Undue degradation
Component durability and lifetime
Installation workmanship
Under-sized wiring System faults due to installation defects
Maintenance Tree trimming Cleaning of panels Replacement/repair of failed equipment
Through our review of current PV incentive programs in the U.S., we identified the following eight strategies or groups of related strategies to promote PV system performance, each of which can potentially address a particular set of performance-related issues (see Table 3): • Equipment and installation standards ensure that PV system components and installations
meet minimum industry standards related to safety, reliability, and ratings accuracy. • Warranty requirements provide an incentive for component manufacturers and installers to
provide reliable equipment and systems, and they reduce the cost to customers of replacing or repairing failed equipment.
• Installer requirements, assessments, and voluntary training ensure that PV professionals have the knowledge and skills to design and install reliable PV systems that efficiently utilize the available solar resource.
• Design standards and administrative design review ensure that PV system designs meet minimum standards related to orientation, shading, and other factors that determine the utilization of the available solar resource.
Designing PV Incentive Programs to Promote Performance 4

Case Studies of State Support for Renewable Energy October 2006
• Incentive-based approaches provide a direct monetary incentive to program participants (typically the customer or installer) to ensure that PV systems perform well. The range of performance issues addressed depends on the particular incentive-based approach(es) used.
• Post-installation site inspections and acceptance testing can serve to identify equipment and installation defects.
• Performance monitoring and assessment may be conducted by program administrators and by customers, and programs may incorporate elements to facilitate the latter. Such activities can serve to identify malfunctioning equipment and needed routine maintenance.
• Maintenance requirements and services ensure that necessary maintenance is conducted, either by requiring that the installer provide this service, or by providing maintenance directly as a component of the PV incentive program, itself.
The details of how any one of these strategies is implemented can vary considerably from one program to the next. Thus, in the following sections of this report, we summarize the specific approaches used by the programs in our review. Table 3. PV Incentive Program Design Strategies to Promote Performance
Performance Factors Potentially Addressed * Program Design Option Geographical
Location System Design
Equipment Quality
Installation Workmanship Maintenance
Equipment and installation standards Warranty requirements Installer requirements, assessment, and voluntary
training
Design standards and administrative design review Incentive-based approaches Performance-based incentive Expected performance-based buydown Incentive hold-backs Improved rating conventions Post-installation inspections and acceptance testing Performance monitoring and assessment Performance monitoring by program administrator Meter display requirements and other
information/diagnostic tools
Customer education and training (regarding system monitoring and assessment)
Maintenance requirements and services * The table identifies what are arguably the primary performance factors addressed by each program design strategy; many of these strategies
may address additional performance factors as well, depending on their specific design. Equipment and Installation Standards Various organizations in the U.S. and internationally have developed standards for PV equipment and systems (see Table 4).3 PV incentive programs can, and often do, require that funded systems meet one or more of these standards. 3 For additional information on existing standards applicable to PV system components and installations, see the summary published by the Interstate Renewable Energy Council (IREC), available at:
Designing PV Incentive Programs to Promote Performance 5

Case Studies of State Support for Renewable Energy October 2006
Table 4. Key Equipment and Installation Standards for Grid-Connected PV Systems Rated Output Product Reliability Safety
Modules UL-1703 FSEC Standards 201-05 and 202-05 IEC 61215 and 61646
IEEE 1262 IEC 61215 and 61646
UL-1703 IEC 61730
Inverters CEC standard (Bower et al. 2004) UL-1741 Systems
(grid-connected) IEEE 929 and 1547
NEC Article 690 The standards most directly related to performance are those that specify how manufacturers of modules and inverters are to determine the nameplate ratings for individual product lines. The only national standard in the U.S. governing the rated output of PV modules is UL-1703, which relates primarily to product safety but also requires that, under Standard Test Conditions (STC)4, the power output of the modules tested be at least 90% of their nameplate rating. The lack of a tighter national standard has been highlighted as an important issue by some, given a limited amount of empirical evidence suggesting that module nameplate ratings in the U.S. may be systematically inflated.5 To address this issue, a group of industry stakeholders has been considering whether or not to develop a more rigorous U.S. rating standard and associated certification process.6 Tighter module rating standards are already in place in Florida and have been proposed by the CEC for the new NSHP program in California. In Florida, state law requires that the ratings of modules sold in-state be based on the results of tests conducted or certified by the Florida Solar Energy Center (FSEC). These tests consist of measurements of power output under STC for a random sample of six modules per product line, the average of which then becomes the rating for that product, when sold in Florida. The FSEC has developed a test protocol for this process, codified as FSEC Standards 201-05 and 202-05. In California, the draft guidebook for the CEC’s new NSHP program proposes requiring that each module product line undergo a set of performance and reliability tests developed by the International Electrotechnical Commission (IEC 61215 for crystalline modules and IEC 61646 for thin-film modules), and that the results from these tests be certified and submitted to the CEC. The CEC further proposes to require that the power output of each individual module is no less than the certified nameplate rating for that
http://www.irecusa.org/articles/static/1/binaries/PV_Prod_Cert_Standards_Feb06.pdf. In addition, the Florida Solar Energy Center (FSEC) maintains a list and short descriptions of current standards, available at: http://www.fsec.ucf.edu/pvt/education/inspgcps/handbook/pdf/PVCodes_Standards.pdf. 4 Module nameplate ratings are based on power output under STC, defined as 1000 W/m2 irradiance and 25 °C cell temperature. 5 FSEC recently tested samples of modules from nine manufacturers, measuring their power output under STC. For eight of the manufacturers, the average power output of the sample of modules tested was less than their nameplate rating, and for six manufacturers, it was more than 5% less than the nameplate rating (Szaro 2006). The CEC recently sponsored research that included in-depth performance monitoring of twelve large PV systems. Nine of the twelve PV arrays were determined to be unlikely (less than a 50% probability) to meet their rated output under STC (BEW 2006). Because other countries, such as Germany and Japan, have tighter ratings standards and/or rely on production-based incentives, there has been some speculation (and supporting anecdotal evidence) that manufacturers ship better performing modules to these foreign markets (Whitaker 2006). 6 A certification working group has been formed and several meetings of industry participants have been conducted over the past year to develop consensus on a new certification process and standard. Information from the most recent meeting is available at: http://www.irecusa.org/articles/static/1/1153947937_987094287.html.
Designing PV Incentive Programs to Promote Performance 6

Case Studies of State Support for Renewable Energy October 2006
module product line. This provision appears to require that the nameplate rating for each module product line represents a guaranteed minimum initial power output at STC. The only inverter rating standard in the U.S. is one currently used by the CEC. Sandia National Laboratories and several other organizations jointly developed a test protocol for measuring inverter efficiency (Bower et al. 2004). The CEC requires that results from these tests be submitted prior to designating an inverter model as eligible for their program, and the test results become the basis for the inverter efficiency values used by the CEC to compute incentive payments. Also relevant to long-term performance are standards that specify test procedures for assessing product reliability and durability. The Institute for Electrical and Electronics Engineers (IEEE) developed a U.S. standard for PV modules (IEEE-1262), but it is now outdated. Internationally, IEC 61215 and 61646, which apply to crystalline and thin-film modules respectively, include test procedures for assessing reliability, in addition to power output. Currently, no reliability-related industry standards exist for inverters. Other equipment and installation standards pertain primarily to safety, which are relevant to performance insofar as safety issues may also lead to pre-mature equipment failure or degradation. In the U.S., Underwriters Laboratories has established the two key product safety standards for PV systems: UL-1703 for PV modules and UL-1741 for inverters and other interconnection equipment. IEC 61730 is an analogous international product safety standard for modules. Also relevant to safety are IEEE-929 and IEEE-1527, which specify functional requirements for utility interconnected systems and have implications for inverters related to, for example, islanding and power quality. IEEE-929 is an older standard that applies specifically to PV systems and will not be updated in the future; it is being replaced by IEEE-1547, which applies to utility-interconnected distributed generation more generally. Finally, the National Electrical Code (NEC) contains numerous standards relevant to the wiring and electrical connections for PV systems, including Article 690, which specifically addresses PV installations. There is a certain level of overlap among these various safety standards. The current version of the NEC also requires that inverters used in grid-connected applications be UL-listed, and the 2008 version of the NEC will require the same of modules (Wiles 2006). In general, equipment and installation standards become binding when required by funding organizations for systems funded through their programs, by utilities for interconnection or net metering, or by lawmakers and permitting authorities for systems installed within their jurisdiction. Table 5 summarizes the most common equipment and installation standards required by PV incentive programs. As the table shows, most programs require modules to be UL-listed. As mentioned above, the CEC’s proposed guidebook for its new NSHP program recommends also requiring that module ratings be determined according IEC 61215/61646. Most programs also require that inverters be UL-listed, and over one-third also require that inverters comply with IEEE-929.7 Finally, a number of programs require that equipment be on the CEC’s list of eligible equipment (“CEC-listed”). At present, this simply implies the
7 States and municipalities may adopt the NEC with or without modification. The NEC is updated every several years, and there is often some time lag between each successive iteration of the NEC and its adoption by states and municipalities.
Designing PV Incentive Programs to Promote Performance 7

Case Studies of State Support for Renewable Energy October 2006
equipment is UL-listed and that inverters have been tested according to the protocol developed for the CEC. Table 5. Equipment Standards
State – Organization UL-1703 (modules)
IEC 61215/ 61646
(modules)
UL-1741 (inverters)
IEEE-929 (inverter)
CEC-listed (module and
inverter)† AZ – APS
AZ – SRP
AZ – TEP
AZ - UPS
CA – CEC ERP & PBI pilot
CA – CEC NSHP (proposed)
CA – IOUs SGIP CA – IOUs CSI *** To be determined To be determined To be determined To be determined To be determined
CA – LADWP *
CA – SMUD
CO – Xcel
CT – CCEF Small PV Program ††
CT – CCEF Large PV Program
DE – DEO
IL – DCEO *
MA – MTC
MD – MEA
ME – MSEP
MN – MSEO
NJ – NJCEP †††
NV – SPP/NP
NY – LIPA
NY – NYSERDA
OH – DOD
OR – ETO
PA – SDF †† RI – RIREF Small PV Program
RI – RIREF Large PV Program **
TX – Austin
VT – RERC
WA – DOR WI – WFE
† To be CEC-listed, modules and inverters must be certified as compliant with UL-1703 and UL-1741, respectively. In addition, each inverter model must undergo further testing to determine its maximum continuous power output, conversion efficiency, and tare losses. These tests are to be conducted by a Nationally Recognized Test Laboratory, according to the procedures specified in Bower et al. (2004).
†† Modules must be either CEC-listed or FSEC-listed, although SDF is somewhat flexible about this requirement. ††† NJCEP is in the process of implementing the requirement that equipment be CEC-listed (Hunter 2006). * In LADWP’s program, custom modules not certified by UL 1703 may qualify, provided that they are certified by the L.A. Department of
Building and Safety Materials Test Lab. Similarly, in DCEO’s program, modules that are not UL-listed may qualify provided that they have successfully completed at least one year of field testing.
** If the modules are not UL-listed, the applicant must demonstrate that they are in the process of gaining UL certification. Modules must also meet IEEE-1262.
*** The solar legislation recently enacted in California, SB1, requires that, by January 2008, the CEC establish eligibility criteria for solar energy systems receiving ratepayer funded incentives. Thus, the CSI equipment standards will ultimately be based on those developed by the CEC.
Designing PV Incentive Programs to Promote Performance 8

Case Studies of State Support for Renewable Energy October 2006
Warranty Requirements PV equipment manufacturers and installers may offer various types of warranties, which can be distinguished according to: the duration of coverage, the items covered (modules, inverters, other components, and/or the installation service), the conditions covered (performance degradation or simply failure/breakage), and the costs covered (parts or labor). PV incentive programs may specify minimum warranty requirements and thereby promote performance by imparting an incentive to manufacturers and installers to design and install reliable products, and by reducing the costs customers would otherwise bear to repair malfunctioning systems. Almost all of the programs reviewed in this report incorporate some type of minimum warranty requirement (see Table 6). The most common requirement is that the PV contractor warrantee the entire system, in most cases for a five-year period. California’s recently enacted solar legislation (SB1) requires a more aggressive 10-year system warranty for the state’s new incentive programs. Some programs alternatively (or also) have component-specific warranty requirements for modules (typically 10-20 years) and/or inverters (2-5 years). Although programs generally require that component warranties be provided by the manufacturer, several allow the PV contractor to warrantee components if the manufacturer’s warranty is insufficient (a potentially important distinction given that PV contractors may not remain in business for a 20-year warranty period). Finally, three programs require that installers provide distinct warranties for the installation service, for either a one- or two-year duration. With respect to the conditions covered by the warranty, all program requirements specify that the warranty provide protection against breakage or failure. Ten programs also require that the warranty include a performance guarantee that the output of the system or particular components does not degrade by more than a specified percentage from its rated value over the warranty period.8 Such performance guarantees are most often required as part of a system warranty, although CCEF and RIREF both also require that PV modules come with a separate performance guarantee of less than 20% degradation over 20 years. Regarding the costs that are covered, program guidelines typically require a “full” warranty covering parts and labor. As an exception, rather than requiring a full, five-year system warranty, SDF and CCEF both require a full warranty for two years and a limited (parts-only) warranty for an additional three years.
8 As an alternative to a “physical” performance guarantee, Black (2005) suggests that PV contractors could provide a “financial” performance guarantee, by reimbursing customers for energy not produced below a specified minimum level (essentially a form of insurance).
Designing PV Incentive Programs to Promote Performance 9

Case Studies of State Support for Renewable Energy October 2006
Table 6. Warranty Requirements Warranty Duration (yrs.)
State – Organization System Modules Inverters Installation Performance Guarantees
AZ – APS AZ – SRP AZ – TEP 10 2 AZ – UPS 10 2 CA – CEC ERP & PBI pilot 5 <10% degradation over 5 yrs (all components) CA – CEC NSHP (proposed) 10 <15% degradation over 10 yrs (all components) CA – IOUs SGIP 5 <10% degradation over 5 yrs (all components) CA – IOUs CSI 10 To be determined * CA – LADWP 5 20 <10% degradation over 5 yrs (all components) CA – SMUD 5 CO – Xcel 5 CT – CCEF Small PV Program 5 20 <10% degradation over 5 yrs (all components)
CT – CCEF Large PV Program 20 5 <10% degradation over 10 yrs and <20% over 20 yrs**
DE – DEO 5 IL – DCEO MA – MTC 5 MD – MEA ME – MSEP MN – MSEO 20 2† NJ – NJCEP 5 NV – SPP/NP 20 5 1 NY – LIPA 20 5 <20% degradation†† NY – NYSERDA 5 <10% degradation over 5 yrs (all components) OH – DOD ††† ††† OR – ETO 2 20 5 <20% degradation over 20 years (modules only) PA – SDF 5 RI – RIREF Small PV Program 2
RI – RIREF Large PV Program 5 20 <10% degradation over 5 yrs (all components) <20% degradation over 20 years (modules only)
TX – Austin 5 VT – RERC 5 1 WA – DOR WI – WFE 1 1 2
* The California solar legislation SB1 requires that systems funded through the state’s new programs have a 10-year warranty that protects against breakage and “undue degradation of electrical generation output.” The specific maximum percentage degradation allowed has yet to be determined for the CSI.
** The warranty requirements for CCEF’s Onsite Renewable DG Program are unclear about what components are to be covered by the performance guarantee.
† MSEO requires that, in addition to being provided with at least a 2-year inverter warranty, customers be offered the option to purchase an extended 5-year inverter warranty.
†† LIPA’s program guidelines are unclear about the duration of the performance guarantee and whether it just applies to modules or also to inverters.
††† The Ohio DOD requires that all components come with a manufacturer’s warranty, but does not specify the required duration or coverage. Installer Requirements, Assessments, and Voluntary Training The performance of PV systems depends, to a large degree, on the expertise of the professionals involved in their design and installation. PV program administrators have sought to ensure the proficiency of installers through a number of different approaches, including imposing installer eligibility requirements, disqualifying installers that have performed poorly, and directly sponsoring or otherwise supporting voluntary training activities.
Designing PV Incentive Programs to Promote Performance 10

Case Studies of State Support for Renewable Energy October 2006
Most of the programs reviewed in this report require that installers (that is, either the people actually performing the installations or, in some cases, at least a supervisor) meet some set of minimum qualifications related to their proficiency (see Table 7).9 The most common of these requirements, adopted by almost half of the programs, is that installers have a general contractors’ license, an electricians’ license, or (in California) a solar contractors’ license. More than a third of the programs require that installers have some minimum level of training and/or experience with PV, specifically. Included within this group are four programs that require installers to be certified by the North American Board of Certified Energy Professionals (NABCEP).10 Two of these programs – MSEP’s Solar Program and WFE’s Cash Back Rewards Program – are phasing in this requirement over a one- to two-year transitional period, during which time installers can participate provided that they are in the process of obtaining certification. Austin Energy, which currently requires all installers to be certified, also phased in this requirement over several years. Other programs’ training and experience requirements typically consist of some minimum number of installations (ranging from three to ten, as either the lead installer or an apprentice) and/or completion of a training course sponsored by the program administrator or another approved organization. A few programs require that installers submit references from previous projects. Given the nascent state of the installer infrastructure in many regions, some program administrators have taken a flexible approach to their training and experience requirements. For example, as a rule, NYSERDA requires installers to have completed at least three installations and at least 24 hours of nationally-accredited training. However, on a case by case basis, NYSERDA may allow installers that do not meet these standards to participate on a provisional basis. Installers designated as provisional are not included in the list of eligible installers on the program website, and NYSERDA works closely with these installers on each project, conducting detailed design reviews and site inspections. In Vermont, RERC also allows installers that do not meet the eligibility requirement to participate on a provisional basis, provided that they have completed an accredited training course and installed at least one system. SDF offers a proficiency test that installers can take to participate in the program provisionally, until they receive the requisite training. In addition to screening installers to determine their initial eligibility, some program administrators retain – and have executed – the option to subsequently disqualify installers if their workmanship is found to be unacceptable. Often, these types of problems are brought to the attention of the program administrator only through extraordinary circumstances. However, some program administrators take a more pro-active approach and have a process in place, typically involving site inspections and/or performance monitoring, to assess the performance of participating installers on a more routine basis. NYSERDA, for example, has uncovered a limited number of installation problems through its regular inspections and, as a result, has kicked one installer out of its program and demoted several others to provisional status (Ferranti
9 PV programs often impose other types of eligibility requirements on installers unrelated to proficiency (e.g., insurance requirements), which we do not discuss here. 10 To obtain NABCEP’s PV Installer Certification, an individual must pass the NABCEP-administered written exam and meet one of seven alternate minimum experience and training requirements, all of which include at least one year of PV installation experience.
Designing PV Incentive Programs to Promote Performance 11

Case Studies of State Support for Renewable Energy October 2006
2006). In California’s new CSI, installers that fail three inspections will be permanently disqualified from the program. Procedures will be developed to take into consideration the severity of the transgression and to offer opportunities for correction and an appeal mechanism. Table 7. PV Installer Requirements
State – Organization
Licensing* NABCEP certification Other Training/Experience
AZ – APS E
AZ – SRP
AZ – TEP AZ – UPS CA – CEC ERP & PBI pilot G/E/S CA – CEC NSHP (proposed) G/E/S CA – IOUs SGIP G/E/S CA – IOUs CSI To be determined To be determined To be determined CA – LADWP G/E/S 1-day LADWP-sponsored training seminar
CA – SMUD G/E At least 5 PV installations plus satisfaction of at least one of seven other alternate requirements related to licensing, training, experience, and education
CO – Xcel
CT – CCEF Small PV Program E Completion of PV installation training course plus at least 3 installations as lead installer or 10 as an apprentice
CT – CCEF Large PV Program DE – DEO IL – DCEO MA – MTC E MD – MEA
ME – MSEP E **
MN – MSEO NJ – NJCEP G NV – SPP/NP E NY – LIPA
NY – NYSERDA At least 3 installations and 24 hours of nationally accredited training
OH – DOD
OR – ETO G 1-day Energy Trust-sponsored training session PA – SDF Completion of SDF-recognized training course RI – RIREF Small PV Program RI – RIREF Large PV Program
TX – Austin E † Pass local Austin test developed and administered by Austin Energy (in addition to NABCEP certification)
VT – RERC At least 3 installations within the past year or NABCEP certification and one installation within the past year
WA – DOR
WI – WFE **
* Licensing Requirements: G = General Contractor (or equivalent), E = Electrical Contractor, S = Solar Contractor (CA), = license required but type unspecified.
** MSEP and WFE are both phasing in their NABCEP certification requirement and presently require only that installers be in the process of obtaining certification.
† Austin Energy began requiring NABCEP certification in January 2006. Prior to that, installers without NABCEP certification could participate in the program provided that they had at least 40 hours of PV training and two PV installations, and that they acquire NABCEP certification within two years of becoming eligible for the program.
Another approach that PV program administrators have taken to promote installer proficiency is to provide funding or other forms of support for voluntary installer training. For example,
Designing PV Incentive Programs to Promote Performance 12

Case Studies of State Support for Renewable Energy October 2006
LADWP previously offered a voluntary three-day installer training workshop, in addition to its mandatory one-day workshop. The Nevada utilities have also offered several voluntary installation training workshops, and post a list of installers that have attended these workshops on their program website as a reference for prospective customers. WFE offers higher buydown incentives for PV systems installed by NABCEP-certified installers (150% of the rate for non-certified installers) and also offers “business scholarships” to partially reimburse individuals for tuition or exam fees. Last but not least, NYSERDA has taken a particularly aggressive approach to promoting installer training and certification, providing various forms of support both to installers and to training and certification institutions. NYSERDA’s activities in this area have included: • providing funding to the Interstate Renewable Energy Council (IREC) and the Institute for
Sustainable Power11 to develop and implement a national accreditation and certification program for PV training institutions and instructors;
• providing funding to various educational institutions throughout New York to develop accredited training and continuing education programs;
• providing funding to NABCEP to develop its installer certification program; • offering 25-30 basic PV training sessions over the past three years, a one-week training
course, and an advanced PV course to help installers prepare for NABCEP certification or earn continuing education credits if already certified;
• sponsoring study assistance and training tools (e.g., an online refresher course) to help installers prepare for the NABCEP certification exam; and
• working with NABCEP and IREC to develop marketing tools and materials to help NABCEP-certified installers differentiate themselves.
Design Standards and Administrative Design Review The performance of PV systems is critically affected by decisions made during the design phase (e.g., the positioning of the modules and the sizing of the inverters). PV program administrators have sought to weed out poorly-designed systems through two general approaches: adopting minimum design standards and reviewing project designs prior to reserving funding. Thirteen programs have adopted some form of minimum design standard (see Table 8). These standards come in two basic varieties. Some are specified in terms of measurable design parameters – most commonly, panel orientation and/or amount of shading. Panel orientation requirements generally specify that the panels be facing in a southerly direction, and in several cases, that their tilt angle fall within a designated range. Shading standards are specified in terms of either a maximum number of hours of shading or the physical position of obstructions relative to the panels. The second broad category of design standards are those that are specified in terms of estimated annual energy production – expressed either on an absolute basis (e.g., kWh per year, per
11 IREC is the organization responsible for implementing the accreditation and certification program for renewable energy training institutions and instructors in the U.S. An accreditation or certification from IREC means that the training institution or instructor has met a specific set of standards developed by the Institute for Sustainable Power.
Designing PV Incentive Programs to Promote Performance 13

Case Studies of State Support for Renewable Energy October 2006
installed kW) or on a relative basis, by comparing the expected output of the system to that of an “ideal” reference system. One important feature of the latter approach is that the ideal reference system may be defined to include or exclude any of the myriad design parameters that affect performance (provided that its effect can be reliably estimated). For example, most programs with this form of design standard define the ideal system as one with optimal orientation and no shading, but composed of the same equipment and sited at the same geographical location as the actual system. The Nevada utilities and RIREF define the ideal reference system even more narrowly, as simply an un-shaded system identical to the actual system in all other respects; their minimum performance standards are thus essentially a variation on shading standards. Table 8. Programs with Minimum Design Standards
Design Parameters State – Organization Azimuth† Tilt Shading
Estimated Annual Output††
AZ – TEP††† ± 90° of true south 10-60° Unshaded from 3 hrs after sunrise to 3 hrs before sunset
AZ – UPS ± 90° of true south 10-60° Unshaded from 3 hrs after sunrise to 3 hrs before sunset
CA – LADWP Unshaded 90% of the time CO – Xcel
No obstructions within a horizontal angle of ±60° from panel centerline or within a vertical angle of 15-90°
MA – MTC ± 90° of due south 70% of ideal MD – MEA * Unshaded 70% of the time MN – MSEO 960 kWh/kW
(~87% of ideal) NJ – NJCEP 80% of ideal per
system (40% for BIPV) and 70% of ideal per string **
NV – SPP/NP ± 90° of true south 75% of un-shaded system
OH – DOD South-facing (solar subdivisions) ***
30-45° (solar subdivisions) ***
No shading from 7 AM to 8 PM (other residential PV) ***
OR – ETO ± 90° of true south (if not “low sloped”)
75% of ideal (case-by-case exceptions for BIPV)
PA – SDF 70% of ideal RI – RIREF Small
PV Program ± 45° of true south, if <7% loss from shading
>45° in areas with high snow accumulation
93% of un-shaded system if azimuth is not within ± 45° of true south
† Due south (as indicated by a compass) differs from true south, because the earth’s magnetic poles are off-centered from its rotational axis. In the continental U.S., the divergence can be as large as 20° and is greatest in the northwest and northeast.
†† Programs in this table define the “ideal” system as having optimal orientation and no shading, but otherwise identical to the actual system. ††† TEP also requires: (a) that modules be at least four inches above any surface, with an additional inch of clearance required for each foot of
continuous array surface beyond four feet in the direction parallel to the mounting support surface; and (b) that the total voltage drop on the DC and AC wiring, from the furthest PV module to the AC meter, not exceed 2%.
* MEA specifies their shading requirement as “70 percent of the array [must be] shade-free throughout the year to be considered for the grant.” Taken at face value, this statement would allow a project to be partially shaded during all hours of the year. We assume that the intended requirement is that the entire array be shade-free during 70% of the time.
** A string is a number of PV modules wired in series. PV arrays often consist of multiple strings, wired to one another in parallel. *** The Ohio DOD is currently offering funding for PV through three separate solicitations targeted to different markets (new residential
subdivisions, other types of residential projects, and non-residential projects), each with slightly different minimum design standards or, in the case of non-residential projects, no designs standards.
Designing PV Incentive Programs to Promote Performance 14

Case Studies of State Support for Renewable Energy October 2006
Two types of specialized tools are often required to demonstrate compliance with design standards. First, a shading analysis tool is typically needed in order to estimate the number of hours of shading per year or to estimate the reduction in available solar energy due to shading.12 Second, some type of software is needed to estimate the annual energy production of a particular PV system. A number of programs require that applicants use PVWATTS, a simulation tool developed by the National Renewable Energy Laboratory, accessible on-line. Alternatively, several programs have developed their own simple spreadsheet models or have purchased commercial products such as Clean Power Estimator, which they make available to applicants. The other general approach that many program administrators have taken to target design issues is to conduct some form of design review of proposed projects, prior to reserving funding. As could be expected, these administrative reviews vary widely in terms of the specific process utilized and the detail in which designs are scrutinized. At the most basic level, many programs simply request information about panel orientation in the project application form (although it is not always apparent from program literature whether poor orientation would actually cause a project to be rejected). A number of other programs require somewhat more detailed information (e.g., site drawing or photographs) or more rigorous analysis by the applicant. For example, CCEF requires that installers include in their project applications the results of a shading analyses and an estimate of annual energy production based on an acceptable simulation tool. Rather than relying solely on information submitted by applicants, Austin Energy, the Nevada utilities, and SMUD conduct pre-installation site inspections and assessments for all projects, and MTC does the same for a sample of projects. Although most program administrators conduct design reviews in-house with program staff, the Nevada utilities have contracted this service out to a technical consultant, and NYSERDA uses a two-tier review process involving both program staff and outside consultants. All projects in NYSERDA’s program are first reviewed in-house to flag potential performance issues. Technical consultants then conduct more detailed design reviews for: (a) projects with potential performance issues identified through the initial in-house review, (b) projects larger than 15 kW, (c) installers with fewer than four installations, and (d) installers with prior issues. Incentive-Based Approaches Historically, PV incentive programs in the U.S. have provided rebates for PV systems based on their rated capacity, disbursed prior to or immediately following installation. While simple to administer, this incentive structure does not directly impart an incentive for performance.13 To address this shortcoming, a number of programs have adopted alternative incentive structures or modifications to the same basic incentive structure, which differentiate among projects based on
12 The Solar Pathfinder is a relatively low-tech, on-site shading analysis instrument used in many programs. SMUD has developed its own shading analysis software tool, which analyzes digital photographs to estimate hourly, monthly, and annual shade percentages (Bartholomy et al. 2006). A number of other programs use the Clean Power Estimator, which has a built-in shade analysis tool that computes shading losses based on the height and angular position of obstructions relative to the PV panels, which are measured manually. 13 Of course, most customer-sited PV systems are net metered, in which case the customer’s bill savings directly depend on PV energy production, thereby imparting a direct incentive to ensure that the system performs well.
Designing PV Incentive Programs to Promote Performance 15

Case Studies of State Support for Renewable Energy October 2006
either their actual performance or factors that are likely to affect their performance. These incentive-based approaches include: • Performance-based incentives (PBI), whereby the incentive payment is calculated based on
the measured output of the system over an operational period of usually one year or more; • Expected performance-based buydowns (EPBB), whereby the incentive is provided up-
front, but is adjusted to account for factors that are likely to affect performance, such as panel orientation and shading;
• Incentive hold-backs, whereby a portion of the up-front rebate is held back and disbursed only after operational data has been submitted demonstrating acceptable performance; and
• Improved rating conventions that better reflect the performance of the system under actual operating conditions or that account more fully for system components that affect performance.
Note that Hoff (2006) describes a number of other hypothetical incentive designs.14 However, we focus exclusively on the four basic approaches listed above, which are being used by the PV incentive programs in our review. Performance-Based Incentives
Only four programs reviewed in this report incorporate a PBI (see Table 9).15 In addition, MTC previously offered a PBI as part of an earlier PV incentive program, but opted not to incorporate a PBI into its current program, which is focused on small systems (<10 kW), due to the administrative costs and complexity (Abe 2006). Of the four PBI programs reviewed in this report, SDF’s Solar PV Grant Program has several unique structural features that deserve mention up-front. First, the program has a hybrid incentive structure, where a significant portion of the total incentive payment is provided in the form of a traditional, up-front capacity-based payment. The other three programs offer a pure PBI payment (i.e., no additional up-front payment). Second, SDF’s program splits the PBI payment between the customer and installer, thereby providing both parties with a direct incentive to attend to system performance. The other three programs provide the entire PBI payment to a single entity (the system owner, in Washington’s program, and in the CEC’s PBI pilot and the new CSI program in California, to whatever entity serves as the project applicant). The four PBI programs shown in Table 9 all offer flat, energy-based incentive rates16 and can be differentiated according to the basic design parameters identified in the table. The first design
14 These include: Performance-Based Buydowns, which provide an upfront payment based on estimated performance, but are adjusted over time based on actual performance; and Capacity-Based Incentives, which provide multiple payments over time based on the manufacturer’s ratings. 15 Though not shown in the table, CCEF also offers a small supplemental PBI payment within its On-site Renewable DG Program ($0.01/kWh for the first year of energy production) for projects installed in the congested Southwest Connecticut region. Also, as noted previously, there are various programs in the U.S., not covered in this report, whereby renewable energy credits are purchased by means of a payment based on PV energy production, which is essentially the same payment structure as a PBI. See footnote 2 for a list of these programs. 16 In principle, one could design a PBI based on a more complex incentive rate structure – for example, time-differentiated energy rates that value more highly energy produced during peak periods (as suggested by some
Designing PV Incentive Programs to Promote Performance 16

Case Studies of State Support for Renewable Energy October 2006
issue is what type of projects are subject to a PBI. The three programs other than the CSI provide a PBI to all projects participating in the program. Of these three programs, SDF’s is limited to relatively small systems, while the other two (the CEC’s PBI pilot and the Washington State program) have no restrictions on the size or type of PV system eligible. Table 9. Programs with a PBI State – Organization Applicable Projects Incentive Rate Performance
Period Payment
Frequency CA – CEC PBI pilot All projects eligible for the
program (no size restrictions) $0.50/kWh 3 yrs. Quarterly
CA – IOUs CSI To be determined † $0.39/kWh (res. & comm.) $0.50/kWh (gov. & non-profit)††
5 yrs. Monthly
PA – SDF * All projects eligible for the program (systems 1-5 kW)
$1.00.kWh (customer) $0.10/kWh (installer) 1 yr. One annual payment
WA – DOR All projects eligible for the program (no size restrictions) $0.15/kWh ** Through June 2014 Annually
† The CPUC’s August 2006 decision (CPUC 2006) specifies that only a PBI be offered for BIPV systems and for systems larger than a specified size (initially 100 kW, ramping down to 30 kW over several years) installed on existing buildings. Other projects, which would be eligible to receive an EPBB, could opt instead for a PBI. Modifications to this structure are currently being considered in order to comply with the state’s recently enacted solar legislation, SB1, which requires that, by January 2008, all incentives for projects >100 kW be in the form of a PBI (with no exception for new construction) and that half of all incentives for projects larger than 30 kW be in the form of a PBI.
†† The CSI incentive rates will be ramped down over time; the values listed here are the initial incentive rates. * SDF’s program has a hybrid incentive structure composed of a PBI (split between the customer and installer) and a standard capacity-based
buydown. ** Under the WA program, the base incentive rate of $0.15/kWh is increased by a factor of 1.2, 2.4, or 3.6 if the inverters, modules, or both
(respectively) are manufactured in Washington state. The CSI is unique in that it will differentiate among projects in terms of whether a PBI is required and how it is structured (although these details are currently in flux). The CPUC’s August 2006 decision (CPUC 2006) specifies that a PBI would initially be required only for systems larger than 100 kW installed on existing buildings and for all building-integrated PV (BIPV) systems. Other projects would be eligible for an up-front incentive but could opt for a PBI, which might be more lucrative for particularly high-performance projects (e.g., concentrating solar and tracking systems). The rationale for offering only a PBI for BIPV systems is that an accurate module rating system for BIPV products does not yet exist. The CPUC’s primary rationale for the 100 kW threshold is that systems of this size are generally already financed, so moving to a PBI would not require any fundamental change in the way that these projects are funded.17 The CPUC stated its intent to transition to a 30 kW size threshold over a two-to-three year period, in order to “allow sales and financing arrangements to evolve in the direction of a PBI” (CPUC 2006). The CPUC’s decision exempts all new construction projects (other than BIPV) from the PBI requirement, regardless of system size, as builders and developers (who are often the recipient of the incentive) are typically not in a position to effectively assume ongoing responsibility for system performance. The CPUC is currently revising the rules governing applicability of the PBI in light of the solar legislation recently passed in California, SB1, which specifies that, by January 2008, all incentives for systems larger than 100 kW and half of all incentives for systems larger than 30 kW be provided in the form of a PBI (with no exceptions for new construction).
parties in the CPUC’s CSI proceeding), or an incentive payment based on the system’s measured capacity (kW) coincident with the utility’s system-wide peak demand. 17 Another reason for initially focusing on large systems (though not specifically cited by the CPUC) is that these projects are few in number, and thus the additional administrative costs would be minimized, in terms of both the total administrative cost and the incremental percentage impact on project costs.
Designing PV Incentive Programs to Promote Performance 17

Case Studies of State Support for Renewable Energy October 2006
Two other PBI design parameters, which together form the basis for the total incentive payment per project, are the magnitude of the incentive rate and the duration of the performance period (that is, the time period during which energy production is measured for the purpose of calculating the incentive payment). Among the four PBI programs, incentive rates range from $0.15/kWh in Washington’s program to $1.10/kWh in SDF’s program (the sum of the PBIs for the customer and installer). In the CSI program, incentive rates, both PBI and non-PBI, are differentiated among customer types, reflecting the various tax benefits available to residential and commercial customers but not to government and non-profit customers.18 With respect to the performance period, three of the four programs specify a particular duration, ranging from one to five years. The fourth program, Washington’s, instead designates a single date as the end of the performance period for all projects. Any project installed during the program’s operation can receive PBI payments through the end of the program. The duration of the performance period is significant not just because it is one determinant of the size of the incentive, but also because it determines how effective the PBI will be in addressing performance issues that arise only over time (e.g., inverter failures and tree trimming). For this reason, the CPUC opted for a 5-year period as what it believed to be reasonable balance between promoting performance and minimizing administrative costs associated with processing PBI payments. The last of the basic design parameters identified in Table 9 is the frequency of the incentive payments. For the new CSI program, the CPUC opted to require monthly PBI payments in order to provide more regular feedback on system performance to the customer. The other three programs all issue payments less frequently. As with the duration of the performance period, the main tradeoff is that more frequent payments incur higher administrative and transaction costs. Expected Performance-Based Buydowns
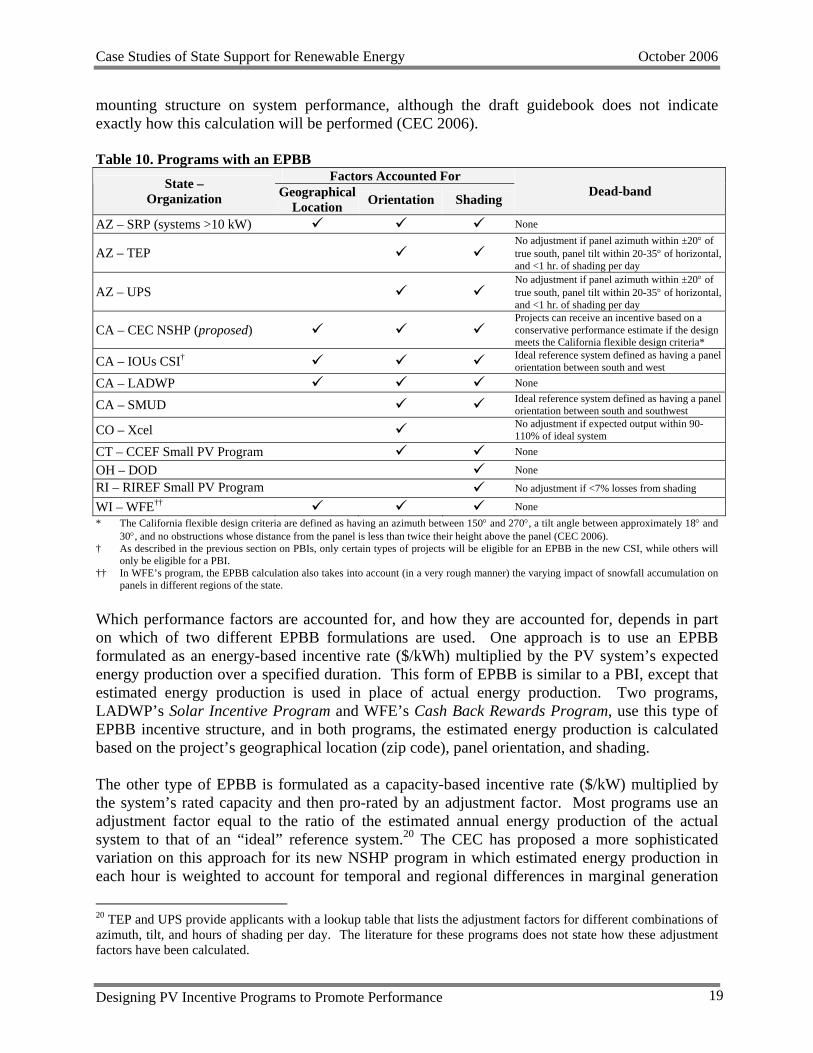
The fact that incentives under a PBI structure are paid over time may deter some customers from investing in PV, for example, if they are unable to pay out-of-pocket or arrange attractive financing for the full, up-front cost of a PV system. Expected performance-based buydowns (EPBBs) are an alternative approach whereby the incentive is provided up-front but can account for factors that are likely to affect performance and whose impact can be estimated up-front. Twelve of the programs reviewed in this report offer incentives in the form of an EPBB (see Table 10). The EPBBs used in these programs account for one or more of the three performance-related factors identified in the table (geographical location, panel orientation, and shading).19 The CEC has also proposed, for its new NSHP program, to account for the effect of
18 In particular, residential and commercial customers are able to claim federal tax credits for PV (at least through 2007, when the current tax credits are scheduled to expire), and commercial customers receive further financial benefits in the form of accelerated depreciation and interest payment tax deductions. 19 As with minimum design standards, shading analysis tools and/or PV simulation software are generally required for EPBB calculations. The reader may refer to the related discussion in the section on minimum design standards for additional information about these tools. The CEC is currently in the process of developing its own software that will be used to estimate annual energy production in the NSHP.
Designing PV Incentive Programs to Promote Performance 18
Case Studies of State Support for Renewable Energy October 2006
mounting structure on system performance, although the draft guidebook does not indicate exactly how this calculation will be performed (CEC 2006). Table 10. Programs with an EPBB
Factors Accounted For State – Organization Geographical
Location Orientation Shading Dead-band
AZ – SRP (systems >10 kW) None
AZ – TEP No adjustment if panel azimuth within ±20° of true south, panel tilt within 20-35° of horizontal, and <1 hr. of shading per day
AZ – UPS No adjustment if panel azimuth within ±20° of true south, panel tilt within 20-35° of horizontal, and <1 hr. of shading per day
CA – CEC NSHP (proposed) Projects can receive an incentive based on a conservative performance estimate if the design meets the California flexible design criteria*
CA – IOUs CSI† Ideal reference system defined as having a panel orientation between south and west
CA – LADWP None
CA – SMUD Ideal reference system defined as having a panel orientation between south and southwest
CO – Xcel No adjustment if expected output within 90-110% of ideal system
CT – CCEF Small PV Program None
OH – DOD None
RI – RIREF Small PV Program No adjustment if <7% losses from shading
WI – WFE†† None * The California flexible design criteria are defined as having an azimuth between 150° and 270°, a tilt angle between approximately 18° and
30°, and no obstructions whose distance from the panel is less than twice their height above the panel (CEC 2006). † As described in the previous section on PBIs, only certain types of projects will be eligible for an EPBB in the new CSI, while others will
only be eligible for a PBI. †† In WFE’s program, the EPBB calculation also takes into account (in a very rough manner) the varying impact of snowfall accumulation on
panels in different regions of the state. Which performance factors are accounted for, and how they are accounted for, depends in part on which of two different EPBB formulations are used. One approach is to use an EPBB formulated as an energy-based incentive rate ($/kWh) multiplied by the PV system’s expected energy production over a specified duration. This form of EPBB is similar to a PBI, except that estimated energy production is used in place of actual energy production. Two programs, LADWP’s Solar Incentive Program and WFE’s Cash Back Rewards Program, use this type of EPBB incentive structure, and in both programs, the estimated energy production is calculated based on the project’s geographical location (zip code), panel orientation, and shading. The other type of EPBB is formulated as a capacity-based incentive rate ($/kW) multiplied by the system’s rated capacity and then pro-rated by an adjustment factor. Most programs use an adjustment factor equal to the ratio of the estimated annual energy production of the actual system to that of an “ideal” reference system.20 The CEC has proposed a more sophisticated variation on this approach for its new NSHP program in which estimated energy production in each hour is weighted to account for temporal and regional differences in marginal generation
20 TEP and UPS provide applicants with a lookup table that lists the adjustment factors for different combinations of azimuth, tilt, and hours of shading per day. The literature for these programs does not state how these adjustment factors have been calculated.
Designing PV Incentive Programs to Promote Performance 19
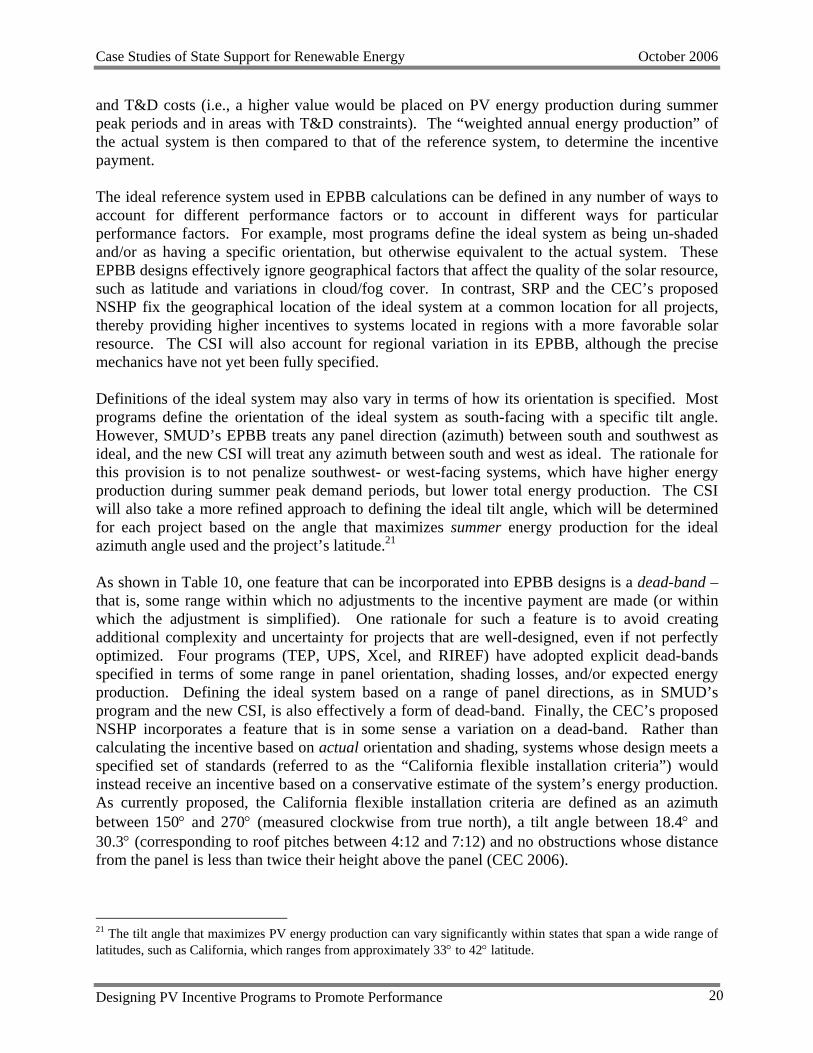
Case Studies of State Support for Renewable Energy October 2006
and T&D costs (i.e., a higher value would be placed on PV energy production during summer peak periods and in areas with T&D constraints). The “weighted annual energy production” of the actual system is then compared to that of the reference system, to determine the incentive payment. The ideal reference system used in EPBB calculations can be defined in any number of ways to account for different performance factors or to account in different ways for particular performance factors. For example, most programs define the ideal system as being un-shaded and/or as having a specific orientation, but otherwise equivalent to the actual system. These EPBB designs effectively ignore geographical factors that affect the quality of the solar resource, such as latitude and variations in cloud/fog cover. In contrast, SRP and the CEC’s proposed NSHP fix the geographical location of the ideal system at a common location for all projects, thereby providing higher incentives to systems located in regions with a more favorable solar resource. The CSI will also account for regional variation in its EPBB, although the precise mechanics have not yet been fully specified. Definitions of the ideal system may also vary in terms of how its orientation is specified. Most programs define the orientation of the ideal system as south-facing with a specific tilt angle. However, SMUD’s EPBB treats any panel direction (azimuth) between south and southwest as ideal, and the new CSI will treat any azimuth between south and west as ideal. The rationale for this provision is to not penalize southwest- or west-facing systems, which have higher energy production during summer peak demand periods, but lower total energy production. The CSI will also take a more refined approach to defining the ideal tilt angle, which will be determined for each project based on the angle that maximizes summer energy production for the ideal azimuth angle used and the project’s latitude.21 As shown in Table 10, one feature that can be incorporated into EPBB designs is a dead-band – that is, some range within which no adjustments to the incentive payment are made (or within which the adjustment is simplified). One rationale for such a feature is to avoid creating additional complexity and uncertainty for projects that are well-designed, even if not perfectly optimized. Four programs (TEP, UPS, Xcel, and RIREF) have adopted explicit dead-bands specified in terms of some range in panel orientation, shading losses, and/or expected energy production. Defining the ideal system based on a range of panel directions, as in SMUD’s program and the new CSI, is also effectively a form of dead-band. Finally, the CEC’s proposed NSHP incorporates a feature that is in some sense a variation on a dead-band. Rather than calculating the incentive based on actual orientation and shading, systems whose design meets a specified set of standards (referred to as the “California flexible installation criteria”) would instead receive an incentive based on a conservative estimate of the system’s energy production. As currently proposed, the California flexible installation criteria are defined as an azimuth between 150° and 270° (measured clockwise from true north), a tilt angle between 18.4° and 30.3° (corresponding to roof pitches between 4:12 and 7:12) and no obstructions whose distance from the panel is less than twice their height above the panel (CEC 2006).
21 The tilt angle that maximizes PV energy production can vary significantly within states that span a wide range of latitudes, such as California, which ranges from approximately 33° to 42° latitude.
Designing PV Incentive Programs to Promote Performance 20

Case Studies of State Support for Renewable Energy October 2006
Incentive Hold-backs
Programs offering standard capacity-based buydowns or EPBBs often disburse these payments only after systems have been installed and determined, through inspections or other means, to be operating properly. Several programs have gone one step further, by holding back a portion of the rebate over a lengthier operational period (e.g., six months to one year), disbursing it only after energy production data has been submitted and acceptable performance has been demonstrated. In its Onsite Renewable DG Program, CCEF pays the incentive out in three installments: 50% upon delivery of the equipment to the project site; 40% after startup, inspection, and commissioning; and the remaining 10% after six months of operating data has been collected and the system has shown to have produced at least 70% of its projected AC energy production, as verified by CCEF’s independent consulting engineer. MTC also holds back a portion of the incentive payment (10%) for one year, which it disburses only after the customer or installer submits performance data. MTC’s program has no specific performance threshold that systems must meet in order to receive the final incentive installment. Rather, the incentive is held back, in large part, simply to motivate the applicant to submit performance data sought for program evaluation purposes. NYSERDA incorporated a hold-back provision in a previous program, but discontinued the practice because of difficulties getting installers to collect and submit the data (Ferranti 2006). Improved Rating Conventions
A common issue relevant to standard capacity-based buydowns as well as most EPBBs is what capacity rating convention to use as the basis for the incentive payment.22 The simplest rating convention, but least indicative of actual performance, is the module manufacturer’s rated DC power output under Standard Test Conditions (STC).23 Of the programs reviewed in this report, about half provide a rebate payment based on this measure of system capacity, including six programs with an EPBB (see Table 11). Naturally, any capacity rating is a poor proxy for the likely energy production of a system. However, there are several reasons why module manufacturers’ ratings may not even be a particularly reliable proxy for a system’s actual capacity (i.e., its AC power output at peak sun conditions). The first reason is that actual cell temperatures under normal operating conditions are generally significantly higher than STC, which reduces a module’s power output, and the size of this effect will vary depending on the climate as well as on the type of module and mounting structure used. Second, various losses are incurred in converting modules’ DC power output to AC power, and the size of these losses will also vary between systems depending, for example, on the type of inverter used and how well-matched it is to the array. Third, module manufacturers’ ratings have an associated tolerance band, and inevitably there is some variation in output at STC among individual modules within a product line.24 Moreover, there has been some empirical evidence to suggest that the nameplate ratings of modules sold in the U.S. may 22 As currently proposed, the EPBB used for the CEC’s new NSHP will not depend on the type of capacity rating used. Instead, the estimated energy production will be calculated by modeling module performance based on a standard set of parameters provided by module manufacturers. 23 Standard Test Conditions are defined as 1000 W/m2 irradiance and 25 °C cell temperature. 24 For example, in tests of nine manufacturers’ modules conducted by FSEC, the standard deviation in power output at STC ranged from approximately 1% to 3% across module samples from seven manufacturers (Szaro 2006).
Designing PV Incentive Programs to Promote Performance 21

Case Studies of State Support for Renewable Energy October 2006
be systematically inflated by as much as 10% in some cases (BEW 2006, Szaro 2006, Whitaker 2006). There are two simple improvements on modules’ rated output at STC that can be adopted independently or jointly. One improvement is to use modules’ rated DC output at PVUSA Test Conditions (PTC)25, which better correspond to actual cell operating temperatures under full sun conditions in most climates. Eight programs use module ratings at PTC to calculate incentive payments. The other improvement is to multiply modules’ rated output (at either PTC or STC) by the rated inverter efficiency, to calculate an AC capacity rating for the system and thereby account for what is typically the largest source of DC-to-AC losses (the inverter). Seven programs reviewed in this report use an AC rating calculated in this manner. Most use a particular variation, often referred to as the “CEC-AC” rating, based on the modules’ rated output at PTC and the inverter efficiency ratings published by the CEC (equal to a weighted average of an inverter’s rated efficiency at six different load levels). Although the CEC-AC rating is, by most standards, the most accurate and encompassing of the various rating conventions thus far described, it still does not account for DC-to-AC losses other than the inverter, nor can it account for inaccurate nameplate ratings. However, these two factors can be accounted for by AC ratings that are based on measurements of each individual system – what is sometimes referred to as a “verified AC rating.” Such an approach has the additional advantage of providing early detection of equipment or installation problems. Of the programs reviewed in this report, only SRP and TEP use a verified AC rating, although their approaches differ substantially. In SRP’s program, the verified AC rating (which is only used for systems >10 kW) is calculated by multiplying the system’s stipulated CEC-AC rating by the ratio of the actual energy production measured over a 30-day period to the estimated energy production over the same period.26 The estimated energy production is calculated based on the system’s stipulated CEC-AC rating, its orientation and shading, and actual weather data (specifically, satellite solar radiation data and ambient temperature data for Phoenix). If the ratio of actual to estimated energy production is between 0.95 and 1.00, the initial stipulated rating is used to determine the incentive payment rather than the adjusted value (presumably in order to avoid penalizing customers for small inaccuracies in the measurements or estimation method). TEP uses a verified AC rating method only for “Option 1” of its program. To determine the rating, TEP measures each system’s AC power output, solar insolation, and wind speed over a two-week period. The utility then develops a linear regression among these three measured variables, and uses that statistical relationship to estimate the system’s AC output at PTC (Henry 2006).
25 PVUSA Test Conditions are defined as 1000 W/m2 irradiance, 20 °C ambient temperature, and 1 m/s wind speed. 26 The CPUC staff proposal for the CSI program recommended using a verified AC rating method similar to SRP’s, but the CPUC decided against adopting for the time being, because of its perceived administrative complexity.
Designing PV Incentive Programs to Promote Performance 22

Case Studies of State Support for Renewable Energy October 2006
Table 11. Capacity Rating Conventions State – Organization Capacity Rating
Convention Additional Information
AZ – APS DC – STC AZ – SRP (<10 kW systems) DC – STC
AZ – SRP (>10 kW systems) Verified AC AC rating is determined by multiplying a stipulated rating (using the CEC ERP approach) by the ratio of the actual output over a 30-day period to the estimated output over the same period.
AZ – TEP (option 1) Verified AC AC output at PTC is estimated from measurements of each system’s AC power output, solar insolation, and wind speed.
AZ – TEP (option 2) n/a No capacity rating required: TEP supplies the PV system at a discounted price.AZ – TEP (option 3) DC – STC AZ – UPS DC – STC
CA – CEC ERP AC – PTC Efficiency rating for each inverter model is based on the weighted average of its efficiency at six different load levels.
CA – CEC PBI pilot n/a No capacity rating required: incentive is a PBI.
CA – CEC NSHP (proposed) n/a The EPBB incentive calculation uses a model of module performance that accounts for the particular climate and type of mounting structure used.
CA – IOUs SGIP AC – PTC Uses the CEC’s inverter efficiency ratings. CA – IOUs CSI (EPBB projects) AC – PTC Uses the CEC’s inverter efficiency ratings. CA – IOUs CSI (PBI projects) n/a No capacity rating required: incentive is a PBI.
CA – LADWP AC – PTC The incentive is based on an “adjusted STC” rating equal to 1.12 times the rated output at PTC, multiplied by the CEC’s rated inverter efficiency.
CA – SMUD AC – PTC Uses the CEC’s inverter efficiency ratings. CO – Xcel DC – STC CT – CCEF Small PV Program DC – PTC CT – CCEF Large PV Program DC – PTC DE – DEO n/a No capacity rating required: incentive is based on project cost. IL – DCEO n/a No capacity rating required: incentive is based on project cost. MA – MTC DC – STC MD – MEA n/a No capacity rating required: incentive is based on project cost. ME – MSEP DC – STC MN – MSEO DC – STC NJ – NJCEP DC – STC NV – SPP/NP AC – PTC AC rating based on rated inverter efficiency at 75% loading. NY – LIPA DC – STC NY – NYSERDA DC – STC OH – DOD DC – STC OR – ETO DC – STC PA – SDF DC – STC RI – RIREF Small PV Program DC – STC RI – RIREF Large PV Program DC – STC TX – Austin AC – STC Inverter efficiency rating method not specified. VT – RERC DC – STC WA – DOR n/a No capacity rating required: incentive is a PBI.
WI – WFE DC – STC Module output is de-rated by 20% for the incentive calculation, but we don’t classify this as an AC rating, since it doesn’t differentiate between projects.
Designing PV Incentive Programs to Promote Performance 23
Case Studies of State Support for Renewable Energy October 2006
Post-Installation Site Inspections and Acceptance Testing As discussed previously, pre-installation inspections may be conducted as part of an administrative design review process, to assess the suitability of the site for a PV installation. Post-installation inspections typically serve a different purpose and may be conducted by a number of entities for different reasons: the building inspector assesses code compliance; the local utility ensures that the installation complies with its interconnection standards; and the PV program administrator or its representative verifies that the installation is consistent with the approved project application and, in some cases, verifies that it is functioning properly.27 Routine post-installation site inspections are conducted in more than half of the programs reviewed in this report (see Table 12). In several of these programs, inspections are conducted only for a sample of projects; in the others, all projects are inspected, and incentive payments are issued only after projects have passed inspection. As might be expected, the depth of the inspection process varies considerably across these programs, and without talking to each program manager, it is not always evident what the process entails. Based on the information available, in many programs the post-installation inspection serves mainly just to verify that the installed system is consistent with the approved application (e.g., by checking equipment ratings and module orientation), but the quality of the installation workmanship and system performance are not directly verified. However, at least several programs do conduct more detailed inspections. For example, NYSERDA frequently checks for code compliance and a number of program administrators conduct “acceptance tests,” which involve various measurements that serve to verify that the system is producing the expected amount of power.28 Alternatively, a number of programs require that installers conduct acceptance tests and submit satisfactory results prior to receiving the full incentive payment.
27 In practice, these roles may not be so clearly delineated, as the program administrators often also assess code compliance, particularly if local building inspectors are not well acquainted with PV. 28 Acceptance tests involve measurements of solar insolation and power output, and can also include measurements of ambient temperature and wind speed. See Celentano (2005) for a description of the acceptance test procedure used in SDF’s program.
Designing PV Incentive Programs to Promote Performance 24

Case Studies of State Support for Renewable Energy October 2006
Table 12. Post-Installation Inspection and Assessment Procedures Post-Installation Inspection* Acceptance Testing
State – Organization All Projects Sample Conducted by Program Admin.
Required of Installer
AZ – APS AZ – SRP AZ – TEP AZ – UPS CA – CEC ERP CA – CEC PBI pilot CA – CEC NSHP (proposed) ** CA – IOUs SGIP CA – IOUs CSI† <30 kW 30-100 kW
CA – LADWP CA – SMUD CO – Xcel CT – CCEF Small PV Program CT – CCEF Large PV Program DE – DEO IL – DCEO MA – MTC MD – MEA ME – MSEP MN – MSEO NJ – NJCEP NV – SPP/NP NY – LIPA NY – NYSERDA OH – DOD OR – ETO PA – SDF RI – RIREF Small PV Program RI – RIREF Large PV Program TX – Austin VT – RERC WA – DOR WI – WFE†† * This table only summarizes inspections conducted by the program administrator or their representative for the purpose of verifying
consistency with the application and/or assessing installation quality. ** The draft NSHP guidebook allows sampling within large housing developments where PV systems are pre-plotted on more than six homes. † The inspection process for systems >100 kW funded through the CSI has not yet been formally specified. †† WFE may consider spot checking systems in the future, but is not doing so at present due to budget constraints (Wolter 2006).
Designing PV Incentive Programs to Promote Performance 25
Case Studies of State Support for Renewable Energy October 2006
Performance Monitoring and Assessment Many performance issues arise only over time, and to identify and remedy these issues, PV systems must be monitored and their performance routinely assessed. PV program administrators may conduct this monitoring and performance assessment directly, which requires that some data reporting or collection process be established. PV programs may also facilitate performance monitoring and assessment by the system owner, by providing or requiring that installers provide customer training and/or enabling technologies, such as “customer-friendly” meter displays and diagnostic tools. An essential element to performance monitoring, regardless of who conducts it, is the metering equipment used to measure system output. Most programs require that gross PV output be metered, i.e., separate from net metering of the facility’s load (see Table 13). Programs’ metering specifications differ in terms of the required accuracy: nine programs require “revenue-grade” meters, while others allow less accurate meters (e.g., ±5%). Specifications also differ somewhat in terms of the required functionality. For example, several programs require that the meter have communications capabilities, several require an “easy to read” display, and several require that the meter measure and display instantaneous power output in addition to cumulative energy production. Of the programs reviewed in this report, only the CSI requires interval metering29 (just for systems >10 kW). Many of the programs with metering requirements also have a data collection or reporting process – a prerequisite if program administrators are to assess PV systems’ performance (see Table 13). In most cases, the customer or installer is responsible for submitting data to the program administrator via the telephone or internet, although a number of program administrators collect data themselves through site visits, and two programs have remote data collection capabilities. Programs also vary in terms of how frequently performance data are collected (in about half the cases, annually, and in the other cases, more frequently) and the duration of time over which they are conducted (in about half the cases, indefinitely, and in the other cases, only for the first one or two years of operation). PV program administrators may use PV energy production data for various reasons, many of which are unrelated to performance assessment (e.g., to determine PBI payments, to account for RECs, or for program evaluation). Based on a limited number of personal communications, at a minimum, ETO, SDF, SMUD, MTC, and NYSERDA all analyze energy production data for the purpose of identifying poorly performing systems. SMUD takes a particularly active approach (Bartholomy and Sheridan 2005). The utility collects energy production data and computes a performance index for each system on a monthly basis, by comparing its actual energy production to the amount predicted from information on the system’s design and monthly weather data. SMUD then uses these monthly performance indices to flag under-performing systems, which it then inspects. The utility has also used performance index data in various analyses of its “PV fleet” to characterize changes in performance over time and to better understand the relationship between performance and factors such as system design and equipment type. 29 Interval meters record PV energy production in hourly (or shorter) intervals, rather than simply recording cumulative energy production over time.
Designing PV Incentive Programs to Promote Performance 26

Case Studies of State Support for Renewable Energy October 2006
Several other program administrators also conduct follow-up inspections as part of their performance monitoring process. SDF conducts one follow up inspection for each system after its first year of operation and prepares a short report describing its performance and any related issues, which it sends to the customer. TEP and UPS conduct ongoing, annual inspections of each system funded through their programs. PV programs may also help customers become more adept at monitoring and assessing the performance of their PV system, by providing or requiring that installers provide education and/or enabling technologies. At the most basic level, many programs require that installers provide customers with an estimate of their system’s annual energy production as a benchmark for evaluating its actual performance. RIREF and MTC also require that installers provide system owners with some level of training on performance monitoring and assessment, and LADWP has directly sponsored PV training workshops for customers. Various enabling technologies may also be provided or required. For example, as previously mentioned, a number of programs explicitly require “customer-friendly” meter displays, and LIPA provides all customers with a free, web-based diagnostic tool that they can use to estimate the amount of electricity their system should have produced over any range of dates, based on actual weather data. It is anticipated that, for the new CSI program in California, customers will be provided with some type of monthly report describing the performance of their system.
Designing PV Incentive Programs to Promote Performance 27

Case Studies of State Support for Renewable Energy October 2006
Table 13. Performance Monitoring and Data Reporting Requirements* Separate Metering of PV Output Data Collection and Reporting State – Organization
Required Technical Specifications Responsible Party
Frequency/Duration
AZ – APS Customer Annually/Ongoing
AZ – SRP Program Admin. Ongoing
AZ – TEP Customer Monthly/Ongoing
AZ – UPS Customer Monthly/Ongoing
CA – CEC ERP ±5% accuracy
CA – CEC PBI pilot revenue-grade Utility or 3rd Party Quarterly/3 yrs.
CA – CEC NSHP (proposed)
“easy-to-read” display with kW and kWh, ±5% accuracy, remote monitoring capability
CA – IOUs SGIP ** CA – IOUs CSI
Systems <10 kW: cumulative kWh with ±5% accuracy Systems >10 kW: interval data with ±2% accuracy
Not yet specified† Not yet specified†
CA – LADWP ±5% accuracy
CA – SMUD Program Admin. Monthly/Ongoing
CO – Xcel
CT – CCEF Small PV Program “easy-to-read” display with kW and kWh, ±5% accuracy Installer/Customer Biannually/2 yrs.
CT – CCEF Large PV Program revenue-grade (if CCEF is to retain REC ownership) Automated†† Ongoing
DE – DEO IL – DCEO MA – MTC revenue-grade Customer or
Automated Monthly/1yr.
MD – MEA ME – MSEP MN – MSEO NJ – NJCEP kW and kWh displays
NV – SPP/NP
NY – LIPA
NY – NYSERDA kW and kWh displays, ±5% accuracy Installer Biannually/2 yrs.
OH – DOD Customer Annually/1 yr.
OR – ETO revenue-grade Customer Annually/1 yr.
PA – SDF revenue-grade Program Admin. Annually/1 yr.
RI – RIREF Small PV Program revenue-grade Installer/Customer Annually/Ongoing
RI – RIREF Large PV Program revenue-grade (if RECs will be sold) Installer/Customer Monthly/Ongoing
(if RECs will be sold) TX – Austin VT – RERC revenue-grade
WA – DOR
WI – WFE “easy-to-read” display; ±5% accuracy
* Metering and data collection may be conducted for program measurement and evaluation purposes (often only a sample of systems). The focus of this table is on metering and data collection for all systems, not specifically for program evaluation.
** The SGIP does not require that all PV systems be separately metered, but many customers and equipment vendors have chosen to install metering, and metering has also been installed on a sample of the remaining systems for program evaluation purposes (Itron 2005).
† Certain details of the CSI’s metering and data reporting process have yet to be resolved, including the specific communications capabilities required, the party responsible for collecting and reporting data, and the content of performance data reports provided to customers.
†† CCEF specifies that PV installations in its On-site Renewable DG Program must have “access to appropriate communications platform for system performance monitoring and/or renewable energy credit (REC) monitoring.” This would seem to suggest that data reporting is automated, although this is not explicitly stated.
Designing PV Incentive Programs to Promote Performance 28
Case Studies of State Support for Renewable Energy October 2006
Maintenance Requirements and Services Several programs incorporate elements that serve to directly ensure that necessary maintenance is conducted. RIREF’s program for C&I customers requires that project contractors provide maintenance services and scheduled inspections for at least five years. Contractors are also required to provide training to host site personnel so that they know how to implement routine maintenance and repair. This program is structured as a competitive solicitation, and proposals are required to include a written O&M plan that describes the maintenance and training services that will be provided. Proposals are evaluated, in part, on the quality of their O&M plan, thus potentially providing an incentive for contractors to exceed the minimum requirements. TEP and UPS have taken a different approach to ensuring that necessary maintenance is conducted. Rather than requiring that installers provide it, the utilities provide maintenance services, themselves. Both utilities conduct ongoing, annual inspections of each system, and if, in the course of these inspections, the utility determines that a system requires repair, it will provide the maintenance labor for such repair at no cost to the customer. Recommendations A comprehensive and rigorous assessment of the different program design strategies described above would need to consider not only the benefits of each approach in terms of improved performance, but also the costs, both direct and indirect, as well as the long-term impacts on market development.30 Moreover, programs typically operate under various practical constraints (e.g., related to staffing or budgets) that may also affect the feasibility of different options, and these constraints must also be considered. Although such an assessment is beyond the scope of this report, the foregoing review of current practices does support a number of general recommendations as well as several specific suggestions for how PV incentive programs can effectively promote well-performing systems. 1. Identify critical performance issues. Different performance issues are best addressed by particular types of program design strategies (see Table 3). Thus, the process of designing PV incentive programs to promote system performance should ideally begin with a clear understanding of what performance issues are most pressing. Although there is not yet a broad empirical basis for making this determination, several performance issues have emerged as being potentially significant, including (but not limited to): inaccurate module ratings, improperly sized inverters, elevated cell temperatures associated with the type of mounting structure used, excessive shading, and soiling. Equipment and installation defects, including premature inverter failures, have also been known to occur on occasion and can affect long-term energy production if not promptly identified and remedied. PV incentive programs can help contribute to the growing base of knowledge about performance issues by conducting long-term performance monitoring and thorough post-installation inspections, identifying specific performance issues that have arisen, and disseminating the
30 Hoff (2006) presents a framework for evaluating alternative incentive structures.
Designing PV Incentive Programs to Promote Performance 29

Case Studies of State Support for Renewable Energy October 2006
results among the broader PV community. Without this data, efforts to design PV incentive programs to encourage PV performance will continue to proceed in an ad-hoc manner, without a reliable understanding of the problems that need to be addressed. We recommend that programs currently collecting performance data for one- or two-year periods consider extending these efforts over a longer time span. To avoid duplication and to ensure that results across programs can be meaningfully compared, programs may also want to consider engaging in collaborative efforts to track and analyze performance data across programs, akin to the comparisons of PV system performance across countries conducted by the International Energy Agency’s Photovoltaics Power Systems Programme (IEA 2004). 2. Build customer knowledge and capabilities. Net metering provides PV system owners with a substantial financial incentive to attend to the performance of their system over its entire life. Thus, if there is a barrier impeding customers from ensuring that their systems perform well, it is probably not lack of an incentive. More likely, it is lack of awareness of the financial ramifications of potential performance issues, and a lack of the knowledge and means to address these issues. Similarly, while performance guarantees provided by installers or manufacturers may reduce the costs that customers bear to repair poorly performing systems, these guarantees may have little impact if customers lack the awareness and skills necessary to determine whether their systems are performing at their warranteed levels. PV incentive programs can leverage the financial incentives provided through net metering and performance guarantees, by helping customers become more educated purchasers of PV systems and more skilled at assessing the performance of their PV system. The programs reviewed in this report provide many examples of approaches that could be used to advance this objective, including program-sponsored seminars and consumer guides, requirements that installers provide customers with basic information and training, metering requirements, and diagnostic tools (such as the web-based PV output calculator provided by LIPA). 3. Ensure that applicable codes are followed and enforced. The National Electric Code and local building codes go a long way towards ensuring that PV systems function safely and reliably. However, these codes are not always followed or effectively enforced, as building inspectors and PV installers may lack a solid understanding of the PV-related standards. PV incentive programs can improve the effectiveness of these codes by directly verifying compliance through the program’s post-installation inspection process, by requiring a sign-off by the building inspector prior to paying the rebate, by sponsoring training of local installers and building inspectors, and/or by requiring that installers meet minimum PV training requirements.
4. Consider following California’s lead on warranty requirements. The new solar legislation recently enacted in California, SB1, requires that all systems funded through the state’s incentive programs to be covered by a 10-year warranty against breakage and undue degradation (no more than 15%, as proposed in the CEC’s draft program guidebook).
Designing PV Incentive Programs to Promote Performance 30

Case Studies of State Support for Renewable Energy October 2006
This will be the most aggressive warranty requirement nationwide, and could have significant implications for inverters, which are the major component most likely to fail within the first 10 years. As the industry evolves to meet this new requirement, and as experience is gained in California, programs in other states may want to tighten their warranty requirements as well, to ensure a consistent level of quality across jurisdictions. 5. If a more rigorous standard for module ratings is developed, consider requiring that
modules be certified to meet that standard. The accuracy of module ratings is important so that both PV incentive programs and customers get what they pay for (and thus are important even for programs that don’t rely on module ratings for calculating incentive payments). The CEC has proposed adopting a tighter module rating standard for its forthcoming NSHP program, which would require that manufacturers’ nameplate ratings be established according to IEC standards and, furthermore, that they represent a guaranteed minimum output at STC for all individual modules in the corresponding product line. Although the CEC’s new program will be limited to residential new construction, SB1 authorizes the CEC to establish eligibility requirements for all equipment funded by ratepayer incentives in the state. Thus, given the size of California’s market overall, the CEC’s proposed requirements may have national implications. Separate efforts are also underway to consider developing a tighter national rating standard for modules sold in the U.S. and to create a certification body for verifying that modules comply with the standard. When and if tighter California or national standards are developed, PV incentive programs should consider incorporating those standards into their module eligibility requirements (allowing for a reasonable grace period, if warranted). 6. Consider using a capacity rating convention at least as accurate as the approach currently
used by the CEC. Programs that provide incentives calculated from capacity ratings should strive to use rating conventions that provide the greatest level of differentiation among projects based on their actual power output under peak sun conditions. Of the various rating conventions currently in use, verified AC ratings likely best fit this criterion. However, given the additional complexity and administrative cost of this approach, it may be warranted only for relatively small programs and/or large systems. To justify wider application, there remains a need to more rigorously assess the accuracy of rating conventions that rely on manufacturers’ data – especially given current movement towards tighter module rating standards. Efforts are also needed to identify potential technical and/or administrative options for reducing the cost and complexity of verified AC ratings while maintaining their accuracy. In the mean time, we recommend at a minimum that programs consider using the AC rating convention currently used by the CEC. This AC rating is calculated from modules’ rated output at PTC and the inverter ratings published by the CEC. Module ratings at PTC are generally a better representation of their power output under peak sun conditions than nameplate ratings at STC, and can be calculated in a relatively straightforward manner from manufacturers’ data. Currently, the CEC publishes PTC ratings for all of the module products eligible for its program. The CEC’s inverter efficiency ratings are based on a single test protocol developed by Sandia
Designing PV Incentive Programs to Promote Performance 31

Case Studies of State Support for Renewable Energy October 2006
National Laboratories and several other organizations, providing both rigor and consistency. Moreover, because the CEC’s inverter efficiency values are based on a weighted average of efficiencies measured at various different load levels (indicative of typical patterns of inverter loading), they are likely to be more representative of actual inverter losses over time than the rated efficiency at any one load level. 7. Consider how best to incorporate NABCEP certification. Having proficient PV designers and installers is essential to achieving high levels of performance, especially if the program administrator has limited resources to devote to reviewing system designs and inspecting installations. The NABCEP certification for PV installers has been developed by a broad base of experts in the field and incorporates many, if not all, of the essential skills needed for PV installers. Thus, rather than re-inventing the wheel, it would seem to make the most sense for PV programs seeking to promote installer proficiency to take advantage of the existing framework provided by NABCEP. The programs reviewed in this report illustrate various approaches that PV incentive programs can take to encouraging NABCEP certification, including: requiring that installers be certified, providing higher incentives for systems installed by NABCEP certified installers, or providing financial or other forms of support directly to installers to help them obtain certification. It is not clear at present what approach is necessarily best, and indeed it may differ from one program to the next. Thus, at this stage, we simply encourage programs to support NABCEP certification through whatever approach seems most appropriate. If programs do decide to require NABCEP certification, we recommend following the approach used by several of the programs reviewed in this report, and to first establish a transitional period of at least one-to-two years during which installers are required only to demonstrate progress toward obtaining certification. 8. Conduct or require acceptance testing. Acceptance testing involves spot measurements to verify that the PV system is functioning properly and producing power at the expected level. Incorporating acceptance tests into the post-installation inspection process would seem to add a small incremental cost relative to the value that such tests can provide by quickly identifying improperly installed systems or defective equipment. We therefore suggest that programs already conducting post-installation inspections integrate acceptance tests into their inspection routine. Programs that do not conduct post-installation inspections for all projects should consider requiring that installers conduct acceptance tests and submit satisfactory results prior to fully disbursing incentive payments. 9. Consider structuring incentives as an EPBB and possibly moving to a PBI for large
projects. Many of the program design strategies described in this report are examples of standards-based approaches (e.g., equipment standards, warranty requirements, installer eligibility requirements, and design standards), in contrast to incentive-based approaches such as EPBBs and PBIs. Both standards-based approaches and incentive-based approaches can be employed to address many of
Designing PV Incentive Programs to Promote Performance 32

Case Studies of State Support for Renewable Energy October 2006
the same performance issues (as evident in Table 3); however, each has particular strengths and advantages. Generally speaking, standards-based approaches are most effective as a tool for protecting PV system owners (and the ratepayers/taxpayers that are supporting those systems) by ensuring that PV systems meet a minimum level of acceptability. Standards can also be a more efficient mechanism for addressing specific types of performance issues that would otherwise entail high transaction costs for individual consumers to independently address. Finally, standards can provide a necessary form of support for market development, particularly in its early phases, by weeding out products and service providers of such low quality that they could undermine consumer confidence. Incentive-based approaches, on the other hand, are probably more effective at stimulating innovation and, when used in conjunction with standards, can motivate the industry to exceed the minimum requirements (perhaps even allowing standards to be tightened more quickly, if so desired). In addition, incentive-based approaches, particularly PBIs, may ultimately be a more efficient mechanism for achieving high levels of performance, as they are focused directly on the desired outcome (well-performing systems) and provide market participants with the flexibility to determine the most cost-effective way to achieve that outcome. Thus, neither standards-based approaches nor incentive-based approaches obviate the need for the other, and in fact they may be most effective when used together in a complementary fashion. Net metering is, of course, the most common incentive-based approach, albeit an implicit one. EPBBs and PBIs can be used to strengthen the economic signal provided by net metering. It is also possible that, under some circumstances, EPBBs and PBIs may be more effective at encouraging performance than net metering. In comparing PBIs and EPBBs to one another, PBIs have several fundamental advantages.31 First, PBIs require no administrative guesswork about the effects of particular variables on performance. This can be particularly significant for BIPV and for systems with shading, for which performance is often difficult to accurately predict.32 Second, PBIs account for a wider range of performance issues than EPBBs, which makes them potentially a more efficient mechanism for stimulating high levels of performance, as they offer a wider range of options for achieving that objective. In particular, EPBBs inherently can only account for factors whose impact on performance can be estimated reasonably well up-front, which in most cases limits their coverage to geographical location, panel orientation, and shading. PBIs, on the other hand, account for the full range of issues that affect a system’s initial conversion efficiency, as well as any issues that emerge during the performance period. Combining an EPBB with a verified AC rating methodology, as SRP and TEP have done, is almost as comprehensive as a PBI, but does not address performance issues that emerge over time (although this difference may be negligible for PBIs with short performance periods). Finally, the fact that a PBI provides incentives only for actual delivery of solar electricity may have a certain political value beyond any implications for program cost-effectiveness or market development.
31 Hoff (2006) identifies a list of qualitative criteria for comparing alternative incentive structures. 32 No accurate rating conventions yet exist for BIPV. The impact of shading on PV energy production depends not just on the amount of shading, but also on the specific pattern of shading and the layout of the array’s electrical wiring (Greenberg 2006). EPBB incentive structures can account for the impact of shading on the quantity of solar energy available, but not the impact of shading on the conversion efficiency of the array.
Designing PV Incentive Programs to Promote Performance 33

Case Studies of State Support for Renewable Energy October 2006
PBIs, however, are not without several potential drawbacks, which EPBBs avoid. First, spreading the incentive payment out over time erodes its value to the customer, due to the effects of discounting and performance risks. Thus, to maintain the same level of cost-effectiveness for customers, a larger total incentive payment must generally be offered through a PBI (on a net present value basis), compared to an EPBB or other up-front incentive.33 The longer the period over which the PBI is paid, the greater this potential additional cost. A shorter PBI performance period may lessen this effect, but does so at the risk of reducing the fundamental value of a PBI in encouraging long-term performance. Second, the fact that PBI payments are disbursed over time may be problematic for particular types of customers, such as (a) those without access to attractive financing or sufficient cash to pay the entire up-front cost out-of-pocket, and (b) builders or developers of new construction, who are unlikely to be willing to accept ongoing liability for the performance of PV systems after the building has been sold. Third, for PBI structures with relatively short performance periods, the size of the overall incentive payment can be quite sensitive to short-term idiosyncratic conditions (e.g., weather variability or equipment/installation problems that take time to remedy), which could deter customers from installing PV and may be perceived by some as unfair. Finally, PBIs create additional administrative and participant costs associated with ongoing data collection and incentive payment processing. This issue may be particularly acute for programs targeted to small PV systems, as these additional costs may be large on a per kW basis for such small systems. Based on the considerations above, we recommend that programs currently offering a standard capacity-based buydown consider moving to an EPBB, regardless of what types of standards-based approaches are also employed. The case for moving to a PBI is somewhat less clear at present. PBIs may entail additional administrative costs34, but perhaps the more significant question is what impact they will have on market acceptance. These risks are probably most manageable for large projects, as these are often already financed, have the necessary metering, and are relatively few in number (thus the additional administrative costs would be small). We therefore recommend that programs moving to a PBI in the near term consider doing so first for large projects. Over the longer-term, PV incentive programs may want to observe experiences with the new CSI in California to gauge the appropriateness of extending PBIs more broadly. 10. Employ minimum design standards if EPBBs or PBIs are not used. Minimum design standards represent the most direct way to deter egregious design flaws associated with poor panel orientation and excessive shading. Incentive structures that account for these design factors (e.g., EPBBs and PBIs) lessen to some extent the need for minimum design standards, although these incentive structures still do not provide the same level assurance as a minimum standard. Indeed, seven of the programs reviewed in this report employ minimum design standards in addition to an EPBB or PBI. However, the need for minimum design standards is greatest for programs offering standard capacity-based buydowns (or any other type
33 This is true assuming that customers’ risk-adjusted discount rate is higher than the interest rate of the escrow account in which incentive funds are deposited until payment is due. 34 Note, however, that this may not always be the case. Use of a PBI for larger PV systems, for example, may be less of an administrative hassle than developing and implementing design standards and installer requirements, and then verifying compliance with those standards and requirements.
Designing PV Incentive Programs to Promote Performance 34

Case Studies of State Support for Renewable Energy October 2006
of incentive structure that does not account for system design). Even if the program administrator conducts some level of design review, specifying explicit standards up-front will provide greater transparency to the review process and is likely to improve the quality of designs submitted for administrative review. We recommend using design standards that are based on the expected energy production (e.g., minimum expected kWh per kW or minimum expected kWh relative to an ideal system) and that account for both shading and orientation. This type of design standard is preferable to one specified in terms of individual design parameters (e.g., an allowed range in orientation or a maximum level of shading allowed), as it offers more flexibility in compliance and ultimately is a more meaningful indication of performance. Conclusions Given the relatively high cost of incentives required to stimulate the PV market, ensuring that PV systems perform well is an important issue in PV program design. This review of 32 of the largest PV programs in the U.S. demonstrates that many different mechanisms to encourage proper system performance are being employed across the country. Each has its advantages, and the best set of approaches in any given case will critically depend on the performance issues of greatest concern and on each program’s particular objectives and constraints. That being said, our review does point to a number of promising strategies that we believe program administrators should strongly consider adopting. Most importantly, we encourage programs to evaluate and share information about the effectiveness and costs of alternate approaches, to provide a solid foundation for program design going forward. Acknowledgements The work described in this report was funded by the National Renewable Energy Laboratory under Memorandum Purchase Order No. DEK-6-66278-01, the Clean Energy States Alliance, and the U.S. Department of Energy (Office of Electricity Delivery and Energy Reliability, Permitting, Siting and Analysis) under Contract No. DE-AC02-05CH11231. We would particularly like to thank Robert Margolis (National Renewable Energy Laboratory), Lewis Milford and Mark Sinclair (Clean Energy Group), and Larry Mansueti (United States Department of Energy) for their support of this work. For providing information and/or for reviewing earlier drafts of this report, we would like to thank: Jon Abe (Massachusetts Technology Collaborative), Obadiah Bartholomy (Sacramento Municipal Utility District), Kacia Brockman (Energy Trust of Oregon), Jim Burke (Sacramento Municipal Utility District), Ron Celentano (Pennsylvania Sustainable Development Fund), Adele Ferranti (New York State Energy Research and Development Authority), Nicholas Fugate (California Energy Commission), Gary Gero (Los Angeles Department of Water and Power), Elizabeth Giles (Energy Trust of Oregon), Dan Greenberg (ESource), Bill Henry (Tucson Electric Power), Tom Hoff (Clean Power Research), B. Scott Hunter (New Jersey Board of Public Utilities), Cheryl Jenkins (Vermont Energy Investment Corporation), Jan McFarland (Americans for Solar Power), Mike Nelson (Northwest Solar Center), Kimberly Peterson (Connecticut Clean Energy Fund), Mark Sinclair (Clean Energy Group), Mike Taylor
Designing PV Incentive Programs to Promote Performance 35

Case Studies of State Support for Renewable Energy October 2006
(Minnesota State Energy Office), John Wiles (Southwest Technology Development Institute), Chuck Whitaker (BEW Engineering), Mike Winka (New Jersey Board of Public Utilities), and Niels Wolter (Wisconsin Focus on Energy). Any remaining errors or omissions are the sole responsibility of the authors.
Designing PV Incentive Programs to Promote Performance 36

Case Studies of State Support for Renewable Energy October 2006
INFORMATION SOURCES
Abe, Jon. 2006. Personal communications with Massachusetts Technology Collaborative program staff.
Bartholomy, Obadiah and Margaret Sheridan. 2005. “Performance Monitoring of 900 Individual
Photovoltaic Systems in Sacramento.” Proceedings of the 2005 Solar World Conference. Orlando, Florida.
Bartholomy, Obadiah, Brent Sloan and Jon Bertolino. 2006. “Development of a Digital Shade
Analysis Tool for PV Siting.” Proceedings of the Solar 2006 Conference. Denver, Colorado. BEW Engineering. 2006. Project 3.2 Building Integrated PV Testing and Evaluation Project,
Final Report. Prepared for the California Energy Commission’s Public Interest Energy Research Program. http://pierminigrid.showdata.org/docs/PIER_%20Proj32_FinalRpt.pdf
Black, Andy. 2005. “PV Performance Guarantees and 10-Year Warranties.” Proceedings of the
2005 Solar World Conference. Orlando, Florida. Bower, Ward (Sandia National Laboratories), Chuck Whitaker (Endecon Engineering), William
Erdman and Michael Behnke (BEW Engineering) and Mark Fitzgerald (Institute for Sustainable Technology). 2004. Performance Test Protocol for Evaluating Inverters Used in Grid-Connected Photovoltaic Systems. Prepared for the California Energy Commission. Available at: http://www.energy.ca.gov/renewables/02-REN-1038/documents/2004-12-01_INVERTER_TEST.PDF
CEC (California Energy Commission). 2006. New Solar Homes Partnership Draft Guidebook.
CEC-300-2006-017. September 2006. Celentano, Ron. 2005. “SDF Solar PV Grant Program in Southeastern Pennsylvania.”
Proceedings of the 2005 World Solar Energy Conference. Orlando, Florida. CPUC (California Public Utilities Commission). 2006. Opinion Adopting Performance-Based
Incentives, an Administrative Structure, and Other Phase One Program Elements for the California Solar Initiative. Decision 06-08-028. August 24, 2006.
Ferranti, Adele. 2006. Personal communication with New York State Energy Research and
Development Authority program staff. Greenberg, Dan. 2006. Best Practices in PV Rebate Programs: Helping Customers Install
Quality Photovoltaic Systems. ESource Technical Report, ER-06-7. Henry, Bill. 2006. Personal communication with Tucson Electric Power program staff.
Designing PV Incentive Programs to Promote Performance 37

Case Studies of State Support for Renewable Energy October 2006
Hoff, Thomas E. 2006. Photovoltaic Incentive Design Handbook. Clean Power Research. Draft report. August 16, 2006. http://www.clean-power.com/research/customerPV/PVIncentiveDesignHandbook.pdf
Hunter, Benjamin Scott. 2006. Personal communication with New Jersey Clean Energy Program
staff. IEA (International Energy Agency). 2004. Country Reports on PV System Performance.
International Energy Agency Photovoltaics Power Systems Program, Report IEA-PVPS T2-05:2004.. http://www.iea-pvps.org/products/download/rep2_05.pdf
Itron. 2005. CPUC Self-Generation Incentive Program, Fourth-Year Impact Report. Final
Report submitted to Southern California Edison and the Self-Generation Incentive Program Working Group. April 15, 2005.
Jahn, Ulrike and Wolfgang Nasse. 2004. “Operational Performance of Grid-connected PV
Systems on Buildings in Germany.” Progress in Photovoltaics: Research and Applications. Vol .12, Issue 6, September 2004, pp. 441-448.
KEMA. 2005. Emerging Renewables Program Systems Verification Report 2004-2005. Prepared
for the California Energy Commission, CEC-300-2005-019. Otani, Kenji, Kazuhico Kato, Takumi Takashima, Tetsuo Yamaguchi and Koichi Sakuta. 2004.
“Field Experience with Large-scale Implementation of Domestic PV Systems and with Large PV Systems on Buildings in Japan.” Progress in Photovoltaics: Research and Applications. Vol .12, Issue 6, September 2004, pp. 449-459.
Stevens, John. 2000. IEEE Std 929-2000 – Background, Implications and Requirements. Sandia
National Laboratory, SAND2000-0914C. Albuquerque, New Mexico. Szaro, Jennifer. 2006. “The Value of Photovoltaic Performance Certification (A Florida
Perspective).” Presentation at the PV Product Certification Meeting held at the ASES Solar 2006 Conference. Denver, Colorado. July 10, 2006. http://www.irecusa.org/articles/static/1/binaries/JenniferSzaro.pdf
Whitaker, Chuck. 2006. “PV Module Performance: Feet to the Fire.” Presentation at the PV
Product Certification Meeting held at the ASES Solar 2006 Conference. Denver, Colorado. July 10, 2006. http://www.irecusa.org/articles/static/1/binaries/ChuckWhitaker.pdf
Wiles, John. 2006. Personal communication with staff of the Southwest Technology
Development Institute. Wolter, Niels. 2006. Personal communication with Wisconsin Focus on Energy program staff.
Designing PV Incentive Programs to Promote Performance 38
Case Studies of State Support for Renewable Energy October 2006
ABOUT THIS CASE STUDY SERIES A number of U.S. states have established clean energy funds to support renewable and clean forms of electricity production. This represents a new trend towards aggressive state support for clean energy, but few efforts have been made to report and share the early experiences of these funds. This paper is part of a series of clean energy fund case studies prepared by Lawrence Berkeley National Laboratory and the Clean Energy States Alliance. The primary purpose of this case study series is to report on the innovative programs and administrative practices of state (and some international) clean energy funds, to highlight additional sources of information, and to identify contacts. Our hope is that these case studies will be useful for clean energy funds and other stakeholders that are interested in learning about the pioneering renewable energy efforts of newly established clean energy funds. To access or download all the case studies, see: http://eetd.lbl.gov/ea/ems/cases/ or http://www.cleanenergystates.org/
ABOUT THE CLEAN ENERGY STATES ALLIANCE The Clean Energy States Alliance (CESA) is a non-profit initiative funded by members and foundations to support the state clean energy funds. CESA collects and disseminates information and analysis, conducts original research, and helps to coordinate activities of the state funds. The main purpose of CESA is to help states increase the quality and quantity of clean energy investments and to expand the clean energy market. The Clean Energy Group manages CESA, while Berkeley Lab provides CESA with analytic support.
CONTACT THE MANAGERS OF THE CASE STUDY SERIES
Ryan Wiser Mark Bolinger Lewis Milford Berkeley Lab Berkeley Lab Clean Energy Group
1 Cyclotron Rd., MS90-4000 Berkeley, CA 94720
105 North Thetford Road Lyme, NH 03768
50 State Street Montpelier, VT 05602
510-486-5474 603-795-4937 802-223-2554 [email protected] [email protected] [email protected]
FUNDING ACKNOWLEDGEMENTS
Berkeley Lab’s contribution to this case study was funded by the National Renewable Energy Laboratory under Memorandum Purchase Order No. DEK-6-66278-01, the Clean Energy States Alliance, and the U.S. Department of Energy (Office of Electricity Delivery and Energy Reliability, Permitting, Siting and Analysis) under Contract No. DE-AC02-05CH11231. The Clean Energy Group's efforts in connection with this work and related activities are funded by the Clean Energy States Alliance, and by The Surdna Foundation, the Rockefeller Brothers Fund, the Oak Foundation, The John Merck Fund, The Emily Hall Tremaine Foundation, and The Education Foundation of America.
DISCLAIMER This document was prepared as an account of work sponsored by the United States Government. While this document is believed to contain correct information, neither the United States Government nor any agency thereof, nor The Regents of the University of California, nor any of their employees, makes any warranty, express or implied, or assumes any legal responsibility for the accuracy, completeness, or usefulness of any information, apparatus, product, or process disclosed, or represents that its use would not infringe privately owned rights. Reference herein to any specific commercial product, process, or service by its trade name, trademark, manufacturer, or otherwise, does not necessarily constitute or imply its endorsement, recommendation, or favoring by the United States Government or any agency thereof, or The Regents of the University of California. The views and opinions of authors expressed herein do not necessarily state or reflect those of the United States Government or any agency thereof, or The Regents of the University of California.
Designing PV Incentive Programs to Promote Performance 39