designing raingardens for community acceptance · its appreciation and acceptance of the new...
TRANSCRIPT

Designing raingardens for community acceptance Meredith Frances Dobbie

2 | Designing raingardens for community acceptance
Designing raingardens for community acceptance Cities as Water Supply Catchments – Society and Institutions (Project A4.1) A4.1 – 1 - 2016
Author
Meredith Frances Dobbie1
1Monash University © 2016 Cooperative Research Centre for Water Sensitive Cities Ltd.
This work is copyright. Apart from any use permitted under the Copyright Act 1968, no part of it may be reproduced by any process without written permission from the publisher. Requests and inquiries concerning reproduction rights should be directed to the publisher.
ISBN: 978-1-921912-30-6
Publisher
Cooperative Research Centre for Water Sensitive Cities
Level 1, 8 Scenic Blvd, Clayton Campus Monash University Clayton, VIC 3800
p. +61 3 9902 4985e. [email protected] w. www.watersensitivecities.org.au
Date of publication: April 2016
An appropriate citation for this document is: Dobbie, M.F. (2016) Designing raingardens for community acceptance. Melbourne, Australia: Cooperative Research Centre for Water Sensitive Cities,
Disclaimer
The CRC for Water Sensitive Cities has endeavoured to ensure that all information in this publication is correct. It makes no warranty with regard to the accuracy of the information provided and will not be liable if the information is inaccurate, incomplete or out of date nor be liable for any direct or indirect damages arising from its use. The contents of this publication should not be used as a substitute for seeking independent professional advice.

CRC for Water Sensitive Cities | 3
Table of contents
4Executive summary
1 Introduction 6
1.1 Landscape perception and perceptual lenses 6
1.2 Study of perception of raingardens 9
2 Study description 10
2.1 Street selection 10
2.2 Data collection 10
2.3 Analysis 11
3 Results 13
3.1 Respondents 13
3.2 Support for stormwater and its fit-for-purpose use 13
3.3 Preference for different streetscapes, with and without raingardens 14
3.4 Liking 17
3.5 Satisfaction with street 18
3.6 Street use 20
3.7 Place attachment 22
3.8 Influence of knowledge on preference for streetscapes with raingardens 23
3.9 Attitudes towards installing a raingarden 27
3.10 Maintenance of raingardens 28
4 Discussion 29
4.1 Aesthetic of attachment and identity 29
4.2 Aesthetic of care and effect of knowledge 30
4.3 Ecological aesthetic 30
4.4 Aesthetic of affordance 31
4.5 Designing raingardens for appreciation and acceptance 31
33
36
References
Appendix 1. Survey: Community perceptions of suburban streetscapes
Appendix 2. Survey respondents’ sociodemographic data 58

4 | Designing raingardens for community acceptance
Executive summaryThe water sensitive city will look different from contemporary cities, reflecting its greater sustainability. Its landscape will contain water sensitive urban design (WSUD) initiatives, which are intended to reduce flooding, contribute to water security, improve environmental quality of urban waterways, mitigate the urban heat island effect and increase the visual, physical and recreational amenity of the city. This new city form and structure will demand a shift in urban ways of living and also in neighbourhood aesthetics. Community acceptance of these landscape changes is essential. Opposition could impede the widespread implementation of WSUD, acting as a barrier to the realisation of the water sensitive city. Thus, research is essential in order to understand the shift in neighbourhood aesthetics associated with the implementation of WSUD initiatives and possible consequences for its widespread acceptance.
Raingardens are innovative and visible examples of WSUD initiatives that might be expected to change the appearance of an urban street. Perception of raingardens will be influenced by the ‘perceptual lens’ through which the landscape is viewed. Attitudes constitute the perceptual lenses, and five perceptual lenses have been proposed: a scenic aesthetic; an ecological aesthetic; an aesthetic of care, perhaps influenced by knowledge; an aesthetic of attachment and identity; and an aesthetic of affordance. Understanding which lens is used in perceiving streetscapes with raingardens, and how the raingardens are appreciated, can inform guidelines for their design to meet both technical and aesthetic functions. In addition, management strategies and communication programs can be developed to promote the acceptance of raingardens.
This study was undertaken to determine how residents of established suburbs in Melbourne perceive, appreciate and value raingardens retrofitted into their own or neighbouring streets and streets in other suburbs. Eight streets were studied, four with raingardens and four without. Streets with raingardens were preferred: four streets with raingardens were amongst the five most preferred streetscapes. Attitudes thought to underpin the lenses operating in the perception of raingardens were associated with place attachment, landscape care and maintenance, satisfaction and affordance.
There was support for stormwater harvesting and treatment and its fit-for-purpose use, liking for and willingness to install raingardens, but a reluctance to be responsible for their maintenance. Knowledge also influenced perception directly, not simply by shaping attitudes. Multiple perceptual lenses seemed to operate in the perception of the raingardens. An aesthetic of attachment and identity was evident in residents of the most preferred street. An aesthetic of care, influenced by knowledge, and an aesthetic of affordance were also evident. An ecological aesthetic might be used but there was little evidence of a scenic aesthetic.
Landscape elements were important in the perception of and preference for streetscapes, with or without raingardens. These landscape elements can be manipulated when retrofitting raingardens into suburban streets to optimize appreciation of the new landscape and acceptance of its raingardens. Street trees and understorey plants and their maintenance can influence perception of and preference for streetscapes. In addition, possible changes to how a street is used can also influence its appreciation and acceptance of the new streetscape.
Placement of raingardens within a street and its overall design should be carefully considered. Context is critical. Car parking, plant selection, layout, structure and form of the raingarden and its maintenance must all be carefully considered.
Where on-street parking is highly valued, particularly in streets in higher density suburbs, raingardens should not displace car parking along the kerb. Other locations than within the road itself should be considered, and community engagement undertaken.

CRC for Water Sensitive Cities | 5
Street trees and understorey plants for inclusion in a raingarden in one street might not be suitable in another street. Wherever possible, trees should be included in the raingarden. Certain species of trees function in stormwater treatment and should be considered. However, as only 50% of the planting within a raingarden must function in treating stormwater, other trees could be used, although deciduous trees should be avoided.
The palette of understorey plants for raingardens should be broadened. Many common raingarden plants are perceived as messy and unattractive, especially in a suburban context of formal, manicured gardens. In a bushy suburb in which domestic gardens use predominantly native plants with irregular forms planted in organic or informal layouts, raingardens with reeds, sedges and grasses are less likely to appear messy, simply reflecting their suburban context more closely. In more formal suburbs, the use of exotic plants, particularly those with showy flowers or seasonal displays, should be considered for inclusion in a raingarden. For effective function, at least 50% of the planting of a raingarden should contribute to water quality treatment. Thus, 50% of the planting can be other plants, selected for their aesthetic function rather than their technical function. Careful consideration of the context of each raingarden should reveal possible plants to be included in the raingarden, for their appearance and seasonal variation. Many plants in nearby domestic gardens might be suitable for planting in raingardens in the street. A raingarden whose design reflects its immediate context, drawing its design elements, including plant selection, from surrounding gardens, is likely to be appreciated, valued and accepted by local residents.
Plant selection should consider how the area around a raingarden might be used. Possible adjacent uses, e.g. car parking, might constrain plant selection.
A regular maintenance regime is essential. If plant selection is restricted to strappy loosely formed plants in a raingarden, extra attention should be given to ensure the raingarden is well maintained. All rubbish should be removed and dead or dying plants replaced quickly, so that the planting appears dense and cared for. Pruning also demonstrates that the raingardens are cared for by someone, if only the local council. However, such pruning must be skilled and improve the appearance of the plants and the raingarden.
Maintenance should ensure that raingardens remain green. Raingardens that have brown plants, even if they are healthy, are likely to be less preferred than if their plants are green. In suburban contexts where domestic gardens are well irrigated, the contrast of these gardens with raingardens with brown foliage will be even greater, to the disadvantage of the raingardens.
Signage is also useful, to provide information about the raingarden and to indicate that someone cares for it.
6 | Designing raingardens for community acceptance
IntroductionThe water sensitive city will look different from contemporary cities, reflecting its greater sustainability. Its landscapes will function as green infrastructure1, comprising various pieces of water sensitive urban design (WSUD) within the urban fabric. These WSUD initiatives, such as constructed wetlands, raingardens, swales, rainwater tanks, green roofs and green and living walls, will create a greener, more vegetated city. Such green infrastructure is intended to reduce flooding, contribute to water security by providing alternative sources of water, improve environmental quality of urban waterways, mitigate the urban heat island effect, and increase the visual, physical and recreational amenity of the city (Wong and Brown 2009). Adopting green infrastructure will also demand “major shifts in accustomed ways of life and neighbourhood aesthetics (my emphasis), a reversal of some of the modern trajectories ‘baked in’ to our existing water systems, and redefinitions of what counts as water infrastructure and the distinctions between private use and public responsibility” (Sofoulis 2005, p. 460). Retrofitting WSUD as green infrastructure to existing urban areas at various scales is critical for its full benefits to be realised (Weber et al. 2009).
It is also in existing suburbs that the multiple benefits of WSUD more generally can be obtained. Community acceptance of landscape changes associated with WSUD
initiatives in greenfield developments is implicit in the purchase of a property. In contrast, their acceptance by residents in established suburbs is less certain; opposition could impede the widespread implementation of WSUD, acting as a barrier to the realisation of the water sensitive city. Thus, research is essential in order to understand the shift in neighbourhood aesthetics associated with implementation of WSUD initiatives and its influence on the acceptance of green infrastructure in the water sensitive city. Strategies can then be developed to optimise acceptance of the changing urban landscapes that support sustainable stormwater management specifically and innovative water systems more generally.
This report outlines key research insights regarding how residents of established suburbs in Melbourne perceive, appreciate and value raingardens retrofitted into their own or neighbouring streets and streets in other suburbs. The research results and consequent recommendations presented here will be of use to local governments, land developers, landscape architects and private consultants. They will be able to use this information to inform the design of raingardens, management strategies and communication programs to promote the community acceptance of raingardens.
1 ‘Green infrastructure’ is defined as “an interconnected network of natural areas and other open spaces that conserves natural ecosystem values and functions, sustains clean air and water, and provides a wide array of benefits to people and wildlife” [Benedict, M. A. and E. T. McMahon (2006). Green Infrastructure. London, Island Press, p. 1]. Green infrastructure can include constructed elements, mimicking natural structures and processes to achieve specific ecological, social and/or economic outcomes through the delivery of ecosystem services.
1.1 Landscape perception and perceptual lenses
Landscape perception is a transaction between an individual and a landscape. It is influenced by the personal beliefs, attitudes, values and knowledge, and social and cultural contexts of the individual and specific details of a physical setting and its context (Gobster et al. 2007). There are at least four different ways of ‘seeing’ a landscape (Figure 1): using a scenic aesthetic; an ecological aesthetic; an aesthetic of care, influenced by knowledge; and/or an aesthetic of attachment and identity (Gobster et al. 2007). These different types of aesthetic can be understood as
perceptual lenses. An additional perceptual lens might be one associated with the perception of affordance, i.e. what one can do within a landscape (Gibson 1979). These lenses focus the perceptual responses, affective (feeling) reactions and cognitive (thinking) processes in perceiving a landscape, thereby guiding its appreciation. Raingardens in suburban streets might be perceived through any of these perceptual lenses, depending on the context of the individual and the landscape setting.

CRC for Water Sensitive Cities | 7
Understanding which aesthetic lens is used in perceiving streetscapes with raingardens can inform guidelines for the design of raingardens to optimise the likelihood of their appreciation by residents and visitors. Raingardens to be retrofitted into existing streetscapes can then be designed to meet both technical and aesthetic functions. By so doing, streetscape change as a result of the implementation of water sensitive urban design at the local, street level is more likely to be accepted, advancing the development of water sensitive cities.
1.1.1 Scenic aesthetic
The scenic aesthetic appreciates idealised nature in landscapes. It developed from 17th and 18th century aesthetic theory, represented in landscape paintings and designed landscapes (Carlson 1979; Gobster 1999; Gobster
et al. 2007). It is used to appreciate wild landscapes but also urban landscapes that have a Picturesque style. Such landscapes are likely to include vistas across broad expanses of grass, scattered clumps of trees and discrete waterbodies, arranged to create scenes. Each scene is then appreciated for its aesthetic qualities of colour and design as a bounded, static two-dimensional image (Carlson 1979; Rolston 1995). The scenic aesthetic is the dominant model of nature appreciation. It applies a cultural notion of naturalness, often inconsistent with the scientific notion (Nassauer 1995a). Scale and context are important in the operation of the scenic aesthetic. Thus, it is more likely to apply in the perception of parkland with constructed wetlands than of a streetscape with raingardens. Nevertheless, the scenic aesthetic might not value the naturalistic style of many WSUD initiatives, including raingardens, with monocultures of tussock grasses, sedges and reeds.
Scenic aesthetic
Aesthetic of care, influenced by knowledge
Ecological aesthetic
Aesthetic of attachment and identity
Figure 1. Four main aesthetic lenses that are used when looking at landscapes (Gobster et al. 2007). Photos: M. Dobbie
8 | Designing raingardens for community acceptance
1.1.2 Ecological aesthetic
The ecological aesthetic seeks to reconcile the conflicts between a preference for landscapes as scenery and a desire for those landscapes to be ecologically sustainable (Gobster 2001). The ecological aesthetic involves a deeper understanding and appreciation of nature. All the senses are used to create an aesthetic experience that is as much cognitive as perceptual, in which the aesthetic appeal derives not from colours and shapes or scenic and picturesque qualities but from the perceived ecological quality or health of the landscape (Eaton 1997). Again, scale and context are likely to be important for the ecological aesthetic, with which many WSUD initiatives might be appreciated.
1.1.3 Aesthetic of care and effect of knowledge
The aesthetic of care (Nassauer 1992, 1995b) values landscapes that appear neat and tidy. Such landscapes in the US are perceived as symbols of civic pride, good land management and stewardship (Nassauer 1988, 1995b; Hull, Robertson et al. 2001; Dutcher, Finley et al. 2004). In Australia, they are valued for “social respectability, a certain moral quality, and (to avoid) the stress occasioned by mess” (Trigger and Head 2010, p. 245). Neatness can be interpreted as a “cue to care” (Nassauer 1995b, p. 167), indicating a human intent in an otherwise disorderly landscape, i.e. “orderly frames for messy ecosystems” (Nassauer 1995b, p. 161). However, scale can be important in the perception of messiness (Eaton 2001). An aesthetic of care is likely to not appreciate the structure and composition of many WSUD initiatives, with loosely formed strappy-leaved plants predominant.
Knowledge and familiarity can influence landscape perception, appreciation and preference (Dearden 1989; Dobbie 2013). Familiarity can help a viewer detect patterns in an otherwise disorderly landscape, or richness and distinctiveness in an apparently unexciting and undifferentiated landscape (Bier 2001). It can increase knowledge of detailed features of environments (Zube 1998), providing more in the landscape to pay attention to and find interesting. Knowledge about the ecological function of WSUD initiatives, and their contribution to improved water quality, is likely to enhance appreciation of them (Wagner 2008).
1.1.4 Aesthetic of attachment and identity
An aesthetic of attachment and identity reflects an individual’s sense of place, expressed through an emotional attachment to a place or the definition of self that is associated with that place (Lewicka 2011). Place attachment results from the interaction of person, place and psychological process (Scannell and Gifford 2010a) (Figure 2). It is influenced by physical and social characteristics
of the place, through cognitive, affective and behavioural processes. Social influences can be length of residency, mobility and home ownership, affecting community ties (Manzo 2005). Experiences associated with a place can also be important, creating meaning for that place (Manzo 2005). Attachment might not be to the physical attributes of the place itself but to the meaning that those attributes represent (Stedman 2003). Scale is important: place attachment is likely to be stronger at home and city scales than at neighbourhood scales (Hidalgo and Hernandez 2001). Although place attachment is generally more influenced by social rather than physical characteristics (Hidalgo and Hernandez 2001), changes in the physical structure of a place, e.g. by introduction of WSUD initiatives, might be perceived unfavourably through the aesthetic lens of attachment and identity. The extent of this might vary, though, depending on whether the place attachment is specific, e.g. to a specific street, or conceptual, e.g. suburban streets in general (Ryan 2005), related to the natural aspects of the place or the social bonds that the place represents (Scannell and Gifford 2010b).
Place identity is also a function of the physical characteristics and social context of a place, interacting in this case with the individual’s self-identity (Proshansky et al. 1983). It is a sense of belonging to a landscape and is derived from all the experiences of a place. A similar concept is landscape identity, defined as the “perceived uniqueness of a place” (Stobbelaar and Pedroli 2011, p. 322). Again, place and landscape identities might be affected by WSUD initiatives, in turn influencing their aesthetic appreciation. However, the aesthetic of attachment and identity will be place-specific. Perception, appreciation and value might depend on the visual compatibility of the specific place and the WSUD initiative.
1.1.5 Aesthetic of affordance
Landscape perception and preference might also be influenced by the activities that the landscape is perceived to support. These are termed ‘affordances’ (Gibson 1979). Affordances vary from person to person, related to individual abilities (Chemero 2003). Thus, an affordance of a landscape for one person might not be for another. So, WSUD initiatives in urban landscapes might be perceived in terms of their impact on activities that the person wants to undertake. For example, a nature strip in a street might afford parking. If the nature strip is replaced with a raingarden, the affordance of parking is lost, which might affect appreciation of the altered streetscape.

CRC for Water Sensitive Cities | 9
PlaceAttachmentCultural/
group
Individual
Social Physical
Behavior
Affect
Cognition
• Happiness• Pride• Love
• Memory• Knowledge• Schemas• Meaning
• Proximity-maintaining• Reconstruction of place
• Natural• Built
• Social arena• Social symbol
• Experience• Realisations• Milestones
• Religious• Historical Person
Place
Process
Figure 2. Tripartite model of place attachment (Scannell and Gifford 2010a)
1.2 Study of perception of raingardensIn studying landscape perceptions of raingardens in suburban streets, any of these five perceptual lenses might be used, depending on the individual and the specific landscape context of the street. The use of different perceptual lenses might yield different perceptions, with consequences for the acceptance of raingardens. As participants in the study were to be residents of selected streets in some of which raingardens had been installed, the study was framed around the concept of place attachment specifically, and sense of place more broadly. This provided a theoretical structure for the study without precluding the possibility of identifying other perceptual lenses that might operate.
Specifically, this study:
1. reveals preferences for raingardens, and reasons for those preferences;
2. suggests which aesthetic lenses operate in the perception of streetscapes with raingardens;
3. describes the relationship of preference for streets with raingardens with liking for that street, satisfaction with the street and its various elements, e.g. trees, footpath, guttering, and place attachment;
4. demonstrates the importance of knowledge in influencing preference for streets with raingardens; and
5. reveals support for stormwater harvesting and treatment and its fit-for-purpose use, liking for and willingness to install raingardens, but a reluctance to be responsible for their maintenance.
These insights will be invaluable in the design, implementation, and management of programs to retrofit raingardens in established suburban streets. They can also inform community consultation at the outset of a program, to anticipate any community resistance and to promote community acceptance of the retrofitted raingardens.
10 | Designing raingardens for community acceptance
Study description
2.1 Street selection
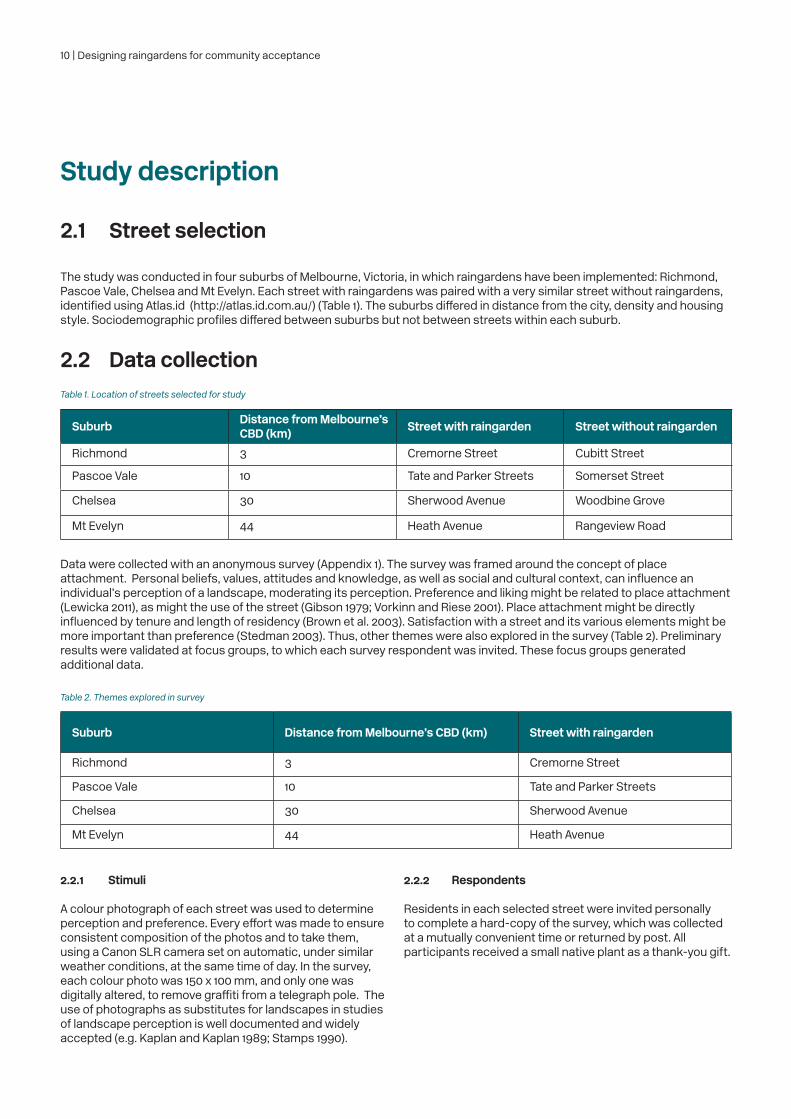
The study was conducted in four suburbs of Melbourne, Victoria, in which raingardens have been implemented: Richmond, Pascoe Vale, Chelsea and Mt Evelyn. Each street with raingardens was paired with a very similar street without raingardens, identified using Atlas.id (http://atlas.id.com.au/) (Table 1). The suburbs differed in distance from the city, density and housing style. Sociodemographic profiles differed between suburbs but not between streets within each suburb.
2.2 Data collection
Data were collected with an anonymous survey (Appendix 1). The survey was framed around the concept of place attachment. Personal beliefs, values, attitudes and knowledge, as well as social and cultural context, can influence an individual’s perception of a landscape, moderating its perception. Preference and liking might be related to place attachment (Lewicka 2011), as might the use of the street (Gibson 1979; Vorkinn and Riese 2001). Place attachment might be directly influenced by tenure and length of residency (Brown et al. 2003). Satisfaction with a street and its various elements might be more important than preference (Stedman 2003). Thus, other themes were also explored in the survey (Table 2). Preliminary results were validated at focus groups, to which each survey respondent was invited. These focus groups generated additional data.
Suburb Distance from Melbourne’s CBD (km) Street with raingarden Street without raingarden
Richmond 3 Cremorne Street Cubitt Street
Pascoe Vale 10 Tate and Parker Streets Somerset Street
Chelsea 30 Sherwood Avenue Woodbine Grove
Mt Evelyn 44 Heath Avenue Rangeview Road
Suburb Distance from Melbourne’s CBD (km) Street with raingarden
Richmond 3 Cremorne Street
Pascoe Vale 10 Tate and Parker Streets
Chelsea 30 Sherwood Avenue
Mt Evelyn 44 Heath Avenue
Table 1. Location of streets selected for study
Table 2. Themes explored in survey
2.2.1 Stimuli
A colour photograph of each street was used to determine perception and preference. Every effort was made to ensure consistent composition of the photos and to take them, using a Canon SLR camera set on automatic, under similar weather conditions, at the same time of day. In the survey, each colour photo was 150 x 100 mm, and only one was digitally altered, to remove graffiti from a telegraph pole. The use of photographs as substitutes for landscapes in studies of landscape perception is well documented and widely accepted (e.g. Kaplan and Kaplan 1989; Stamps 1990).
2.2.2 Respondents
Residents in each selected street were invited personally to complete a hard-copy of the survey, which was collected at a mutually convenient time or returned by post. All participants received a small native plant as a thank-you gift.

CRC for Water Sensitive Cities | 11
2.3 Analysis
Numerical and categorical data from closed questions were analysed with SPSS 22 (IBM, Arendonk, USA) and NVivo (QSR International Pty Ltd, Burlington, USA), as indicated in Table 3. Frequency distributions of categorical data were determined, and mean and standard deviations for numerical data. Mean preference of groups of respondents
either living on different streets or living on streets with or without raingardens were compared. Correlations of different variables were undertaken, to determine their independence: when a correlation is perfect (r=1), one variable predicts another. Cross-tabulations revealed relationships between categorical variables, including street of residency.
Variable Analytical outcome
Comparison of variable between groups
Correlation of variables Cross-tabs
Support for stormwater harvesting, treatment and reuse
Frequency distribution
Like street of residency Frequency distribution
√*
Influence of knowledge on preference
Frequency distribution
Prepared to install raingarden on private property
Frequency distribution
√*
Like raingardens in own street
Frequency distribution
√*
Notice raingardens in own street
Frequency distribution
√*
Assist with raingarden maintenance in own street
Frequency distribution
√*
Assist with raingarden maintenance in own street
Frequency distribution
√*
Preference Mean (standard deviation)
** *** √ √ √ √
Place attachment Mean (standard deviation)
√ √ √ √ √
Satisfaction with street of residency
Mean (standard deviation)
√ √ √ √
Satisfaction with elements of street of residency
Mean (standard deviation)
√
Street interaction Frequency distribution
√ √ √ √
Tenure Frequency distribution
√
Period of residency Frequency distribution
√
Sociodemographic attributes Frequency distribution
√
Table 3. Variables examined, analytical outcomes and comparisons made of data.
Textual data from open-ended questions were analysed with NVivo. Aggregated data and data based on residency in a street with or without raingardens were analysed. Word frequency queries generated word clouds and tabulations of summary data, from which themes were identified. Themes are illustrated with selected quotes.
* Cross-tabulations with street of residence** Group: Street of residency*** Group: Street +/- raingarden

12 | Designing raingardens for community acceptance
CRC for Water Sensitive Cities | 13
Results
3.1 Respondents
In all, 139 respondents completed the survey. These respondents, drawn from eight suburban streets of Melbourne, generally resembled the population of Greater Melbourne, based on the 2011 census in gender and age groups (ABS n.d.; Appendix 2). Any differences with the ABS data were minor, thus, the results of this study can be generalised to the broader population of Greater Melbourne.
3.2 Support for stormwater and its fit-for-purpose use
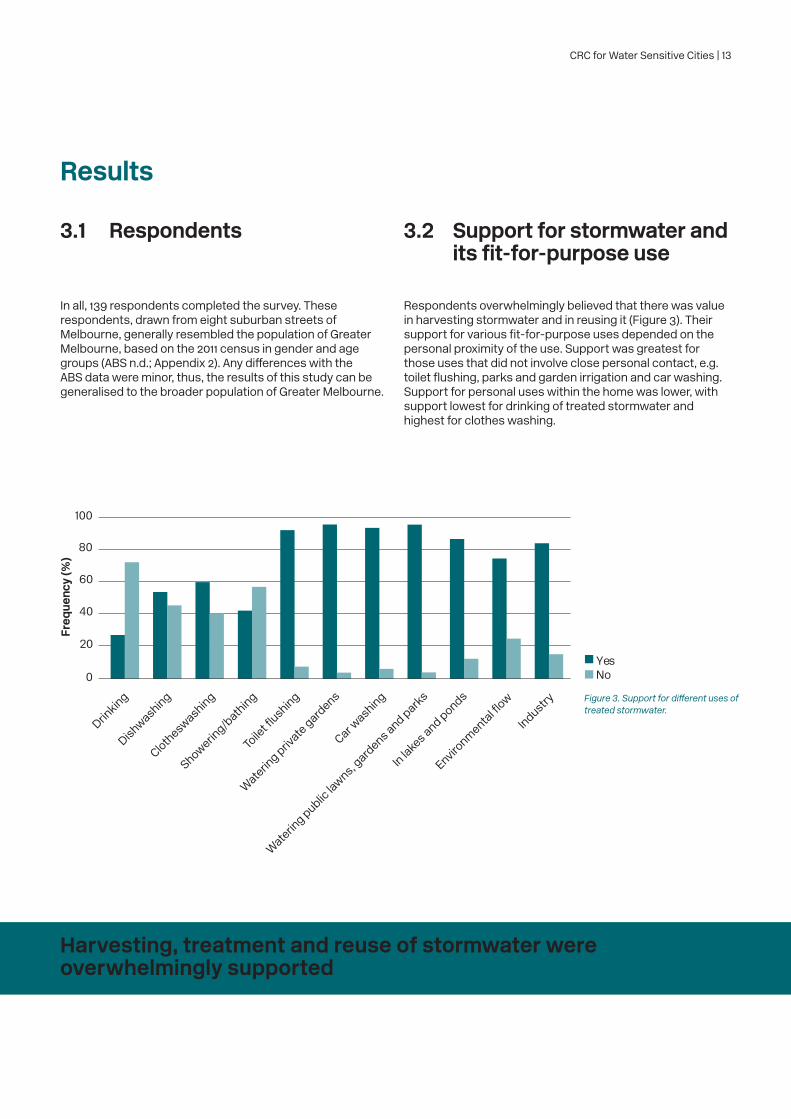
Respondents overwhelmingly believed that there was value in harvesting stormwater and in reusing it (Figure 3). Their support for various fit-for-purpose uses depended on the personal proximity of the use. Support was greatest for those uses that did not involve close personal contact, e.g. toilet flushing, parks and garden irrigation and car washing. Support for personal uses within the home was lower, with support lowest for drinking of treated stormwater and highest for clothes washing.
Figure 3. Support for different uses of treated stormwater.
Harvesting, treatment and reuse of stormwater were overwhelmingly supported
Freq
uenc
y (%
)
YesNo
100
80
60
40
20
0

14 | Designing raingardens for community acceptance
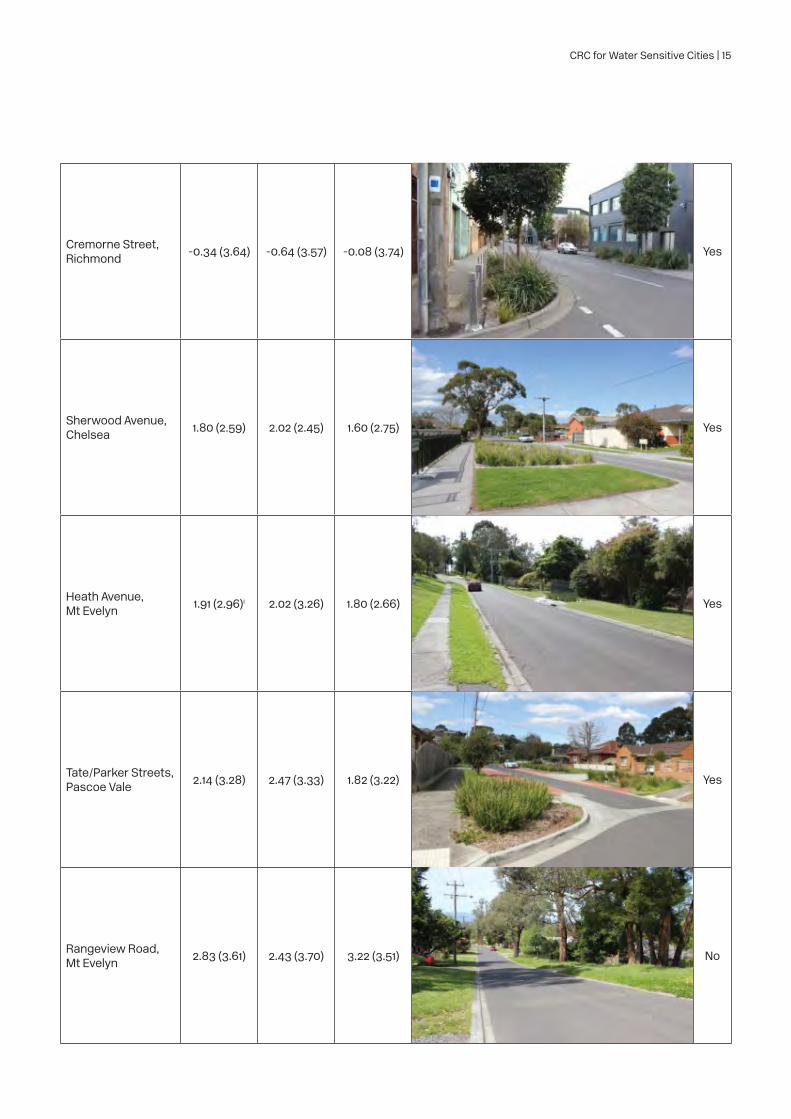
Table 4. Mean preference (standard deviation, s.d.) for streetscapes with or without raingardens. Best/worst scaling was used to rate streetscapes. Thus, mean preference values can range from -7 (worst) to +7 (best). Results are given for analysis of aggregated data and for subsets of respondents, based on residency in streets with or without raingardens.
Street
Mean preference (s.d.)
Street photo Rain
gard
ens
in
stre
et
Aggregated data
(N=120)
Residents on streets with rain-gardens (N=60)
Residents on streets without rain-gardens (N=60)
Cubitt Street, Richmond -6.29 (2.25) -6.58 (1.40) -5.98 (2.85) No
Woodbine Grove, Chelsea -0.99 (2.43) -0.72(2.44) -1.27 (2.41) No
Somerset Street, Pascoe Vale -0.91 (2.57) -0.98 (2.19) -0.83 (2.91) No
3.3 Preference for different streetscapes, with and without raingardens
For aggregated data for all respondents, the most preferred streetscape was Rangeview Road, Mt Evelyn, and the least preferred was Cubitt Street, Richmond (Table 4). For each pair of streetscapes in each suburb, the one with raingardens was preferred to the one without, except for the streetscapes in Mt Evelyn. The order of increasing preference was Cubitt Street, Richmond; Woodbine Grove, Chelsea; Somerset Street, Pascoe Vale; Cremorne Street, Richmond; Sherwood Avenue, Chelsea; Heath Avenue, Mt Evelyn; Tate/Parker Streets, Pascoe Vale; Rangeview Road, Mt Evelyn. So, four streetscapes with raingardens were in the top five most preferred streetscapes.
CRC for Water Sensitive Cities | 15
Cremorne Street, Richmond -0.34 (3.64) -0.64 (3.57) -0.08 (3.74) Yes
Sherwood Avenue, Chelsea 1.80 (2.59) 2.02 (2.45) 1.60 (2.75) Yes
Heath Avenue, Mt Evelyn 1.91 (2.96)i 2.02 (3.26) 1.80 (2.66) Yes
Tate/Parker Streets, Pascoe Vale 2.14 (3.28) 2.47 (3.33) 1.82 (3.22) Yes
Rangeview Road, Mt Evelyn 2.83 (3.61) 2.43 (3.70) 3.22 (3.51) No
16 | Designing raingardens for community acceptance
Streetscapes with raingardens are generally preferred to those without
Living in a street with raingardens does not influence preference for streets with or without raingardens
Living on a street with or without raingardens did not influence preference for the different streetscapes. The order of preference was essentially the same for each group of respondents (those living on a street with raingardens and those living on a street without raingardens), and preference for a particular street did not differ significantly between the two groups.
Residency in a particular street, though, influenced preference. Generally, preference for a particular street was greatest for the residents of that street, and, where it was not, this difference was not significant. However, preferences of residents of inner Melbourne streets closest to the CBD did differ significantly from those of residents of outer Melbourne streets furthest from the CBD. Residents of inner Melbourne streets very close to the CBD, i.e. Cremorne and Cubitt Streets, Richmond, preferred their own streetscapes significantly more than the streetscapes of far outer Melbourne. Conversely, residents of far outer Melbourne streets, i.e. Heath Avenue and Rangeview Road, Mt Evelyn, preferred their own streetscapes significantly more than the closest inner Melbourne streetscapes. There was less distinction for those intermediate suburban streets, i.e. Tate and Parker Streets and Somerset Street, Pascoe Vale, and Sherwood Avenue and Woodbine Grove, Chelsea, which are less extreme in appearance, neither high-density inner-city urban nor low-density, leafy outer suburban.

CRC for Water Sensitive Cities | 17
3.4 Liking
Results for liking or disliking one’s street of residency shed some light on the preference results, which are enriched further by interpretation of the open-ended questions seeking suggestions from residents on how the appearance of their own street could be improved and with data from the focus groups.
Figure 4. Percentage of residents on each street that liked, disliked or were uncertain about liking their street.
In general, respondents overwhelmingly liked their street of residency. Nevertheless, some residents of each street except Tate and Parker Streets, Pascoe Vale, did not (Figure 4). Liking for street of residency differed between streets. More residents than expected statistically in Cremorne and Cubitt Street, Richmond, and Somerset Street, Pascoe Vale, disliked their street, and more than expected in Tate and Parker Streets, Pascoe Vale, and Rangeview Road, Mt Evelyn, liked their street.
Residents of Cremorne Street, Richmond, most preferred Tate and Parker Streets, Pascoe Vale. These respondents might have perceived that the density of Tate and Parker Streets is higher than that of the other streets with raingardens, and hence presumed to be closer to the city, such that Tate and Parker Streets might offer similar benefits as a result of its proximity to Melbourne’s CBD as does Cremorne Street. The residents’ suggestions for
improving the appearance of Cremorne Street are reflected in the appearance of Tate and Parker Streets, i.e. better maintenance, including removal of graffiti and rubbish and repairing footpaths, and more trees.
Cubitt Street residents most preferred Cremorne Street, Richmond. They also suggested that street trees would improve the appearance of their street, presumably without compromising parking. Thus, it is possible that these respondents perceived Cremorne Street as similar to Cubitt Street but with the addition of desirable street trees and leafy, green vegetation.
Although more residents than expected in Somerset Street, Pascoe Vale, disliked their street, they most preferred Tate/Parker Streets, the nearby streets with raingardens. These residents also had the highest preference for Woodbine Grove, Chelsea. They suggested that the appearance
Freq
uenc
y (%
)
Like street of residence
Cremorn
e St,
Richmond
Cubitt St,
Richmond
Tate and Parker S
t,
Pascoe Vale
Somerset S
t,
Pascoe Vale
Sherwood Ave,
Chelsea
Woodbine Gro
ve,
Chelsea
Heath Ave,
Mt Evelyn
Rangeview Rd,
Mt Evelyn
100
90
80
70
60
50
40
30
20
10
0
NoYes
Uncertain

18 | Designing raingardens for community acceptance
Woodbine Grove implied that residents thought it plain and uninteresting. Whether Sherwood Avenue has more interest is difficult to assess; certainly, it is a more varied streetscape with densely vegetated raingardens, larger more established street trees and a curving road layout.
Residents of Heath Avenue, Mt Evelyn, preferred nearby Rangeview Road, without raingardens, over their own street, although most liked the appearance of their street. Suggestions for improvements to the appearance of Heath Avenue related to plant selection, maintenance issues, and inappropriate pruning of street trees to accommodate power lines. Respondents were divided equally as to whether the raingardens improved the appearance of the street. Thus, Rangeview Road might represent all that is good about Heath Avenue with larger, well-shaped trees and no raingardens. The view to distant hills might also have favourably influenced preference.
In general, the street of residency was liked more than other streets.
3.5 Satisfaction with street
Overall, respondents were satisfied with their street of residency (Table 5), with mean satisfaction ranging from 4.40 (1.34) for Somerset Street, Pascoe Vale, to 5.73 (1.42) for Tate and Parker Streets, Pascoe Vale. Correlation analysis revealed no consistent pattern in the relationship of preference with satisfaction with the street and its various street elements or in the relationship of satisfaction with the street with satisfaction with the street’s elements. Nevertheless, there is some evidence to suggest that satisfaction with the street of residency is related to satisfaction with the street’s trees (or acceptance of its absence of trees, in the case of Cubitt Street, Richmond), and to a lesser extent with the street’s nature strip (or lack of it), guttering and footpath.
Street of residency
Crem
orne
Str
eet,
Rich
mon
d (N
=12)
Cubi
tt S
tree
t,
Rich
mon
d (N
=19)
Tate
/Par
ker S
tree
t, Pa
scoe
Val
e (N
=11)
Som
erse
t Str
eet,
Pa
scoe
Val
e (N
=5)
Sher
woo
d Av
enue
, Ch
else
a (N
=14)
Woo
dbin
e G
rove
, Ch
else
a (N
=11)
Hea
th R
oad,
M
t Eve
lyn
(N=2
9)
Rang
evie
w R
oad,
M
t Eve
lyn
N=3
2)
Satisfaction with street 4.58 (1.31)
5.26 (1.20)
5.73(1.42)
4.40(1.34)
5.21(1.53)
5.00(1.10)
5.47(1.22)
5.64(1.06)
Satisfaction with street trees 4.25 (1.36)
3.00 (1.63)
5.00(1.61)
5.20(1.30)
4.67(2.02)
4.82(1.83)
4.66(1.54)
4.94(1.56)
Satisfaction with nature strip 4.00 (1.81)
2.61 (1.65)
5.45(1.64)
4.80(1.30)
5.00(1.51)
4.09(1.58)
4.63(1.47)
4.91(1.40)
Satisfaction with guttering 4.67 (1.56)
4.00 (1.37)
6.55(0.52)
5.20(1.64)
5.53(1.55)
5.00(1.25)
4.83(1.32)
5.53(1.13)
Satisfaction with footpath 4.08 (1.44)
4.05 (1.39)
6.18(1.47)
3.00(0.82)
5.40(1.45)
4.82(1.89)
4.40(1.52)
4.85(1.81)
Satisfaction with on-street parking
3.17 (1.70)
3.26 (1.85)
4.82(1.83)
1.40(0.55)
3.07(1.98)
5.00(1.55)
3.10(1.88)
4.44(1.91)
Preference for street of residence
1.33 (3.68)
-4.53 (3.83)
4.30(2.63)
2.20(4.44)
2.23(3.30)
0.38(2.67)
3.24(2.96)
4.50(3.09)
of Somerset Street could be improved by no more development, fewer cars, and better care of the lawns and gardens. Both Tate/Parker Streets and Woodbine Grove resemble Somerset Street but are tidier, with no visible higher-density development and few cars. Thus, both these streetscapes reflect the comments for improving Somerset Street.
Most residents of Woodbine Grove, Chelsea, liked their street. Nevertheless, they most preferred Sherwood Avenue, the nearby street with raingardens. Suggestions to improve
Table 5. Satisfaction with the street and its various elements and preference for street, by residents of each street. Mean (s.d.) values are given.

CRC for Water Sensitive Cities | 19
Respondents’ comments about their satisfaction with their street of residency, and how their street could be improved, help interpret these results. In Cremorne Street, Richmond, comments about satisfaction centred around traffic issues, i.e. congestion and parking, and rubbish collection. Respondents from Cubitt Street, Richmond, were also dissatisfied with provision for car parking, either for themselves or for their visitors, and also with the lack of street trees and vegetation. Car parking was more important than street planting: one resident commented that “There is little/no room for on-street parking. We accept this as inner city living but would like more trees on the existing footpaths. Parking is at a premium so we do not want to see road space being taken for any purpose”.
In Tate and Parker Streets, Pascoe Vale, seven out of eleven respondents commented about their satisfaction with the street. Issues related to excessive car parking by train travellers and poor maintenance of nature strips and raingardens. More decorative plants were wanted: “...While I like the idea of raingardens, the tussock planting is messy. it browns off in summer. I would rather more appealing plants to be planted such as Grevillea, etc. Flowering gums and leafy trees set the street off. The native frangipanis are scraggly looking when growing and the crepe myrtles seem to be slow getting established....” In nearby Somerset Street, limited on-street parking was again an issue.
In Chelsea, traffic was a concern in both streets. In Sherwood Avenue, the raingardens were perceived to contribute to traffic problems: “I really like the raingarden - it looks good and helps to slow down traffic - but it does create safety issues with off-street parking (especially as there are many units in that street) and is particularly bad when it is “bin” night/day”. Another issue related to habitat loss with development at increased density. Increased density and traffic speed on the long, straight road contributed to traffic-related concerns in Woodbine Grove. Two respondents commented on stormwater management and raingardens: “I do notice the stormwater drain out the front, gathers all the rubbish from the street, many times on overflow” and “The raingardens are nicer on the street corners than on a nature strip in my opinion”.
In Mt Evelyn, comments about satisfaction with Heath Avenue related to vegetation. Some concerned the raingardens: “only that we have the watergarden. Its an eyesore. Many plants around the edge have died. The garden collects all the rubbish from the street which I have to then collect + put in my green waste bin at cost to me”. Others included reference to street trees: “trees: they changed it and I don’t like it. The raingardens do not look OK”. Three of the respondents (of 30 in all) criticised tree selection and tree maintenance under the powerlines. In Rangeview Road, street dissatisfaction related to inappropriate street tree selection and inadequate maintenance.
Satisfaction with the street of residency varied with the context of the street. However, common issues affecting satisfaction related to the street trees and other vegetation, traffic, including parking, and maintenance.
20 | Designing raingardens for community acceptance
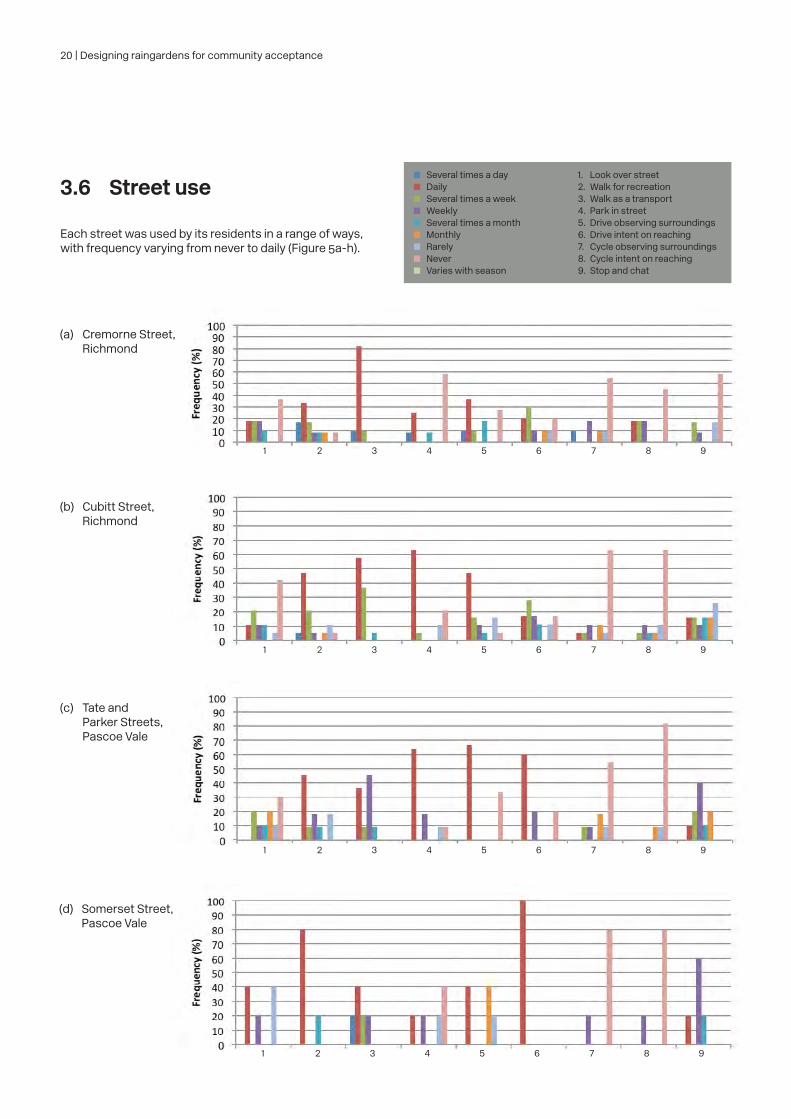
3.6 Street use
Each street was used by its residents in a range of ways, with frequency varying from never to daily (Figure 5a-h).
1. Look over street 2. Walk for recreation 3. Walk as a transport 4. Park in street 5. Drive observing surroundings 6. Drive intent on reaching 7. Cycle observing surroundings 8. Cycle intent on reaching 9. Stop and chat
Several times a day Daily Several times a week Weekly Several times a month Monthly Rarely Never Varies with season
1 2 3 4 5 6 7 8 9
1 2 3 4 5 6 7 8 9
1 2 3 4 5 6 7 8 9
1 2 3 4 5 6 7 8 9
(a) Cremorne Street, Richmond
(d) Somerset Street, Pascoe Vale
(b) Cubitt Street, Richmond
(c) Tate and Parker Streets, Pascoe Vale

CRC for Water Sensitive Cities | 21
1 2 3 4 5 6 7 8 9
1 2 3 4 5 6 7 8 9
1 2 3 4 5 6 7 8 9
1 2 3 4 5 6 7 8 9
(e) Sherwood Ave., Chelsea
(f) Woodbine Grove, Chelsea
(g) Heath Avenue, Mt Evelyn
(h) Rangeview Road, Mt Evelyn
Figure 5. Frequency distributions of street use by residents of that street.
Street use was not related to preference, for any street, nor did it generally correlate with satisfaction with one’s own street.
Street use varied. It was not related to street preference or street satisfaction.

22 | Designing raingardens for community acceptance
Place attachment for each street varied. Place attachment was related to street satisfaction for residents of Cubitt Street, Richmond; Tate/Parker and Somerset Streets, Pascoe Vale; and Heath Avenue, Mt Evelyn. It was related to preference for residents of Rangeview Road, Mt Evelyn only. It was not related to tenure, period of residency or street use.
3.7.1 Place attachment and preference
For the aggregated data, place attachment did not correlate with preference. For data based on street of residency, place attachment of residents of Rangeview Road, Mt Evelyn, did correlate with their preference for Rangeview Road. No other correlations were significant. Thus, in general, place attachment was not related to preference for street of residency.
3.7.2 Influences on place attachment
3.7.2.1 Tenure and period of residency
Cross-tabulations suggested that place attachment was not influenced by tenure or period of residency.
3.7.2.2 Satisfaction and street use
Place attachment correlated with satisfaction with street of residency. It did not correlate strongly enough with street use to have a practical effect.
For data based on street of residency, place attachment correlated with satisfaction for residents of Cubitt Street, Richmond, Tate and Parker and Somerset Streets, Pascoe Vale, and Heath Avenue, Mt Evelyn. Thus, place attachment for these streets could be predicted from satisfaction.
Figure 6. Mean place attachment for residents of each street in study.
3.7 Place attachment
Place attachment varied from a low mean value of 3.96 (s.d. 1.37) for Cremorne Street, Richmond, to a high of 5.02 (s.d. 1.20) for Rangeview Road, Mt Evelyn (Figure 6).
Mea
n pl
ace
atta
chm
ent
Cremorn
e St,
Richmond
Cubitt St,
Richmond
Tate and Park
er St,
Pascoe Vale
Somerset S
t,
Pascoe Vale
Sherwood Ave,
Chelsea
Woodbine Gro
ve,
Chelsea
Heath Ave,
Mt Evelyn
Rangeview Rd,
Mt Evelyn
7
6
5
4
3
2
1

CRC for Water Sensitive Cities | 23
Figure 7. Mean preference for two different pairs of streetscapes in Moonee Ponds and Mentone, related to residency of respondents.
3.8 Influence of knowledge on preference for streetscapes with raingardens
Preference for two pairs of streetscapes, with and without raingardens in Moonee Ponds and Mentone, was determined for the aggregated data and for the data based on whether the respondent lived in a street with raingardens or not. Preference was greater for the Moonee Ponds streetscape with raingardens compared with the streetscape without (Figure 7). The streetscape with raingardens was moderately liked whereas the streetscape without raingardens tended
towards being slightly liked. In contrast, preference for the two streetscapes in Mentone was similar, both being slightly liked (Figure 7). Preference for the two pairs of streetscapes did not differ statistically between groups of respondents living on streets with raingardens and those living on streets without raingardens. There was no influence of age, gender, educational level, professional training or membership of nature organisations on this preference.
Mea
n pr
efer
ence
7
6
5
4
3
2
1Raingarden No raingarden Raingarden No raingarden
Monee Ponds Mentone
7654321
Strongly likeModerately likeSlightly likeNeither like nor dislikeSlightly dislikeModerately dislikeStrongly dislike
All respondentsResidents on streets with raingardensResidents on streets without raingardens

24 | Designing raingardens for community acceptance
Streetscape Photo of streetscape Word cloud representing reasons for preference
Moonee Ponds
Mentone
Figure 8. Word clouds revealing themes underlying preference for streetscapes in Moonee Ponds and Mentone, with or without raingardens.

CRC for Water Sensitive Cities | 25
The themes underlying preference for both streetscapes in Moonee Ponds and Mentone, identified by content analysis, were vegetation and maintenance (Figure 8). Parking was important in preference for the Moonee Ponds streetscapes, which are in a higher-density suburb closer to the city. Naturalness was important in preference for the Mentone streetscapes, which are in a less dense suburb more distant from the city.
The theme of vegetation related to plant selection and tree growth. A lush green streetscape with established trees was preferred. Comments explaining preference illustrate these themes. For example, in preferring the Moonee Ponds streetscape with a raingarden, respondents commented that the “streetscape looks more maintained/groomed/bigger and (has) more trees/shrubs”; “(it) is a more interesting streetscape, greater variety of greenery (grass, native grass and trees) and fewer cars”; “trees, greenery, stormwater escape, tidy”; and “(it) has a raingarden, good shade trees, general neater appearance”. These comments contrast with those of respondents who preferred the streetscape without a raingarden: “prefer (it) as the maturity of the trees make it look more ‘natural’ and I like the less ‘sharp’ edges”, “like the grass on the island”, and “(the streetscape with the raingarden) will look better when the tree grows but I don’t like the plants”. In the Mentone streetscapes, attention was drawn to the mix of plants. The streetscape with the raingarden was described as “a much more pleasing mixture of greenery, less boring expanses of grass and a better mix of different trees.
Overall, a more natural, bushy streetscape. Far more interesting environment than (the streetscape without a raingarden)”. Comments about trees related to their selection and appropriateness to location, revealing a preference for trees that are well established but that do not grow so large that they must be pruned to avoid powerlines. One respondent was also concerned about the size of the plants in the raingarden: “(in the streetscape without the raingarden) the grasses and cut vegetation is better for your neighbours. the only thing is the grasses are big and you could scratch your car or yourself or your pet. maybe use smaller grasses or a bigger boundary around the grasses”.
Opinions around plant selection differed, in some cases related to concerns about maintenance. “...I love native grasses. (Streetscape with a raingarden) is a lot more leafy, more trees and native grasses”; and “(it) looks neater. the garden has neat edging but the plants in it look messy”. Maintenance was an issue for both sets of streetscapes. Untidiness or lack of care was perceived to be a problem in the streetscapes without a raingarden. In the streetscapes with a raingarden, maintenance related more to the raingardens themselves: “Native grasses….-mixed planting may make maintenance difficult” and “I don’t really like the tussock planting. It looks messy in (the Mentone streetscape with a raingarden)”.
Preference for streetscapes with raingardens was influenced by different landscape elements in different suburban contexts. Common elements were trees and other vegetation and maintenance. In a specific context, parking might be important, or naturalness.
In general, familiarity did not influence preference for streetscapes with raingardens.
Familiarity with raingardens, arising from living on a street with raingardens, generally did not influence preferences for streetscapes with or without raingardens. Only in preference for the Moonee Ponds streetscape without raingardens did respondents living on streets with raingardens differ in their perceptions from respondents living on streets without raingardens. The former valued vegetation, parking and maintenance as themes underlying preference, in contrast to vegetation, openness and naturalness for the latter.

26 | Designing raingardens for community acceptance
Figure 9. Initial preference and preference after information was provided about the function of raingardens and their environmental and social benefits.
After respondents read a short paragraph about the role of raingardens in stormwater management and the benefits associated with them (Appendix 1), their preference for the streetscape with the raingarden increased (Figure 9). For the Moonee Ponds streetscapes, the proportion of respondents who preferred the streetscape with a raingarden increased by 10%. In contrast, for the Mentone streetscapes, the proportion of respondents preferring the streetscape with a raingarden almost doubled. Thus, the provision of simple information about the function of raingardens and their environmental and social benefits can positively influence preference for raingardens.
Providing even simple information about raingardens can positively influence preference for streetscapes with raingardens.
All respondentsResidents on streets with raingardensResidents on streets without raingardens
Freq
uenc
y (%
)
100
90
80
70
60
50
40
30
20
10
0Monee Ponds
with raingardenMentone
with raingardenMonee Ponds
with raingardenMentone
with raingarden
Initial preference Preference with knowledge

CRC for Water Sensitive Cities | 27
Table 6. Frequency of willingness of respondents to install a raingarden on their private property.
Table 7. Frequency of respondents that noticed, liked and helped to maintain raingardens in own street.
3.9 Attitudes towards installing a raingarden
Willingness to install a raingarden on private property was high (Table 6). Most people who lived on streets with raingardens had noticed them and most liked them (Table 7). However, few assisted in their maintenance. The reality of living with a raingarden might dampen enthusiasm to help maintain them: almost three-quarters of respondents not living on streets with raingardens stated that they would help maintain any future raingarden installed in their street, compared with one-fifth of respondents who helped maintain the raingardens on their street. Of these residents who did help maintain the raingardens, only half did so regularly, on a monthly basis.
Street of residence Would install raingarden on own property (%)
Yes No MaybeAggregated data (N=128) 73.4 25.8 0.8
Cremorne Street, Richmond (N=12)
83.3 16.7 0
Cubitt Street, Richmond (N=19) 63.2 36.8 0
Tate/Parker Streets, Pascoe Vale (N=11)
90.9 9.1 0
Somerset Street, Pascoe Vale (N=4)
100 0 0
Sherwood Avenue, Chelsea (N=14)
64.3 28.6 7.1
Woodbine Grove, Chelsea (N=9)
100 0 0
Heath Avenue, Mt Evelyn (N=27)
51.9 48.1 0
Rangeview Road, Mt Evelyn (N=32)
81.3 18.8 0
Noticed raingardens in own street (%)
Likes raingardens in own street (%)
Helps maintain raingardens in own street (%)
Yes No Yes No Neutral Yes No Monthly 3-monthly Annually
Aggregated data (N=64)
89.6 11.4 76.2 20.6 3.2 20.9 79.1 53.8 30.8 15.4
Cremorne Street, Richmond (N=12)
100 0 70 30 0 25 75 50 50 0
Tate/Parker Streets, Pascoe Vale (N=11)
72.7 27.3 81.8 18.2 0 18.2 81.8 50.0 0.0 50.0
Sherwood Avenue, Chelsea (N=14)
86.7 13.3 92.3 7.7 0 13.3 86.7 100.0 0 0
Heath Avenue, Mt Evelyn (N=27)
96.6 3.4 71.4 25 3.6 24.1 75.9 57.1 28.6 14.3

28 | Designing raingardens for community acceptance
Residents of different streets differed in their willingness to install raingardens on their private property. The reasons for these differences are not obvious. They do not seem to relate to their liking for their street or their satisfaction with it. Nevertheless, amongst residents of streets with raingardens, more residents of Cremorne Street, Richmond, and Tate/Parker Streets, Pascoe Vale, than expected statistically, and fewer residents of Sherwood Avenue, Chelsea, and Heath Avenue, Mt Evelyn, would install raingardens. Amongst residents of streets without raingardens, more residents in Somerset Street, Pascoe Vale, Woodbine Grove, Chelsea, and Rangeveiw Road,
3.10 Maintenance of raingardensOverwhelmingly, councils were held responsible for maintenance of raingardens, either alone or jointly with others (Figure 10). More residents of streets without raingardens suggested that residents and property owners should also be involved in maintenance, compared with residents of streets with raingardens. At most, one-quarter of residents of streets with raingardens helped to maintain them (Table 7).
There was a willingness to install raingardens on private property. In general, those who lived on streets with raingardens had noticed them and liked them. Few helped in their maintenance.
Raingardens are perceived to be councils’ responsibility to maintain.
Mt Evelyn, and fewer in Cubitt Street, Richmond, than expected statistically would install raingardens. When the analyses were repeated for the two groups of respondents, based on whether they lived on streets with or without raingardens, the proportions that would install raingardens on their private property did not differ statistically.
On different streets with raingardens, proportions of residents who noticed the raingardens in their street did not differ statistically (Table 7). Similarly, proportions who liked the raingardens in their street or helped maintain them did not differ statistically (Table 7).
Figure 10. Word cloud representing most frequent suggestions from residents of streets with or without raingardens for those responsible for maintenance of raingardens.
Residents of streets without raingardens Residents of streets with raingardens

CRC for Water Sensitive Cities | 29
DiscussionAttitudes are the outcome of beliefs, values and knowledge (Ajzen 2001). They are an important influence on landscape perceptions (Gobster et al. 2007), shaping what is looked at and how it is appreciated and valued. Attitudes constitute the lenses through which a landscape is perceived. Attitudes thought to underpin perceptual lenses are associated with place attachment, landscape care and maintenance, satisfaction and affordance. Knowledge can also inform perception directly, not simply by shaping attitudes. This study suggests multiple perceptual lenses can operate in the perception of raingardens. The predominant aesthetic is not related to place attachment, although the aesthetic of attachment and identity is evident in residents of the most preferred street. An aesthetic of care, influenced by
knowledge, and an aesthetic of affordance also appeared to operate. An ecological aesthetic might operate but there was little evidence of a scenic aesthetic.
Understanding which aesthetic lens is used in perceiving streetscapes with raingardens can inform guidelines for the design of raingardens to optimize the likelihood of their appreciation by residents and visitors. Raingardens to be retrofitted into existing streetscapes can then be designed to meet both technical and aesthetic functions. By so doing, streetscape change as a result of the implementation of water sensitive urban design at the local, street level will be accepted, advancing the development of water sensitive cities.
4.1 Aesthetic of attachment and identity
A perceptual lens of attachment and identity did not appear to operate across all of the eight streets in this study. Place attachment to each of the eight streets studied was not strong, varying from neutral (M=3.96, s.d. 1.37) for residents of Cremorne Street, Richmond, to slight (M=5.09, s.d. 1.29) for residents of Rangeview Road, Mt Evelyn. Preference for each street also varied, on a scale from -7 to +7, from a low of -4.53 (s.d. 3.83) for residents of Cubitt Street, Richmond, to a high of 4.50 (s.d. 3.09) for residents of Rangeview Road, Mt Evelyn. Only in the perception of Rangeview Road, Mt Evelyn, by its residents did place attachment correlate with preference. For the aggregated data, Rangeview Road, Mt Evelyn, was the most preferred street (M=2.83, s.d. 3.61).
On a street-by-street basis, it was most preferred by its own residents, who appreciated its vegetation, including the trees, and its cared-for appearance. Stedman (2003) argues that place attachment can be influenced by landscape elements. Indeed, Fornara et al. (2010) included two physical landscape attributes – green areas and environmental health - in their instrument to determine place attachment. This present study of perception of streetscapes with and without raingardens provides some support for the influence of physical landscape elements on place attachment, and, in turn, of place attachment on preference. However, there is no evidence to suggest that the presence or absence of raingardens in streets influences place attachment to that street.
In contrast, satisfaction with the street of residence correlated with preference for Cubitt Street, Richmond, and Sherwood Avenue, Chelsea. For the aggregated data, Cubitt Street, Richmond (M=-6.29, s.d. 2.25), was the least preferred street, and Sherwood Avenue, Chelsea (M=1.80, s.d. 2.59), was slightly preferred, on a scale from -7 to +7. For these two streets, it would seem that satisfaction, rather than place attachment, was an important attitude framing perception of the street by its residents. The specific source of that satisfaction is not clear. However, for Sherwood Avenue, preference correlated with satisfaction with the street’s trees, guttering and footpath. Satisfaction with the street most commonly correlated with satisfaction with its trees. Only in Sherwood Avenue, Chelsea, did street satisfaction correlate with the nature strip, which in many locations along its length was a raingarden.
Place attachment and satisfaction can both be related to preference. In the absence of one, the other might be important. In this study, one or other correlated with preference for residents of three streets. The relationship, though, is not necessarily causal. However, residents of the most ‘attractive’ street were more attached, which might be expected to influence preference, whereas for residents of less attractive streets, appearance might be less important than the street satisfying their needs.
30 | Designing raingardens for community acceptance
Place dependence is a component of sense of place, with place attachment and place identity. It too might influence preference for a resident’s street. In this study, there was a range of uses of the street of residence, representing the resident’s street dependence. However, preference was not related to street dependence. How a resident used his/her street as explored in this study did not influence preference for that street.
Similarly the process components of place attachment explored in this study, i.e. period of residency and tenure, did not appear to influence place attachment. Place attachment is a complex phenomenon, modelled as a tripartite structure with person, place and process components (Scannell and Gifford 2010a). Many factors must comprise these components, interacting within and between them, in the production of place attachment. Multiple methodologies are available to explore place attachment (Stobbelaar and Pedroli 2011), with different methods for data collection. In this study, surveys with follow-up focus groups were used to collect data. In subsequent studies, interviews would allow deeper examination of the possible myriad factors comprising place attachment, building on this preliminary understanding.
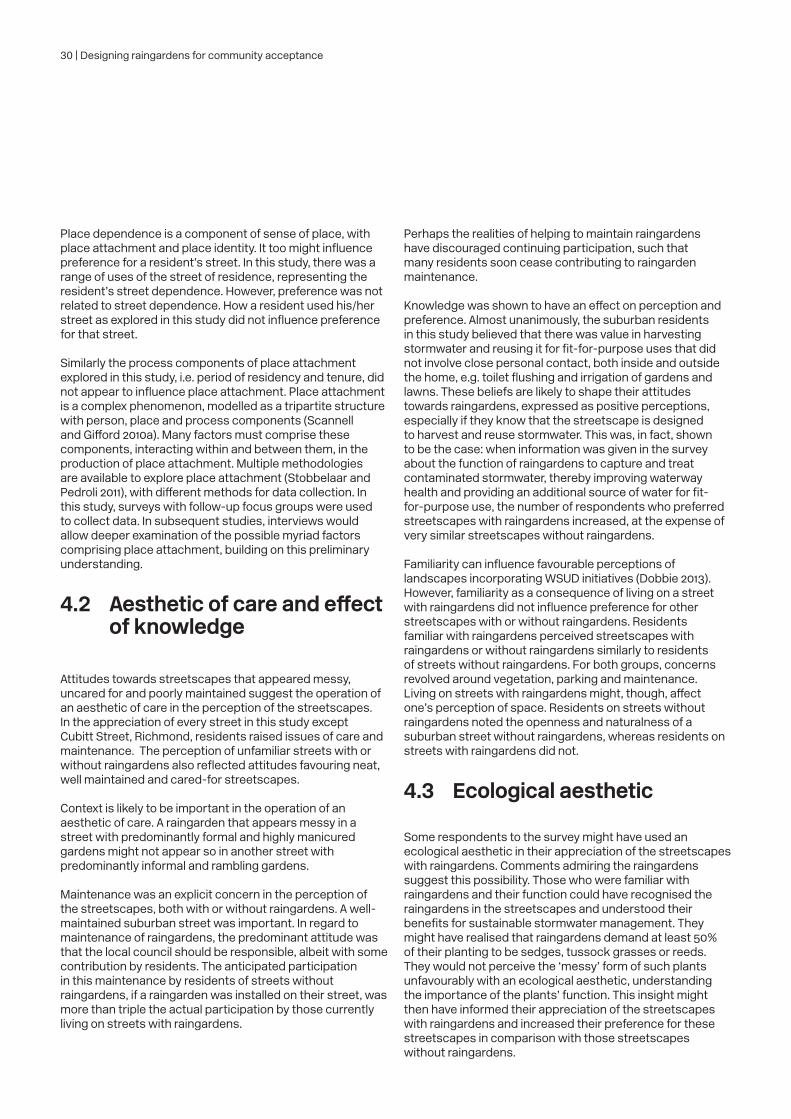
4.2 Aesthetic of care and effect of knowledge
Attitudes towards streetscapes that appeared messy, uncared for and poorly maintained suggest the operation of an aesthetic of care in the perception of the streetscapes. In the appreciation of every street in this study except Cubitt Street, Richmond, residents raised issues of care and maintenance. The perception of unfamiliar streets with or without raingardens also reflected attitudes favouring neat, well maintained and cared-for streetscapes.
Context is likely to be important in the operation of an aesthetic of care. A raingarden that appears messy in a street with predominantly formal and highly manicured gardens might not appear so in another street with predominantly informal and rambling gardens.
Maintenance was an explicit concern in the perception of the streetscapes, both with or without raingardens. A well-maintained suburban street was important. In regard to maintenance of raingardens, the predominant attitude was that the local council should be responsible, albeit with some contribution by residents. The anticipated participation in this maintenance by residents of streets without raingardens, if a raingarden was installed on their street, was more than triple the actual participation by those currently living on streets with raingardens.
Perhaps the realities of helping to maintain raingardens have discouraged continuing participation, such that many residents soon cease contributing to raingarden maintenance.
Knowledge was shown to have an effect on perception and preference. Almost unanimously, the suburban residents in this study believed that there was value in harvesting stormwater and reusing it for fit-for-purpose uses that did not involve close personal contact, both inside and outside the home, e.g. toilet flushing and irrigation of gardens and lawns. These beliefs are likely to shape their attitudes towards raingardens, expressed as positive perceptions, especially if they know that the streetscape is designed to harvest and reuse stormwater. This was, in fact, shown to be the case: when information was given in the survey about the function of raingardens to capture and treat contaminated stormwater, thereby improving waterway health and providing an additional source of water for fit-for-purpose use, the number of respondents who preferred streetscapes with raingardens increased, at the expense of very similar streetscapes without raingardens.
Familiarity can influence favourable perceptions of landscapes incorporating WSUD initiatives (Dobbie 2013). However, familiarity as a consequence of living on a street with raingardens did not influence preference for other streetscapes with or without raingardens. Residents familiar with raingardens perceived streetscapes with raingardens or without raingardens similarly to residents of streets without raingardens. For both groups, concerns revolved around vegetation, parking and maintenance. Living on streets with raingardens might, though, affect one’s perception of space. Residents on streets without raingardens noted the openness and naturalness of a suburban street without raingardens, whereas residents on streets with raingardens did not.
4.3 Ecological aesthetic
Some respondents to the survey might have used an ecological aesthetic in their appreciation of the streetscapes with raingardens. Comments admiring the raingardens suggest this possibility. Those who were familiar with raingardens and their function could have recognised the raingardens in the streetscapes and understood their benefits for sustainable stormwater management. They might have realised that raingardens demand at least 50% of their planting to be sedges, tussock grasses or reeds. They would not perceive the ‘messy’ form of such plants unfavourably with an ecological aesthetic, understanding the importance of the plants’ function. This insight might then have informed their appreciation of the streetscapes with raingardens and increased their preference for these streetscapes in comparison with those streetscapes without raingardens.

CRC for Water Sensitive Cities | 31
4.4 Aesthetic of affordance
An aesthetic of affordance values landscapes that support desired uses. In this study, concerns about the availability of on-street parking, ease of entry or exit from a car, and walking along a street without being scratched by plants suggest the operation of this aesthetic as a lens in the perception of streets with or without raingardens. Residents of inner city streets might be concerned about the loss of on-street parking as a result of construction of raingardens within the road itself. Motorists in streets with raingardens might be concerned about the difficulty of alighting from a car parked up against a raingarden or the possibility of plants within the raingarden scratching the car or its occupants. An additional concern might be that plants within a raingarden could scratch pedestrians or their pets, unlike grass nature strips.
4.5 Designing raingardens for appreciation and acceptance
Landscape elements are important in the perception of and preference for streetscapes, with or without raingardens. These landscape elements can be manipulated when retrofitting raingardens into suburban streets to optimize appreciation of the new landscape and acceptance of its raingardens. This study has shown that street trees and understorey plants and their maintenance can influence perception of and preference for streetscapes. In addition, possible changes to how a street is used can also influence its appreciation and acceptance of that change. When designing raingardens, the following eight recommendations should be followed:
1. Placement of raingardens within a street should be carefully considered.
On-street parking is highly valued, particularly in streets in higher density suburbs. Ideally, raingardens should not displace car parking along the kerb. Locations other than within the road itself should be considered first. If on-street parking must be lost, community engagement is critical to explain the reasons for this loss and the benefits that will come from sustainable stormwater management and the construction of raingardens.
2. Context is critical.
Street trees and understorey plants for inclusion in a raingarden in one street might not be suitable in another street. Raingardens must always be designed to complement their physical and cultural context.
3. Wherever possible, trees should be included in the raingarden.
Certain species of trees, e.g. Banksia marginata and Hakea laurina, have been shown to function well in stormwater treatment (Payne et al. 2015). Other trees could also be used as only 50% of the planting within a raingarden must function in treating stormwater. However, deciduous trees should be avoided as fallen leaves can reduce the effectiveness of the raingarden (Payne et al. 2015).
4. Choose plants for aesthetic function as well as technical function.
The palette of understorey plants currently used in raingardens is quite narrow, generally restricted to wetland plants that tolerate periodic inundation. Many of these plants are tussock grasses, sedges and reeds, with a similar habit and long strappy leaves. The form of the plant is naturally loose and irregular, which can appear untidy, especially in a suburban context of formal, manicured gardens. In a bushy suburb in which domestic gardens use predominantly native plants with irregular forms planted in organic or informal layouts, raingardens with such plants are less likely to appear messy, simply reflecting their suburban context more closely. The use of exotic plants, particularly those with showy flowers or seasonal displays, should be considered for inclusion in a raingarden. For effective function, at least 50% of the planting of a raingarden should contribute to water quality treatment (Payne et al. 2015). This provides the opportunity for 50% of the planting to be other plants, selected for their aesthetic function rather than their technical function. Careful consideration of the context of each raingarden should reveal possible plants to be included in the raingarden, for their appearance and seasonal variation. Many plants in nearby domestic gardens might be suitable for planting in raingardens in the street. A raingarden whose design reflects its immediate context, drawing its design elements, including plants, from surrounding gardens, is likely to be appreciated, valued and accepted by local residents.
5. Plant selection should also consider how the area around a raingarden might be used.
Possible adjacent uses might constrain plant selection. For example, if on-street parking is available adjacent to a raingarden, plants with spiky foliage that might scratch cars, pedestrians or motorists should be avoided. Similarly, plants that attain a large size and so obstruct movement past the raingarden should also be avoided.
6. Ensure the raingarden always looks tidy and well cared for.
If plant selection is restricted to strappy loosely formed plants in a raingarden, extra attention should be given to ensure the raingarden is well maintained. Such raingardens

32 | Designing raingardens for community acceptance
need an orderly frame for their messy ecosystem (Nassauer 1995b). Orderly frames, or ‘cues to care’ (Nassauer 1995b), can be provided by implementing a maintenance regime that removes all rubbish and replaces dead or dying plants quickly, so that the planting appears dense and cared for. Pruning also demonstrates that the raingardens are cared for by someone, if only the local council. However, such pruning must be skilled and improve the appearance of the plant and the raingarden.
7. Ensure the raingarden always looks green.
Maintenance should also ensure that raingardens remain green. Green, lush landscapes are preferred over brown, arid landscapes (Balling and Falk 1982; Bier 2001; Dobbie 2013). Raingardens that have brown plants, even if they are healthy, are likely to be less preferred than if their plants are green. In suburban contexts where domestic gardens are well irrigated, the contrast of these gardens with raingardens with brown foliage will be even greater, to the disadvantage of the raingardens.
8. Provide signage as ‘cue to care’ and to increase knowledge and understanding.
Signage is a useful ‘cue to care’ and increases knowledge and understanding of raingarden function. Knowledge shifts preference towards streetscapes with raingardens. Thus, signage presenting information about the function of raingardens and their environmental benefits could be provided. This is likely to increase knowledge and enhance appreciation of the raingarden and preference for the streetscape. Ensure that any signage is well designed, visible but unobtrusive.

CRC for Water Sensitive Cities | 33
ReferencesAustralian Bureau of Statistics (ABS) (nd). 2011 Census Community Profiles: Greater Melbourne. http://www.censusdata.abs.gov.au/census_services/getproduct/census/2011/communityprofile/2GMEL?opendocument&navpos=220; accessed 26/3/2015.
Ajzen, I. (2001). Nature and operation of attitudes. Annual Review of Psychology 52(1): 27-58.
Balling, J. D. and J. H. Falk (1982). Development of visual preference for natural environments. Environment and Behavior 14(1): 5-28.
Benedict, M. A. and E. T. McMahon (2006). Green Infrastructure. London, Island Press.
Bier, V. M. (2001). On the state of the art: Risk communication to the public. Reliability Engineering and System Safety 71(2): 139-150.
Brown, B., D. D. Perkins and G. Brown (2003). Place attachment in a revitalizing neighborhood: Individual and block levels of analysis. Journal of Environmental Psychology 23(3): 259-271.
Carlson, A. (1979). Appreciation and the natural environment. The Journal of Aesthetics and Art Criticism 37(3): 267-275.
Chemero, A. (2003). An outline of a theory of affordances. Ecological Psychology 15(2): 181-195.
Dearden, P. (1989). Societal landscape preferences: a pyramid of influences. In Landscape Evaluation: Approaches and Applications. Eds P. Dearden and B. Sadler. Victoria, Department of Geography, University of Victoria and Institute of the North-American West: 41-63.
Dobbie, M. F. (2013). Public aesthetic preferences to inform sustainable wetland management in Victoria, Australia. Landscape and Urban Planning 120: 178-189.
Dobbie, M. F. and R. R. Brown (2014). Cultural ecosystem services of wsud: what are they and why do they matter? 13th International Conference on Urban Drainage. Kuching, Sarawak, Malaysia.
Dutcher, D. D., J. C. Finley, A. E. Luloff and J. Johnson (2004). Landowner perceptions of protecting and estabishing riparian forests: a qualitative analysis. Society & Natural Resources 17(4): 329-342.
Eaton, M. M. (1997). The beauty that requires health. In Placing Nature: Culture and Landscape Ecology. Ed. J. I. Nassauer. Washington DC, Covelo, California, Island Press: 85 - 106.
Eaton, M. M. (2001). Merit, Aesthetic and Ethical. Oxford, New York, Oxford University Press.
Fornara, F., M. Bonaiuto and M. Bonnes (2010). Cross-validation of abbreviated perceived residential environment quality (PREQ) and neighborhood attachment (NA) indicators. Environment and Behavior 42(2): 171-196.
Gibson, J. J. (1979). The Ecological Approach to Visual Perception. Boston, Houghton Mifflin.
Gobster, P. H. (1999). An ecological aesthetic for forest landscape management. Landscape Journal 18: 54 - 63.
Gobster, P. H. (2001). Visions of nature: conflict and compatibility in urban park restoration. Landscape and Urban Planning 56: 35-51.
Gobster, P. H., J. I. Nassauer, T. C. Daniel and G. Fry (2007). The shared landscape: what does aesthetics have to do with ecology? Landscape Ecology 22(7): 959-972.
Hidalgo, M. C. and B. Hernandez (2001). Place attachment: conceptual and empirical questions. Journal of Environmental Psychology 21(3): 273-281.
Hull, R. B., D. P. Robertson and A. Kenora (2001). Public understandings of nature: a case studfy of local knowledge about “natural” forest conditions. Society and Natural Resources 14: 325-340.
Lewicka, M. (2011). Place attachment: How far have we come in the last 40 years? Journal of Environmental Psychology 31(3): 207-230.
Manzo, L. C. (2005). For better or worse: Exploring multiple dimensions of place meaning. Journal of Environmental Psychology 25(1): 67-86.
Nassauer, J. I. (1988). The aesthetics of horticulture: neatness as a form of care. HortScience 23(6): 973-977.
Nassauer, J. I. (1992). The appearance of ecological systems as a matter of policy. Landscape Ecology 6(4): 239 - 250.
Nassauer, J. I. (1995a). Culture and changing landscape structure. Landscape Ecology 10(4): 229 - 237.
Nassauer, J. I. (1995b). Messy ecosystems, orderly frames. Landscape Journal 14, 161-170.
Payne, E. G. I., B. E. Hatt, A. Deletic, M. F. Dobbie, D. T. McCarthy and G. I. Chandrasena (2015). Adoption Guidelines for Stormwater Biofiltration Systems – Summary Report. Melbourne, Australia: Cooperative, Cooperative Research Centre for Water Sensitive Cities.

34 | Designing raingardens for community acceptance
Proshansky, H. M., A. K. Fabian and R. Kaminoff (1983). Place-identity: Physical world socialization of the self. Journal of Environmental Psychology 3(1): 57-83.
Rolston, H., III. (1995). Does aesthetic appreciation of landscapes need to be science-based? British Journal of Aesthetics, from http://find.galegroup.com.ezproxy.lib.unimelb.edu.au/itx/infomark.do?&contentSet=IAC-Documents&type=retrieve&tabID=T002&prodId=EAM&docId=A18009298&source=gale&srcprod=EAIM&userGroupName=unimelb&version=1.0.
Ryan, R. L. (2005). Exploring the effects of environmental experience on attachment to urban natural areas. Environment and Behavior 37(1): 3-42.
Scannell, L. and R. Gifford (2010a). Defining place attachment: A tripartite organizing framework. Journal of Environmental Psychology 30(1): 1-10.
Scannell, L. & Gifford, R. (2010b). The relations between natural and civic place attachment and pro-environmental behavior. Journal of Environmental Psychology 30(3), 289-297.
Sofoulis, Z. (2005). Big water, everyday water: a sociotechnical perspective. Continuum: Journal of Media & Cultural Studies 19(4): 445 - 463.
Stamps, A. E., III. (1990). Use of photographs to simulate environments: a meta-analysis. Perceptual and Motor Skills, 71, 907-913.
Stedman, R. C. (2003). Is it really just a social construction?: The contribution of the physical environment to sense of place. Society & Natural Resources 16(8): 671-685.
Stobbelaar, D. J. and B. Pedroli (2011). Perspectives on landscape identity: a conceptual challenge.” Landscape Research 36(3): 321-339.
Trigger, D. S. and L. Head (2010). Restored nature, familiar culture: contesting visions for preferred environments in Australian cities. Nature + Culture 5(3): 231-250.
Vorkinn, M. and H. Riese (2001). Environmental concern in a local context: The significance of place attachment. Environment and Behavior 33(2): 249-263.
Wagner, M. M. (2008). Acceptance by knowing? The social context of urban riparian buffers as a stormwater best management practice. Society & Natural Resources 21(10): 908-920.
Weber, T., J. Stewart and J. Dahlenburg (2009). The importance of retrofitting WSUD in restoring urbanised catchments. 6th International Conference on Water Sensitive Urban Design. Perth, Western Australia.
Wong, T. H. F. and Brown, R. R. (2009). The water sensitive city: principles for practice. Water Science and Technology 60(3): 673-682.
Zube, E. H., Simcox, D, and Friedman, S (1998). Desert riparian landscapes: values and change, 1981 - 96. Landscape and Urban Planning 42: 81 -89.

Appendix 1 — Survey: Community perceptions of suburban streetscapes
Appendix 2 —Survey respondents’ sociodemographic data
Designing raingardens for community acceptance

Designing raingardens for community acceptanceAppendix 1 – Survey: Community perceptions of suburban streetscapes | 36
©2015 – CRC for Water Sensitive Citieswww.watersensitivecities.org.au | [email protected]
Appendix 1
Survey: Community perceptions of suburban streetscapesThank you for agreeing to complete this survey. I am going to start by asking you two questions about how you think your street looks.
Question 1. What do you think about how your street looks? Do you like it?
Question 2. How could the appearance of your street be improved?
Now I would like to ask you some questions about stormwater. I am interested in your opinion. There are no right or wrong answers.
Stormwater is all surface water that runs off, after rainfall, from surfaces such as roofs, footpaths, roads, car parks, gardens and vegetated open spaces.
Question 3. Do you think that there is value in capturing and treating stormwater before it is discharged to a nearby river, creek or Port Phillip Bay?
[ ] Yes [ ] No
Question 4. Do you think that there is value in reusing treated stormwater in some way?
[ ] Yes [ ] No
Question 5. Which of the following do you think are appropriate uses of treated stormwater, i.e. stormwater that has had pollutants removed from it? You can choose as many as you like. If you think none is appropriate, please choose that box.
[ ] Drinking
[ ] Dishwashing
[ ] Clotheswashing
[ ] Showering/bathing
[ ] Toilet flushing
[ ] Garden watering
[ ] Car washing
[ ] Watering lawns and garden beds in parks
[ ] Water in ponds or lakes in parks
[ ] Environmental flows in streams and rivers
[ ] Industrial use
[ ] Other: Please describe these other uses:
[ ] None

Designing raingardens for community acceptance Appendix 1 – Survey: Community perceptions of suburban streetscapes | 37
©2015 – CRC for Water Sensitive Citieswww.watersensitivecities.org.au | [email protected]
The next questions involve streetscapes. When you look at your street, you are looking at what is called a streetscape. It is a street scene.
The following 14 questions simply ask you to compare sets of 4 photos of different streetscapes in terms of best and worst.
For each set of 4 photos, please choose the one that you like best and the one that you like worst by labelling them ‘B’ for best and ‘W’ for worst.
There is no right or wrong answer. It depends on what you like.
You will notice that photographs are repeated in this series of questions. This is intended and is necessary to allow statistical analysis of the results.
Question 6. Which one of these four streetscapes do you like best and which one do you like worst? Label the images to indicate your preference: one box for best (B), and one box for worst (W).
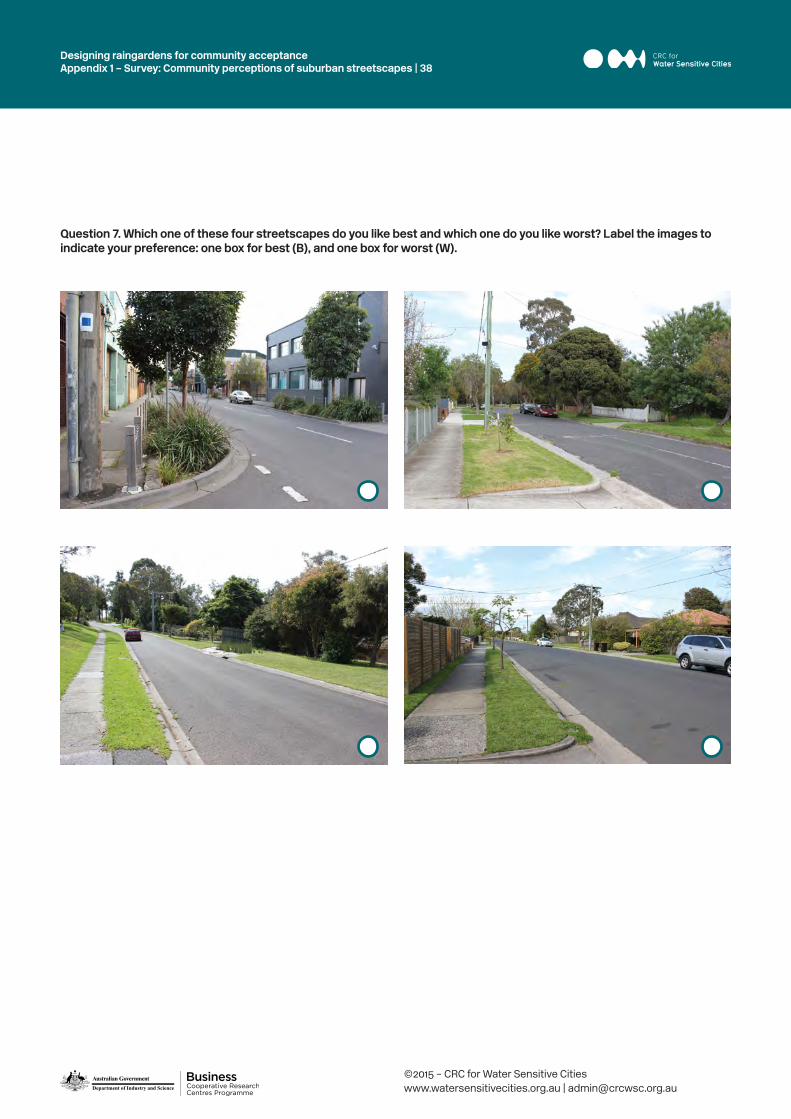
Designing raingardens for community acceptanceAppendix 1 – Survey: Community perceptions of suburban streetscapes | 38
©2015 – CRC for Water Sensitive Citieswww.watersensitivecities.org.au | [email protected]
Question 7. Which one of these four streetscapes do you like best and which one do you like worst? Label the images to indicate your preference: one box for best (B), and one box for worst (W).

Designing raingardens for community acceptance Appendix 1 – Survey: Community perceptions of suburban streetscapes | 39
©2015 – CRC for Water Sensitive Citieswww.watersensitivecities.org.au | [email protected]
Question 8. Which one of these four streetscapes do you like best and which one do you like worst? Label the images to indicate your preference: one box for best (B), and one box for worst (W).
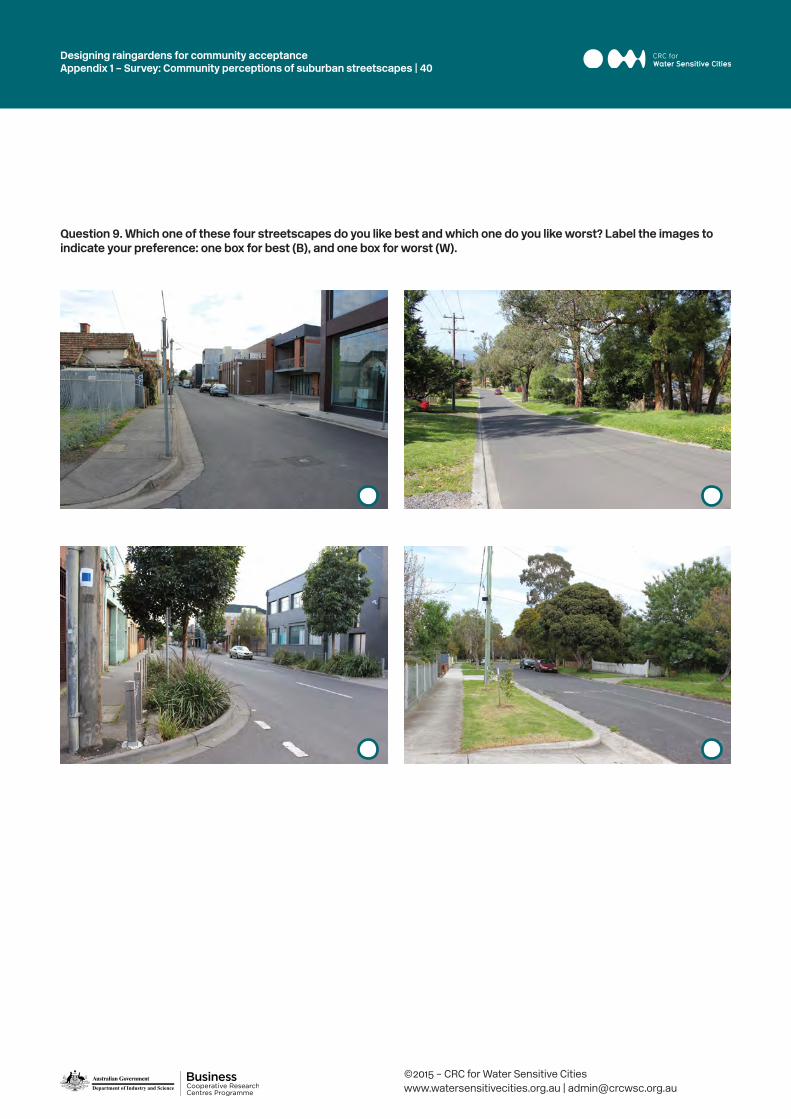
Designing raingardens for community acceptanceAppendix 1 – Survey: Community perceptions of suburban streetscapes | 40
©2015 – CRC for Water Sensitive Citieswww.watersensitivecities.org.au | [email protected]
Question 9. Which one of these four streetscapes do you like best and which one do you like worst? Label the images to indicate your preference: one box for best (B), and one box for worst (W).
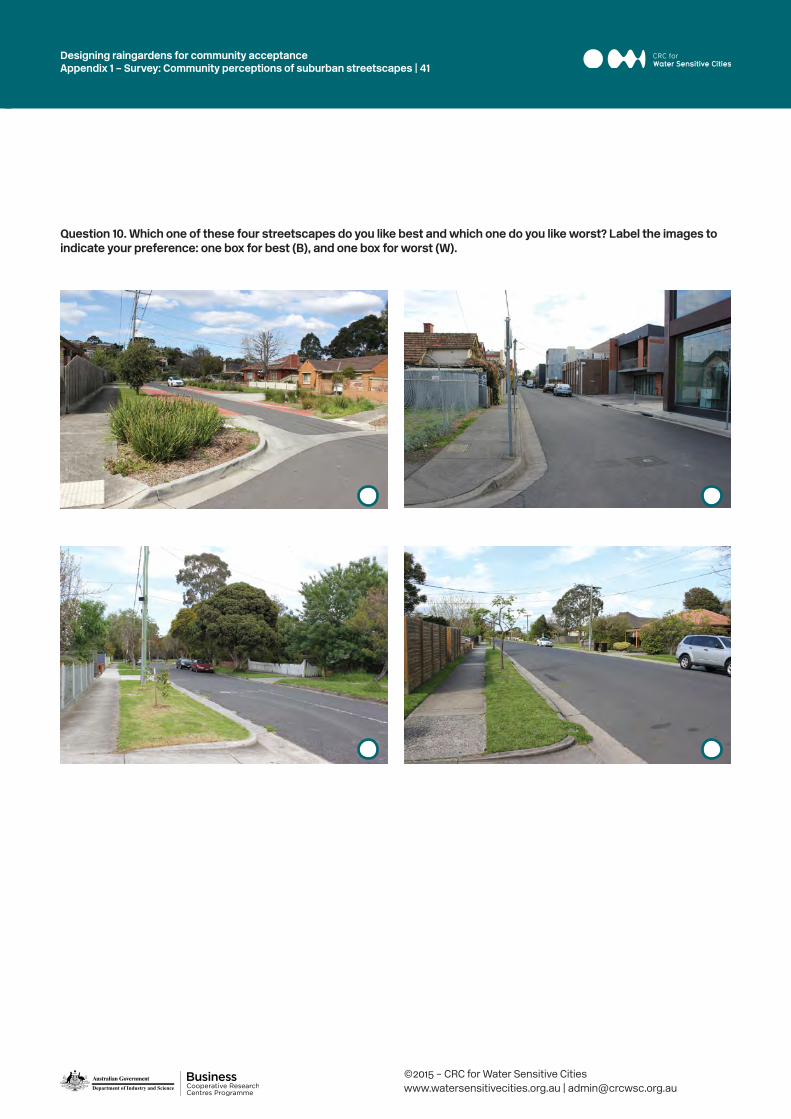
Designing raingardens for community acceptance Appendix 1 – Survey: Community perceptions of suburban streetscapes | 41
©2015 – CRC for Water Sensitive Citieswww.watersensitivecities.org.au | [email protected]
Question 10. Which one of these four streetscapes do you like best and which one do you like worst? Label the images to indicate your preference: one box for best (B), and one box for worst (W).

Designing raingardens for community acceptanceAppendix 1 – Survey: Community perceptions of suburban streetscapes | 42
©2015 – CRC for Water Sensitive Citieswww.watersensitivecities.org.au | [email protected]
Question 11. Which one of these four streetscapes do you like best and which one do you like worst? Label the images to indicate your preference: one box for best (B), and one box for worst (W).

Designing raingardens for community acceptance Appendix 1 – Survey: Community perceptions of suburban streetscapes | 43
©2015 – CRC for Water Sensitive Citieswww.watersensitivecities.org.au | [email protected]
Question 12. Which one of these four streetscapes do you like best and which one do you like worst? Label the images to indicate your preference: one box for best (B), and one box for worst (W).

Designing raingardens for community acceptanceAppendix 1 – Survey: Community perceptions of suburban streetscapes | 44
©2015 – CRC for Water Sensitive Citieswww.watersensitivecities.org.au | [email protected]
Question 13. Which one of these four streetscapes do you like best and which one do you like worst? Label the images to indicate your preference: one box for best (B), and one box for worst (W).

Designing raingardens for community acceptance Appendix 1 – Survey: Community perceptions of suburban streetscapes | 45
©2015 – CRC for Water Sensitive Citieswww.watersensitivecities.org.au | [email protected]
Question 14. Which one of these four streetscapes do you like best and which one do you like worst? Label the images to indicate your preference: one box for best (B), and one box for worst (W).

Designing raingardens for community acceptanceAppendix 1 – Survey: Community perceptions of suburban streetscapes | 46
©2015 – CRC for Water Sensitive Citieswww.watersensitivecities.org.au | [email protected]
Question 15. Which one of these four streetscapes do you like best and which one do you like worst? Label the images to indicate your preference: one box for best (B), and one box for worst (W).

Designing raingardens for community acceptance Appendix 1 – Survey: Community perceptions of suburban streetscapes | 47
©2015 – CRC for Water Sensitive Citieswww.watersensitivecities.org.au | [email protected]
Question 16. Which one of these four streetscapes do you like best and which one do you like worst? Label the images to indicate your preference: one box for best (B), and one box for worst (W).

Designing raingardens for community acceptanceAppendix 1 – Survey: Community perceptions of suburban streetscapes | 48
©2015 – CRC for Water Sensitive Citieswww.watersensitivecities.org.au | [email protected]
Question 17. Which one of these four streetscapes do you like best and which one do you like worst? Label the images to indicate your preference: one box for best (B), and one box for worst (W).

Designing raingardens for community acceptance Appendix 1 – Survey: Community perceptions of suburban streetscapes | 49
©2015 – CRC for Water Sensitive Citieswww.watersensitivecities.org.au | [email protected]
Question 18. Which one of these four streetscapes do you like best and which one do you like worst? Label the images to indicate your preference: one box for best (B), and one box for worst (W).
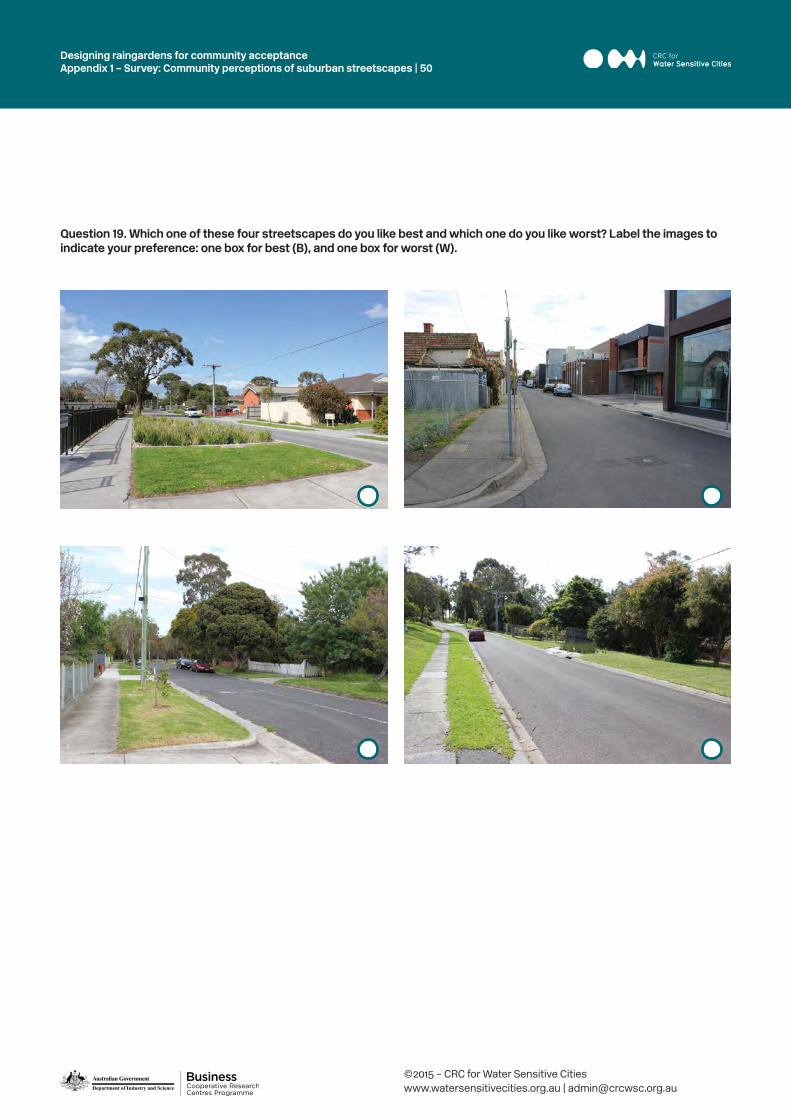
Designing raingardens for community acceptanceAppendix 1 – Survey: Community perceptions of suburban streetscapes | 50
©2015 – CRC for Water Sensitive Citieswww.watersensitivecities.org.au | [email protected]
Question 19. Which one of these four streetscapes do you like best and which one do you like worst? Label the images to indicate your preference: one box for best (B), and one box for worst (W).

Designing raingardens for community acceptance Appendix 1 – Survey: Community perceptions of suburban streetscapes | 51
©2015 – CRC for Water Sensitive Citieswww.watersensitivecities.org.au | [email protected]
Now I would like you to look at pairs of streetscapes and answer questions relating to each pair.
Question 20.
20A 20B
Question 20.1. Do the streetscapes in photos 20A and 20B look different to you? If so, how do they differ?
[ ] Strongly like [ ] Moderately like [ ] Slightly like [ ] Neither like nor dislike [ ] Slightly dislike [ ] Moderately dislike [ ] Strongly dislike
[ ] Strongly like [ ] Moderately like [ ] Slightly like [ ] Neither like nor dislike [ ] Slightly dislike [ ] Moderately dislike [ ] Strongly dislike
Question 20.2. How much do you like the streetscape in Photo 20A? Please tick the box below that most closely describes how much you like or dislike this streetscape:
Question 20.3. How much do you like the streetscape in Photo 20B? Please tick the box below that most closely describes how much you like or dislike this streetscape:
Question 20.4. Which streetscape do you prefer out of Photos 20A and 20B? Why?

Designing raingardens for community acceptanceAppendix 1 – Survey: Community perceptions of suburban streetscapes | 52
©2015 – CRC for Water Sensitive Citieswww.watersensitivecities.org.au | [email protected]
Question 21.
21A 21B
Question 21.1. Do the streetscapes in photos 21A and 21B look different to you? If so, how do they differ?
Question 21.2. How much do you like the streetscape in Photo 21A? Please tick the box below that most closely describes how much you like or dislike this streetscape:
Question 21.3. How much do you like the streetscape in Photo 21B? Please tick the box below that most closely describes how much you like or dislike this streetscape:
Question 21.4. Which streetscape do you prefer out of Photos 21A and 21B? Why?
[ ] Strongly like [ ] Moderately like [ ] Slightly like [ ] Neither like nor dislike [ ] Slightly dislike [ ] Moderately dislike [ ] Strongly dislike
[ ] Strongly like [ ] Moderately like [ ] Slightly like [ ] Neither like nor dislike [ ] Slightly dislike [ ] Moderately dislike [ ] Strongly dislike

Designing raingardens for community acceptance Appendix 1 – Survey: Community perceptions of suburban streetscapes | 53
©2015 – CRC for Water Sensitive Citieswww.watersensitivecities.org.au | [email protected]
Question 22. The streetscapes in Photos 20A and 21A have raingardens where the nature strip might otherwise be. Raingardens are designed to capture and treat stormwater before it is discharged to the bay, reducing the amount of pollution that enters our waterways. It might also be possible to reuse the treated stormwater, to reduce the demand on mains drinking water and improve river and stream health. The streetscapes in Photos 20B and 21B do not have raingardens. Stormwater in these streets is discharged directly to the bay.
21A 21B
20A 20B
Question 22.1. Knowing what raingardens do, do you prefer Photo 20A to Photo 20B
[ ] Yes [ ] No
Question 22.2. Similarly, do you prefer Photo 21A to 21B?
[ ] Yes [ ] No

Designing raingardens for community acceptanceAppendix 1 – Survey: Community perceptions of suburban streetscapes | 54
©2015 – CRC for Water Sensitive Citieswww.watersensitivecities.org.au | [email protected]
Now some questions about raingardens and you.
Question 23. Would you be prepared to install a raingarden to capture and treat stormwater on your property?
[ ] Yes [ ] No
Question 24. There is a raingarden to capture and treat stormwater in your street.
Question 24.1 Have you noticed the raingardens in your street?
[ ] Yes [ ] No
Question 24.2. Do you like the raingardens in your street?
[ ] Yes [ ] No
Question 24.3. Do you help maintain the raingardens by removing rubbish, weeding the garden, pruning the plants?
[ ] Yes [ ] No
Question 24.4. If you answered yes to Question 24.3, how often do you undertake maintenance of the raingarden in your street?
[ ] Monthly [ ] Every 3 months [ ] Yearly
Question 25. Who should be responsible for maintenance of raingardens in streets?
Now, some questions about how you feel about your street.
The following four questions ask you to indicate how much you agree or disagree with a statement. Tick the box that most closely describes how much you agree or disagree with the statement.
Question 26. “This street is a part of me.”
[ ] Strongly agree [ ] Moderately agree [ ] Slightly agree [ ] Neither agree nor disagree [ ] Slightly disagree [ ] Moderately disagree [ ] Strongly disagree
Question 27. “It would be very hard for me to leave this street.”
[ ] Strongly agree [ ] Moderately agree [ ] Slightly agree [ ] Neither agree nor disagree [ ] Slightly disagree [ ] Moderately disagree [ ] Strongly disagree
Question 28. “This is the ideal street for me.”
[ ] Strongly agree [ ] Moderately agree [ ] Slightly agree [ ] Neither agree nor disagree [ ] Slightly disagree [ ] Moderately disagree [ ] Strongly disagree
Question 29. “I do not feel a part of this street.”
[ ] Strongly agree [ ] Moderately agree [ ] Slightly agree [ ] Neither agree nor disagree [ ] Slightly disagree [ ] Moderately disagree [ ] Strongly disagree

Designing raingardens for community acceptance Appendix 1 – Survey: Community perceptions of suburban streetscapes | 55
©2015 – CRC for Water Sensitive Citieswww.watersensitivecities.org.au | [email protected]
These next two questions give us a bit of background to you as a resident in your street.
Question 30. How long have you lived in this street?
years months
Question 31. Do you own or rent the house or apartment where you live?
[ ] Own [ ] Rent
I am interested in how you interact with and use your street.
Here are some possible uses and interactions. You might do none, some or all of these things, daily, weekly, monthly or never. So, how often would you:
Question 32. Sit on your porch or in your garden and look out over your street?
Question 33. Walk along your street for recreation, e.g. walking your dog or exercising?
Question 34. Walk along your street to get somewhere, e.g. the local shop or park?
Question 35. Park your car in your street?
Question 36. Drive along your street, observing what is happening?
Question 37. Drive along your street, just intent on reaching your destination?
Question 38. Cycle along your street, observing what is happening?
Question 39. Cycle along your street, just intent on reaching your destination?
Question 40. Stop and chat with neighbours in your street?
Question 41. Are there other ways in which you interact with your street?

Designing raingardens for community acceptanceAppendix 1 – Survey: Community perceptions of suburban streetscapes | 56
©2015 – CRC for Water Sensitive Citieswww.watersensitivecities.org.au | [email protected]
I will now ask you how satisfied you are with the various elements of your street.
I am interested in your satisfaction with such structures as the tres and footpaths. Again, there are no right or wrong answers. I am just interested in your opinion.
Question 42. So, how satisfied are you with your street as a whole?
[ ] Strongly satisfied [ ] Moderately satisfied [ ] Slightly satisfied [ ] Neither satisfied nor dissatisfied [ ] Slightly dissatisfied [ ] Moderately dissatisfied [ ] Strongly dissatisfied
Question 43. How satisfied are you with the street trees in your street?
[ ] Strongly satisfied [ ] Moderately satisfied [ ] Slightly satisfied [ ] Neither satisfied nor dissatisfied [ ] Slightly dissatisfied [ ] Moderately dissatisfied [ ] Strongly dissatisfied
Question 44. How satisfied are you with the nature strip in your street?
[ ] Strongly satisfied [ ] Moderately satisfied [ ] Slightly satisfied [ ] Neither satisfied nor dissatisfied [ ] Slightly dissatisfied [ ] Moderately dissatisfied [ ] Strongly dissatisfied
Question 45. How satisfied are you with the guttering (i.e. kerb and channel) along your street?
[ ] Strongly satisfied [ ] Moderately satisfied [ ] Slightly satisfied [ ] Neither satisfied nor dissatisfied [ ] Slightly dissatisfied [ ] Moderately dissatisfied [ ] Strongly dissatisfied
Question 46. How satisfied are you with the footpath in your street?
[ ] Strongly satisfied [ ] Moderately satisfied [ ] Slightly satisfied [ ] Neither satisfied nor dissatisfied [ ] Slightly dissatisfied [ ] Moderately dissatisfied [ ] Strongly dissatisfied
Question 47. How satisfied are you with the on-street parking in your street?
[ ] Strongly satisfied [ ] Moderately satisfied [ ] Slightly satisfied [ ] Neither satisfied nor dissatisfied [ ] Slightly dissatisfied [ ] Moderately dissatisfied [ ] Strongly dissatisfied
Question 48. Are there other things in your street that you would like to comment upon, in terms of your satisfaction or dissatisfaction?

Designing raingardens for community acceptance Appendix 1 – Survey: Community perceptions of suburban streetscapes | 57
©2015 – CRC for Water Sensitive Citieswww.watersensitivecities.org.au | [email protected]
Now just a few questions about you, so I can see if there are any patterns in all the responses to the survey.
Question 49. How old are you? You can give an age range, i.e. 50-55 years, if you prefer.
years
Question 50. What is your gender?
[ ] Female [ ] Male
Question 51. What do you do for a living?
Question 52. What is your highest level of educational attainment?
Question 53. What professional, trade or other job-related training have you had?
Question 54. Do you belong to any nature-based or environmental organisations (e.g. Australian Conservation Foundation, Victorian National Parks Association)?
[ ] Yes [ ] No
Question 55. If you do belong to any nature-based or environmental organisation, which are they?
That is all! Thank you for your time. The research team at Monash University greatly appreciates the time and effort you have given to help us in our research.
The survey can be returned to us in the pre-paid, self-addressed envelope provided or collected at a time that suits you, as arranged with the person who supplied the survey to you.
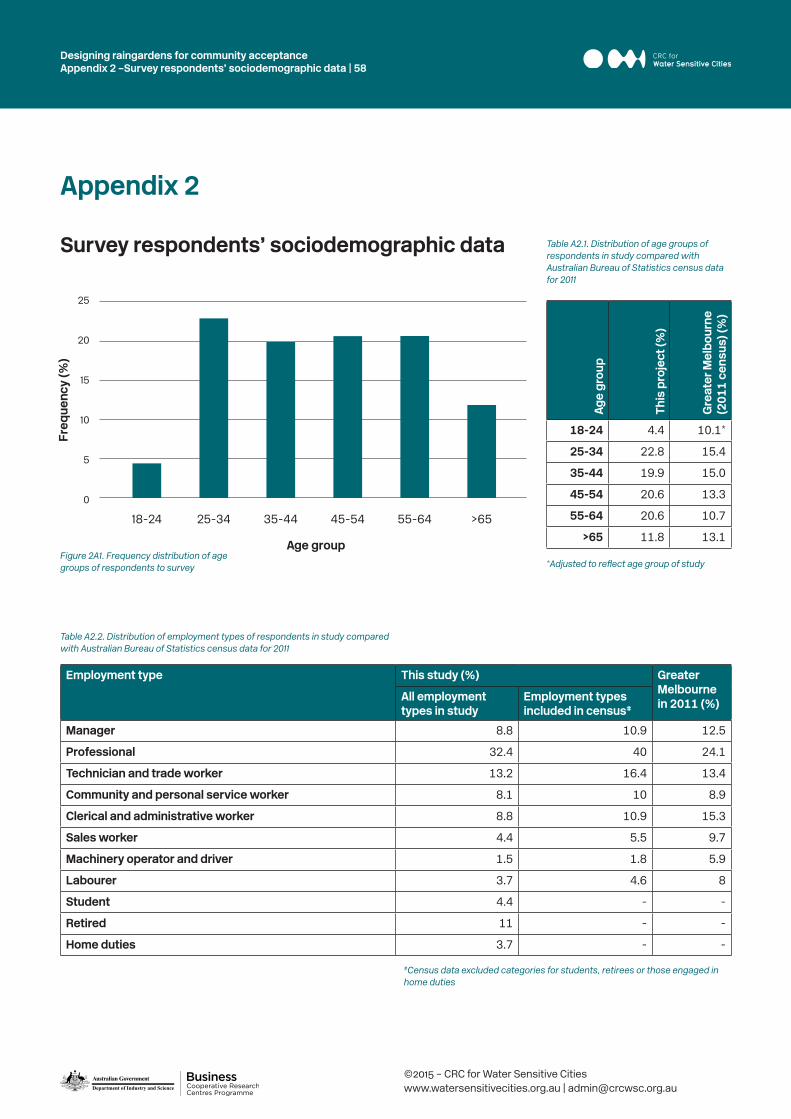
Designing raingardens for community acceptanceAppendix 2 –Survey respondents’ sociodemographic data | 58
©2015 – CRC for Water Sensitive Citieswww.watersensitivecities.org.au | [email protected]
Appendix 2
Survey respondents’ sociodemographic data
Figure 2A1. Frequency distribution of age groups of respondents to survey
Table A2.2. Distribution of employment types of respondents in study compared with Australian Bureau of Statistics census data for 2011
#Census data excluded categories for students, retirees or those engaged in home duties
Table A2.1. Distribution of age groups of respondents in study compared with Australian Bureau of Statistics census data for 2011
*Adjusted to reflect age group of study
Age
grou
p
This
pro
ject
(%)
Gre
ater
Mel
bour
ne
(201
1 ce
nsus
) (%
)
18-24 4.4 10.1*
25-34 22.8 15.4
35-44 19.9 15.0
45-54 20.6 13.3
55-64 20.6 10.7
>65 11.8 13.1
Employment type This study (%) Greater Melbourne in 2011 (%)All employment
types in studyEmployment types included in census#
Manager 8.8 10.9 12.5
Professional 32.4 40 24.1
Technician and trade worker 13.2 16.4 13.4
Community and personal service worker 8.1 10 8.9
Clerical and administrative worker 8.8 10.9 15.3
Sales worker 4.4 5.5 9.7
Machinery operator and driver 1.5 1.8 5.9
Labourer 3.7 4.6 8
Student 4.4 - -
Retired 11 - -
Home duties 3.7 - -
Freq
uenc
y (%
)
25
20
15
10
5
0
18-24 25-34 35-44 45-54 55-64
Age group

Designing raingardens for community acceptance Appendix 2 – Survey respondents’ sociodemographic data | 59
©2015 – CRC for Water Sensitive Citieswww.watersensitivecities.org.au | [email protected]
Table A2.3. Distribution of highest educational level attained by respondents in study compared with Australian Bureau of Statistics census data for 2011
Table A2.4. Distribution of training of respondents in study compared with Australian Bureau of Statistics census data for 2011
*Census data adjusted for minimum age of study participants: 15 in census, 18 in study #Census data excluded Year 12 and below
*Census data excluded data on population without any training.
Highest educational level This study (%) Greater Melbourne in 2011 (%)*Educational levels in
studyEducational levels included in census
Postgraduate degree 9.3 12.9 10.4
Graduate diploma/certificate 6.2 8.6 5.2
Bachelor degree 32.6 45.2 33.3
Advanced diploma/diploma 5.4 7.5 19
Certificate 18.6 25.8 32.2
Year 12 13.2 - -#
Did not complete secondary schooling 14 - -#
Training This study (%) Greater Melbourne in 2011 (%)All training areas in
studyTraining areas included in census*
Natural/physical sciences 4.8 5.3 4.1
Information technology 4 4.4 4.9
Engineering and related technologies 9.5 10.5 17.2
Architecture and building 7.1 7.9 6.1
Agriculture, environmental and related studies 4 4.4 1.6
Health 14.3 15.8 10.4
Education 9.5 10.5 8.6
Management and commerce 23 25.4 23.3
Society and culture 4.8 5.3 13.2
Creative arts 1.6 1.7 5
Food, hospitality and personal services 7.9 8.8 5.8
None 9.5 - -
Figure A2.2. Frequency distribution of period of residency of respondents in own street
Freq
uenc
y (%
)
YearsMonths0-6 7-12 1-2
20
18
16
14
12
10
8
6
4
2
0

[email protected] www.watersensitivecities.org.auLevel 1, 8 Scenic BoulevardMonash UniversityClayton VIC 3800
Cooperative Research Centre for Water Sensitive Cities