designing research studies
TRANSCRIPT

MERC
Getting Started: Hypothesis Driven Research
Larry D. Gruppen, PhD
Development Team: Patricia S. O’Sullivan & Ann W. Frye, Larry Gruppen, Ernie Yoder
Disclosure(s)

Objectives Following completion of this workshop, attendees will be able to discuss:
• How to translate a research question into a hypothesis, and how to develop the null hypothesis
• The steps in hypothesis testing
• Type 1 and Type 2 errors
• α, β, power, sample size, confidence interval, and statistical significance

Types of Research Quick Review
• Qualitative Research
• Correlational Research
• Experimental and Quasi-Experimental Research
• Causal-Comparative Research

Goals of Research Descriptions of groups
Differences between groups
Relationships between groups
Explain relationships between variables
Quantify relationships between variables
Prediction of one variable based upon others
Define cause-effect relationships

Qualitative Research What is the phenomenon?
Use When
Focus on meaning and context
In-depth recording and triangulation
Inductively derived interpretation
Description or experience is key
Methods
Interview
Observation
Think aloud, stimulated recall
Chart review
Surveys

Methods
Surveys
Tests
Chart review
Archived data
All data are confidential
Correlational Research Use When
Predictors can’t be randomized
Subjects &/or treatments not controllable
Control groups not available
Example: predict resident performance on board exam
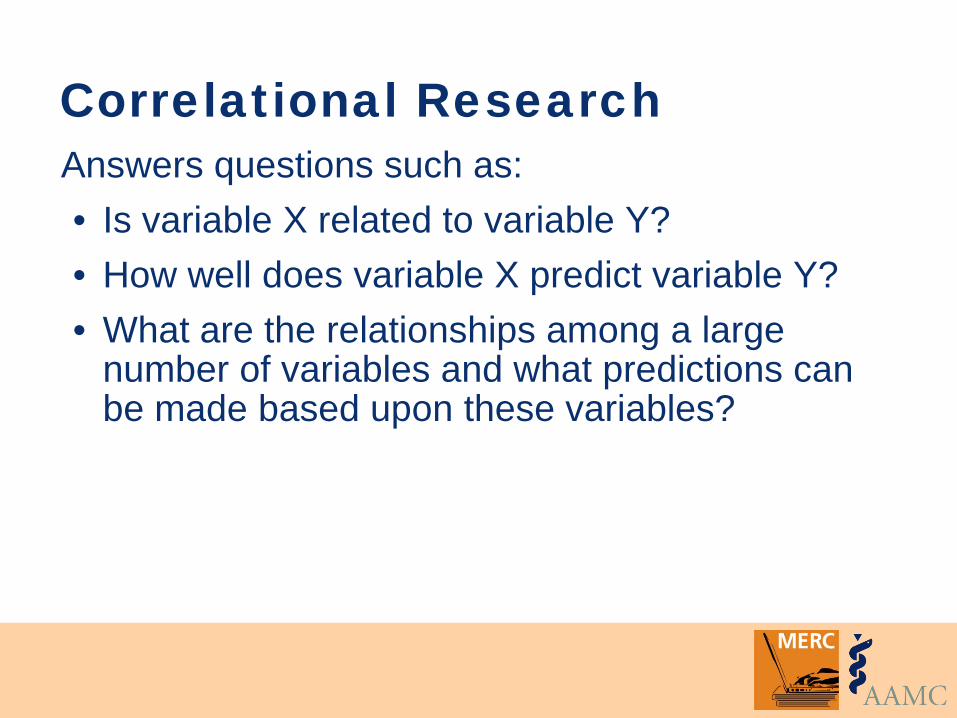
Correlational Research Answers questions such as:
• Is variable X related to variable Y?
• How well does variable X predict variable Y?
• What are the relationships among a large number of variables and what predictions can be made based upon these variables?

Experimental and Quasi-Experimental Research
Use When
Temporal relationship
Feasible explanatory mechanism
No alternative explanation
Subjects and treatments controlled
Methods
Control over treatment and measurement
Randomization
Control Groups
Example: Comparison of learning strategies for reaching competency

Causal-Comparative Focus is determining cause for or consequences of existing differences between groups of people
Can look at levels of exposure, comparing 2 or more groups
Does not give conclusive evidence
Identifies possible causes of variation
Is retrospective in nature

Activity 1: Research Question Please write two or three research questions about phenomena in which you have interest.
We will use these questions later during the workshop

Good Research Question Feasible: adequate subject #, expertise, affordable, manageable in scope
Interesting: to the investigator
Novel: confirm, refute, extend past findings (or new findings)
Ethical
Relevant: to scientific knowledge, clinical & health policy, future research

Hypothesis Testing Steps in hypothesis testing
• State the research question in the form of a hypothesis Ha
• Formulate the null hypothesis H0
• Decide on the α level (risk accepted that H0 is true, but rejected based upon result obtained by chance or due to error) – discussed later
• Determine the statistical test to be applied
Key to selecting and applying appropriate statistical tests
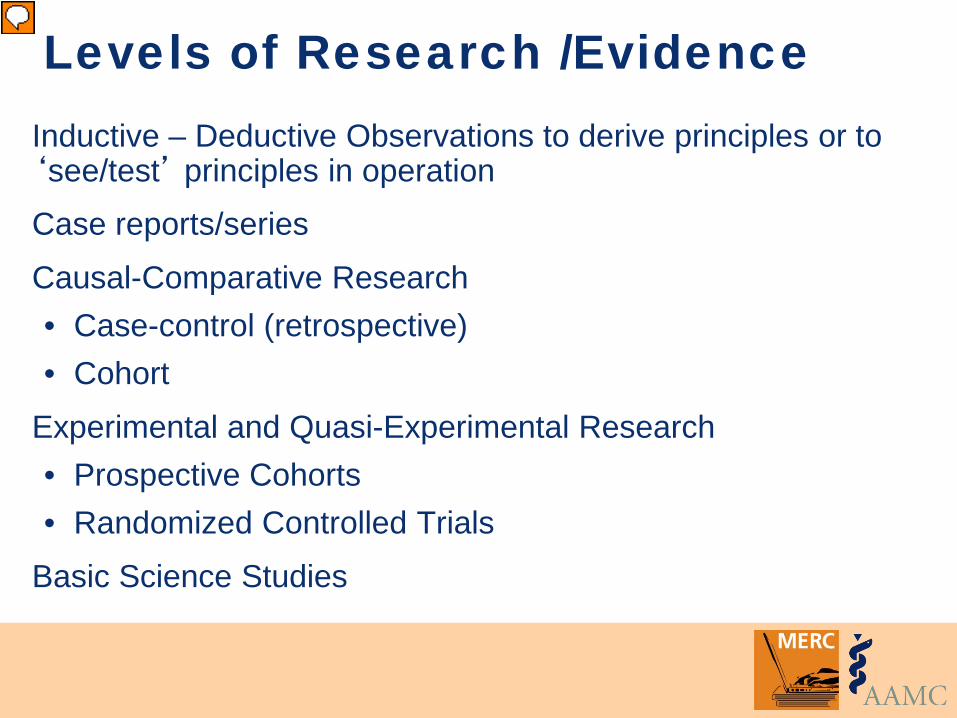
Levels of Research /Evidence Inductive – Deductive Observations to derive principles or to ‘see/test’ principles in operation
Case reports/series
Causal-Comparative Research
• Case-control (retrospective)
• Cohort
Experimental and Quasi-Experimental Research
• Prospective Cohorts
• Randomized Controlled Trials
Basic Science Studies

What is a hypothesis? A statement which:
Purpose:
•Summarizes the elements of the study •The sample •The design •The predictor and outcome variables
establish the basis for tests of significance/ inference (statistics)

Hypotheses Typically derived of a research question
May be stated:
• As the alternative hypothesis
• As the null hypothesis
• Are directional if logic and/or existing studies/data suggest direction of relationships

Hypotheses We are searching for relationships between variables (measurable characteristics of subjects we study)
We can explain, predict, and quantitatively describe relationships, but have difficulty proving causation

Hypothesis A statement about a relationship between variables
Ha: There is a difference between groups or variables
• Women have higher IQs than men
• µf ≠ µm or µf > µm
H0: There is no difference between groups or variables
• No IQ difference between men and women
• µf = µm

Hypotheses Based upon hypotheses, we collect and analyze data in hopes of rejecting the null hypothesis, thus providing evidence supporting the alternative hypothesis… but not proving the alternative hypothesis

Hypotheses Based upon good research question
Simple – one difference or relationship
Specific – clearly stated, defined
Stated in advance – before data collection
• May be stated after data collection, and are labeled “post hoc” or after the fact, in this case

Example: Hypothesis Taylor, ML, et al. (2005). The relationship between the National Board of Medical Examiners’ prototype of the Step 2 Clinical Skills Exam and Interns’ Performance. Academic Medicine, 80:496-501.
“Thus, the purpose of this study is to examine whether performance on the Step 2 CS was associated with future clinical performance as interns (their first year of residency).”

Hypothesis Thus, the purpose of this study is to examine whether performance on the Step 2 CS was associated with future clinical performance as interns (their first year of residency).
NBME Step 2 Clinical Skills examination performance of MS-4 students predicts of future clinical performance as measured by internship residency director’s evaluation form.

Activity 2 Form small groups (4-5 people each)
Each group will translate one of the 4 research questions (on the following 4 slides) into a research hypothesis for testing - Ha
Write your hypothesis on the flip chart or work sheet and be prepared to share with the large group

Activity 2A Hatala, et al. (2006). Assessing the mini-Clinical Evaluation Exercise in comparison to a national specialty examination. Medical Education 40:950-956.
The current study assesses the reliability and validity evidence for the mini-CEX as a clinical competence assessment tool among PG-4 internal medicine residents in comparison to their performance on a high-stakes national internal medicine specialty examination (RCPSC-IM, Canada).

Activity 2B Morgan, PF, & Cleave-Hogg, D. (2002). Comparison between medical students’ experience, confidence, and competence. Medical Education, 36:534-539.
The purpose of this study was to determine whether or not breadth of clinical experience and student levels of confidence were indicators of competency on standardized simulator performance-based assessments.
Activity 2C Papadakis, MA, Arnold, GK, et al. (2008). Performance during Internal Medicine Residency Training and Subsequent Disciplinary Action by State Licensing Boards. Ann Int Med. 148:869-876.
To investigate whether similar predictors of future problems could be found during residency training, we studied a cohort of all physicians who entered internal medicine residency in the United States between 1990 and 2000 and subsequently became diplomates.

Activity 2D Shetty, KD, & Bhattacharya, J. (2007). Changes in Hospital Mortality Associated with Residency Work-Hour Regulations. Ann Int Med. 147:73-80.
We retrospectively analyzed discharge data collected between 2001 and 2004 to determine whether the ACGME regulations were associated with changes in inpatient mortality.
Hypothesis: Activity 3 After sharing hypotheses,
Each group please formulate the null hypothesis H0 for your Ha
What type of research is this?
• Qualitative
• Correlational
• Experimental
• Causal-comparative
Share each null hypothesis and research type Break for 15

Activity 4: Your Research Question Please convert your question into a hypothesis.
Share with the members of your small group
Critique for each other and improve your hypothesis
Sharing with the larger group

Activity 5: Your Hypothesis Develop the null version of your hypothesis
Share

Hypothesis Testing Select the sample
Collect the data from the sample
Calculate the appropriate sample statistic
Reject or fail to reject H0 (statistical significance)
Clinical/biological/educational significance!
What is statistical significance? What does it mean? Compared to educational significance?

Common errors Type 1: Rejecting a Null Hypothesis which is true in the population
• Probability labeled as α
Type 2: Failing to reject a false Null Hypothesis
• Probability labeled as β
• May be a problem of small sample size or seeking an excessively large effect size (difficult or impossible to achieve)

Statistical Significance Guides likelihood that result is by chance alone or due to error
Provides no information on adequacy of the study
Does not address biological, clinical, or educational significance
Three Key Statistical Questions Is an observed effect real or should it be attributed to chance, error, or extraneous (unknown/unmeasured) factors?
If the effect is real, how large is it?
Is the effect large enough to be useful?

Power Analysis Quality control for research studies and statistical analyses: the ability of the study, as designed, to detect significance
Should be a part of every study, either before or after it is done (before is best)
The interaction of 4 study aspects
• Alpha α
• Power 1- β
• Effect size (relevance/importance)
• Sample size

α-level The level of chance the researcher is willing to take that the study results are a chance occurrence
The probability that one will accept that the Null Hypothesis is actually true, while rejected aka: type one error, falsely rejecting the null
Usually set at .01 or .05, probability of finding a relationship that does not exist
Use low value when effects are important – medical care vs. teaching methods

β-level The probability of making a Type 2 error – failing to reject a null hypothesis which is actually false in the population
Related to power calculation
Use small value when very important to avoid at type 2 error – e.g. reassure regarding risk of exposure (eg. consequences of chemotherapy or not making a diagnosis)
Power 1 - β (probability of rejecting H0 when H0 is actually false)
β is the probability of a type II error, failing to reject the false null hypothesis
Represents the ability to detect a difference in a measured variable between groups or to detect an association between variables
Typically β = 0.20, Power = 1 – 0.20 = 0.80. Varies inversely with α
Set at β=.2, investigator is willing to accept a 20% chance of missing an association given the effect size

Maximize Power The probability that the test will lead to the correct rejection of the null hypothesis, that a relationship exists
• Meaningful intervention
• Appropriately large sample size
• Limit number of variables in the study
Effect Size The likelihood that a study will be able to detect an association between a predictor and an outcome depends on the actual magnitude of that association
The likelihood that a study will be able to detect a difference between two groups (treatment and non-) depends upon the magnitude of that difference
Theory or literature driven

Effect Size The investigator does not actually know at the outset the magnitude of association or difference
The investigator must choose the size of the association or difference which she would like to detect
What would be clinically/educationally significant?

Effect Sizes For 2 sample t-Test, difference between two means as a proportion of the pooled standard deviation
R2 for ANOVA and Mult Regression, proportion of total variance accounted for
NNT: in therapy for dichotomous outcomes, number needed to treat to observe the outcome of interest
OR: comparison of the probability of an event in 2 groups

p-value (significance) Statistically the probability that results are a chance occurrence. The probability of observing a result at least as extreme or as big as that in this study by chance alone. Calculated by the computer. Problematic for small samples.
Correlations may reach statistical significance – but key is clinical or educational (p-value is less important)

Statistical Significance - P P-value provides evidence against the null hypothesis
If we did 100 studies, 5 would give this result by chance
Does not mean:
• Probability is 5% that the null is true
• Probability is 95% that the null is false

Statistical Significance is not everything! With large samples, very small changes or correlations may reach statistical significance, but are clinically irrelevant
With small samples, important changes or correlations may not reach statistical significance, but may be very meaningful
In education, makes you kind of wonder about setting p at .10 rather than .05

Estimating sample size Utilize computer application or nomogram
• Number of variables
• Types of variable values
• Power (1-β)
• Type 1 error α
• Effect size estimate

Hypothesis (Taylor) Thus, the purpose of this study is to examine whether performance on the Step 2 CS was associated with future clinical performance as interns (their first year of residency).
NBME Step 2 Clinical Skills examination performance of MS-4 students predicts of future clinical performance as measured by internship residency director’s evaluation form.

Taylor study • Alpha α
• Power 1- β
• Effect size
• Sample size
.05
.20
Depends upon instrument/scoring*
See your local statistician
* MUSC Program Director Evaluation Form results in a score for each intern. The score range is 0-100. Quartiles have been statistically defined 1=76-100; 2=51-75; 3=26-50; 4=0-25.

Exercise 6 For your study:
• Alpha level
• Beta level
• What would be a relevant/important effect size or difference between groups?
• Share an example or 2

Confidence Interval For point estimates such as population mean, RR, OR, correlation coefficient, sensitivity, specificity, PPV, NPV
95% is point estimate ± 2 S.E.
For similar studies of same sample size, at least 95/100 point estimates will occur in this interval
The narrower the interval the greater our confidence

Confidence Interval Describes the precision of the statistic or value
Reflects degree of uncertainty in the data
The smaller the sample, the lower the precision
If study performed 100 times, result will fall within this range at least 95 times

Activity 7 For your hypothesis, would confidence interval be an appropriate statistic to calculate?

Your hypothesis NEXT STEPS:
• What type of research or research design would you use to test your hypothesis?
• What statistical test would be utilized?

And Should I Mention?? You should consult with a statistician while you are conceptualizing the study!

Questions?