designing the green supply chain
DESCRIPTION
Designing the Green Supply Chain( logistics)TRANSCRIPT
Designing theGreen Supply Chain
Benita M. BeamonUniversity of Washington
Industrial EngineeringBox 352650
Seattle, WA 98195-2650Phone: (206) 543-2308Fax: (206) 685-3072
Logistics Information Management (1999)Vol. 12, No. 4, pp. 332-342
Abstract
The supply chain has been traditionally defined as a one-way, integrated manufacturingprocess wherein raw materials are converted into final products, then delivered tocustomers. Under this definition, the supply chain includes only those activitiesassociated with manufacturing, from raw material acquisition to final product delivery.However, due to recent changing environmental requirements affecting manufacturingoperations, increasing attention is given to developing environmental management (EM)strategies for the supply chain. This research: (1) investigates the environmental factorsleading to the development of an extended environmental supply chain, (2) describes theelemental differences between the extended supply chain and the traditional supply chain,(3) describes the additional challenges presented by the extension, (4) presentsperformance measures appropriate for the extended supply chain, and (5) develops ageneral procedure towards achieving and maintaining the green supply chain.
Keywords
supply chain, logistics, environment, environmental management
2
1 Introduction
Years ago, the concept of environmental quality was almost non-existent in the United States.Then, the concept came to mean cleaner air and cleaner water. Now, environmental quality hascome to mean ��safe drinking water, healthy ecosystems, safe food, toxic-free communities,safe waste management, and the restoration of contaminated sites (Council on EnvironmentalQuality, 1996).� Concurrently, there has been increasing public attention placed on the overallcondition of the natural environment. This attention may be largely attributed to informationprovided by the media, through growing numbers of environmental and consumer interestgroups (Fiksel, 1996). The most commonly perceived enemy to environmental protection ismanufacturing and production operations. That is, manufacturing and production processes areviewed as the culprits in harming the environment, in the forms of waste generation, ecosystemdisruption, and depletion of natural resources (Fiksel, 1996). Indeed, waste generation andnatural resource use, primarily attributed to manufacturing, contribute to environmentaldegradation by outstripping the earth�s ability to compensate and recover, and thus are notsustainable by the earth�s ecosystem.
The current state and trend of environmental degradation (from regulatory, consumer, and moralstandpoints) indicate a need for a change in manufacturing philosophy. That is, there must be afundamental shift in the way production systems operate. There must be a move towardssustainability, achieved through vast reductions in resource use and waste generation, and amove away from one-time use and product disposal. The first step in such a move is to extendthe structure of the current one-way supply chain to a closed loop, including supply chainoperations designed for end-of-life product and packaging recovery, collection, and re-use (in theforms of recycling and/or remanufacturing). The objectives of this research are to: (1) describethe current state of the natural environment, (2) investigate the environmental factors leading tothe development of an extended environmental supply chain, (3) describe the additionalchallenges presented by the extension, (4) present performance measures appropriate for theextended supply chain, and (5) develop a general procedure towards achieving and maintainingthe green supply chain.
2 The State of the Environment
2.1 Solid and Hazardous Waste
The amount of solid waste generated in the United States has been growing steadily over the past30 years and is expected to continue to grow (Council on Environmental Quality, 1996).According to the United States Environmental Protection Agency (EPA), approximately 12billion tons of industrial waste (and approximately 208 million tons of municipal waste) isgenerated every year in the United States. Over 4 billion tons of the total waste generated ishazardous waste, and is increasing at a rate of 10% annually (Environmental Protection AgencyOffice of Solid Waste, no date, and Fiksel, 1996). This translates into approximately 10 poundsof total waste per person per day (approximately 4.3 pounds of municipal waste per day).Although disposal fees vary by region, the national average waste disposal fee has increased
3
dramatically during the span of 1985 to 1995, rising from $8.20 per ton in 1985 to $32.19 per tonin 1995 (Council on Environmental Quality, 1996). These costs are largely a result of the factthat, according to EPA estimates for municipal solid waste, only 56 million tons (27%) wasrecovered by recycling or composting and 33.5 million tons (16%) was incinerated, while 118.5million tons (57%) was landfilled (Environmental Protection Agency Office of Solid Waste, nodate).
2.2 Natural Resource Use
The United States extracts an increasing amount of material from United States lands andterritories annually, currently in excess of ten tons of material per person (United StatesCongress Office of Technology Assessment, 1992). In fact, material consumption has increasedby a factor of four since the turn of the century (while population has increased by a factor ofthree during the same period) (United States Congress Office of Technology Assessment, 1992).During this time, the largest increases in natural resource extraction were derived from miningoperations (metals and non-metallic ores) and from organics (plastics, and petrochemicals)(United States Congress Office of Technology Assessment, 1992). Additionally, the types ofresources extracted have shifted from agricultural and forestry resources in the early 1900�s tomining and organics today (United States Congress Office of Technology Assessment, 1992). Itis important to note here that modern product designs are generally more efficient (requiringmuch less material to produce) and result in products that are lighter in weight; however, thesemodern products are also highly complex, making them generally more difficult to repair,recycle and/or remanufacture.
2.3 Water and Air Pollution
WaterAlthough the rivers, lakes, and coastal waters of the United States are cleaner today than theywere in the early 1970�s, water pollution is still a very real concern. For example (Council onEnvironmental Quality, 1996):
∑ Nearly 40% of all U.S. waters are still too polluted to support all of their designatedfunctions.
∑ Contaminated fish advisories or bans were issued in 1995 for over 1,700 bodies of water(representing a 14% increase over the previous year) to protect the public from eatingcontaminated fish.
∑ More than 4,000 beaches were closed in 1995 due to harmful levels of bacteria and otherpollutants.
∑ Approximately 20% of the population receive water from a facility that is in violation ofat least one national safety requirement.
4
AirSimilar to water quality, air quality in the United States has undergone considerableimprovement in recent years. However, also similar to air quality, some troubling facts stillremain:
∑ In excess of 2/3 of the global urban population (primarily in developing countries)breathes air that has unhealthy particulate levels at least part of the year (Percival, et. al.,1992).
∑ It has been estimated that air particulate levels in the United States are responsible forapproximately three percent of all deaths in the U.S. (corresponding to 60,000 deaths peryear) (Percival, et. al., 1992).
∑ In November of 1993, the EPA designated 42 U.S. areas as non-attainment areas forcarbon monoxide (41 of which were classified as moderate; Los Angeles was classifiedas serious) (Council on Environmental Quality, 1993).
∑ Approximately 59 million people in the U.S. live in counties in which pollution levelsfailed to meet at least one air quality standard in 1993 (Council on EnvironmentalQuality, 1993).
3 Environmental Policy
3.1 Public Pressure
In the United States of America, an estimated 75% of consumers claim that their purchasingdecisions are influenced by a company�s environmental reputation, and 80% would be willing topay more for environmentally friendly goods (Lamming and Hampson, 1996). On a worldwidelevel, a recent 22-country survey of environmental attitudes found that (Elkington, 1994):
∑ In half of the countries surveyed, the environment was considered one of the three mostserious problems.
∑ In most countries, the majority of the citizens surveyed said that the state of theenvironment affects their health, and an even greater majority say that the environmentaffects the health of their children.
∑ In 16 of the 22 countries, citizens said that they avoid products that are harmful to theenvironment.
Thus, in the USA, and worldwide, there is an overall awareness of the worsening state of theenvironment, as well as a desire to reverse that trend, even if it costs more to do so.
5
3.2 Environmental Legislation
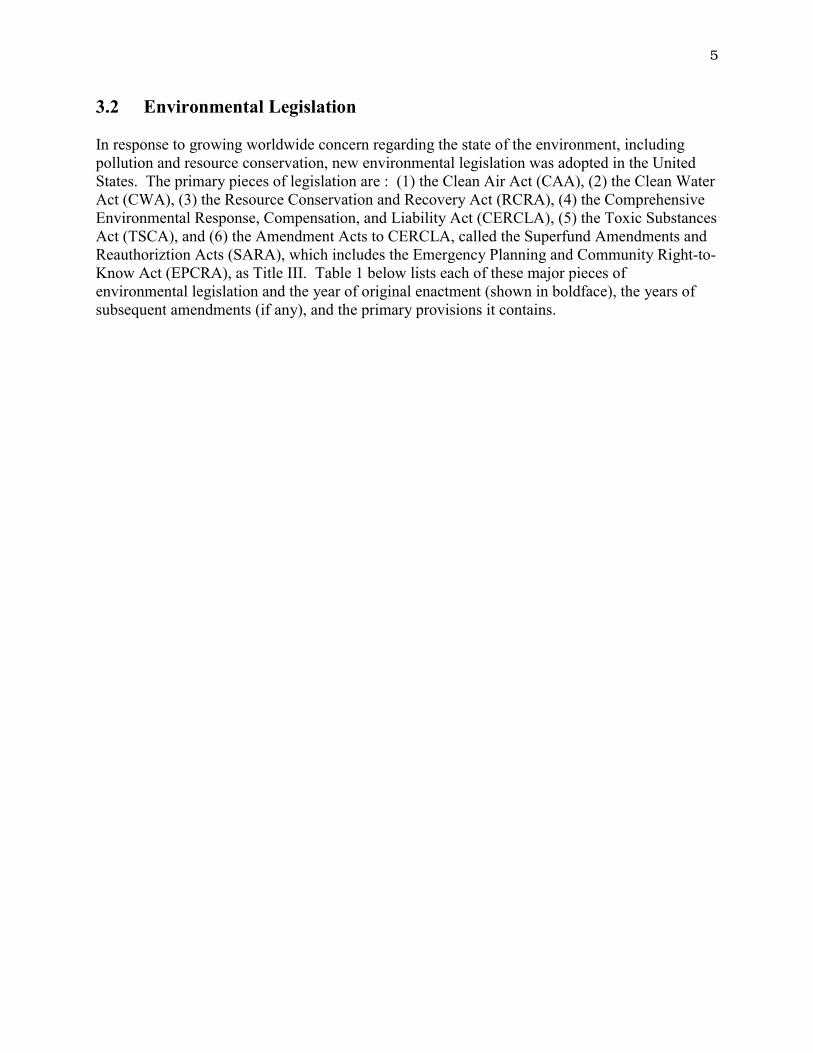
In response to growing worldwide concern regarding the state of the environment, includingpollution and resource conservation, new environmental legislation was adopted in the UnitedStates. The primary pieces of legislation are : (1) the Clean Air Act (CAA), (2) the Clean WaterAct (CWA), (3) the Resource Conservation and Recovery Act (RCRA), (4) the ComprehensiveEnvironmental Response, Compensation, and Liability Act (CERCLA), (5) the Toxic SubstancesAct (TSCA), and (6) the Amendment Acts to CERCLA, called the Superfund Amendments andReauthoriztion Acts (SARA), which includes the Emergency Planning and Community Right-to-Know Act (EPCRA), as Title III. Table 1 below lists each of these major pieces ofenvironmental legislation and the year of original enactment (shown in boldface), the years ofsubsequent amendments (if any), and the primary provisions it contains.
6
ActYear of
Enactment,Amendments
Primary Provisions
CAA 1967, 1970,1977, 1990
National Ambient Air Quality Standards (NAAQSs)
Hazardous Air Pollution Standards
Motor Vehicle Emissions Standards
Fuel and Fuel Additive Standards
Aircraft Emission Standards
Ozone Protection Provisions
CWA 1972, 1977,1981, 1987
Regulation of wastewater discharges from manufacturing facilities
Provisions for federal aid for municipal sewage treatment systems
Identification and permit requirements for non-point discharges
RCRA 1976, 1984 Regulation of generation, storage, transportation, treatment, disposal, and storage of hazardous waste
Ban on landfilling untreated hazardous waste
Ban on burning hazardous waste for energy recovery
CERCLA(�Superfund�)
1980 Provisions for federal funding to clean up sites contaminated from prior unregulated disposal
TSCA 1976 Provisions for testing, regulating and screening all substances produced or imported to the UnitedStates prior to use
Provisions for banning and reporting any chemical substance posing unreasonable risk to health or tothe environment
SARA 1986 Provisions for increased pace of cleanup
Provisions for increased public participation
Provisions for more stringent and better defined cleanup standards
EPCRA(SARA, Title III)
1986 Provisions requiring companies to report the release and storage of specified chemicals and chemicalcompounds above certain threshold limits (called �release reporting�)
Provisions allowing public access to release reports, including chemicals used, and the amount andnature of the releases to the environment
Table 1. Environmental Regulations
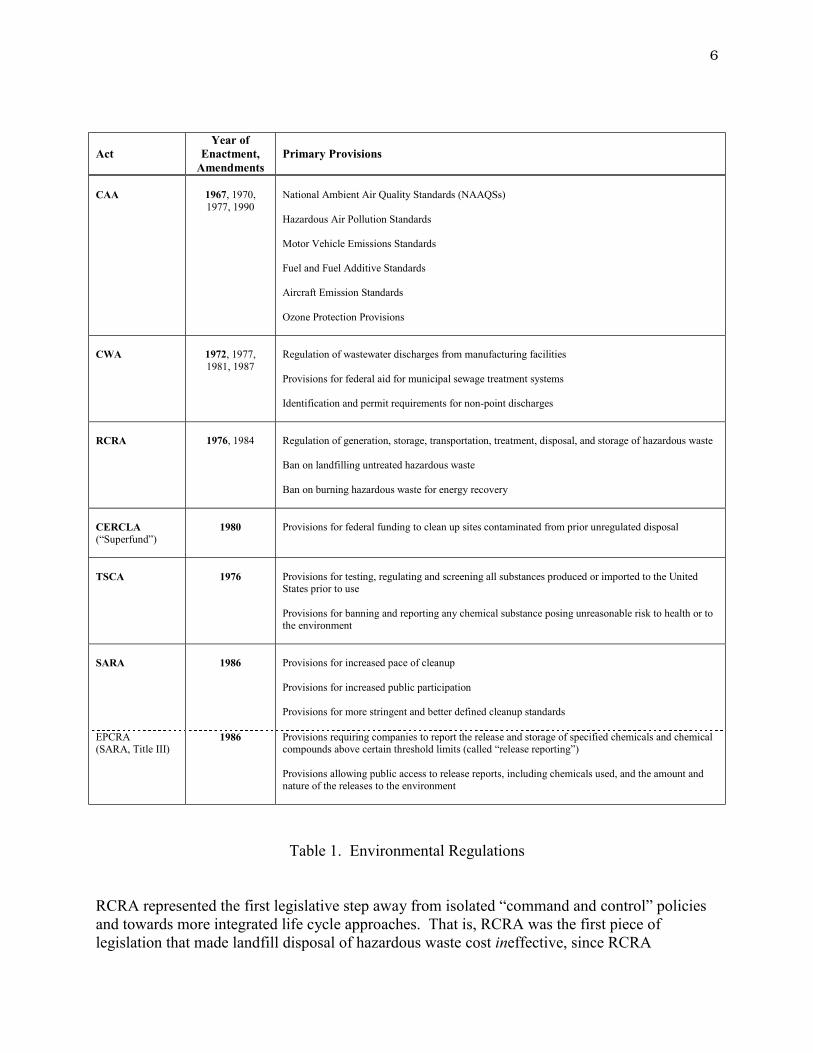
RCRA represented the first legislative step away from isolated �command and control� policiesand towards more integrated life cycle approaches. That is, RCRA was the first piece oflegislation that made landfill disposal of hazardous waste cost ineffective, since RCRA
7
established that although the short-term cost of hazardous waste landfill disposal may be small,the long-term environmental cost of such a move is far greater. In fact, the current philosophy ofpollution and waste reduction and resource follows this model; environmental management ismoving away from risk management and pollution prevention, and towards life cyclemanagement and industrial ecology, as shown below in Table 2.
Stage of Environmental Policy Primary Characteristic(s) Year(s)Risk Management Waste management and pollution
control.1970�s -mid 1980�s
Pollution Prevention Process improvement to reducematerial use, minimize waste, andimprove efficiency.
mid 1980�s -early 1990�s
Life Cycle Management andIndustrial Ecology
Systematic product and processmanagement to maximize profitabilityand ensure environmental quality.
Focus on life cycle environmentaleffects of processes and products.
mid 1990�s - ?
Table 2. Evolution of Environmental Management
3.3 Environmental Management Standards (ISO 14000 Series)
In response to more stringent environmental regulations and changes in environmentalmanagement philosophy, there has been a corresponding need to develop operational guidelinesand standards to assist organizations in moving towards ecologically sustainable businesspractices. The ISO 14000 series standard is designed to address these needs.
Objectives and Structure
Recently, the International Organization for Standards (ISO) adopted ISO 14000 Series as itsinternational specification standard for environmental management systems, with the objectivesof (Alexander, 1996 and Pratt, 1997):
1. Encouraging an internationally common approach to environmental management.
2. Strengthening companies� abilities to improve and measure environmental performance,through continual system audits.
3. Improving international trade and removing trade barriers.
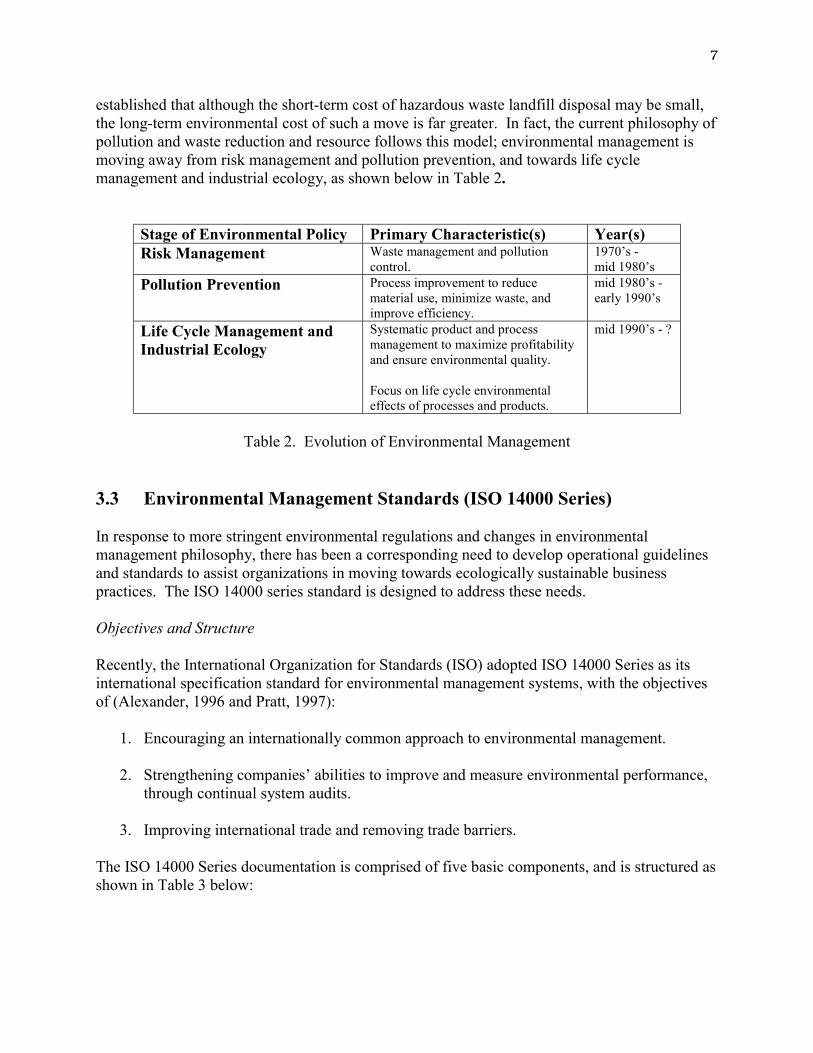
The ISO 14000 Series documentation is comprised of five basic components, and is structured asshown in Table 3 below:
8
ISO 14001 Specifies minimum requirements for achieving ISO 14000 Certification.ISO 14004 Sets guidelines for developing an environmental management (EM) system.ISO 14010 Establishes the general principles of environmental auditing.ISO 14011 Establishes auditing procedures for the auditing of EM systems.ISO 14012 Establishes qualification criteria for environmental auditors.
Table 3. The ISO 14000 Series(source: (International Organization for Standardization, 1996))
Primary Requirements
ISO 14000 addresses these three objectives by requiring that organizations develop (Pratt, 1997and Sarkis, et. al., 1995):
1. An advance environmental impact analysis of all new activities, products, and processes.
2. A continuous environmental impact assessment of current activities, products, andprocess.
3. Standards and objectives, that include policies for pollution prevention and wasteminimization, that are defined for and continuously improved at every organizationallevel.
4. Numerical targets and monitoring procedures for each identified objective.
5. Procedures to be followed in the event of non-compliance with established environmentalpolicies, and in cases of accidental discharge.
6. Procedures to ensure that suppliers and contractors working within or associated withorganizational facilities apply environmental standards equivalent to organizationalstandards.
Thus, ISO 14000 is indicative of the recent shift in environmental philosophy; ISO 14000focuses on procedures and systems, and says nothing of discharge standards, limits, or testmethods (Pratt, 1997).
4 The Supply Chain Re-Defined
The new environmental era represents a new challenge to manufacturing and productionenterprises worldwide. The challenge is to develop ways in which industrial development andenvironmental protection can symbiotically coexist. The first step in meeting this challenge is tore-define the basic structure of the entire supply chain, by accommodating environmentalconcerns associated with waste and resource use minimization.
9
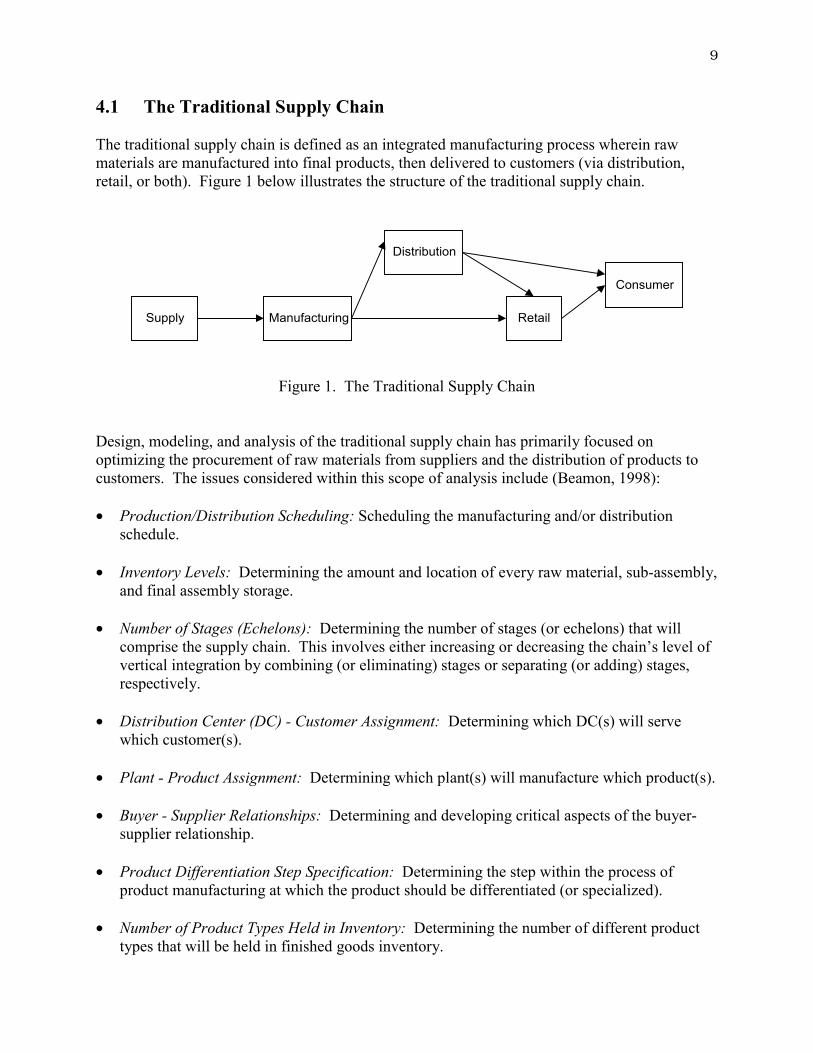
4.1 The Traditional Supply Chain
The traditional supply chain is defined as an integrated manufacturing process wherein rawmaterials are manufactured into final products, then delivered to customers (via distribution,retail, or both). Figure 1 below illustrates the structure of the traditional supply chain.
Supply Manufacturing
Distribution
Retail
Consumer
Figure 1. The Traditional Supply Chain
Design, modeling, and analysis of the traditional supply chain has primarily focused onoptimizing the procurement of raw materials from suppliers and the distribution of products tocustomers. The issues considered within this scope of analysis include (Beamon, 1998):
• Production/Distribution Scheduling: Scheduling the manufacturing and/or distributionschedule.
• Inventory Levels: Determining the amount and location of every raw material, sub-assembly,and final assembly storage.
• Number of Stages (Echelons): Determining the number of stages (or echelons) that willcomprise the supply chain. This involves either increasing or decreasing the chain�s level ofvertical integration by combining (or eliminating) stages or separating (or adding) stages,respectively.
• Distribution Center (DC) - Customer Assignment: Determining which DC(s) will servewhich customer(s).
• Plant - Product Assignment: Determining which plant(s) will manufacture which product(s).
• Buyer - Supplier Relationships: Determining and developing critical aspects of the buyer-supplier relationship.
• Product Differentiation Step Specification: Determining the step within the process ofproduct manufacturing at which the product should be differentiated (or specialized).
• Number of Product Types Held in Inventory: Determining the number of different producttypes that will be held in finished goods inventory.
10
4.2 The Extended Supply Chain
The ultimate objective of extending the traditional supply chain is to allow consideration of thetotal immediate and eventual environmental effects of all products and processes (known asproduct and process stewardship, respectively). The stewardship concept is based on therecognition that the environmental effects of an organization include the environmental impactsof goods and processes from the extraction of raw materials, to the use of goods produced, to thefinal disposal of those goods (Lamming and Hampson, 1996).
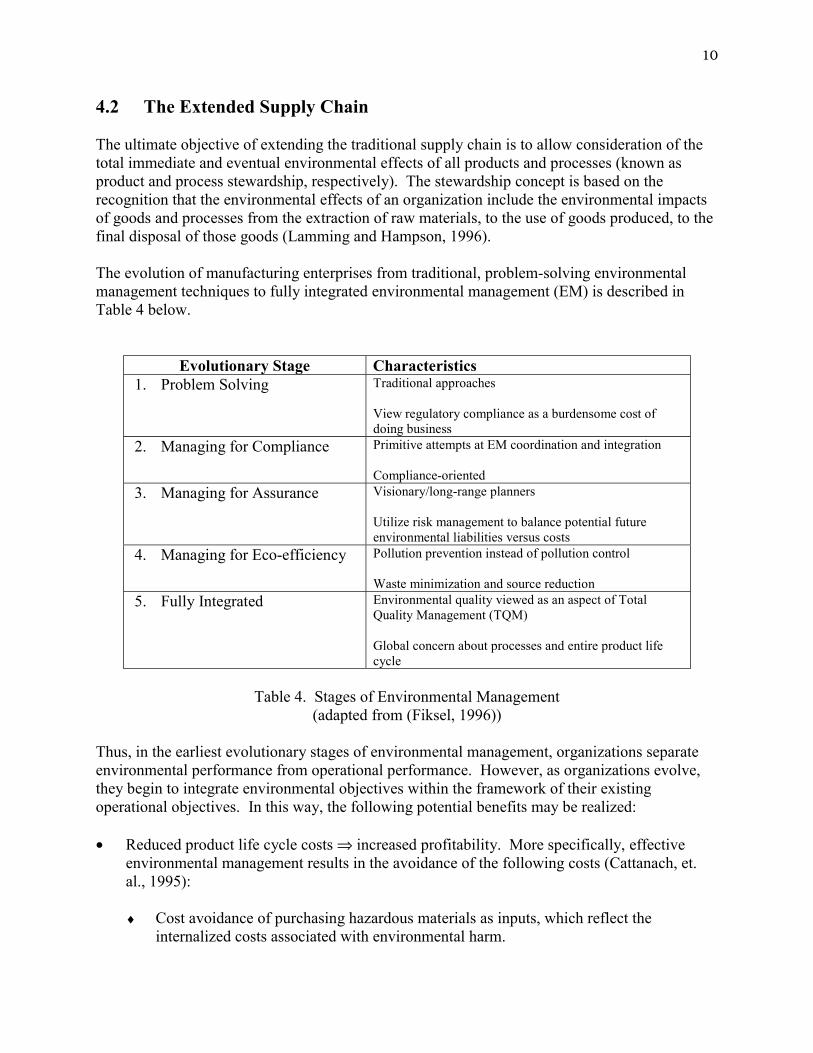
The evolution of manufacturing enterprises from traditional, problem-solving environmentalmanagement techniques to fully integrated environmental management (EM) is described inTable 4 below.
Evolutionary Stage Characteristics1. Problem Solving Traditional approaches
View regulatory compliance as a burdensome cost ofdoing business
2. Managing for Compliance Primitive attempts at EM coordination and integration
Compliance-oriented3. Managing for Assurance Visionary/long-range planners
Utilize risk management to balance potential futureenvironmental liabilities versus costs
4. Managing for Eco-efficiency Pollution prevention instead of pollution control
Waste minimization and source reduction5. Fully Integrated Environmental quality viewed as an aspect of Total
Quality Management (TQM)
Global concern about processes and entire product lifecycle
Table 4. Stages of Environmental Management(adapted from (Fiksel, 1996))
Thus, in the earliest evolutionary stages of environmental management, organizations separateenvironmental performance from operational performance. However, as organizations evolve,they begin to integrate environmental objectives within the framework of their existingoperational objectives. In this way, the following potential benefits may be realized:
• Reduced product life cycle costs ⇒ increased profitability. More specifically, effectiveenvironmental management results in the avoidance of the following costs (Cattanach, et.al., 1995):
♦ Cost avoidance of purchasing hazardous materials as inputs, which reflect theinternalized costs associated with environmental harm.
11
♦ Cost avoidance of storing, managing, and disposing process waste, particularly as wastedisposal becomes increasingly expensive.
♦ Cost avoidance of stigmatization or market resistance to environmentally harmfulproducts.
♦ Cost avoidance of public and regulatory hostility towards environmentally harmfulorganizations.
• Reduced environmental and health risks ⇒ reduced liability risks (Cattanach, et. al., 1995and Zhang, et. al., 1997).
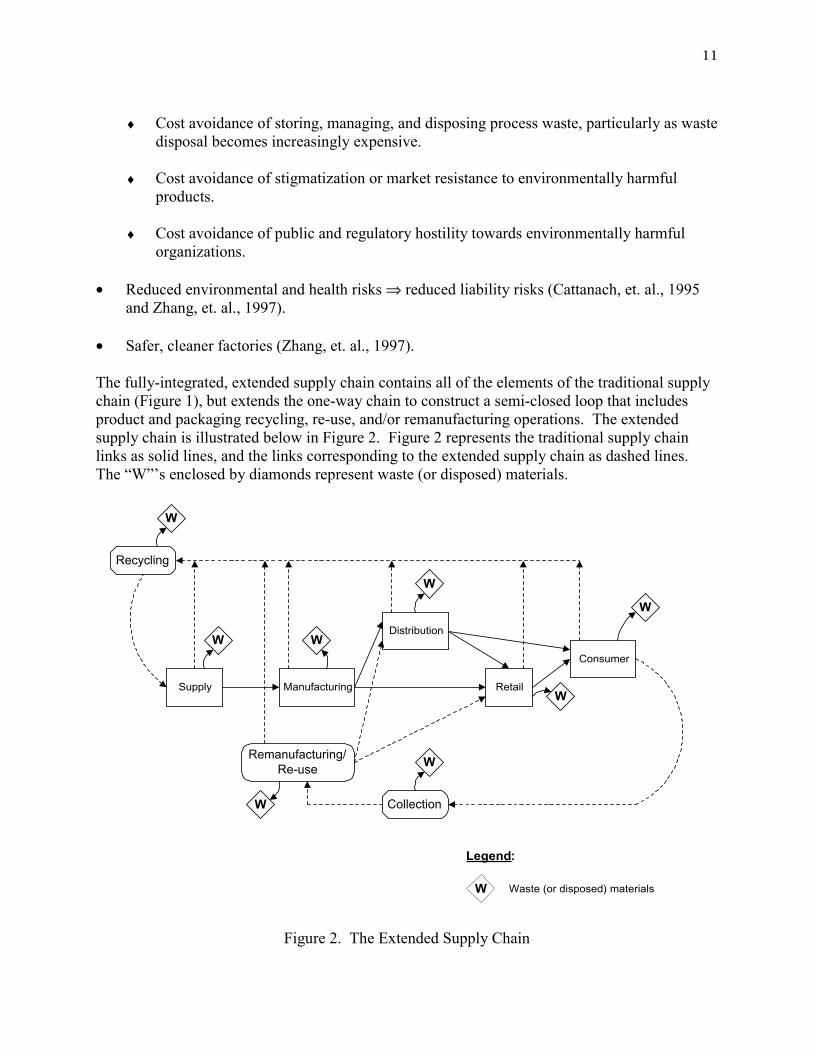
• Safer, cleaner factories (Zhang, et. al., 1997).
The fully-integrated, extended supply chain contains all of the elements of the traditional supplychain (Figure 1), but extends the one-way chain to construct a semi-closed loop that includesproduct and packaging recycling, re-use, and/or remanufacturing operations. The extendedsupply chain is illustrated below in Figure 2. Figure 2 represents the traditional supply chainlinks as solid lines, and the links corresponding to the extended supply chain as dashed lines.The �W��s enclosed by diamonds represent waste (or disposed) materials.
Supply Manufacturing
Distribution
Retail
Consumer
W W
W
Recycling
W
Legend:
W Waste (or disposed) materials
W Collection
Remanufacturing/Re-use
W
W
W
Figure 2. The Extended Supply Chain
12
4.2.1 Recycling and Re-use
Recycling is the process of collecting used products, components, and/or materials from thefield, disassembling them (when necessary), separating them into categories of like materials(e.g., specific plastic types, glass, etc.), and processed into recycled products, components,and/or materials. In this case, the identity and functionality of the original materials are lost.(Thierry, et. al., 1995). The success of recycling depends on: (1) whether or not there is amarket for the recycled materials, and (2) the quality of the recycled materials (since mostrecycling processes actually reduce the value of the material from its original value, as thematerial itself has degraded). Re-use is the process of collecting used materials, products, orcomponents from the field, and distributing or selling them as used. Thus, although the ultimatevalue of the product is also reduced from its original value, no additional processing is required.
4.2.2 Remanufacturing
The process of remanufacturing consists of collecting a used product or component from thefield, assessing its condition, and replacing worn, broken, or obsolete parts with new orrefurbished parts. In this case, the identity and functionality of the original product is retained.The resulting (remanufactured) product is then inspected and tested, with the goal of meeting orexceeding the quality standards of brand new products. Thus, in some cases, the remanufacturedproduct can exceed the original product in quality and/or function. This is due to the fact thatduring the remanufacturing process, the design of the replaced parts and/or components mayhave been improved since the original product was manufactured. The unique advantage ofremanufacturing is that, unlike recycling and re-use, the process of remanufacturing does notdegrade the overall value of the materials used.
4.3 The Extended Supply Chain: Operational and Strategic Issues
Extending the supply chain to include recovery operations, such as remanufacturing, recycling,and re-use adds an additional level of complexity to supply chain design, and a new set ofpotential operational and strategic considerations. These new considerations arise from twobasic problems: (1) uncertainty associated with the replacement/recovery process (in timerequirements, quality, and quantity of returned products, packaging, and/or containers), and (2)the reverse distribution process itself (collection and transportation of used products, packaging,and/or containers).
Examples of operational and strategic issues associated with recoverable product systems are:
∑ Inventory control policies (including lot-sizing, scheduling, and safety stocks) given highlyuncertain timing, quality, and quantities of replenishments (Guide, et. al., 1997a, Guide, et.al., 1997b, Haynsworth and Lyons, 1987, and Perry, 1991).
∑ Impact of uncontrollable recovery processes on inventory composition, production planning,and scheduling (i.e., the demand and recovery processes are not perfectly correlated,potentially resulting in uncontrolled growth of unwanted parts and non-availability of criticalparts) (Van der Laan, et. al., 1996a and Van der Laan, et. al., 1996b).
13
∑ Disassembly planning (including scheduling, sequencing, and disassemblability analysis) formaterial recovery (Gupta and Taleb, 1994 and Johnson and Wang, 1995).
∑ The number and location of collection/recovery facilities.
∑ Collection procedures and customer incentive systems for retrieval operations.
∑ Effects of traditional supply chain strategies (e.g., decentralized versus centralized businessfunctions, facility location, purchasing strategies) on environmental performance (e.g.,energy use, solid waste, pollution, product recovery).
∑ Simultaneous operational/environmental supply chain optimization; merging environmentaland operational goals into traditional analysis.
∑ Level and location of buffer inventories must be considered on both sides of the extendedsupply chain (forward and reverse) (Fleishmann, et. al., 1997).
∑ New criteria for vendor selection and certification.
5 Performance Evaluation
An important component in supply chain design and analysis is the establishment of appropriateperformance measures. A performance measure, or a set of performance measures, is used todetermine the efficiency and/or effectiveness of an existing system, or to compare competingalternative systems. Performance measures are also used to design proposed systems, bydetermining the values of the decision variables that yield the most desirable level(s) ofperformance.
5.1 Traditional Supply Chain Performance Measures
Available literature regarding traditional supply chain systems identifies a number ofperformance measures as important in the evaluation of supply chain effectiveness andefficiency. These measures are typically concerned with: (1) customer satisfaction, service, orresponsiveness or (2) cost. The interested reader is referred to Beamon (1996) and Beamon(1998) for a discussion of these measures.
5.2 Performance Measures for the Extended Supply Chain
Although a number of performance measures appropriate for traditional supply chains have beendeveloped, these existing measures are inadequate for use in the extended chain. The existingmeasures are inadequate in capturing the dual extended supply chain objectives of economicefficiency and environmental protection. This identifies a need to develop new, more inclusive,measures to describe supply chain performance. ISO 14000 identifies the need for these
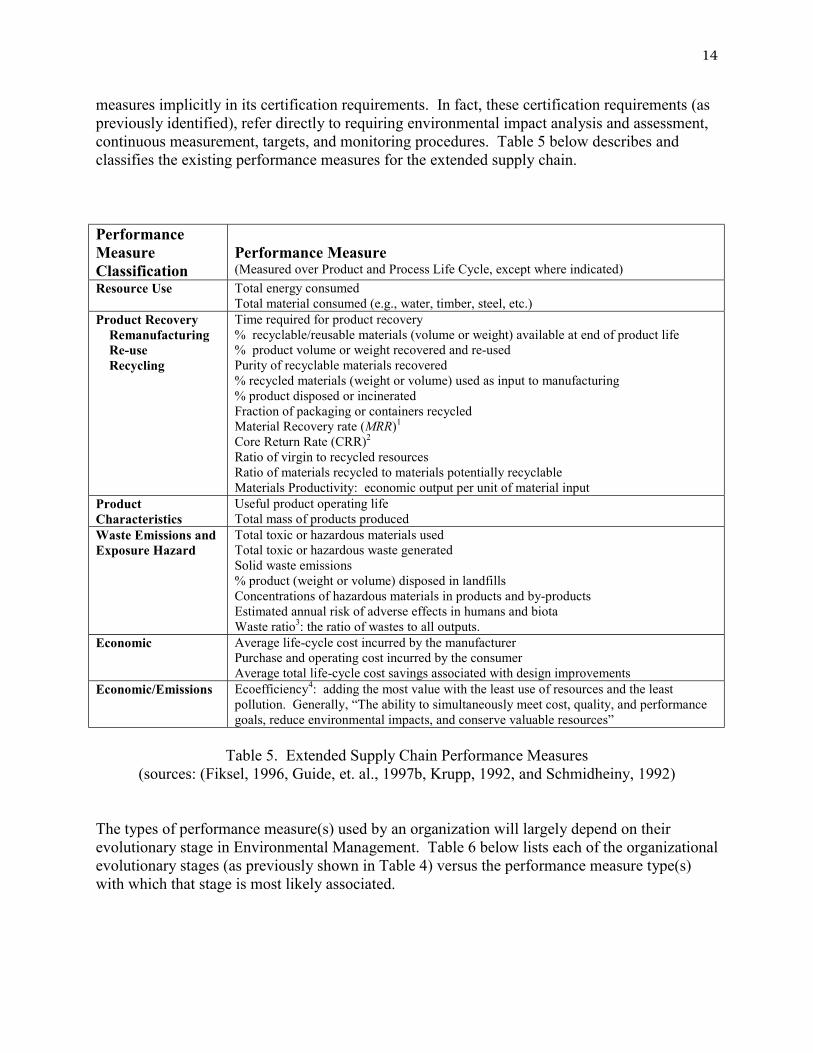
14
measures implicitly in its certification requirements. In fact, these certification requirements (aspreviously identified), refer directly to requiring environmental impact analysis and assessment,continuous measurement, targets, and monitoring procedures. Table 5 below describes andclassifies the existing performance measures for the extended supply chain.
PerformanceMeasureClassification
Performance Measure(Measured over Product and Process Life Cycle, except where indicated)
Resource Use Total energy consumedTotal material consumed (e.g., water, timber, steel, etc.)
Product Recovery Remanufacturing Re-use Recycling
Time required for product recovery% recyclable/reusable materials (volume or weight) available at end of product life% product volume or weight recovered and re-usedPurity of recyclable materials recovered% recycled materials (weight or volume) used as input to manufacturing% product disposed or incineratedFraction of packaging or containers recycledMaterial Recovery rate (MRR)1
Core Return Rate (CRR)2
Ratio of virgin to recycled resourcesRatio of materials recycled to materials potentially recyclableMaterials Productivity: economic output per unit of material input
ProductCharacteristics
Useful product operating lifeTotal mass of products produced
Waste Emissions andExposure Hazard
Total toxic or hazardous materials usedTotal toxic or hazardous waste generatedSolid waste emissions% product (weight or volume) disposed in landfillsConcentrations of hazardous materials in products and by-productsEstimated annual risk of adverse effects in humans and biotaWaste ratio3: the ratio of wastes to all outputs.
Economic Average life-cycle cost incurred by the manufacturerPurchase and operating cost incurred by the consumerAverage total life-cycle cost savings associated with design improvements
Economic/Emissions Ecoefficiency4: adding the most value with the least use of resources and the leastpollution. Generally, �The ability to simultaneously meet cost, quality, and performancegoals, reduce environmental impacts, and conserve valuable resources�
Table 5. Extended Supply Chain Performance Measures(sources: (Fiksel, 1996, Guide, et. al., 1997b, Krupp, 1992, and Schmidheiny, 1992)
The types of performance measure(s) used by an organization will largely depend on theirevolutionary stage in Environmental Management. Table 6 below lists each of the organizationalevolutionary stages (as previously shown in Table 4) versus the performance measure type(s)with which that stage is most likely associated.
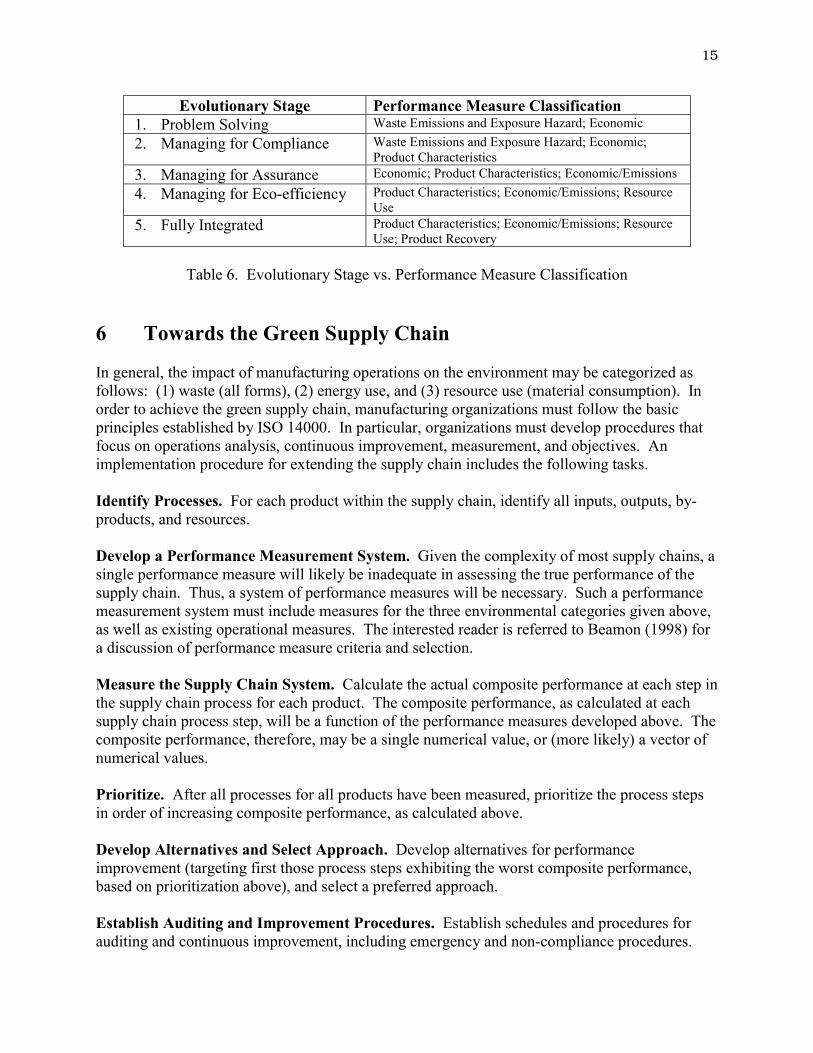
15
Evolutionary Stage Performance Measure Classification1. Problem Solving Waste Emissions and Exposure Hazard; Economic2. Managing for Compliance Waste Emissions and Exposure Hazard; Economic;
Product Characteristics3. Managing for Assurance Economic; Product Characteristics; Economic/Emissions4. Managing for Eco-efficiency Product Characteristics; Economic/Emissions; Resource
Use5. Fully Integrated Product Characteristics; Economic/Emissions; Resource
Use; Product Recovery
Table 6. Evolutionary Stage vs. Performance Measure Classification
6 Towards the Green Supply Chain
In general, the impact of manufacturing operations on the environment may be categorized asfollows: (1) waste (all forms), (2) energy use, and (3) resource use (material consumption). Inorder to achieve the green supply chain, manufacturing organizations must follow the basicprinciples established by ISO 14000. In particular, organizations must develop procedures thatfocus on operations analysis, continuous improvement, measurement, and objectives. Animplementation procedure for extending the supply chain includes the following tasks.
Identify Processes. For each product within the supply chain, identify all inputs, outputs, by-products, and resources.
Develop a Performance Measurement System. Given the complexity of most supply chains, asingle performance measure will likely be inadequate in assessing the true performance of thesupply chain. Thus, a system of performance measures will be necessary. Such a performancemeasurement system must include measures for the three environmental categories given above,as well as existing operational measures. The interested reader is referred to Beamon (1998) fora discussion of performance measure criteria and selection.
Measure the Supply Chain System. Calculate the actual composite performance at each step inthe supply chain process for each product. The composite performance, as calculated at eachsupply chain process step, will be a function of the performance measures developed above. Thecomposite performance, therefore, may be a single numerical value, or (more likely) a vector ofnumerical values.
Prioritize. After all processes for all products have been measured, prioritize the process stepsin order of increasing composite performance, as calculated above.
Develop Alternatives and Select Approach. Develop alternatives for performanceimprovement (targeting first those process steps exhibiting the worst composite performance,based on prioritization above), and select a preferred approach.
Establish Auditing and Improvement Procedures. Establish schedules and procedures forauditing and continuous improvement, including emergency and non-compliance procedures.
16
7 Conclusion
The supply chain concept grew out of the recognition that the process of transforming rawmaterials into final products and delivering those products to customers is becoming increasinglycomplex. As such, it became increasingly apparent that analysis (and subsequent improvement)of the individual supply chain stages did not lead to improvement of the chain as a whole. Thus,the concept of the supply chain emerged to describe all production stages from raw materialacquisition to final product delivery. Changes in the state of the environment, leading tosubsequent public pressure and environmental legislation have necessitated a fundamental shiftin manufacturing business practices. No longer is it acceptable or cost-effective to consider onlythe local and immediate effects of products and processes; it is now imperative to analyze theentire life cycle effects of all products and processes. Therefore, the traditional structure of thesupply chain must be extended to include mechanisms for product recovery. This extensionpresents an additional level of complexity to supply chain design and analysis; more specifically,the addition of the product recovery mechanism gives rise to numerous issues affecting strategicand operational supply chain decisions. Consequently, the extension of the traditional supplychain requires the establishment and implementation of new performance measurement systems.These new measurement systems will serve as the centerpieces of environmentally-consciousimplementation plans, based on continuous improvement, that will enable organizations tobecome and remain competitive while achieving sustainable processes.
17
8 References[1]. Alexander, F., (1996), �ISO 14001: What Does it Mean for IE�s?�, IIE Solutions, January, pp. 14-18.
[2]. Beamon, B. M., (1996), �Performance Measures in Supply Chain Management�, Proceedings of the 1996Conference on Agile and Intelligent Manufacturing Systems, Rensselaer Polytechnic Institute, Troy, NY,October 2-3.
[3]. Beamon, B. M., (1998), �Supply Chain Design and Analysis: Models and Methods�, International Journalof Production Economics, Vol. 55, No. 3, pp. 281-294.
[4]. Cattanach, R. E., Holdreith, J. M., Reinke, D.P., and Sibik, L. K. (1995), The Handbook of EnvironmentallyConscious Manufacturing: From Design and Production to Labeling and Recycling, Irwin, Chicago, USA.
[5]. Council on Environmental Quality (1996), The 25th Anniversary Report of the Council on EnvironmentalQuality. Available: http://ceq.eh.doe.gov/reports.htm [1997, November 4].
[6]. Council on Environmental Quality (1993), The 24th Annual Report of the Council on EnvironmentalQuality. Available: http://ceq.eh.doe.gov/reports.htm [1997, November 4].
[7]. Elkington, J. (1994), �Towards the Sustainable Corporation: Win-Win-Win Business Strategies forSustainable Development�, California Management Review, Vol. 36, No. 2, pp. 90-100.
[8]. Environmental Protection Agency Office of Solid Waste (No date), �1995-1996 Treatment, Storage, andDisposal Facts�. Available: http://www.epa.gov/epaoswer/osw/tsd.html [1997, October 1].
[9]. Fiksel, J. (1996), Design for Environment: Creating Eco-Efficient Products and Processes, McGraw-Hill,New York, USA.
[10]. Fleishmann, M., Bloemhof-Ruwaard, J. M., Dekker, R., van der Laan, E., van Nunen, J. A. E. E.,Wassenhove, L. N. V. (1997), �Quantitative Models for Reverse Logistics: A Review�, European Journalof Operational Research, Vol. 103, pp. 1-17.
[11]. Guide, D. V. R., Kraus, M. E., and Srivastava, R. (1997a), �Scheduling Policies for Remanufacturing�,International Journal of Production Economics, Vol. 48, No. 2, pp. 187-204.
[12]. Guide, D. V. R., Srivastava, R., and Spencer, M.S. (1997b), �An Evaluation of Capacity PlanningTechniques in a Remanufacturing Environment�, International Journal of Production Research, Vol. 35,No. 1, pp. 67-82.
[13]. Gupta, S.M. and Taleb, K.N. (1994), �Scheduling Disassembly�, International Journal of ProductionResearch Vol. 32, No. 8, pp. 1857-1866.
[14]. Haynsworth, H.C. and Lyons, R. T. (1987), �Remanufacturing by Design, the Missing Link�, Productionand Inventory Management Journal, Vol. 28, No. 2, pp. 24-29.
[15]. International Organization for Standardization (1996), ANSI/ISO 14000 Series, ASQC, Milwaukee, WI.
[16]. Johnson, M.R. and Wang, M.H. (1995), �Planning Product Disassembly for Material RecoveryOpportunities�, International Journal of Production Research, Vol. 33, No. 11, pp. 3119-3142.
[17]. Krupp, J. A. G. (1992), �Core Obsolescence Forecasting in Remanufacturing�, Production and InventoryManagement Journal, Vol. 33, No. 2, pp. 12-17.
18
[18]. Lamming, R. and Hampson, J. (1996), �The Environment as a Supply Chain Issue�, British Journal ofManagement, Vol. 7, pp. s45-s62.
[19]. Perry, J. H. (1991), �The Impact of Lot Size and Production Scheduling on Inventory Investment in aRemanufacturing Environment�, Production and Inventory Management Journal, Vol. 32, No. 3, pp. 41-45.
[20]. Percival, R. V., Miller, A. S., Schroeder, C.H., and Leape, J.P. (1992), Environmental Regulation: Law,Science, and Policy, Little, Brown, and Company, Boston, USA.
[21]. Pratt, K. M. (1997), �Environmental Standards Could Govern Trade�, Transportation and Distribution, 38,68-76.
[22]. Sarkis, J., Nehman, G., and Priest, J. (1996), �A Systemic Evaluation Model for EnvironmentallyConscious Business Practices and Strategy�, IEEE International Symposium on Electronics and theEnvironment, pp. 281-286.
[23]. Sarkis, J., Darnall, N.M., Nehman, G.I., and Priest, J.W. (1995), �The Role of Supply Chain Managementwithin the Industrial Ecosystem�, IEEE International Symposium on Electronics and the Environment, pp.229-234.
[24]. Schmidheiny, S. (1992), �The Business Logic of Sustainable Development�, Columbia Journal of WorldBusiness, Vol. 27, No. 3/4, pp. 18-24.
[25]. Thierry, M., Salomon, M., van Nunen, J. and van Wassenhove, L. (1995), �Strategic Issues in ProductRecovery Management�, California Management Review, Vol. 37,No. 2, pp. 114-135.
[26]. United States Congress, Office of Technology Assessment (1992), Green Products By Design: Choicesfor a Cleaner Environment, OTA - E - 541, Washington, DC, US Government Printing Office. Available:http://www.wws.princeton.edu/~ota/ns20/year_f.html [1997, November 5].
[27]. Van der Laan, E., Dekker, R., and Salomon, M. (1996a), �Product Remanufacturing and Disposal: aNumerical Comparison of Alternative Control Strategies�, International Journal of Production Economics,Vol. 45, No. 1-3, pp. 489-498.
[28]. Van der Laan, E., Dekker, R., Salomon, M., and Ridder, A. (1996b), �An (s,Q) Inventory Model withRemanufacturing and Disposal�, International Journal of Production Economics, Vol. 46-47, pp. 339-350.
[29]. Zhang, H. C., Kuo, T.C., and Lu, J. (1997), �Environmentally Conscious Design and Manufacturing: AState-of-the-Art Survey�, Journal of Manufacturing Systems, Vol. 16, No. 5, pp. 352 - 371.
19
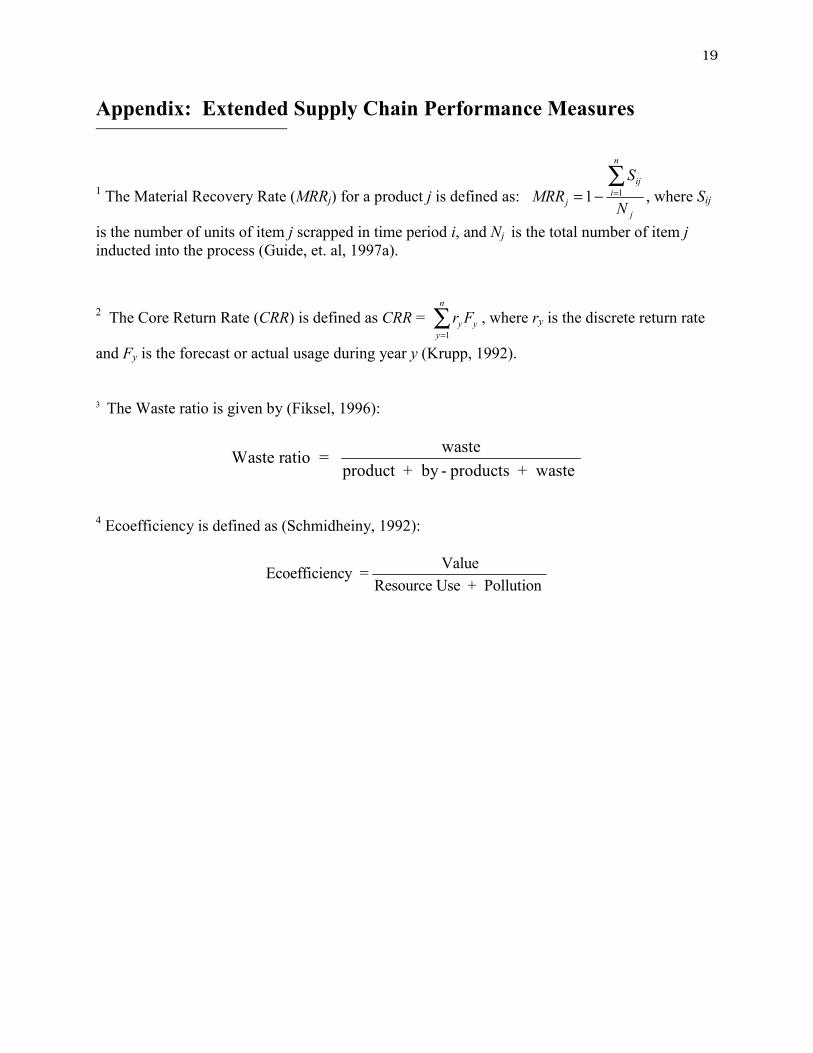
Appendix: Extended Supply Chain Performance Measures
1 The Material Recovery Rate (MRRj) for a product j is defined as: MRRS
Nj
iji
n
j
= − =∑
1 1 , where Sij
is the number of units of item j scrapped in time period i, and Nj is the total number of item jinducted into the process (Guide, et. al, 1997a).
2 The Core Return Rate (CRR) is defined as CRR = r Fy yy
n
=∑
1
, where ry is the discrete return rate
and Fy is the forecast or actual usage during year y (Krupp, 1992).
3 The Waste ratio is given by (Fiksel, 1996):
Waste ratio = wasteproduct + by - products + waste
4 Ecoefficiency is defined as (Schmidheiny, 1992):
Ecoefficiency = ValueResource Use + Pollution
The Supply Chain Response to Environmental Pressures
Discussion Paper
Julie Paquette
Engineering Systems Division
Massachusetts Institute of Technology
June 2005
This paper is written as part of Supply Chain 2020, a research initiative investigating the critical factors
shaping supply chains of today and tomorrow.
1
Table of Contents Table of Contents..........................................................................................................................................2 I. Introduction ................................................................................................................................................3 II. Supply chains must respond to four sources of environmental pressures. ..............................................4
A. Regulations ...........................................................................................................................................4 Directives ...............................................................................................................................................5 Taxes and fees ......................................................................................................................................9 Liability ...................................................................................................................................................9
B. Consumers and Ethical Responsibility................................................................................................10 Quality ..................................................................................................................................................10 Cost......................................................................................................................................................12
C. Resources...........................................................................................................................................14 D. Summary.............................................................................................................................................15
III. The supply chain response involves a distinct operating model, objective, and processes..................16 A. Integral part of strategy .......................................................................................................................16 B. Distinct operating model .....................................................................................................................16 C. Balanced operational objectives .........................................................................................................17 D. Best business processes ....................................................................................................................19
Plan......................................................................................................................................................19 Source..................................................................................................................................................20 Make ....................................................................................................................................................21 Deliver ..................................................................................................................................................22 Return ..................................................................................................................................................22
IV. Conclusion .............................................................................................................................................24 Bibliography ................................................................................................................................................25
2
I. Introduction
Supply chains represent the integration of hundreds of decisions, each with discrete economic and
environmental implications. While delivering the “right product at the right time” and unprecedented
corporate profitability, supply chains have operationalized a linear production path that extracts
resources, uses energy, releases emissions, and produce wastes at volumes and rates that place
increasing burdens on the natural environment. However, as supply chains mature into sophisticated
networks of material and information flow, so does the ability to carefully trace the environmental impacts
of individual products along the supply chain and address these impacts proactively. Today, supply
chains must respond to an array of environmental pressures, including regulations, consumer demands,
and limited resource availability. This response involves the development of distinct operating models,
objectives, and new supply chain processes that are expanding the scope of supply chain management
within organizations. This discussion paper draws from supply chain and environmental management
literature as well as industry case studies to characterize the current state of supply chain environmental
activity and form a basis for future research.
3
II. Supply chains must respond to four sources of environmental pressures.
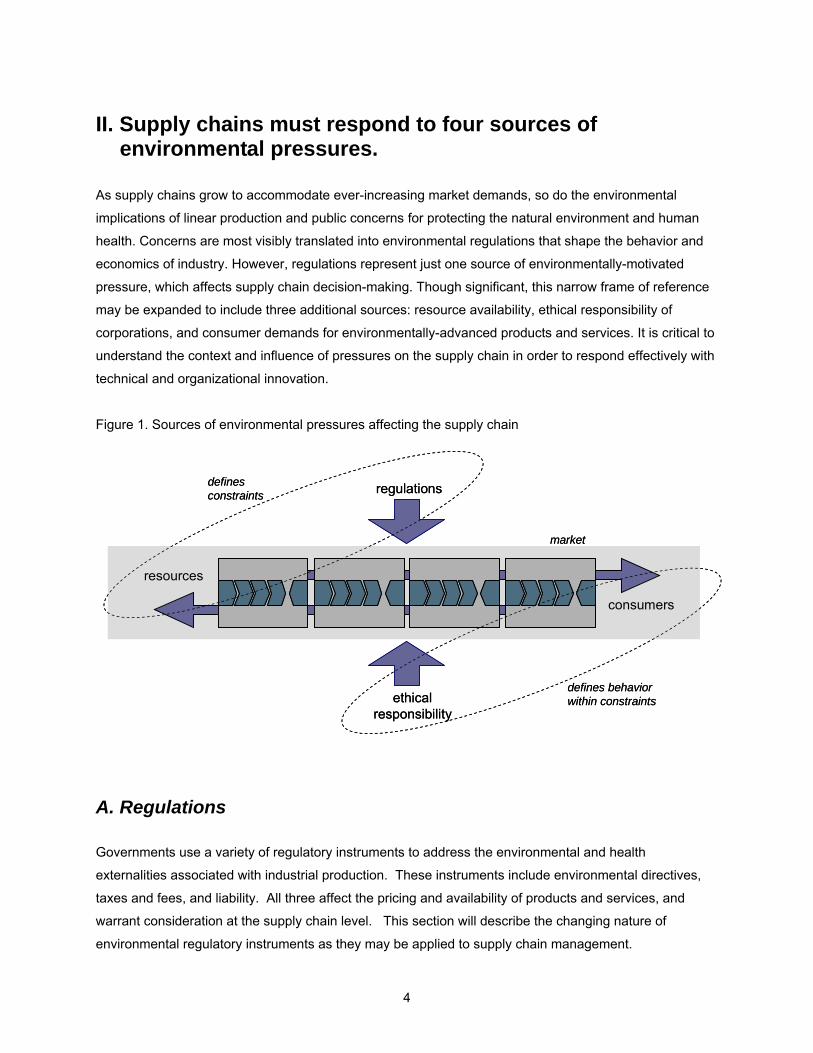
As supply chains grow to accommodate ever-increasing market demands, so do the environmental
implications of linear production and public concerns for protecting the natural environment and human
health. Concerns are most visibly translated into environmental regulations that shape the behavior and
economics of industry. However, regulations represent just one source of environmentally-motivated
pressure, which affects supply chain decision-making. Though significant, this narrow frame of reference
may be expanded to include three additional sources: resource availability, ethical responsibility of
corporations, and consumer demands for environmentally-advanced products and services. It is critical to
understand the context and influence of pressures on the supply chain in order to respond effectively with
technical and organizational innovation.
Figure 1. Sources of environmental pressures affecting the supply chain
resources
consumers
regulations
ethical responsibility
market
defines behavior within constraints
defines constraints
resources
consumers
regulations
ethical responsibility
market
defines behavior within constraints
defines constraints
A. Regulations Governments use a variety of regulatory instruments to address the environmental and health
externalities associated with industrial production. These instruments include environmental directives,
taxes and fees, and liability. All three affect the pricing and availability of products and services, and
warrant consideration at the supply chain level. This section will describe the changing nature of
environmental regulatory instruments as they may be applied to supply chain management.
4
Directives
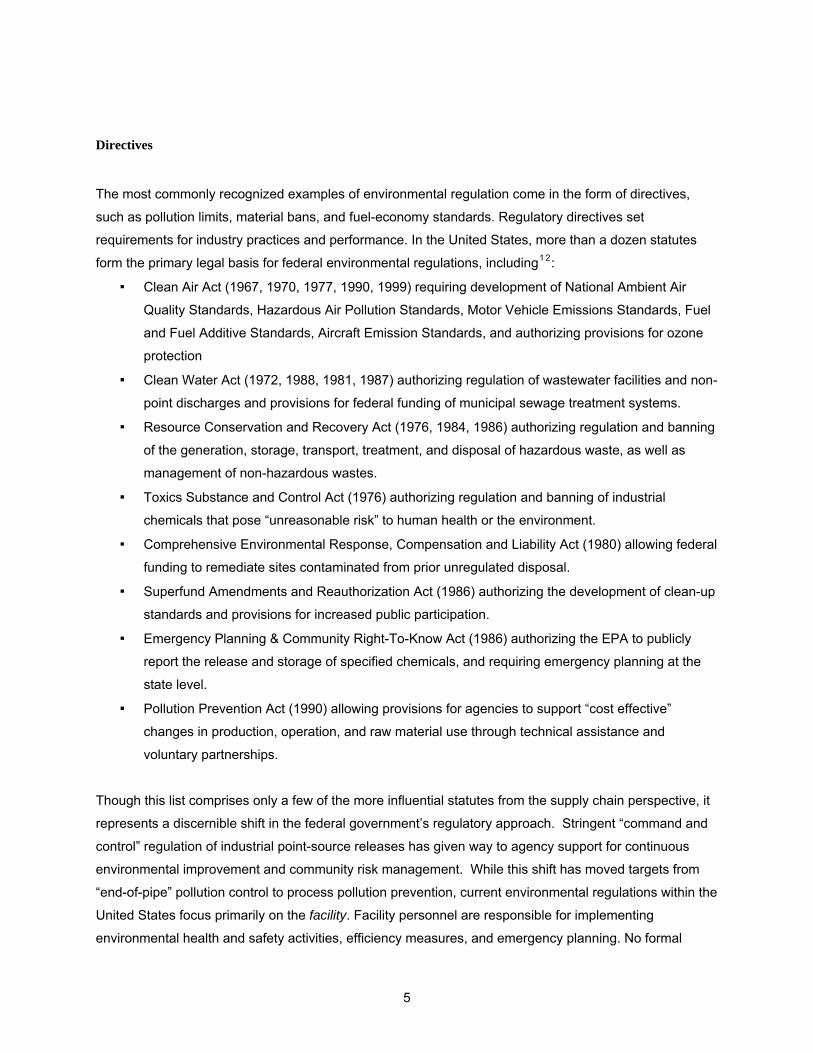
The most commonly recognized examples of environmental regulation come in the form of directives,
such as pollution limits, material bans, and fuel-economy standards. Regulatory directives set
requirements for industry practices and performance. In the United States, more than a dozen statutes
form the primary legal basis for federal environmental regulations, including1 2:
▪ Clean Air Act (1967, 1970, 1977, 1990, 1999) requiring development of National Ambient Air
Quality Standards, Hazardous Air Pollution Standards, Motor Vehicle Emissions Standards, Fuel
and Fuel Additive Standards, Aircraft Emission Standards, and authorizing provisions for ozone
protection
▪ Clean Water Act (1972, 1988, 1981, 1987) authorizing regulation of wastewater facilities and non-
point discharges and provisions for federal funding of municipal sewage treatment systems.
▪ Resource Conservation and Recovery Act (1976, 1984, 1986) authorizing regulation and banning
of the generation, storage, transport, treatment, and disposal of hazardous waste, as well as
management of non-hazardous wastes.
▪ Toxics Substance and Control Act (1976) authorizing regulation and banning of industrial
chemicals that pose “unreasonable risk” to human health or the environment.
▪ Comprehensive Environmental Response, Compensation and Liability Act (1980) allowing federal
funding to remediate sites contaminated from prior unregulated disposal.
▪ Superfund Amendments and Reauthorization Act (1986) authorizing the development of clean-up
standards and provisions for increased public participation.
▪ Emergency Planning & Community Right-To-Know Act (1986) authorizing the EPA to publicly
report the release and storage of specified chemicals, and requiring emergency planning at the
state level.
▪ Pollution Prevention Act (1990) allowing provisions for agencies to support “cost effective”
changes in production, operation, and raw material use through technical assistance and
voluntary partnerships.
Though this list comprises only a few of the more influential statutes from the supply chain perspective, it
represents a discernible shift in the federal government’s regulatory approach. Stringent “command and
control” regulation of industrial point-source releases has given way to agency support for continuous
environmental improvement and community risk management. While this shift has moved targets from
“end-of-pipe” pollution control to process pollution prevention, current environmental regulations within the
United States focus primarily on the facility. Facility personnel are responsible for implementing
environmental health and safety activities, efficiency measures, and emergency planning. No formal
5
mandate requires that environmental management processes and improvements extend beyond this
domain. Further, while facility-focused regulations impact the cost of operations which very well may
change the decisions of supply chain managers, they do not require that any factor beyond cost be
explicitly considered.
Environmental regulations are increasingly focused on consumer products. Products embody the
cumulative environmental impacts from production, use, and disposal. Therefore, regulatory directives
aimed at improving the environmental attributes of individual products effectively impact industry as a
whole. In fact, product-focused regulation is ostensibly supply chain regulation, because changes to
products drive changes to the design and operation of supply chains. Whereas regulations targeting
manufacturing and transport activities at the facility level largely encourage either compliance or
relocation of facilities (both of which are reflected in operation costs), regulations at the product level
require new business processes both within the facilities that make up the supply chain and between
them.
Today, there are at least three categories of regulatory directives that are focused on consumer products:
▪ Performance requirements. Standards that address the environmental impact of products during their
“use” phase are relatively established regulatory instruments, including product fuel economy, energy
efficiency, and emissions standards. In the United States, sequential acts for National Energy Policy
(1975, 1978, 1992) authorize the Department of Energy to regulate energy (and to a lesser extent)
water efficiency in end-use equipment, appliances, and building systems, notably including Corporate
Average Fuel Economy (CAFÉ) standards for passenger cars and light trucks. Use of such standards
is increasing across the globe. The European Union recently passed the Directive on the “eco-design”
of Energy Using Products3 which will harmonize and advance the already strict energy and water
efficiency standards across the EU. It is likely that performance targets, as well as labeling and
reporting requirements, will grow more stringent with time. These requirements place significant
demands on product designers and also affect architectural, material, and process choices. Although
it may appear that a change in product attributes has limited impact on the design and operation of
the supply chain, a large body of research suggests that end-product design alterations affect the
entire production system.4 Therefore, product innovation to meet mounting performance standards
will affect fundamental supply chain functions – planning, sourcing, manufacturing, and marketing.
▪ Material mandates. Research increasingly correlates damage to the environment and human health
to the use of toxic and hazardous materials. Accordingly, mandates in the United States have moved
beyond manufacturing emissions controls to regulate the use of select materials in consumer
products. In concept, material mandates are nothing new. The Food and Drug Administration has
6
been regulating the materials of food, drugs, cosmetics, medical devices, and radiation-emitting
electronics for over a century, representing a large portion of products that consumers purchase5.
The Consumer Product Safety Commission sets guidelines for material use in consumer goods such
as appliances, toys, clothing, and paint. Past mandates have focused on materials that may directly
harm human health due to direct exposure, and include a variety of state and federal-level restrictions
on products containing asbestos, lead, and mercury.6 Today, material mandates are being applied to
a broader range of materials, products, and industries with arguably less direct health impacts. For
instance, the European Union’s Restriction on Hazardous Substances (RoHS) Directive is one of the
more aggressive bans of materials in history.7 The directive specifically targets the electronics
industry and requires the phase out of lead, mercury, cadmium, hexavalent chromium and two groups
of flame retardants in all products by 2008. This type of material mandate not only challenges the
technical capabilities of product designers, but also the organizational capabilities across the
electronics industry. Although materials for electronics are often selected far up the supply chain for
commodity components, RoHS places responsibility for a complete bill of materials and certification
on the final producers, requiring a level of information exchange and data management
unprecedented in the electronics industry. Supply chain managers will be called upon to manage
data, monitor supplier activity, and provide quality control while coordinating material transitions in
existing product lines.
▪ Extended producer responsibility legislation. In an effort to reduce material waste, conserve
resources, and prevent hazardous disposal, several countries have enacted the principle of extended
producer responsibility (EPR) within statutory frameworks. EPR directives place financial
responsibility for the collection and disposal of products at the end of their useful life on
manufacturers, thereby aiming to create incentive to redesign products for reuse and recycling. EPR
legislation, also referred to as “take-back,” is attractive to policy-makers not only because it is a
market-oriented instrument for environmental improvement, but also because it reduces the burden of
waste disposal from individual municipalities.8 While deposit schemes for the recovery of aluminum
cans and car batteries represent variations of “take-back” directives, EPR as discussed here has
approximately a fifteen-year history beginning with packaging initiatives in Europe. The early efforts
of several European countries were formalized in 1994 by the EU’s Packaging and Packaging Waste
Directive that stipulates national collection systems and recycling quotas.9 A variety of public and
private systems have developed in response, including Germany’s Dual System which collects waste
and coordinates recycling at a profit for producers who pay an upfront fee to display the “green dot”
logo on their packaging.10 EPR directives have since targeted more complex products, including
automobiles, appliances, and electronics. The more aggressive legislative efforts are coming out of
East Asia and Europe, and include Japan’s End-of-Life Vehicle Recycling Initiative (1996) and Home
Appliance Recycling Law (2001), and the EU’s Directive on End-of-Life Vehicles (2000) and Directive
7
on Waste Electrical and Electronic Equipment (2002). Although, regulations have been adopted or
proposed in Korea, China, India, Brazil, Venezuela, Chile, and some states within the United States
as well. In order to comply with EPR requirements, companies must design, implement, and possibly
operate comprehensive reverse supply chains.11 Representing no small endeavor, reverse supply
chains may involve collection facilities, reverse logistics, partnerships with disassembly and recycling
providers, integrated remanufacturing and reuse plans, and marketing initiatives to encourage
consumer participation. Altogether, “take back” requires considerable organizational, technical, and
financial commitment from industry.
This discussion of product-focused directives is in no way exhaustive, rather providing a broad overview
of present and future regulatory directions. Altogether, several broad conclusions may be drawn:
First, the global nature of today’s markets and supply chains complicates regulatory compliance efforts.
The broad and sometimes conflicting requirements of various regulatory bodies must be managed
effectively, presenting an additional element of complexity to supply chain management. As such, there is
considerable incentive to standardize environmental processes across the supply chain when possible.
In the past decade, the United States has taken a much different approach to regulating industry than
other nations – favoring environmental improvement through voluntary partnerships with corporations
over more adversarial and legislative measures. While this shift may be preferable for supporting a
market-oriented environmental response, it is likely that the more stringent regulations coming out of
Europe and East Asia will set the standard for performance in all countries for better or worse.
Second, product-focused regulatory directives raise the stakes for industry because they assign chief
responsibility for environmental improvement to the most visible players in the production chain – the final
manufacturers. A requirement that the product embody certain environmental attributes ensures that
some level of improved environmental coordination occurred along the supply chain, regardless of
whether or not the product was imported from a country with little to no environmental regulations. While
regulations that required facility improvements affect operation costs along the supply chain, product-
focused directives change the entire decision framework of the supply chain, influencing cost and adding
environmental criteria to fundamental processes in sourcing, manufacturing, operations, distribution, and
data management.
Third, the optimal supply chain response to product-focused directives will be difficult to determine in the
near future. Not only are global production systems increasingly complex, but such regulatory frameworks
are relatively new, still evolving, and seemingly unclear about ultimate environmental goals. For instance,
it is unclear whether EPR legislation is intended primarily to minimize waste, reduce the toxic constituents
of waste, encourage alternative waste disposal methods, or achieve a combination of these things.
8
Evidence from past governmental initiatives suggests that it is difficult to achieve multiple goals with one
policy instrument (Walls, 2003). For this reason, it may be presumed that future regulations will require
multiple activities as an integrated response to multiple policy goals.
Taxes and fees
Environmental taxes either “impose a tax cost on a product or activity that is environmentally damaging or
they give a tax benefit to some product or activity that is environmentally beneficial.”12 For example, in the
United States, the federal government imposes an excise tax on ozone-depleting chemicals and offers a
tax credit to people who buy electric vehicles. In this sense, environmental taxes do not replace
regulatory directives, but rather help regulate the use of resources by visibly changing the purchase price.
Environmental taxes, if applied aggressively and globally, may transform the way supply chains are
designed and operated. For instance, suppose the United States levied a substantially higher gasoline
tax. Logistics systems might change dramatically in light of escalating transportation costs. This response
could either foster regional supply chains and economic development or irreparably damage international
markets. Environmental fees create the same affect, increasing the cost of select activities to
environmentally-preferable ends. Fees may be applied to landfill, hazardous waste, or raw material
extraction, with ramifications that ripple along the supply chain.
While a large body of literature discusses the use of taxation to shape consumer behavior and raise
government revenue13, the direct impact of various taxation schemes on the management of global
supply chains is not addressed. Environmental taxes and fees may be effective instruments for
environmental progress, though arguably less effective for supply chain progress. In changing the visible
price of a product or activity, supply chain decision outcomes may be different, but the decision
framework and business processes in place may stay the same.
Liability
Liability for environmental damage serves as pressure for performance improvements. Under United
States tort law and environmental statutes such as the Resource Conservation and Recovery Act, “strict
liability places the full burden of environmental costs on the pollution generator, independent of the safety
or precaution taken by the defendant.”14 This liability extends along the supply chain, creating situations
where organizations may be held liable for environmental damage even when that damage is not a direct
consequence of their actions. In the case that larger companies are conducting business with supply
chain partners who have limited assets, it is in the best interest of those large companies to put into place
technical support systems that assure compliance in the use of their products.15 In fact, companies that
9
have “relative advantages in certain risk reduction factors should implement these to reduce the liability of
the entire supply chain.”16 Risk reduction activities may include training initiatives, product redesign,
management of end-of-life products, and service offerings. For example, Greentech Assets, Inc. in Rhode
Island offers recycling services specifically targeted at corporations aiming to limit the environmental and
privacy risks associated with retired electronics.17 Ashland Chemical reduced their own liability and that of
their customers by offering chemical services rather than sales.18 Ashland sells product on a “turn-key
basis, taking on all the responsibilities of providing and disposing chemicals.”19 In this sense, liability
becomes an extremely effective regulatory instrument for several reasons. One, assigning liability to the
most influential player creates incentive for the adoption and diffusion of environmental practices. Two,
liability also invites pressure for environmental practices from insurance providers who underwrite
industrial activities. Third and perhaps most importantly to supply chain processes, liability creates
business opportunities to those companies who have invested in environmental literacy and services
because they are able to reduce the risks associated with the activities of their customers’ and the supply
chain as a whole.20
B. Consumers and Ethical Responsibility Markets create powerful venues for change since a savvy consumer base continually demands more
value from products, services, and the organizations that offer them. In this sense, end consumers drive
fundamental characteristics of the supply chain, including environmental performance. This type of
pressure for environmental attributes and responsibility creates distinct market opportunities for supply
chains that can deliver the “right product at the right time.” This section will describe how consumer
product demands and the ethical responsibilities of corporations are realized through supply chain level
environmental performance.
Quality
Consumers demand quality products. As environmental awareness and expectations increase, so do
demands for products with improved environmental qualities, including energy-efficient appliances,
organic food and fabrics, recycled paper goods, and non-toxic cleaners. Past studies have shown that
pinning down the exact status of environmental consumerism is challenging and subject to debate. Even
as “79% of Americans consider themselves environmentalists and 67% state they would be willing to pay
5-10% more for environmentally compatible goods,”21 actual buying practices have not supported opinion
polls. Consumers rarely accept environmentally-preferred products with inferior performance, and very
few are willing to pay a price premium for environmental attributes.22 While environmental expectations
may be high all around, many companies still view the green consumer as a niche market.
10
Regardless, the niche market has demonstrated consistent growth in recent years and currently
comprises more products with improved environmental attributes than ever before. Sales in select
product categories demonstrate this phenomenon:
▪ Organic: While the conventional food industry is generating a steady 2-3% per year growth, the
organic industry has grown at rates between 17-20% annually for the past several years.23
▪ Energy-efficient: Energy Star, a labeling program administered by the United States EPA since 1992
to reward the most energy-efficient products, has expanded to include 11,000 different models within
40 product categories, ranging from washing machines to light bulbs.24
▪ Non-toxic: Natural household cleaners, including laundry and dishwashing detergents, have risen in
sales from $140 million in 2000 to $290 million in 2004.25
Industrial sales mirror these trends. Purchasing Magazine reported in 2002 that “the most significant
factor affecting supply, demand, pricing, and availability of solvents is the environmental issue.” While
demand for conventional solvents will be essentially flat at 0.2% per year growth, green solvents will post
robust gains averaging 5.7% per year through 2005.26
The issue of branding adds another element to managing consumer pressures for environmental
performance. Research suggests that environmental expectations are higher when products are
marketed with a strong brand. Since branding efforts essentially encourage consumers to develop an
emotional attachment to a company’s image and reputation, consumers in turn expect a relatively higher
level of social and environmental performance. In fact, one of the most comprehensive surveys
conducted in this area, covering 25,000 individuals in 26 countries, found that “more consumers base
their impression of a company on its corporate social responsibility than do on (product) reputation or
financial factors.”27
A positive “reputation is a valuable corporate asset, hard to build, yet easy to diminish.”28 The higher the
profile of the brand, the more responsibility that that company must take for environmental activities along
its supply chain. Environmental activities, however, represent just one aspect of the broader corporate
social responsibility (CSR) agenda which has gained wide appeal in the past fifteen years. Also referred
to as corporate citizenship, CSR involves the ethical treatment of employees, resources, the natural
environment, communities and nations in which companies operate. Non-profit advocacy organizations
have evoked the concept of CSR to raise awareness and build pressure for more ethical corporate
behavior. For example, Global Exchange launched an infamous campaign against Nike, Inc. for sub-
contracting to “sweatshops” throughout South East Asia that employed children, required long hours, and
maintained no environmental health and safety policies.29 The Silicon Valley Toxics Coalition condemns
brand name electronics manufacturers for toxic components and hazardous waste as a result of
11
irresponsible disposal. Their seminal publication, “Exporting Harm: The High Tech Trashing of Asia,” drew
public attention to the practice of exporting electronic waste to be processed in parts of Asia.30
On the other hand, some companies such as Stoneyfield Farm and Aveda have built a name for
themselves on a basis of CSR. The efforts of these companies may drive both consumer demand for
environmentally advanced products and competitive pressure for more responsible behavior in general.
In a time when marketing, media, and public relations define success for many high profile companies,
pressure to project an image of corporate ethical responsibility is very high. While it may be relatively
easy to pay tribute to CSR in annual reports, it appears considerably more challenging to implement and
enforce practices along the supply chain that yield measurable environmental benefits.
Altogether, consumer demands create serious challenges for supply chain management because while
environmental expectations are high and extend beyond final manufacturers to include multi-tiered
suppliers, consumers are unwilling to sacrifice product performance or price. Improved environmental
performance, whether necessitated by regulatory directives or consumer demand, require product design
changes which ultimately affect supply chain functions in planning, sourcing, manufacturing, and
marketing. In the case of directives, often regulatory agencies provide technical assistance and facilitate
compliance activities to a degree. However, the onus of meeting consumer pressures for environmental
improvement in a time of greater corporate ethical responsibility is on those who sell the products.
Cost
Consumers also demand competitively-priced products. In order to offer the “right price” and maintain
profitability, production system costs must be carefully balanced with performance along the supply chain.
Ample anecdotal and empirical evidence suggests that environmental waste equals financial waste in
production systems.31 High utilities, fuel costs, and waste disposal fees provide incentive for the adoption
of environmental management systems that streamline production and yield greater efficiencies along the
supply chain. An oft-cited paper by Michael Porter and Claas van der Linde published in 1995 presents
basic reasoning for environmental improvements as investments that yield both product and process
benefits and possibly create major competitive advantages in innovation and operations.32 These
mechanisms for efficiency include:
Process
▪ substitution, reuse, or recycling of production inputs;
▪ less downtime through more careful monitoring and maintenance;
▪ better utilization of by-products by conversion of waste into valuable forms;
▪ lower energy consumption during the production process;
12
▪ reduced material storage and handling costs;
▪ savings from safer workplace conditions; and
▪ elimination or reduction of the cost of activities involved in discharges or waste disposal
Product
▪ higher quality, more consistent, safer products;
▪ lower product costs;
▪ lower packaging costs;
▪ lower net costs of product disposal to customers; and
▪ higher product resale and scrap value
This concept of keeping operation costs low through environmental improvements has been plugged by
business environmentalists for years as the illustrious “win-win” situation. As such, there are abundant
anecdotal case studies that endorse the use of environmental management systems and processes both
within individual facilities and as collaborative efforts between supply chain partners.33 In a document
published in 2000, the EPA reported that34:
▪ GM reduced disposal costs by $12 million between 1987 and 1997 by establishing a reusable
container program with its suppliers. Additionally, reusable containers can reduce solid waste,
product damage during shipping, and worker safety problems that come with slicing open boxes.
▪ Andersen Corporation developed a composite material from wood wastes generated during its
manufacturing process. This innovation yielded internal rates of return exceeding 50% and
enabled Andersen to decrease solid lumber purchases by 750,000 board-feet.
▪ Public Service Electric and Gas Company saved more than $2 million in 1997 in storage and
product disposal fees by requiring maintenance and operating material suppliers to adhere to
stringent return policies. These costs had previously been hidden in overhead accounts.
Examples like these may be found in many publications, old and new, along with a wide range of process
tools for organizations to identify and implement tailored environmental strategies. Notably, a tool called
GreenSCOR35 has been developed to merge environmental management with supply chain management
in order to integrate environmental considerations into the entire supply chain process. An offshoot of the
Supply Chain Council’s original Supply Chain Operation Reference model (SCOR), benefits to
GreenSCOR include the ability to reduce environmental impacts and related costs system-wide while
supporting traditional supply chain objectives. The approach also raises the visibility of the financial and
operational benefits of environmental supply chain practices.
While the desire to keep operating costs low is good reason to pursue environmental performance
13
improvements along the supply chain, this desire does not represent a unique environmental pressure
within this framework. It is perhaps more accurate to group the “win-win” situations described here as
either 1) operational improvements motivated by economic pressures that happen to demonstrate
environmental benefits, or 2) environmental improvements motivated by regulatory, consumer, or ethical
responsibility pressures that happen to yield cost-savings. In the future, environmental pressures will
require significant and pervasive changes in supply chain design and operations, changes that will not
likely be motivated by incremental cost-savings.
C. Resources
Escalating global population and affluence create demand for more and more products. The
corresponding rates of production inevitably place strains on the natural environment’s ability to supply
resources and absorb wastes. Traditional supply chains “are based on a linear production paradigm
which relies on constant input of virgin natural resources and unlimited environmental capacity for
assimilation of wastes and emissions.”36 Despite considerable progress in resource conservation and
process efficiency measures, this paradigm is still pervasive. The secure supply of critical feed-stocks will
remain a supply chain challenge into the future.
An examination of the global supply and demand for fish illustrates this point well. The World Resource
Institute reports that consumption of fish and fishing products has doubled in the past thirty years and has
increased five-fold since 1950.37 “Fish supply has become one of the major natural resource concerns,
as seventy-five percent of commercially important marine and most inland water fish stocks are either
currently being over-fished, or are being fished at their biological limit.”38 This situation bodes poorly for
those in the fish business, including global corporations such as Unilever that sells fish and uses fish
products as raw materials. Unilever is one of the world's leading suppliers of food, home care, and
personal care consumer goods. In the mid-1990s, Unilever launched a comprehensive effort to secure a
sustainable supply of fish. First, they provided seed money to the World Wildlife Foundation to research
the situation and establish the Marine Stewardship Council as an independent organization to certify
sustainable fish supplies. Then, they initiated discussion with competitors and national regulatory bodies
in support of the Council’s standards. Finally, Unilever publicly endorsed the work of the Stewardship
Council and committed to purchasing only certified fish.39
The availability of energy and water resources for manufacturing also presents a challenge to supply
chain management. Water shortages are increasing world-wide as demand for drinking and irrigation
grows. The United Nations Environmental Program reports that one third of the world’s population lives in
countries where consumption exceeds 10% of total supply and more than 2.7 billion people will face
severe water shortages by the year 2025.40 Supply chain managers must consider resource constraints
14
when locating facilities and planning operations, since energy and water shortages may dramatically
affect business. For example, both Pepsi and Coca-Cola lost their license to use local groundwater at
bottling plants in Kerala, India following a local drought.41
While it may be easy to take for granted the availability of natural resources to support industrial activities,
resource constraints represent a systemic environmental pressure. The most successful companies will
recognize natural limitations, in time to plan for conservation, substitution, or production of their own feed-
stocks. Such a response will require a broader perspective on the role of companies in providing goods,
services, as well as stewardship of the resources that enable economic success.
D. Summary
Altogether, supply chains must respond to environmental pressures from four sources. Resource
availability and regulatory pressures place physical, legal, and economic constraints on supply chain
management, while consumer demands and the ethical responsibilities of corporations define desirable
behavior in the market and within those constraints. As supply chains mature and environmental
pressures become more diverse and demanding, technical and organizational innovation is needed in
supply chain design and operation.
15
III. The supply chain response involves a distinct operating model, objective, and processes
In order to characterize how industry may best respond to environmental pressures through their supply
chains, it is important to understand the role supply chain management plays in supporting business
strategy. Given that “ample evidence exists to support the premise that supply chain management
processes have a significant impact on the operational and financial performance of companies,” it is
appropriate to ask what constitutes a supply chain that successfully brings value to a company.42 In a
working paper that forms the basis for the Supply Chain 2020 research initiative at Massachusetts
Institute of Technology, a four statement hypothesis defining an “excellent supply chain” is proposed. “An
excellent supply chain:
▪ enhances and is an integral part of a corporation’s business strategy;
▪ leverages a distinctive operating model to gain competitive advantage;
▪ executes well against a balanced set of operational objectives or metrics; and
▪ focuses on a small number of best business processes that are aligned with objectives.”
This hypothesis may be further examined with respect to environmental excellence.
A. Integral part of strategy First, if an excellent supply chain is considered an integral part of a corporation’s business strategy, then
it should also be integral to a corporation’s environmental strategy. Supply chains operationalize the
existing linear cycles of industrial production, and represent the cumulative environmental impacts of a
product from extraction to final delivery. It is reasonable to believe that if a company has an
environmental strategy, then that strategy would be implemented through activities at the supply chain
level. Many companies have exhibited a commitment to the natural environment through corporate
responsibility statements in marketing publications and on the internet. One may evaluate whether or not
these companies’ supply chains are enhancing or undermining their stated environmental positions.
B. Distinct operating model Second, an excellent supply chain should leverage a distinctive operating model to gain competitive
advantage. An operating model defines an organization’s overall strategy for business, and may be
reduced commonly to simple statements like “to offer the lowest priced products” or “to provide the largest
selection of products.” Supply chains either support the designated operating model, effectively
16
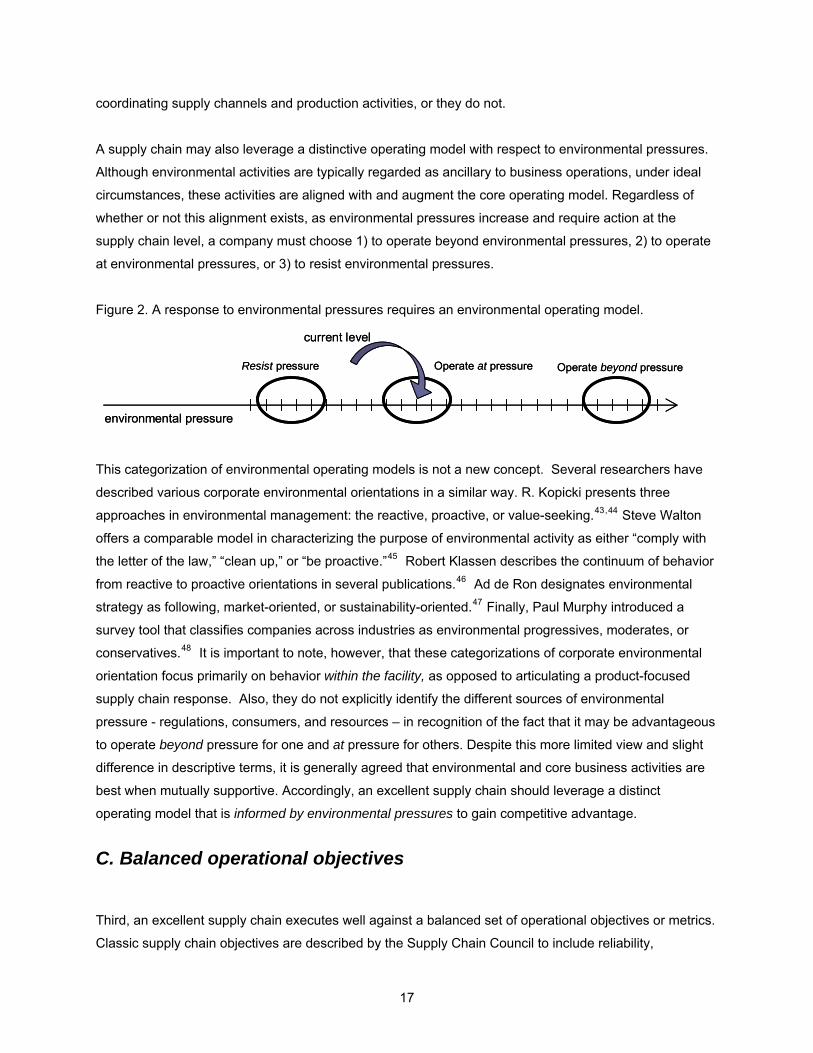
coordinating supply channels and production activities, or they do not.
A supply chain may also leverage a distinctive operating model with respect to environmental pressures.
Although environmental activities are typically regarded as ancillary to business operations, under ideal
circumstances, these activities are aligned with and augment the core operating model. Regardless of
whether or not this alignment exists, as environmental pressures increase and require action at the
supply chain level, a company must choose 1) to operate beyond environmental pressures, 2) to operate
at environmental pressures, or 3) to resist environmental pressures.
Figure 2. A response to environmental pressures requires an environmental operating model.
Operate at pressure Operate beyond pressureResist pressure
environmental pressure
current level
Operate at pressure Operate beyond pressureResist pressure
environmental pressure
current level
This categorization of environmental operating models is not a new concept. Several researchers have
described various corporate environmental orientations in a similar way. R. Kopicki presents three
approaches in environmental management: the reactive, proactive, or value-seeking.43,44 Steve Walton
offers a comparable model in characterizing the purpose of environmental activity as either “comply with
the letter of the law,” “clean up,” or “be proactive.”45 Robert Klassen describes the continuum of behavior
from reactive to proactive orientations in several publications.46 Ad de Ron designates environmental
strategy as following, market-oriented, or sustainability-oriented.47 Finally, Paul Murphy introduced a
survey tool that classifies companies across industries as environmental progressives, moderates, or
conservatives.48 It is important to note, however, that these categorizations of corporate environmental
orientation focus primarily on behavior within the facility, as opposed to articulating a product-focused
supply chain response. Also, they do not explicitly identify the different sources of environmental
pressure - regulations, consumers, and resources – in recognition of the fact that it may be advantageous
to operate beyond pressure for one and at pressure for others. Despite this more limited view and slight
difference in descriptive terms, it is generally agreed that environmental and core business activities are
best when mutually supportive. Accordingly, an excellent supply chain should leverage a distinct
operating model that is informed by environmental pressures to gain competitive advantage.
C. Balanced operational objectives
Third, an excellent supply chain executes well against a balanced set of operational objectives or metrics.
Classic supply chain objectives are described by the Supply Chain Council to include reliability,
17
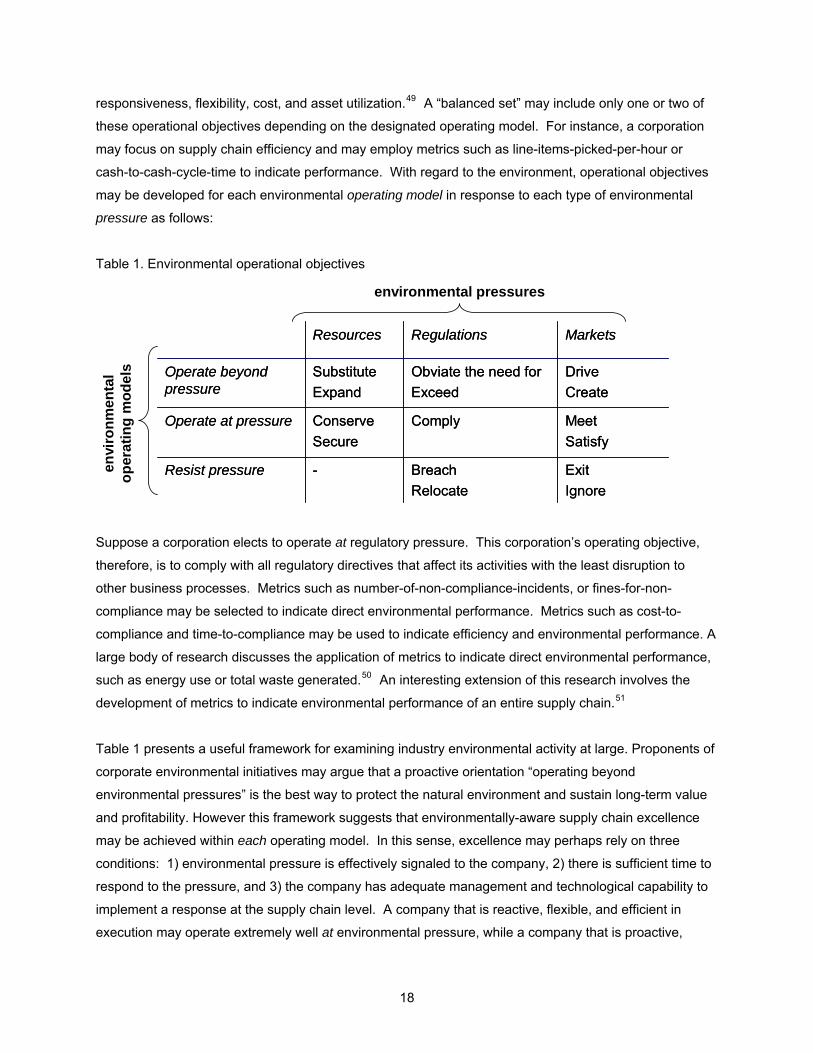
responsiveness, flexibility, cost, and asset utilization.49 A “balanced set” may include only one or two of
these operational objectives depending on the designated operating model. For instance, a corporation
may focus on supply chain efficiency and may employ metrics such as line-items-picked-per-hour or
cash-to-cash-cycle-time to indicate performance. With regard to the environment, operational objectives
may be developed for each environmental operating model in response to each type of environmental
pressure as follows:
Table 1. Environmental operational objectives
Exit Ignore
Breach Relocate
-Resist pressure
MeetSatisfy
ComplyConserveSecure
Operate at pressure
DriveCreate
Obviate the need forExceed
SubstituteExpand
Operate beyond pressure
MarketsRegulationsResources
Exit Ignore
Breach Relocate
-Resist pressure
MeetSatisfy
ComplyConserveSecure
Operate at pressure
DriveCreate
Obviate the need forExceed
SubstituteExpand
Operate beyond pressure
MarketsRegulationsResources
environmental pressures
envi
ronm
enta
l op
erat
ing
mod
els
Suppose a corporation elects to operate at regulatory pressure. This corporation’s operating objective,
therefore, is to comply with all regulatory directives that affect its activities with the least disruption to
other business processes. Metrics such as number-of-non-compliance-incidents, or fines-for-non-
compliance may be selected to indicate direct environmental performance. Metrics such as cost-to-
compliance and time-to-compliance may be used to indicate efficiency and environmental performance. A
large body of research discusses the application of metrics to indicate direct environmental performance,
such as energy use or total waste generated.50 An interesting extension of this research involves the
development of metrics to indicate environmental performance of an entire supply chain.51
Table 1 presents a useful framework for examining industry environmental activity at large. Proponents of
corporate environmental initiatives may argue that a proactive orientation “operating beyond
environmental pressures” is the best way to protect the natural environment and sustain long-term value
and profitability. However this framework suggests that environmentally-aware supply chain excellence
may be achieved within each operating model. In this sense, excellence may perhaps rely on three
conditions: 1) environmental pressure is effectively signaled to the company, 2) there is sufficient time to
respond to the pressure, and 3) the company has adequate management and technological capability to
implement a response at the supply chain level. A company that is reactive, flexible, and efficient in
execution may operate extremely well at environmental pressure, while a company that is proactive,
18
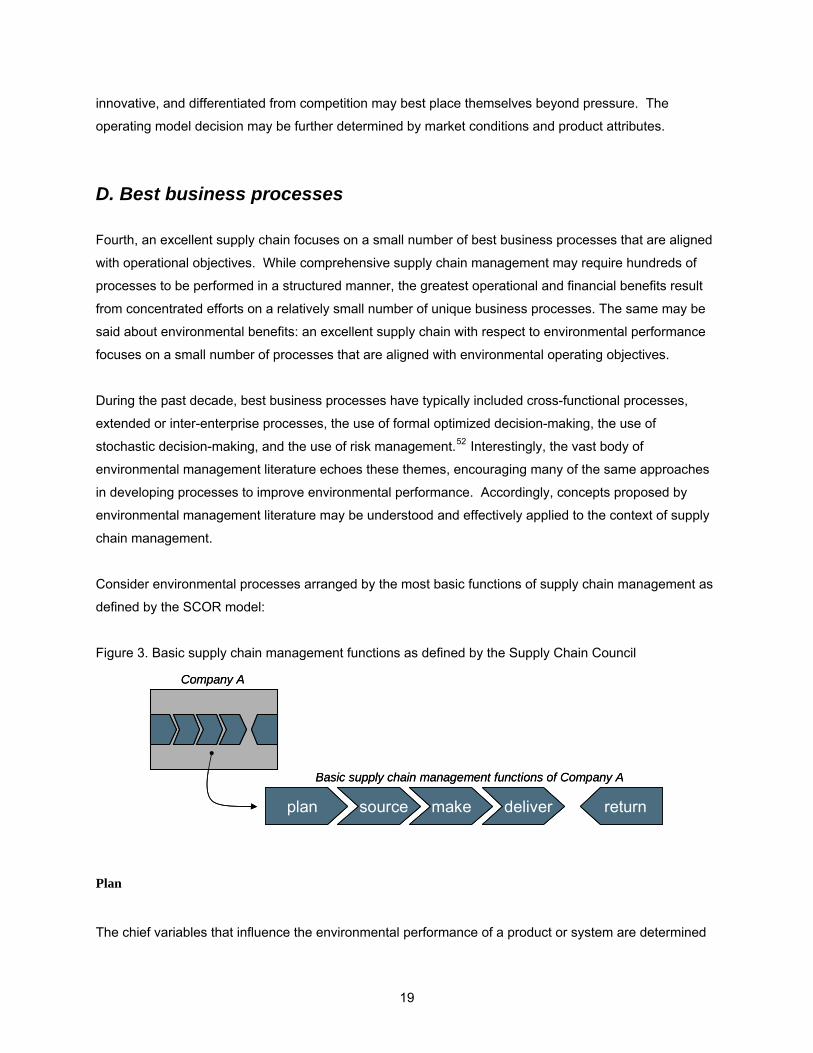
innovative, and differentiated from competition may best place themselves beyond pressure. The
operating model decision may be further determined by market conditions and product attributes.
D. Best business processes Fourth, an excellent supply chain focuses on a small number of best business processes that are aligned
with operational objectives. While comprehensive supply chain management may require hundreds of
processes to be performed in a structured manner, the greatest operational and financial benefits result
from concentrated efforts on a relatively small number of unique business processes. The same may be
said about environmental benefits: an excellent supply chain with respect to environmental performance
focuses on a small number of processes that are aligned with environmental operating objectives.
During the past decade, best business processes have typically included cross-functional processes,
extended or inter-enterprise processes, the use of formal optimized decision-making, the use of
stochastic decision-making, and the use of risk management.52 Interestingly, the vast body of
environmental management literature echoes these themes, encouraging many of the same approaches
in developing processes to improve environmental performance. Accordingly, concepts proposed by
environmental management literature may be understood and effectively applied to the context of supply
chain management.
Consider environmental processes arranged by the most basic functions of supply chain management as
defined by the SCOR model:
Figure 3. Basic supply chain management functions as defined by the Supply Chain Council
plan source make deliver return
Company A
Basic supply chain management functions of Company A
plan source make deliver returnplan source make deliver return
Company A
Basic supply chain management functions of Company A
Plan
The chief variables that influence the environmental performance of a product or system are determined
19
during the planning phase. A number of processes may be used to aid environmental decision-making
while planning the supply chain.
▪ Environmental cost accounting53 is a technique to identify and assign discrete costs to
environmentally harmful activities within a broader system. The term “cost” as used implies two
meanings. The first is the monetary cost that an individual company might incur from a specific
activity, such as the fees associated with hazardous waste disposal. The second is the cost of
damage to human health or the natural environment that may be directly attributed to a corporate
activity. Companies motivated to reduce operating costs or to demonstrate an environmental
commitment use environmentally accounting techniques to capture environmental costs not typically
captured through conventional accounting methods. The US EPA commissioned a comprehensive
study of the use of environmental accounting in hospital purchasing and waste management in the
year 2000, which serves as an excellent reference about accounting techniques.54
▪ Environmental life cycle analysis is a method used to identify and evaluate the environmental impacts
associated with a product or service throughout its entire life from material extraction to eventual
disposal and assimilation into the environment. As opposed to environmental cost accounting, life
cycle analysis implies non-monetary environmental assessment and is used as a product or system
design tool. A number of life cycle analysis methodology books and software programs are
available,55 although not specifically geared to supply chain managers.
▪ Design for environment is an approach to reduce the environmental impacts of a product by
introducing specific design criteria during the product development phase, such as “design for
recyclability” or “design for energy efficiency.” Once the environmental impacts of a particular product
characteristic or life-cycle phase are identified through a formal or informal analysis, design for
environment may be used as an organizing design principle to ameliorate those impacts. Many
industries have successfully implemented a design for environment approach in product
development. For instance, appliances that have been awarded Energy Star rating by the US EPA
are designed to meet specific energy efficiency criteria,56 and Kodak “Fun Saver” one-use-cameras
are designed to be disassembled and remanufactured into new cameras.57
Source
Sourcing professionals may consider the environmental attributes of materials, components, and
products, as well as the environmental performance of the suppliers’ direct activities using the following
processes.
20
▪ Environmental auditing is a procedure to verify the environmental performance of a material,
component, product, or facility. Auditing may be conducted by a third-party organization or the buyer
in accordance with previously established environmental guidelines. Many multi-national companies,
including Limited Brands, Inc., Texas Instruments, and General Motors have designated standards
and routinely audit suppliers for environmental performance.58 Internal auditing is also widely
promoted as part of the ISO 1400059 environmental management standards.
▪ Environmental certification is a guarantee that a product or facility meets environmental standards
defined by a third party. Certification typically involves product labeling for consumer marketing in
response to regulatory pressures or consumer demands for products with improved environmental
attributes. Examples of prevalent certification programs include Green Seal60, Germany’s Blue
Angel61, Certified Organic,62 and the building industry’s Leadership in Energy and Environmental
Design certification63. Companies may undergo environmental certification for their own products or
seek to purchase certified products.
Make
As discussed earlier, the manufacturing response to facility-focused regulatory directives has evolved
from end-of-pipe pollution control to the implementation of environmental management systems. It may
be expected that this evolution will continue domestically and extend to facilities in regions with weaker
regulatory regimes, involving the following processes:
▪ Pollution prevention is an approach to preemptively identify and alter activities that create waste.
Prevention techniques including substitution, product modification, improved maintenance, and
recycling have been successfully applied at several facilities following the Pollution Prevention Act of
1990 and several state-level regulatory directives. The Journal for Cleaner Production64 and the
Pollution Prevention Resource Exchange65 serve as excellent references on this topic.
▪ Environmental management systems are sets of processes that enable an organization to identify,
monitor, and address the environmental impacts of its activities. Systems typically include guidance
for employees in environmental health and safety procedures and facilitation tools for continual
improvement of environmental performance. While developing an environmental management
system does not guarantee better environmental performance, it generally helps companies comply
with regulations and manage risk more consistently and effectively. While ISO 14000 serves as the
international standard for environmental management, the US EPA also provides several good
references to develop a system independently.66
21
Deliver
The environmental implications from transportation are growing, as materials, components, and finished
products travel longer distances through production and distribution cycles. The total impact of delivery
functions correlates to two variables that logistics professionals manage directly: transportation distance
and mode.
“Green” logistics is an approach that considers the environmental impacts of procurement, transport,
inventory control, and distribution activities along with other considerations in order to minimize
environmental costs. For example, in addition to considering monetary cost, time, and reliability of freight
service, one may also consider the volume carbon dioxide emissions. There are several interesting
studies that compare the environmental impacts of various product distribution systems, including online
retail models.67
Return
Return processes are gaining in strategic importance as companies compete further to maintain
customers, recover assets, minimize liability, and meet extended producer responsibility regulatory
requirements.
▪ Reverse logistics is a set of activities to collect, transport, and manage products and materials after
sale and delivery to the customer. Reverse logistics has been typically used to facilitate unsold
product and warrantee returns, and it is being further developed to address “take back” regulatory
obligations and to pioneer concepts of closed-loop supply chains. This subject represents an
important area of emerging research within supply chain management.68
▪ Remanufacturing is a process to clean, repair, and restore used durable products to good condition
for resale. Remanufacturing is typically integrated with reverse logistics processes because valuable
products and components must be appropriately transferred from the consumer to the manufacturer.
In addition to logistical challenges, remanufacturing involves serious technical, planning, and
inventory management challenges, areas which are increasingly explored in practice and research
literature.69
▪ Recycling is a procedure to reuse materials, which may otherwise be considered waste, in a form
other than primary use. Recycling is facilitated by return processes in part because existence of a
secondary market depends on the quality of recycled materials. Whether recycling recovered
materials or using purchased recycled content in production, processes require additional planning
22
due to fluctuations in material timing and availability.
This list is by no means exhaustive or prescriptive. Rather, it provides an overview of the many business
processes that could yield significant environmental improvements while being conscious of the impact on
corporate strategy. Although some may argue that true environmental excellence is a product of the
holistic integration of many processes, concentrated efforts on even one may yield significant
environmental benefits that ripple through the supply chain and create economic value. As said
previously, an excellent supply chain focuses on a small number of best business processes, which
prompts the question: when it comes to the supply chain response to environmental pressures, what is
best?
23
IV. Conclusion
Environmental pressures add a new element of complexity to supply chain management, requiring a
comprehensive response involving environmental operating models, operational objectives, and new
supply chain processes. As environmental pressures grow more diverse and demanding, the quality of
an individual company’s supply chain response may confer significant competitive advantage. This
discussion paper presented an overview of the types of environmental pressures that impact supply
chains today, as well as a framework for characterizing what may be an excellent response to these
pressures. From here, we may explore the different models and processes that companies within one
industry are implementing in response to a single pressure. This future research may establish a
relationship between the quality of a supply chain response and the extent of competitive advantage, offer
a prescriptive, evaluative framework for addressing environmental pressures, and present a path towards
the proactive development of supply chains that enable increased profitability and environmental
sustainability.
24
Bibliography 1 Beamon, B., "Designing the Green Supply Chain," Logistics Information Management, 12/4, (1999): 332-342 2 US Environmental Protection Agency, “Major Environmental Laws,” 2005, www.epa.gov/epahome/laws.htm, accessed May 30, 2005. 3 EU, “Directive on the Eco-Design of Energy Using Products,” europa.eu.int/comm/enterprise/eco_design/, 2005, accessed June 1, 2005. 4 The Material Systems Laboratory at Massachusetts Institute of Technology has studied this area extensively. Researchers include Erica Fuchs, Michael Johnson, Francisco Veloso. 5 US Food and Drug Administration, 2005, www.fda.gov/opacom/hpview.html, accessed June 1, 2005. 6 US Consumer Product Safety Commission, 2005, www.cpsc.gov/, accessed June 1, 2005. 7 EU, “Directive on the Restriction of Hazardous Substances,” 2003, europa.eu.int/eur-lex/pri/en/oj/dat/2003/l_037/l_03720030213en00190023.pdf, accessed June 1, 2005. 8 Walls, Margaret, “The Role of Economics in Extended Producer Responsibility: Making Policy Choices and Setting Policy Goals,” Resources for the Future, Discussion Paper 3/11, 2003, available at www.rff.org/Documents/RFF-DP-03-11.pdf, accessed May 28, 2005. 9 EU, “Directive on Packaging and Packaging Waste,” 1994, europa.eu.int/scadplus/leg/en/lvb/l21207.htm, accessed June 1, 2005. 10 More information about Germany’s “Green Dot” Dual System for recycling packaging waste may be found at www.gruener-punkt.de, accessed June 1, 2005. 11 Toffel, Michael, “The Growing Strategic Importance of End-of-Life Product Management,” California Management Review, 45/3, (2003): 102-129. 12 Environmental Tax Policy Institute, www.vermontlaw.edu/elc/index.cfm?doc_id=134, accessed May 17, 2005. 13 Resources for the Future provides a sampling of references that address environmental taxes as an introduction to this subject area. www.rff.org 14 Boyd, James, “Green Money in the Bank: Firm Responses to Environmental Financial Responsibility,” Magagerial and Decision Economics, 18/6 (1997): 491-506. 15 Snir, Eli, "Liability as a Catalyst for Product Stewardship." Production and Operations Management, 10/2, (2001): 190-207. 16 Snir, 2001. 17 GreenTech Assets, Inc., greentechassets.com/, accessed May 31, 2005. 18 Ashland, Inc., www.ashchem.com/adc/enviro/, accessed May 31, 2005. 19 Snir, 2001.
25
20 Boyer, Marcel and Porrini, Donatella, “The Choice of Instruments for Environmental Policy: Liability or Regulation?” An Introduction to the Law and Economics of Environmental Policy: Issues in Institutional Design, Research in Law and Economics, 20 (2002): 1-41. 21 Roberts, J.A., “Green consumers in the 1990s: profile and implications for advertising,” Journal of Business Research, 36/1, (1996): 217-231. 22 Mohr, Lois A., Eroglu, Dogan, Ellen, Pam E., “The development and testing of a measure of skepticism toward environmental claims in marketers communications,” The Journal of Consumer Affairs, 32/1, (1998): 30-56, referenced in Hoffman, Andrew, “Business Decisions and the Environment: Significance, Challenges, and Momentum of an Emerging Research Field,” in G. Brewer and P. Stern (eds.) National Research Council, Decision Making for the Environment: Social and Behavioral Science Research Priorities, 2005. 23 Hansen, Nannette, “Organic food sales see health growth,” MSNBC News Online, December, 3, 2004, msnbc.msn.com/id/6638417/, accessed May 20, 2005. 24 US Environmental Protection Agency, Energy Star Program, 2005, www.energystar.gov/, accessed June 1, 2005. 25 Daley, Beth, “Eco-products in demand, but labels can be murky,” Boston Globe, February 9, 2005. 26 Atkinson, William, “Demand for green solvents will boom,” Purchasing Magazine Online, October 10, 2002, www.purchasing.com/article/CA250861.html, accessed May 20, 2005. 27 Roberts, Sarah, “Supply chain specific? Understanding the patchy success of ethical sourcing initiatives,” Journal of Business Ethics, 44/2, (2003): 159-170 referencing the Environics International, CSR Monitor Survey, Millennium Poll, 1999. 28 Roberts, 2003. 29 Connor, Tim, “Still Waiting for Nike to Do It,” A Global Exchange Report, 2001, www.globalexchange.org/campaigns/sweatshops/nike/stillwaiting.html, accessed June 5, 2005. 30 Puckett, Jim, et al, “Exporting Harm: The High Tech Trashing of Asia,” A Silicon Valley Toxics Coalition Report, February 2002, www.svtc.org/cleancc/pubs/technotrash.pdf, accessed June 5, 2005. 31 US Environmental Protection Agency, "The Lean and Green Supply Chain: A Practical Guide for Materials Managers and Supply Chain Managers to Reduce Costs and Improve Environmental Performance," EPA 742-R-00-001, 2001. 32 Porter, M., van der Linde, C., “Green and Competitive: Ending the Stalemate,” Harvard Business Review, 73/5, (1995): 120-134. 33 The Toxics Use Reduction Institute offers numerous case studies that demonstrate environmental and financial savings through pollution prevention activities. www.turi.org/content/content/view/full/1879/, accessed May 31, 2005. 34 US EPA, “Lean and Green….,” 2001. 35 Todd Wilkerson’s presentation may found on the website of the Supply Chain Council, www.supply-chain.org/site/files/Wilkerson_LMI_SCWNA03.pdf, accessed April 2, 2005.
26
36 Geyer, R., Jackson, T., “Supply Loops and Their Constraints: The Industrial Ecology of Recycling and Reuse,” California Management Review, 46/2, (2004): 55-73. 37 Kura, Y., Revenga, C., Hoshino, E., Mock, G., “Fishing for answers: making sense of the global fish crisis,” World Resource Institute Report, 2004, pubs.wri.org/pubs_description.cfm?PubID=3866, accessed May 30, 2005. 38 Kura, et al, 2004. 39 Unilever’s annual report describing efforts to build and sustain reliable fish supplies is available at www.unilever.com/ourvalues/environmentandsociety/default.asp, accessed May 5, 2005. 40 United Nations Environmental Program, “Vital Graphics: An overview of the State of the World’s Fresh and Marine Waters,” 2002, www.unep.org/vitalwater/, accessed May 30, 2005. 41 Morrison, J., Gleick, P., “Freshwater Resources: Managing the Risks Facing the Private Sector,” A Research Paper of the Pacific Institute, 2004, www.pacinst.org/reports/business_risks_of_water/, accessed May 30, 2005 42 Lapide, L., “Supply Chain 2020 Project – Phase 1 Excellent Supply Chains: Working Hypothesis and Research Plan,” Center for Transportation and Logistics, Massachusetts Institute of Technology, July 2004, available at www.supplychain202.net, accessed June 7, 2005. 43 Hoek, Remko I. van, “From reversed logistics to green supply chains,” Supply Chain Management, 4/3, (1999): 129-136. 44 Kopicki R.J., M.J. Berg, L. Legg, V. Dasappa and C. Maggioni, “Reuse and Recycling: Reverse Logistics Opportunities,” Council of Logistics Management, 1993, referenced in Hoek, 1999. 45 Walton, S.V., Handfield, R.B. and Melnyk, S.A., "The green supply chain: integrating suppliers into environmental management processes", International Journal of Purchasing & Materials Management, 34/2, (1999): 2-11, referenced in Hoek, 1999. 46 Klassen, R.D., Johnson, P.F., “The Green Supply Chain,” in Westbrook, R., New, S., (eds.), Understanding Supply Chains: Concepts, Critique and Futures, Oxford University Press, 2004. 47 Ron, Ad J. de, “The ultimate result of continuous improvement,” International Journal of Production Economics, 56-57, (1998): 99-110 48 Murphy, Paul R., Poist, Richard, F., Braunschweig, Charles D., “Green Logistics: Comparative Views of Environmental Progressives, Moderates, and Conservatives,” Journal of Business Logistics, 17/1, (1996): 191-211. 49 Supply Chain Council, Supply-Chain Operations Reference Model, SCOR Version 7.0, available at www.supply-chain.org, accessed May 28, 2005. 50 Gregory J., Atlee J., Isaacs J., Kirchain, R., “Sustainability metrics for materials use at the system and operational level,” Materials Systems Laboratory discussion paper, 2004. 51 See Clift, R., “Metrics for Supply Chain Sustainability,” Clean Technologies and Environmental Policy, 5/3-4, (2003): 240-256, and McIntyre, K., et al, “Environmental Performance Indicators for Integrated Supply Chains: the Case of Xerox Ltd.,” Supply Chain Management, 3/3, (1998): 149-160. 52 Lapide, 2004.
27
53 The US Environmental Protection Agency maintains a website with a number of resources about the environmental and financial benefits of environmental cost accounting, available at www.epa.gov/opptintr/acctg/resources.htm, accessed June 2, 2005. 54 Shapiro, K., Stoughton, M., Graff, R., Feng, L., “Health Hospitals: Environmental Improvements through Environmental Accounting,” A Report from Tellus Institute, July 2000, available at www.epa.gov/opptintr/acctg/pubs/hospitalreport.pdf, accessed June 1, 2005. 55 Among the most recent books published about life cycle analysis is The Hitch Hiker’s Guide to LCA by Henrikke Baumann and Anne-Marie Tillman published in 2004. 56 Energy Star designates product specifications and eligibility criteria for several categories of products, summarized at www.energystar.gov/index.cfm?c=products.pr_es_home_office, accessed June 1, 2005. 57 Kodak’s One-use Camera Recycling Program, www.kodak.com/eknec/PageQuerier.jhtml?pq-path=2/3/9/1026/1032&pq-locale=en_US, accessed June 1, 2005. 58 Data is based on conversations with individual companies and online information. 59 International Organization for Standardization, www.iso.org/iso/en/iso9000-14000/index.html, accessed June 2, 2005. 60 Green Seal Product Certification, www.greenseal.org, accessed June 1, 2005. 61 Germany’s Blue Angel Certification, www.blauer-engel.de/englisch/navigation/body_blauer_engel.htm, accessed June 1, 2005. 62 Certified Organic Food Standards, www.ams.usda.gov/nop, accessed June 1, 2005. 63 Leadership in Energy and Environmental Design is a national rating system to certify green buildings, administered by the US Green Building Council, www.usgbc.org/LEED/, accessed June 1, 2005. 64 The contents of the Journal for Cleaner Production is available at www.elsevier.com/wps/find/journaldescription.cws_home/30440/description#description, accessed at June 1, 2005. 65 Pollution Prevention Resource Exchange, www.p2rx.org, accessed June 2, 2005. 66 The US Environmental Protection Agency maintains a website with a number of resources and case studies about environmental management systems, available at www.epa.gov/ems/resources/index.htm, accessed June 2, 2005. 67 Matthews, H. Scott, Hendrickson, Chris T., “Economic and Environmental Implications of Online Retailing in the United States,” Joint OECD/ECMT Seminar on the Impact of E-commerce on Transport, Paris, June 6, 2001.
68 Among the most cited books about reverse logistics is Going Backwards: Reverse Logistics Trends and Practices by Dale S. Rogers and Robald S. Tibben-Lembke published by the Reverse Logistics Executive Council in 1999. Full text of this work is available online at http://www.rlec.org/reverse.pdf, accessed June 3, 2005.
28

69 Guide Jr., V.D.R., and Van Wassenhove, L.N., “Business Aspects of Closed-Loop Supply Chains,” in Guide Jr., V.D.R., and Van Wassenhove, L.N., eds., Business Aspects of Closed-Loop Supply Chains, Carnegie Mellon University Press, (2003): 17-42.
29
1
GREEN SUPPLY CHAIN PARAMETERS FOR COMPANIES IN THE LUMBER INDUSTRY
Salem Y. Lakhal, Ph.D.1* and Souad H’Mida, Ph.D.2 1Faculty of Business Administration, Phone: +(506) 858 4601, Fax: +(506) 858 4093. University of
Moncton, Moncton, NB, E1A 3E9, Canada, E-mail: [email protected]
2 Faculty of Business Administration, Phone: +(506) 863 2035, Fax: +(506) 858 4093 University of Moncton, Moncton, NB, E1A 3E9, Canada, E-mail: [email protected]
Abstract
This research studies the environmental dimensions, policies, operations, and technologies
of companies in the lumber industry. It proposes an analysis of the supply chain from
suppliers to clients and focuses on specific actions related to the following: (i) reduction of
contaminants; (ii) analysis of the operations process; and (iii) development of parameters
and characteristics, which can evolve into a benchmarking system for measuring greenness
efforts of lumber industry companies. This analysis aims at defining the basic features of
an “Olympic” green supply chain, characterized by zero emissions, zero waste of resources,
zero waste in activities, zero use of toxics, zero waste in product life-cycle, and zero waste
( the five zeros analogous to the five circles in the Olympic flag), and green input and
output.
Keywords: Green supply chain, Wood industry, Environment, Kyoto Convention
1. Introduction
In the present days of globalization, leading corporations increasingly are coming to
appreciate the value of the supply chain as a competitive advantage, which has the
potential to enhance customer retention, revenue generation, cost reduction, and asset
utilization (GEMI, 2004). However, concern is growing about the impact that, through the
supply chain, business activities have on the environment, and efforts are underway to
develop appropriate policies, which would reduce adverse environmental repercussions.
The number of companies publishing environmental reports has been increasing rapidly
(Kokubu and Nashioka, 2001). Environmental reporting within the forest and paper
industries is around 56% according to Sinclair and Walton (2003) Furthermore, leading
companies are beginning to realize the importance of proactive environment management * Corresponding author
2
strategies, and to factor in environmental costs when making management decisions. These
measures, however, are still in early stages of development (Lee, 2001). For example, 35
leading American companies, members of the Global Environmental Management
Initiative, have acknowledged the competitive edge acquired by considering environmental
aspects in supply chain management (GEMI, 2004). This statement has been corroborated
by Hitchens et al. (2003), substantiating that improved environmental performance does
not translate into bad economic management. Similarly, strong environmental policies do
not weaken the competitive advantage of a company. Rather, any company that has a
long-term vision is likely to excel both in the short-term and the long-term. Corporate
environmental initiatives are on the rise in North America, while Japanese firms remain
leaders in this field (Imai, 2001).
However, while environmental awareness has increased, the corporate response towards
environmental sustainability is marred by the absence of an agreed upon set of operational
environment assessment tools. In this paper, we seek to fill this gap by suggesting a supply
mechanism that embraces the environment-friendly dimensions of a “green supply chain.”
The existing knowledge of the "green" aspect of the supply chain is still in its embryonic
stage and much remains to be done (Bjorndalen et al., 2005; Khan et al., 2005b; Lakhal
and H'Mida, 2003; Robert, 1999; Sarkis, 2003) to develop its evaluation tools (Bolli and
Emtairah, 2001; Cox, 1999; Lakhal and H'Mida, 2003). While research on environmental
benchmarking remains relatively sparse, it is evident that companies are interested in
learning about methodologies, which ensure the integration of environmental
considerations in all supply chain activities. (See for example Auramo et al., 2002; Cox,
1999; Kleijnen and Smith, 2003; Robert, 1999).
The design, construction, and maintenance of buildings have a tremendous impact on our
environment and our natural resources. Based on the information available on the website
of Smart Community Network (http://www.sustainable.doe.gov/buildings/gbintro.shtml),
buildings use one-third of all the energy consumed in the US, and two-thirds of all
electricity. Therefore, wood product companies must work to be sustainable, especially if
they are to survive today's world of rapid changes in technology, increasing complexity in
products, and strong competition. These factors require companies, among other things, to
integrate environmental protection dimensions into their supply chain operations. The
development of customer awareness about ecological problems of forest product industries
puts the lumber industry companies into the center of interest of the home building
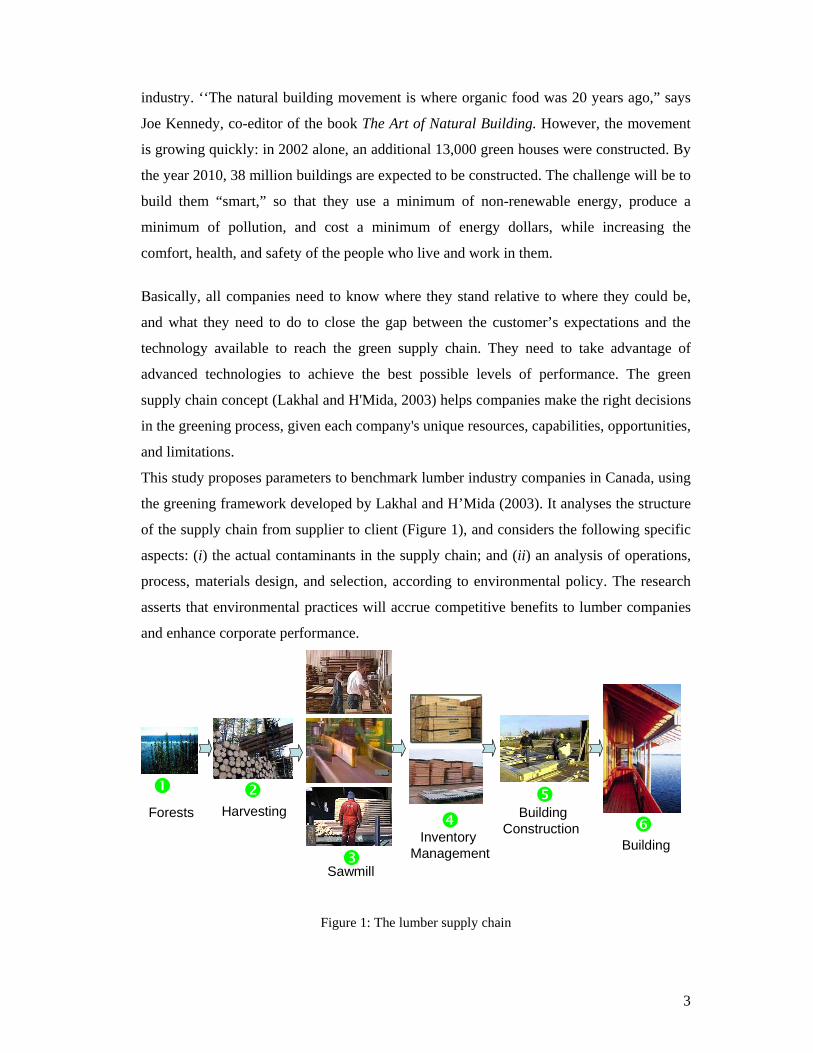
3
industry. ‘‘The natural building movement is where organic food was 20 years ago,” says
Joe Kennedy, co-editor of the book The Art of Natural Building. However, the movement
is growing quickly: in 2002 alone, an additional 13,000 green houses were constructed. By
the year 2010, 38 million buildings are expected to be constructed. The challenge will be to
build them “smart,” so that they use a minimum of non-renewable energy, produce a
minimum of pollution, and cost a minimum of energy dollars, while increasing the
comfort, health, and safety of the people who live and work in them.
Basically, all companies need to know where they stand relative to where they could be,
and what they need to do to close the gap between the customer’s expectations and the
technology available to reach the green supply chain. They need to take advantage of
advanced technologies to achieve the best possible levels of performance. The green
supply chain concept (Lakhal and H'Mida, 2003) helps companies make the right decisions
in the greening process, given each company's unique resources, capabilities, opportunities,
and limitations.
This study proposes parameters to benchmark lumber industry companies in Canada, using
the greening framework developed by Lakhal and H’Mida (2003). It analyses the structure
of the supply chain from supplier to client (Figure 1), and considers the following specific
aspects: (i) the actual contaminants in the supply chain; and (ii) an analysis of operations,
process, materials design, and selection, according to environmental policy. The research
asserts that environmental practices will accrue competitive benefits to lumber companies
and enhance corporate performance.
Figure 1: The lumber supply chain
Forests
Sawmill
Inventory Management
BuildingConstruction
Harvesting
Building
4
This paper is organized as follows: Section 2 opens with a brief review of the available
literature on the green supply chain. Section 3 proposes a functional model of an
“Olympic” green supply chain for a lumber industry company. Section 4 offers concluding
comments and guidelines for future research.
2. Literature review
No research has been conducted on a green supply chain in the lumber industry. Therefore,
this review covers the small amount of literature that is available on green supply chain in
general. We have listed nearly ten papers that deal with the topic. The central concern of
this literature has been to investigate the relationship between environmental management
activity of suppliers and firms, and to study the structure of customer-supplier
manufacturing patterns. Simpson and Power (2005) developed a model for approaching
issues in the environmental performance of the supplier, and Zhu and Sarkis (2005) used
regression analysis to examine the relationship between green supply chain practices and
economic performance. Preuss (2001) studied purchasing patterns of Scottish
manufacturing companies. He introduces the notion of Green Multiplier Effect, suggesting
that purchasing could become an important agent of change towards environmental
initiatives in the supply chain. Three industries were studied in this corpus of research:
paper making, chemicals, and electronics. Evidently, some concepts need more elaboration
and clarification, as shown by Seuring (2004). He assimilates product life-cycle into the
supply chain and discusses environmental aspects of inter-organizational management:
life-cycle management, closed-loop supply chains, integrated chain management, and
green/environmental or sustainable supply chain management. However, Seuring is not
clear about how these concepts relate to each other, and if or how they are different. Rarely
do these researchers suggested models to assess green supply chains. Lakhal and H'Mida
(2004) suggested a framework for a green supply chain, using gap analysis to compare
structural patterns of different supply chains. In marketing research, Georgiadis and
Vlachos (2004) studied the effects of the ‘green image’ on customer demand. Rios et al.
(2003) worked on the disassembling process and developed a model that uses electronic
products to study scenarios in which a recycler identifies and separates high-value
engineering plastics and metals. Murphy and Poist (2003) conducted an empirical study of
the relationship between logistics and environment, confirming that greenness would
broaden the scope of logistics, and influence the way logistics’ managers do their jobs.
Finally, Rao (2002) used a survey questionnaire to determine the extent of greening taking
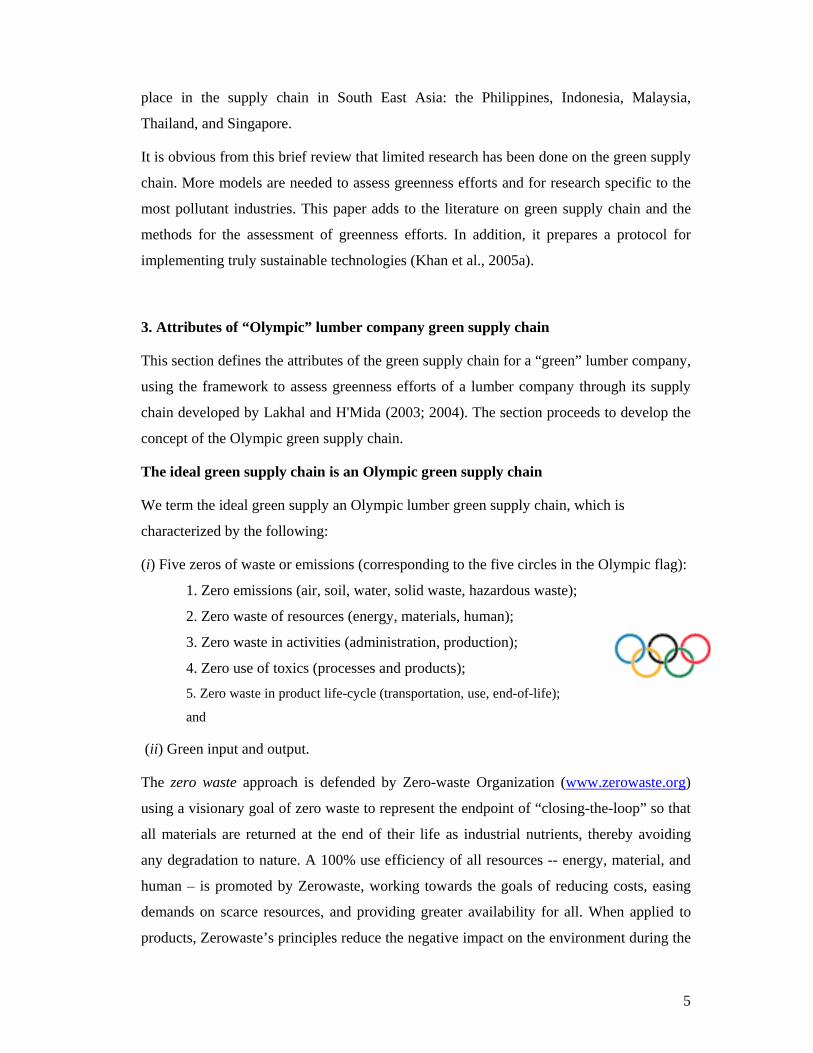
5
place in the supply chain in South East Asia: the Philippines, Indonesia, Malaysia,
Thailand, and Singapore.
It is obvious from this brief review that limited research has been done on the green supply
chain. More models are needed to assess greenness efforts and for research specific to the
most pollutant industries. This paper adds to the literature on green supply chain and the
methods for the assessment of greenness efforts. In addition, it prepares a protocol for
implementing truly sustainable technologies (Khan et al., 2005a).
3. Attributes of “Olympic” lumber company green supply chain
This section defines the attributes of the green supply chain for a “green” lumber company,
using the framework to assess greenness efforts of a lumber company through its supply
chain developed by Lakhal and H'Mida (2003; 2004). The section proceeds to develop the
concept of the Olympic green supply chain.
The ideal green supply chain is an Olympic green supply chain
We term the ideal green supply an Olympic lumber green supply chain, which is
characterized by the following:
(i) Five zeros of waste or emissions (corresponding to the five circles in the Olympic flag):
1. Zero emissions (air, soil, water, solid waste, hazardous waste);
2. Zero waste of resources (energy, materials, human);
3. Zero waste in activities (administration, production);
4. Zero use of toxics (processes and products);
5. Zero waste in product life-cycle (transportation, use, end-of-life);
and
(ii) Green input and output.
The zero waste approach is defended by Zero-waste Organization (www.zerowaste.org)
using a visionary goal of zero waste to represent the endpoint of “closing-the-loop” so that
all materials are returned at the end of their life as industrial nutrients, thereby avoiding
any degradation to nature. A 100% use efficiency of all resources -- energy, material, and
human – is promoted by Zerowaste, working towards the goals of reducing costs, easing
demands on scarce resources, and providing greater availability for all. When applied to
products, Zerowaste’s principles reduce the negative impact on the environment during the
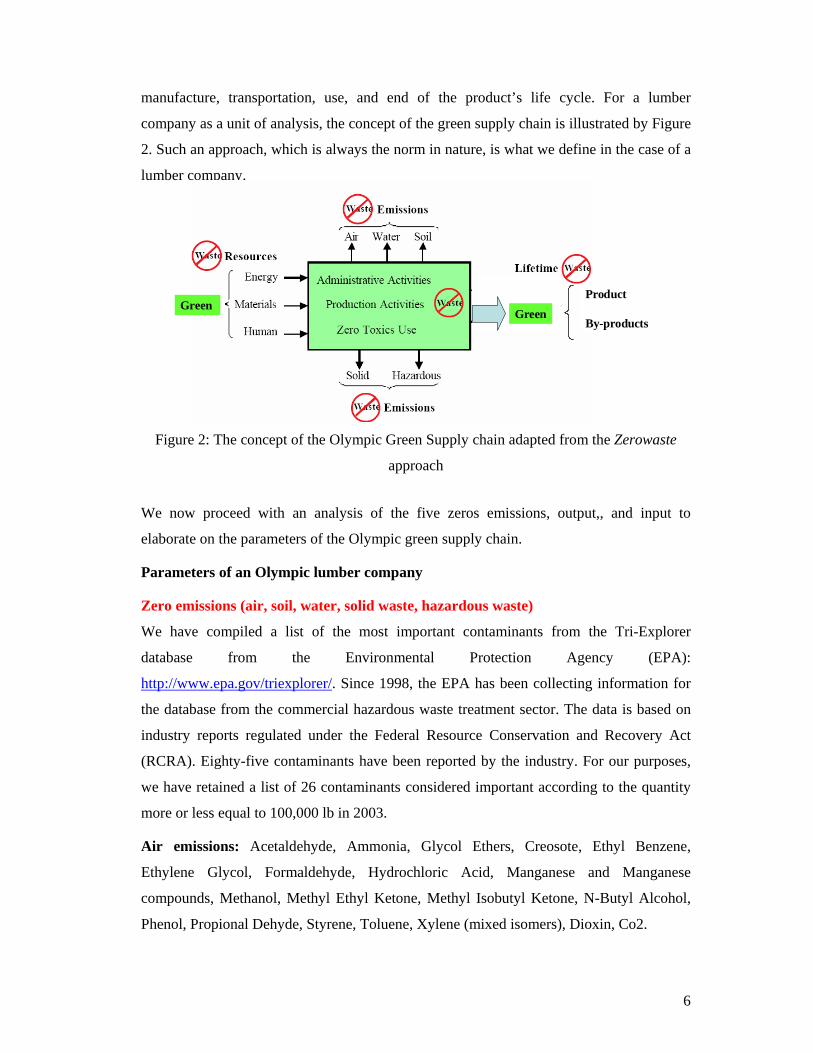
6
manufacture, transportation, use, and end of the product’s life cycle. For a lumber
company as a unit of analysis, the concept of the green supply chain is illustrated by Figure
2. Such an approach, which is always the norm in nature, is what we define in the case of a
lumber company.
Figure 2: The concept of the Olympic Green Supply chain adapted from the Zerowaste
approach
We now proceed with an analysis of the five zeros emissions, output,, and input to
elaborate on the parameters of the Olympic green supply chain.
Parameters of an Olympic lumber company
Zero emissions (air, soil, water, solid waste, hazardous waste)
We have compiled a list of the most important contaminants from the Tri-Explorer
database from the Environmental Protection Agency (EPA):
http://www.epa.gov/triexplorer/. Since 1998, the EPA has been collecting information for
the database from the commercial hazardous waste treatment sector. The data is based on
industry reports regulated under the Federal Resource Conservation and Recovery Act
(RCRA). Eighty-five contaminants have been reported by the industry. For our purposes,
we have retained a list of 26 contaminants considered important according to the quantity
more or less equal to 100,000 lb in 2003.
Air emissions: Acetaldehyde, Ammonia, Glycol Ethers, Creosote, Ethyl Benzene,
Ethylene Glycol, Formaldehyde, Hydrochloric Acid, Manganese and Manganese
compounds, Methanol, Methyl Ethyl Ketone, Methyl Isobutyl Ketone, N-Butyl Alcohol,
Phenol, Propional Dehyde, Styrene, Toluene, Xylene (mixed isomers), Dioxin, Co2.
Product
By-productsGreen
Product
By-productsGreen
Green
7
Soil emissions (landfills): Arsenic Compounds, Chromium Compounds, Copper
Compounds, Creosote, Manganese and Manganese compounds, Methyl Ethyl Ketone,
Pentachlorophenol, Zinc Compounds, Mercury.
In Canada, for example significantly, only four contaminants were tracked: Chromium
(and its compounds), Copper (and its compounds), Dioxins and Furans, and
Hexachlorobenzene (Environment-Canada, 2005a). Furthermore, based on the American
lumber industry’s declaration,. the industry emission of the Hexachlorobenzene seems to
be insignificant (15 lbs in the U.S. was declared in 2003).
The occupational standard of respirable particle concentrations at the sawmill are 5mg/m3.
In evaluating workers at a pine and spruce processing sawmill in west central Alberta,
Hessel et al. (1995) found that the airway dysfunction causing a degree of airway
obstruction occurred at respirable dust levels below the occupational standard of 5mg/m3. .
According to authors, histories of acute bronchitis and asthma were reported in a
significant number of workers with more than three years of employment in the sawmill.
Primary Hazardous/solid wastes:
In the lumber industry, sawmill workers and woodworkers are considered high risk for
contracting occupational asthma (Probable Occupational Asthma) (JOHNSON et al., 2000).
The association between exposure to wood dust and respiratory symptoms was examined
in mill workers by (Liou et al., 1996). The authors concluded that high levels of wood dust
exposure in the wood mill industries may cause pulmonary damage; engineering controls
and industrial hygiene were recommended. Total dust concentrations from grinding and
screening in the high exposure work areas ranged from 4.4 to 22.4mg/m3, and the
respirable proportions were between 2.4% and 50.2%. The dust level in sawing work was
2.9 mg/m3. These results are corroborated by Malo et al. (1994), who found that asthmatic
symptoms appeared to be of occupational origin in 59 % of workers after 30 months of
work.
Risks of nasal cancer and nonmalignant nasal pathology among woodworkers in North
America was reviewed in detail and contrasted with experiences in Europe and elsewhere
by Blot et al. (1997). Considering the totality of evidence on the risk of cancer in exposed
workers, it appears that wood-dust-related nasal adenocarcinoma essentially can be
8
eliminated in Europe and its occurrence prevented in the United States if wood-dust
exposures do not exceed an eight-hour, time-weighted average of 5 mg/m3 standard.
Zero waste of resources (energy, materials, and human),
In Canada, lumber drying accounts for a significant portion of the total energy used in
lumber production, and energy costs represent a large portion of production costs.
According to Natural Resources Canada (NRC) (2005), dry kilns consume an estimated
121 petajoules (PJ) of energy annually, 57% of which is fossil-fuel energy, and emit
roughly 3.5 MT/year of CO2. It is important to have kilns energy efficient. Evidently, this
not the case in Canada where a large percentage of the kilns used in the industry are aging
and not very energy efficient. A reduction in kiln energy consumption would allow the
sector to increase its competitiveness and to have a greener supply chain by decreasing
greenhouse gas (GHG) emissions. In fact, a reduction in energy consumption by 25% and
considering a 15% penetration rate would result in a 3.5 MT reduction in CO2 emissions
over twenty years (NRC 2005).
To reduce loss, the effective use of materials throughout the stages of lumber goods
production is examined, as is the reduction of raw material use by cutting down the amount
of wood used in products and their wrapping and packing. The target is the reduction of the
amount of resource depletion through the use of recycled materials.
Like the manufacturing industry, labor costs constitute a high percentage of expenses. The
waste of human resources could be measured by ratios of accident (number of work
accidents / number of employers), and absenteeism due to illness (number of days lost for
illness / number of work days x number of employees). In an Olympic lumber company,
ratios of accident and absenteeism would be near zero.
Zero waste in administration activities
Zero waste in administration
Considerable cost savings could be achieved by using resource-efficient products and good
environmental practices. Good practices should target energy-efficiency, waste reduction,
water conservation, and other resource-efficient practices for the environment. By taking
advantage of these practices, lumber companies can avoid resource waste and save money.
An Olympic lumber process should have a list of good practices and should encourage
employers and employees to respect them. For example, one workstation (computer and
monitor) left running after business hours, causes power plants to emit nearly one ton of
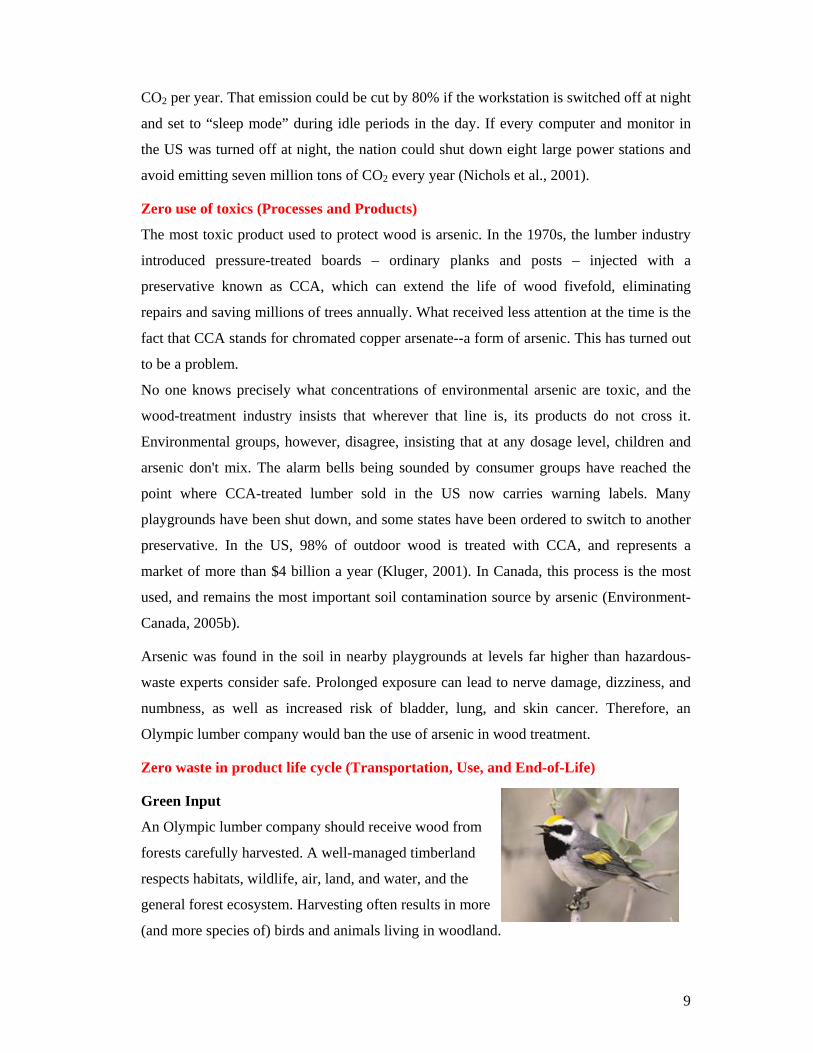
9
CO2 per year. That emission could be cut by 80% if the workstation is switched off at night
and set to “sleep mode” during idle periods in the day. If every computer and monitor in
the US was turned off at night, the nation could shut down eight large power stations and
avoid emitting seven million tons of CO2 every year (Nichols et al., 2001).
Zero use of toxics (Processes and Products)
The most toxic product used to protect wood is arsenic. In the 1970s, the lumber industry
introduced pressure-treated boards – ordinary planks and posts – injected with a
preservative known as CCA, which can extend the life of wood fivefold, eliminating
repairs and saving millions of trees annually. What received less attention at the time is the
fact that CCA stands for chromated copper arsenate--a form of arsenic. This has turned out
to be a problem.
No one knows precisely what concentrations of environmental arsenic are toxic, and the
wood-treatment industry insists that wherever that line is, its products do not cross it.
Environmental groups, however, disagree, insisting that at any dosage level, children and
arsenic don't mix. The alarm bells being sounded by consumer groups have reached the
point where CCA-treated lumber sold in the US now carries warning labels. Many
playgrounds have been shut down, and some states have been ordered to switch to another
preservative. In the US, 98% of outdoor wood is treated with CCA, and represents a
market of more than $4 billion a year (Kluger, 2001). In Canada, this process is the most
used, and remains the most important soil contamination source by arsenic (Environment-
Canada, 2005b).
Arsenic was found in the soil in nearby playgrounds at levels far higher than hazardous-
waste experts consider safe. Prolonged exposure can lead to nerve damage, dizziness, and
numbness, as well as increased risk of bladder, lung, and skin cancer. Therefore, an
Olympic lumber company would ban the use of arsenic in wood treatment.
Zero waste in product life cycle (Transportation, Use, and End-of-Life)
Green Input
An Olympic lumber company should receive wood from
forests carefully harvested. A well-managed timberland
respects habitats, wildlife, air, land, and water, and the
general forest ecosystem. Harvesting often results in more
(and more species of) birds and animals living in woodland.
10
Sustainable forests generate income while improving the environment. It is rooted in the
present and the future.
Whatever CCA's ultimate fate, the existing problem probably will remain when disposing
of treated wood with CCA. Dumping it in an unlined landfill allows arsenic to seep
underground; mulching it scatters CCA on the surface; and burning it fills the air with
toxic smoke. Leaving the structures to disintegrate on their own could take long time.
An Olympic green lumber supply chain would only use biodegradable input to assure a
green output.
Green output
Green output is obtained if green input is used through the supply chain in the lumber
processing. A green output could be assured by certification becoming an important tool
to demonstrate that the lumber company is operating according to a set of principles and
criteria determined by a particular certification program. In the wood industry, one result
of a study conducted in U.S. (Vlosky and Gazo, 2003) indicates a lack of significant
awareness of certification. An average of a third of respondents declared that they had no
understanding of the certifier services and objective. A third of of the respondents had not
heard of the certifiers.
Greenness effort to be an Olympic Lumber company
A lumber company does not easily reach the Olympic stage, which is why stages in the process
should be considered. The efforts utilised to reach the Olympic stage could be designated as
“greenness efforts,” and the company would receive recognition at each stage. We define
greenness efforts as the difference between regulated contaminant levels and average real
contaminant levels. If no regulations exist, the industry average should be considered. This
difference should be positive or equal to zero. This way, the lumber company must comply
with any regulations in place. Clearly, each greenness effort would have to be specific to
its region. Even in one country, it could vary from one region to another. In Canada, for
example, the regulation could vary from one Province to another.
4. Concluding remarks
This research defines the main characteristics of the green supply chain of a lumber
company, applying the framework developed by Lakhal and H’mida (2003). It develops
the concept of the Olympic green supply chain, characterized by five zeros recalling the
five-circled flag of the Olympics: zero emissions, zero waste of resources, zero waste in
11
activities, zero use of toxics, zero waste in product life-cycle, in addition to green input and
green output. This research can serve as the cornerstone of a green supply chain
assessment mechanism, where practical solutions may be generated to improve greenness
levels in supply chain operations. This research aims at ensuring the sustainable
development of the Canadian lumber companies’ sector, and at maximizing its contribution
to the economic and social well-being of the Canadian nation.
Acknowledgements
This research was funded by the Social Sciences and Humanities Research Council of
Canada (SCHRC) 410-2004-1384, the New Brunswick Innovation Foundation (FINB), the
Society of Management Accountants of Canada (CMA), and Université de Moncton,
Canada.
References
Auramo, J., Aminiff, A., and Punakivi., M. (2002). Research Agenda for e-Business Logistics Based on Professional Opinions. International Journal of Physical Distribution & Logistics 32, 513-523.
Bjorndalen, N., Mustafiz, S., and Islam, M. R. (2005). No-Flare Design: Converting Waste to Value Addition. Energy Sources 27.
Blot, W. J., Chow, W.-H., and McLaughlin, J. K. (1997). Wood Dust and Nasal Cancer Risk: A Review of the Evidence from North America. Journal of Occupational & Environmental Medicine 39, 148-156.
Bolli, A., and Emtairah, T. (2001). "Environmental benchmarking for local authorities: from concept to practice, Environmental Issues." International Institute for Industrial Environmental Economics,, Sweden.
Cox, A. C., A. (1999). "A Research Agenda for Supply Chain and Business Management Thinking." Supply Chain Management. 4, 209-214.
Environment-Canada (2005a). National Pollutant Release Inventory. http://www.environment-canada.ca/pdb/npri/npri_home_e.cfm.
Environment-Canada (2005b). "Toxic Chemicals in Atlantic Canada - Arsenic." http://www.ns.ec.gc.ca/epb/envfacts/arsenic.html.
GEMI (2004). "Enhancing Supply Chain Value Through Environmental Excellence." Global Environmental Management Initiative, Washington, D.C. 20005.
Georgiadis, P., and Vlachos, D. (2004). The effect of environmental parameters on product recovery. European Journal of Operational Research 157, 449.
Hessel, P. A., Herbert, F. A., Melenka, L. S., Yoshida, K., Michaelchuk, D., and Nakaza, M. (1995). Lung health in sawmill workers exposed to pine and spruce. Chest 108, 642-646.
12
Imai, S. (2001). "Case Study of Japanese Companies’: Environmental Accounting in Asia." In "International Forum on Business and the Environment", pp. 13-25. Ministry of the Environment, Japan, Japan, September 27-29,.
Johnson, A. R., Dimich-Ward, H. D., Manfreda, J., Becklake, M. R., Ernst, P., Sears, M. R., Bowie, D. M., Sweet, L., and Chan-Yeung, M. (2000). "Occupational Asthma in Adults in Six Canadian Communities." American Journal of Respiratory and Critical Care Medicine 162.
Khan, M. I., Zatzman, G. M., and Islam, M. R. (2005a). A Novel Sustainability Criterion as Applied in Developing Technologies and Management Tools. In "Second International Conference on Sustainable Planning and Development." Bologna, Italy.
Khan, M. M., Prior, D., and Islam, M. R. (2005b). Environment-friendly Wood Panels for Healthy Homes. In "Int. Chemical Engineering Conference", Jordan, Sept. 2005.
Kleijnen, J., and Smith, M. T. (2003). Performance Metrics in Supply Chain Management. The Journal of Operations Management Research Society 54, 507-527.
Kluger, J. (2001). Toxic Playgrounds. Time.com 158.
Kokubu, K., and Nashioka, E. (2001). Environmental Accounting Practices of Listed Companies in Japan. In "International Forum on Business and the Environment", pp. 13-25. Ministry of the Environment, Japan, Japan, September 27-29,.
Lakhal, S. Y., and H'Mida, S. (2003). A Gap Analysis for Green Supply Chain Benchmarking. In "32th International Conference on Computers & Industrial Engineering", Vol. Vol. 1, pp. 1: 44-49., Ireland, August 11- 13th, 2003.
Lakhal, S. Y., and H'Mida, S. (2004). A model for Assessing the Greenness Effort in a Supply Chain. In "35th Decision Sciences Institute Annual Meeting", pp. 5331-5341. Decision Science Institute, Boston, USA.
Lee, B.-W. (2001). "Environmental Accounting in Korea: Cases and Policy Options." In "International Forum on Business and the Environment", pp. 13-25. Ministry of the Environment, Japan, Japan, September 27-29.
Liou, S.-H., Cheng, S.-Y., Lai, F.-M., and Yang, J.-L. (1996). Respiratory symptoms and pulmonary function in mill workers exposed to wood dust. American Journal of Industrial Medicine 30, 293-299.
Malo, J., Cartier, A., L'Archevèque, J., Trudeau, C., Courteau, J., and Bherer, d. L. (1994). Prevalence of occupational asthma among workers exposed to eastern white cedar. American Journal of Respiratory and Critical Care Medicine 150, 1697-1994.
Murphy, P. R., and Poist, R. F. (2003). Green perspectives and practices: A "comparative logistics" study. Supply Chain Management 8, 122.
Nichols, C., Anderson, S., and Saltzman, D. (2001). "A Guide to Greening Your Bottom Line Through a Resource-Efficient Office Environment." City of Portland, Office of Sustainable Development, Portland.
Preuss, L. (2001). In dirty chains? Purchasing and greener manufacturing. Journal of Business Ethics 34, 345.
Rao, P. (2002). Greening the supply chain: A new initiative in South East Asia. International Journal of Operations & Production Management 22, 632.
13
Rios, P., Stuart, J. A., and Grant, E. (2003). Plastics disassembly versus bulk recycling: Engineering design for end-of-life electronics resource recovery. Environmental Science & Technology 37, 5463.
Robert, A. (1999). Integrating Environmental Issues into the mainstream: An Agenda for Research in Operations Management. Journal of Operations Management 17, 575-599.
Sarkis, J. (2003). "A Strategic Decision Framework for Green Supply Chain Management." Journal of Cleaner Production 11, 397-409.
Seuring, S. (2004). "Industrial ecology, life cycles, supply chains: differences and interrelations." Business Strategy and the Environment 13, 306.
Sharma, S. (2001). "Different Strokes: Regulatory Styles and Environmental Strategy in the North-American Oil and Gas Industry." Business Strategy and the Environment 10, 344-364.
Simpson, D. F., and Power, D. J. (2005). Use the supply relationship to develop lean and green suppliers. Supply Chain Management 10, 60.
Sinclair, P., and Walton, J. (2003). Environmental reporting within the forest and paper industry. Business Strategy and the Environment. Chichester 12, 326-337.
Vlosky, R. P., and Gazo, R. (2003). What do Manufacturers Think about Certification? FDM 75, 76-79.
Zhu, Q., and Sarkis, J. (2005). The link between quality management and environmental management in firms of differing size: An analysis of organizations in China. Environmental Quality Management 13, 53-63.