designing with management reporting for oracle … with drill to content 3-61 defining drill to...
TRANSCRIPT
Oracle® CloudDesigning with Management Reporting forOracle Enterprise Performance ReportingCloud
E94364-05

Oracle Cloud Designing with Management Reporting for Oracle Enterprise Performance Reporting Cloud,
E94364-05
Copyright © 2016, 2018, Oracle and/or its affiliates. All rights reserved.
Primary Author: EPM Information Development Team
This software and related documentation are provided under a license agreement containing restrictions onuse and disclosure and are protected by intellectual property laws. Except as expressly permitted in yourlicense agreement or allowed by law, you may not use, copy, reproduce, translate, broadcast, modify,license, transmit, distribute, exhibit, perform, publish, or display any part, in any form, or by any means.Reverse engineering, disassembly, or decompilation of this software, unless required by law forinteroperability, is prohibited.
The information contained herein is subject to change without notice and is not warranted to be error-free. Ifyou find any errors, please report them to us in writing.
If this is software or related documentation that is delivered to the U.S. Government or anyone licensing it onbehalf of the U.S. Government, then the following notice is applicable:
U.S. GOVERNMENT END USERS: Oracle programs, including any operating system, integrated software,any programs installed on the hardware, and/or documentation, delivered to U.S. Government end users are"commercial computer software" pursuant to the applicable Federal Acquisition Regulation and agency-specific supplemental regulations. As such, use, duplication, disclosure, modification, and adaptation of theprograms, including any operating system, integrated software, any programs installed on the hardware,and/or documentation, shall be subject to license terms and license restrictions applicable to the programs.No other rights are granted to the U.S. Government.
This software or hardware is developed for general use in a variety of information management applications.It is not developed or intended for use in any inherently dangerous applications, including applications thatmay create a risk of personal injury. If you use this software or hardware in dangerous applications, then youshall be responsible to take all appropriate fail-safe, backup, redundancy, and other measures to ensure itssafe use. Oracle Corporation and its affiliates disclaim any liability for any damages caused by use of thissoftware or hardware in dangerous applications.
Oracle and Java are registered trademarks of Oracle and/or its affiliates. Other names may be trademarks oftheir respective owners.
Intel and Intel Xeon are trademarks or registered trademarks of Intel Corporation. All SPARC trademarks areused under license and are trademarks or registered trademarks of SPARC International, Inc. AMD, Opteron,the AMD logo, and the AMD Opteron logo are trademarks or registered trademarks of Advanced MicroDevices. UNIX is a registered trademark of The Open Group.
This software or hardware and documentation may provide access to or information about content, products,and services from third parties. Oracle Corporation and its affiliates are not responsible for and expresslydisclaim all warranties of any kind with respect to third-party content, products, and services unless otherwiseset forth in an applicable agreement between you and Oracle. Oracle Corporation and its affiliates will not beresponsible for any loss, costs, or damages incurred due to your access to or use of third-party content,products, or services, except as set forth in an applicable agreement between you and Oracle.
Contents
Documentation Accessibility
Documentation Feedback
1 Overview of Management Reporting
Learning About Management Reporting 1-1
Management Reporting Components 1-1
2 Designing Reports
Before Designing a Report 2-1
About Data Sources 2-1
Data Source Overview 2-2
Creating and Editing Data Source Connections 2-2
Working with the Report Designer 2-5
Accessing the Report Designer 2-5
About the Report Designer 2-5
Report Designer Toolbar 2-6
Report Properties 2-8
Working with Report Objects 2-9
Inserting Report Objects 2-9
Resizing, Editing, and Repositioning Report Objects 2-10
Copying/Moving Report Objects Across Sheets 2-11
Learning about the Point of View 2-12
Point of View Overview 2-12
Global versus Local Point of View 2-13
Using Text Functions to Display Information 2-14
Correcting Report Errors 2-15
iii
3 Working With Grids
About Grids 3-1
Adding a Grid 3-2
About Grid Designer 3-2
Grid Properties 3-3
Formatting Grid Cells 3-6
Formatting Best Practices 3-10
Grid Toolbar 3-11
Defining the Grid Point of View 3-12
About the Grid Point of View 3-12
Working with the Point of View 3-13
Setting Up the Point of View 3-14
Displaying the Printable Page Member 3-15
Attribute Dimensions and the Point of View 3-18
Point of View Examples 3-19
Working With Rows and Columns in Grids 3-27
Inserting Rows and Columns 3-27
Copying, Moving, and Deleting Rows and Columns 3-28
Hiding Rows or Columns 3-28
Merging and Separating Rows or Columns 3-29
Inserting Page Breaks Before a Row or Column 3-30
Defining Formula Rows and Columns 3-31
Inserting a Formula Row or Column 3-31
Calculating at the Cell Level 3-31
Using the Formula Bar 3-32
Creating Formulas 3-32
Example Report with Formulas 3-33
Modifying Member Selection Using the Formula Bar 3-34
Working with Conditional Formatting and Suppression 3-35
Creating a Condition 3-35
Conditional Formatting Example 3-37
Conditional Suppression Example 3-39
Conditional Formatting and Suppression Indicators and Tooltips 3-41
Managing Conditions 3-42
Conditional Formatting and Suppression Considerations 3-43
Conditional Formatting and Suppression Criteria and Parameters 3-45
Zooming on Parent Members in Grids 3-55
Grid-level Zooming 3-56
Row/Column Segment-level Zooming 3-58
Ad hoc Zooming 3-60
iv
Working with Drill To Content 3-62
Defining Drill To Content Links 3-62
Managing Drill To Content Definitions 3-64
Passing the Point of View to the Target Report 3-65
Examples of Drill to Content Results in Grid Cells 3-65
Drilling to Cell File Attachments 3-67
4 Working With Text Boxes
Adding a Text Box 4-1
Formatting Text Boxes 4-1
5 Working With Images
Inserting Images 5-1
Formatting Images 5-1
6 Working With Charts
About Charts 6-1
Inserting a Chart 6-2
About Chart Designer 6-2
Chart Designer Views 6-3
Chart Properties 6-3
Understanding the Dual Y Axis in Charts 6-4
About Waterfall Charts 6-8
About Scatter and Bubble Charts 6-10
7 Defining Members
About Defining Members 7-1
Assigning Members 7-2
Assigning Members to Data Rows or Columns 7-2
Assigning Members Using Functions 7-3
Functions Available Through Member Selection 7-4
Example: Combining the Intersect and Except Functions 7-8
Assigning Members Using Prompts 7-10
Working with Substitution Variables 7-14
Overriding a Data Row or Column Heading 7-14
Searching For Members 7-15
Previewing Selected Members 7-16
Working with Saved Member Selections 7-16
v

Creating, Editing, Deleting, Renaming and Duplicating Saved MemberSelections 7-16
Using Saved Selections in Member Selection 7-17
Suppressing Shared Members 7-18
Showing Supporting Detail 7-18
8 Using Functions
Mathematical Functions 8-1
About Mathematical Functions 8-1
Arguments in Mathematical Functions 8-2
Mathematical Operators in Expressions 8-3
Mathematical Operands in Expressions 8-5
Natural Precedence 8-5
Absolute 8-5
Average 8-6
AverageA 8-7
Count 8-8
CountA 8-8
Difference 8-9
Eval 8-10
IFThen 8-11
Max 8-11
Min 8-11
PercentofTotal 8-12
Product 8-13
Rank 8-14
Round 8-16
Sum 8-17
Truncate 8-17
Variance 8-18
Expected Results Using Essbase 8-19
Expected Results Using EPM Cloud 8-19
Variance Behavior 8-19
Examples 8-19
VariancePercent 8-20
Expected Results Using Essbase 8-20
Expected Results Using EPM Cloud 8-21
VariancePercent Behavior 8-21
Examples 8-21
Text Functions 8-22
About Text Functions 8-22
vi
Text Function Considerations 8-23
Parameters for Text Functions 8-23
CellText 8-25
CellValue 8-25
ColumnNumber/RowNumber 8-26
DateTime 8-27
HeadingValue 8-29
Left/Right/Mid 8-30
MemberAlias 8-31
MemberName 8-31
MemberProperty 8-32
PageCount 8-34
PageNumber 8-35
ReportAuthor 8-35
ReportCreatedOn 8-36
ReportDescription 8-36
ReportLocation 8-36
ReportModifiedBy 8-37
ReportModifiedOn 8-37
ReportName 8-37
ReportRunBy 8-38
Conditional Functions 8-38
IFThen,If 8-38
Conditional Operators 8-38
Complex Conditions 8-40
A Design Considerations
B Migrating Financial Reporting Reports to Management Reporting
Resolving Migration Validation Errors B-3
Differences between Financial Reporting and Management Reporting B-4
vii

Documentation Accessibility
For information about Oracle's commitment to accessibility, visit the OracleAccessibility Program website at http://www.oracle.com/pls/topic/lookup?ctx=acc&id=docacc.
Access to Oracle Support
Oracle customers that have purchased support have access to electronic supportthrough My Oracle Support. For information, visit http://www.oracle.com/pls/topic/lookup?ctx=acc&id=info or visit http://www.oracle.com/pls/topic/lookup?ctx=acc&id=trsif you are hearing impaired.
Documentation Accessibility
viii
Documentation Feedback
To provide feedback on this documentation, send email to [email protected],or, in an Oracle Help Center topic, click the Feedback button located beneath theTable of Contents (you may need to scroll down to see the button).
Follow EPM Information Development on these social media sites:
LinkedIn - http://www.linkedin.com/groups?gid=3127051&goback=.gmp_3127051
Twitter - http://twitter.com/hyperionepminfo
Facebook - http://www.facebook.com/pages/Hyperion-EPM-Info/102682103112642
Google+ - https://plus.google.com/106915048672979407731/#106915048672979407731/posts
YouTube - https://www.youtube.com/oracleepminthecloud
ix
1Overview of Management Reporting
Related Topics
• Learning About Management ReportingManagement Reporting is a cloud-based reporting solution for creating EPM cloudfinancial and managerial reports that enables users to insert charts and grids frommultiple EPM cloud sources, such as Oracle Enterprise Planning and BudgetingCloud and Oracle Financial Consolidation and Close Cloud, into a single report.
• Management Reporting ComponentsDesign management reports by using report components, report objects, and gridcomponents.
Learning About Management ReportingManagement Reporting is a cloud-based reporting solution for creating EPM cloudfinancial and managerial reports that enables users to insert charts and grids frommultiple EPM cloud sources, such as Oracle Enterprise Planning and Budgeting Cloudand Oracle Financial Consolidation and Close Cloud, into a single report.
You can embed Management Reporting reports into Oracle Enterprise PerformanceReporting Cloud report package doclets to integrate them in the collaborative narrativereporting process.
Key benefits of Management Reporting include:
• Combine cross-cloud content into a single report
• Embed grids and charts in report package doclets, with centralized point-of-viewcontrols and automatic doclet updates
• Report package variables provide ease of maintenance for changing the point ofview for reports embedded in a report package.
• Utilize grid row or column formulas to reference data in other grids
Management Reporting ComponentsDesign management reports by using report components, report objects, and gridcomponents.
Report Components
• Header—An area where you can display text on the top of each page of a report.You can also add images to a header.
• Report Body—The main area of the report where you can insert and displaygrids, charts, images and text boxes.
• Footer—An area where you can display text on the bottom of each printed page ofa report. You can also add images to a footer.
1-1
Report Objects
• Grid—A report object in which you retrieve data in the rows and columns.
• Chart—A report object that displays data from a grid. Charts are graphicalrepresentations of the data in a grid
• Text Box—A report object that can contain text, or functions that retrieve datasuch as report settings, data values, point of view (POV) values, or dimensionmembers.
• Image—A report object that contains a graphic or an image file. You can addimages to the body of the report and to a header or footer.
Grid Components
• Row—A horizontal display of information in a grid. A row can contain text, data, orderived data from a calculation. You can format individual rows in grids.
• Column—A vertical display of information in a grid. A column can contain text,data, or derived data from a calculation. You can format individual columns ingrids.
• Cell—An intersection of a row, column, page, and Point of View (POV) for a grid.You can format individual cells in a grid.
Chapter 1Management Reporting Components
1-2
2Designing Reports
Related Topics
• Before Designing a ReportAnswer these questions to get started designing a report.
• About Data SourcesData sources define how Management Reporting grids connect to cloud datasources.
• Working with the Report DesignerUse the report designer to add and edit report objects and view and edit reportproperties.
• Working with Report ObjectsReport objects include grids, text boxes, images, and charts.
• Learning about the Point of ViewThe Point of View identifies the data that will be pulled into a report.
• Using Text Functions to Display InformationText functions display report information such as the report name or description,information about a database associated with a grid, or information about data inyour database connection.
• Correcting Report ErrorsYou may encounter errors on the entire report, or on a specific report object.
Before Designing a ReportAnswer these questions to get started designing a report.
Before designing a report, consider:
• What is the goal of the report?
• Who are the end users of the report?
• How frequently is the report generated and by how many users?
• If the report is going to be inserted into a report package, which grids and chartswill be needed for that report package?
• What data sources will you need to connect to?
About Data SourcesData sources define how Management Reporting grids connect to cloud data sources.
Data sources enable you to maintain your connections on two levels:
• Global changes: Change all reports that use a specific connection to use adifferent connection. For example, all report grids that point to server1:cubetype1will now point to server2:cubetype2.
2-1
• Selective changes: For selected reports, change the connection to point to adifferent data source. For example, you have created two data sourceconnections, and half of your report grids point to connection1 while the other halfpoint to connection2. You can change the connection details for either connection1or connection2 without affecting the other grids.
Supported data sources include:
• Oracle Enterprise Performance Management Cloud, used for:
– Oracle Planning and Budgeting Cloud
– Oracle Enterprise Planning and Budgeting Cloud
– Oracle Financial Consolidation and Close Cloud
– Oracle Tax Reporting Cloud
• Oracle Essbase Cloud
• Oracle Profitability and Cost Management Cloud Essbase Provider
• Oracle Fusion Applications Essbase Provider
• Oracle Essbase Analytic Provider Services (APS)
Note:
Data source connections are created automatically when you deploy anOracle Enterprise Performance Reporting Cloud model. These data sourceconnections cannot be modified. They are automatically updated when themodel gets re-deployed, and deleted if the model or application gets deleted.
Data Source OverviewData source connections are stored in the Data Sources folder in the Library. Thisfolder is visible only to Report Administrators, and you must have that role to create,edit, or delete data source connections.
In addition to the Data Sources folder, you can also create and maintain data sourceconnections when you create a Management Reporting grid, or when you change theconnection for a selected report.
Creating and Editing Data Source ConnectionsTo create a data source connection:
1. From the Data Sources folder in the Library: click , and select Data Source.
2. In Data Source Name, enter a descriptive identifier for the data source, such as acombination of the source product, server, and application or database.
3. In Type, select the type of data source:
• Oracle Enterprise Performance Management Cloud, used for:
– Oracle Planning and Budgeting Cloud
Chapter 2About Data Sources
2-2
– Oracle Enterprise Planning and Budgeting Cloud
– Oracle Financial Consolidation and Close Cloud
– Oracle Tax Reporting Cloud
• Oracle Essbase Cloud
• Oracle Profitability and Cost Management Cloud Essbase Provider
• Oracle Fusion Applications Essbase Provider
• Oracle Essbase Analytic Provider Services (APS)
4. In Server Name, enter the data source server name with no protocol or URL. Forexample, for EPM Cloud, if data source URL is: https://<servername>/HyperionPlanning, the server name is: <servername>.
5. (Oracle Fusion Applications Essbase Provider and Oracle Essbase AnalyticProvider Services (APS) only): In Essbase Server Name, enter the name of theEssbase server. By default for Fusion Applications, the server name is"Essbase_FA_Cluster" and for Essbase APS, the server name is"EssbaseCluster-1".
6. In Identity Domain, enter the identity domain of the data source pod. (Notrequired for Oracle Essbase Cloud, Oracle Fusion Applications Essbase Provideror Oracle Essbase Analytic Provider Services (APS)).
7. Enter the administrator user ID and password.
Note:
You must log in to Oracle Enterprise Performance Reporting Cloud withthe administrator credentials for the data source that you want to createa connection to. For example, if your Oracle Enterprise Planning andBudgeting Cloud administrator is PlanAdmin, you must log in to OracleEnterprise Performance Reporting Cloud with the PlanAdmincredentials to create a data source connection to the Oracle EnterprisePlanning and Budgeting Cloud data source. Enter User ID and Passwordcredentials used for native authentication at the source. Single Sign-onwith Identity Assertion technologies is not supported.
8. Click Test Connection.
(Oracle Essbase Cloud only): Click Yes on the dialog box to trust the connection.This setting is stored so that you do not have to answer the question again.
9. After a successful connection, you can browse and select the application and cube
by selecting for application name and cube name.
After selecting a cube, click on to preview the dimension list.
Chapter 2About Data Sources
2-3

Figure 2-1 Data Source Connection Example
Figure 1 shows an example of a data source connection. Note that you do not need tospecify the data source server protocol (for example, https://) in the Server Namefield.
To edit a data source connection, select the connection and then select Edit from theActions menu. When you edit a connection, you can change the connection name,server, application and cube name.
• Changing the connection name does not affect any report objects that use theconnection.
• Changing the server, application, or application or cube names causes any reportobjects that use the connection to point to the new destination.
Note:
For security purposes, you must re-enter the administrator credentials whenediting a data source.
Chapter 2About Data Sources
2-4
Note:
If you are connecting to an on-premises Essbase cube behind a firewall, youmust open a port for Oracle Enterprise Performance Reporting Cloud inorder to connect to the data source. See “Managing Ports” in AdministeringOracle Analytics Cloud - Essbase. Also, Essbase Analytic Provider Servicesmust be running.
Working with the Report DesignerUse the report designer to add and edit report objects and view and edit reportproperties.
Related Topics
• Accessing the Report Designer
• About the Report Designer
• Report Designer Toolbar
• Report Properties
Accessing the Report DesignerYou access the report designer in the following ways:
• From the Library, in any non-system folder, click and select Report from themenu.
• From the reports panel, click .
• From the home screen, click Create, and select Report.
In the reports panel, you can filter the list of existing reports on Recent, Favorites,and All.
About the Report DesignerThe report designer has the following areas:
Chapter 2Working with the Report Designer
2-5
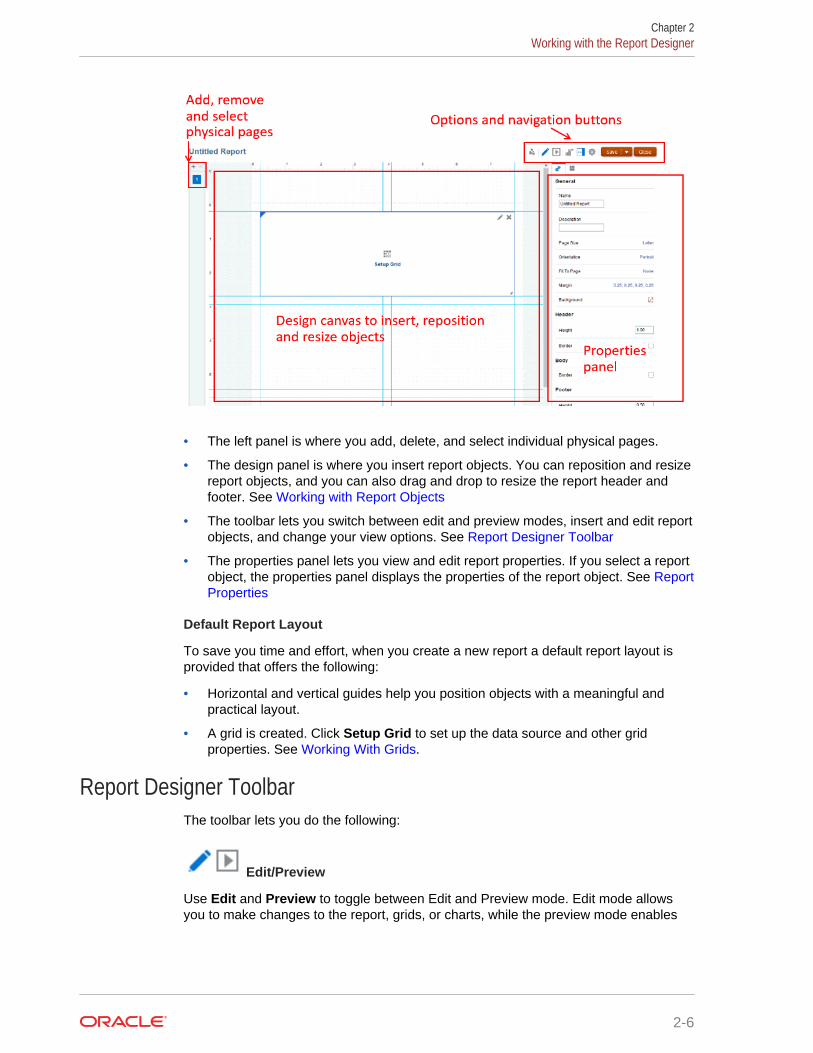
• The left panel is where you add, delete, and select individual physical pages.
• The design panel is where you insert report objects. You can reposition and resizereport objects, and you can also drag and drop to resize the report header andfooter. See Working with Report Objects
• The toolbar lets you switch between edit and preview modes, insert and edit reportobjects, and change your view options. See Report Designer Toolbar
• The properties panel lets you view and edit report properties. If you select a reportobject, the properties panel displays the properties of the report object. See ReportProperties
Default Report Layout
To save you time and effort, when you create a new report a default report layout isprovided that offers the following:
• Horizontal and vertical guides help you position objects with a meaningful andpractical layout.
• A grid is created. Click Setup Grid to set up the data source and other gridproperties. See Working With Grids.
Report Designer ToolbarThe toolbar lets you do the following:
Edit/Preview
Use Edit and Preview to toggle between Edit and Preview mode. Edit mode allowsyou to make changes to the report, grids, or charts, while the preview mode enables
Chapter 2Working with the Report Designer
2-6

you to see how the report will look when it is published. While in preview mode, use
to switch your preview between PDF and HTML.
Tip:
Depending on your browser settings, you may get a javascript error duringprocessing when you preview a report with large grids or charts in HTML.Check the Don't ask again check box, and then click Continue to continueon to the HTML preview.
Note:
If the report results are too large to be rendered in the browser, you areprompted to download the report as a PDF where you can either select
to download or to cancel the operation.
Insert
Use Insert to add report objects to the report. See Inserting Report Objects
Properties
Use Properties to display or hide the properties panel.
Actions
Use Actions to edit report objects and to control view options, such as grid lines,guides, and rulers.
Service Administrators can define a default font for management reports by selectingSet Default Font and selecting the font and size for the reports. This setting appliesthe default font to all reports for all users. Report Designers can still customize the fontin grid cell formatting, chart text and labels, and individual text boxes.
Note:
If a custom font is loaded, it can be set as the default font. See UploadingAdditional Fonts.
Chapter 2Working with the Report Designer
2-7
Note:
For Arabic fonts, only the following are supported in Management Reporting:
• Arial Unicode MS 1.01
• Lateef 1.0
• Scheherazade 1.0
• Simplified Arabic 1.01
• Simplified Arabic 5.00
• Simplified Arabic 5.92
• Traditional Arabic 1.01
• Traditional Arabic 5.00
• Traditional Arabic 5.92
Report PropertiesUse the properties panel to view and edit two types of properties in a report:
• General Properties
• Layout Properties
General Properties
General properties control the page settings for the report, such as page size andorientation, margins, and header and footer size. Changes made to the generalproperties affect all pages of a report.
Note:
Use the Border field to place borders around the report header, footer, andbody. You can adjust the header and footer size by dragging the header orfooter line on the design canvas.
Layout Properties
Layout properties affect the size and positioning of a selected report object, such asthe horizontal and vertical alignment and the size of the indent. Use the Placementfield to control the way the report object is printed on the page relative to other reportobjects:
• Fixed: Places the report object in a fixed location.
• Relative: Places the report object in a location relative to other report objects tothe left (Horizontal Position) or above it (Vertical Position). The selected reportobject adjusts its location when the size of the other report objects change.
Use the Border field to place borders around a report object. You can select theborder style and color.
Chapter 2Working with the Report Designer
2-8

Changes made to the layout properties affect only the selected report object. You mustselect a report object before you can view the layout properties.
Note:
When you edit a report object, the properties panel displays more detailedproperties for that object. For more information, see:
• Grid Properties
• Formatting Text Boxes
• Formatting Images
• Chart Properties
Working with Report ObjectsReport objects include grids, text boxes, images, and charts.
When you add report objects to a report, you define their position in the report layout.For grids and charts, you select the data source connection for the report object.
After you add a report object to a report, you can assign properties to it such as formatoptions. Format options can include font, alignment, spacing, shading, and positioning,depending on the report object.
Inserting Report ObjectsThere are multiple ways that you can insert a report object:
• From the toolbar, click and select the object to insert.
• From a new report, add a page from the left panel and then click on one of theobject icons.
• From the report body, header, or footer, right-click and select Add ReportContent, and then select the object to insert.
Note:
You can insert only text boxes and images in the report header andfooter.
Note:
You must be in Edit mode to insert a report object. You cannot insert objectswhile in Preview mode.
Chapter 2Working with Report Objects
2-9

Resizing, Editing, and Repositioning Report ObjectsAfter you insert a report object, you can resize, edit, or reposition the object directly onthe design canvas.
• To resize the report object, click the arrow in the lower right-hand corner and dragto the desired size.
Tip:
If Snap to Guide is enabled, you can also drag the right border to thenearest vertical guide line and the bottom border to the nearesthorizontal guide line. See Resizing with Guidelines
• To reposition the object, select the object and drag it to the desired position on thedesign canvas.
Note:
You cannot overlap objects on the report design canvas. See CorrectingReport Errors.
• To delete the object, click .
• To edit the object, click or Setup (Object), where (Object) is the object type.For example, Setup Grid.
Chapter 2Working with Report Objects
2-10
Using Guidelines
Guidelines enable you to line up your report objects horizontally and vertically for auniform appearance. By default, report objects are set to "snap to" these guidelines.
To toggle this feature on or off, click , and then Snap to Guide. Your setting issaved for future sessions.
You can also create new guidelines by clicking , then New Guides, and thenspecifying the horizontal and vertical position of the guide.
Finally, you can drag and drop an existing guideline to change its position in the report.
Resizing with Guidelines
If Snap to Guide is enabled in the grid Action menu, report objects can be resized tothe nearest guidelines with the following actions:
• Drag or double-click the right edge of an object to resize the object to the nearestvertical guideline.
• Drag or double-click the bottom edge of an object to resize the object to thenearest horizontal guideline.
• Drag the bottom right corner of an object to resize the object to the nearest verticalguideline.
For more information about working with report objects, see:
• Working With Grids
• Working With Charts
• Working With Text Boxes
• Working With Images
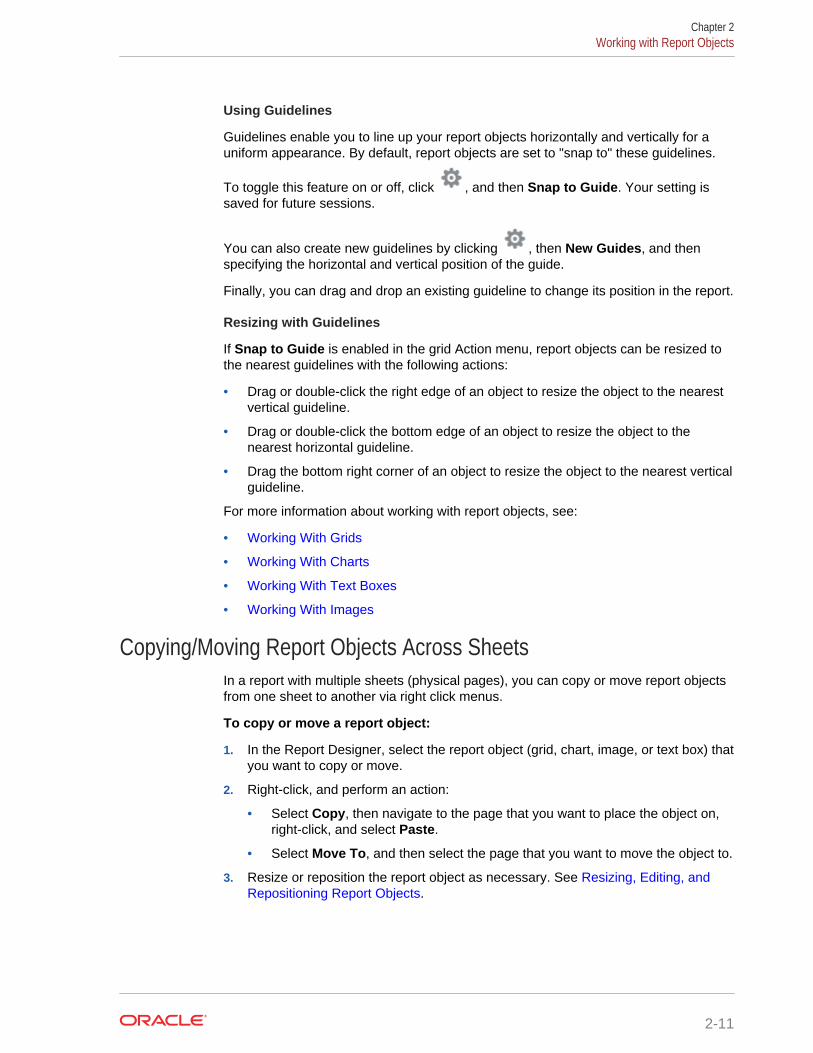
Copying/Moving Report Objects Across SheetsIn a report with multiple sheets (physical pages), you can copy or move report objectsfrom one sheet to another via right click menus.
To copy or move a report object:
1. In the Report Designer, select the report object (grid, chart, image, or text box) thatyou want to copy or move.
2. Right-click, and perform an action:
• Select Copy, then navigate to the page that you want to place the object on,right-click, and select Paste.
• Select Move To, and then select the page that you want to move the object to.
3. Resize or reposition the report object as necessary. See Resizing, Editing, andRepositioning Report Objects.
Chapter 2Working with Report Objects
2-11
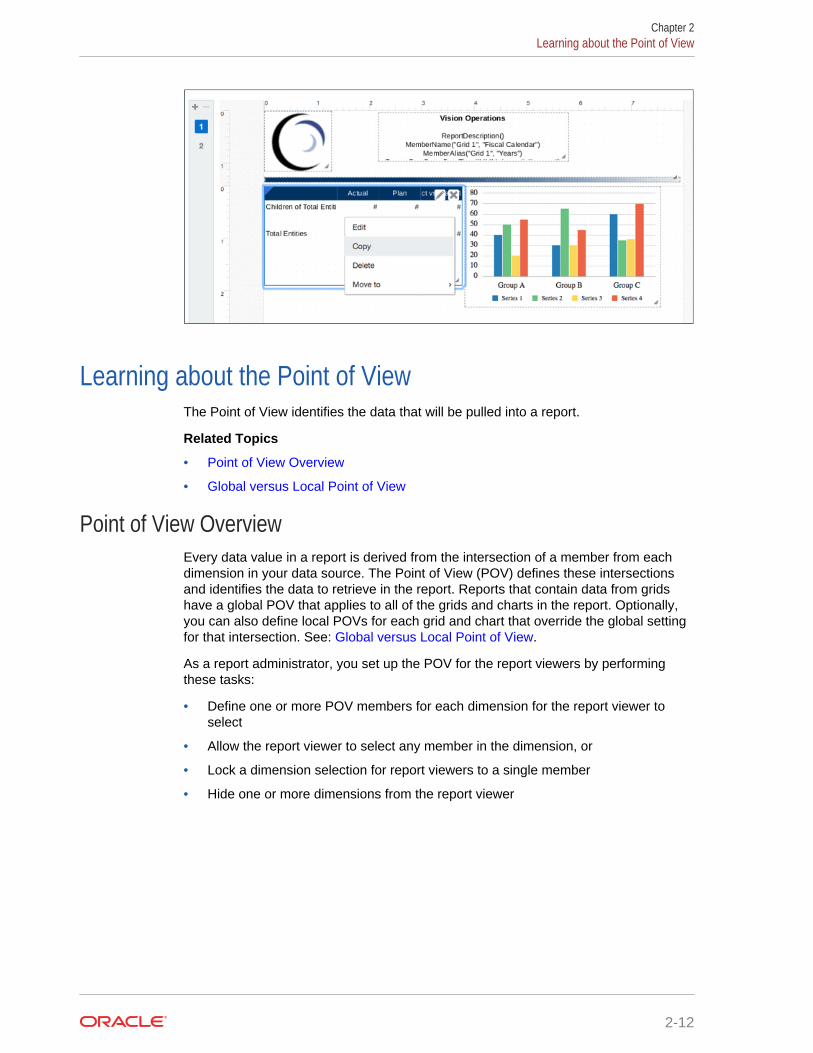
Learning about the Point of ViewThe Point of View identifies the data that will be pulled into a report.
Related Topics
• Point of View Overview
• Global versus Local Point of View
Point of View OverviewEvery data value in a report is derived from the intersection of a member from eachdimension in your data source. The Point of View (POV) defines these intersectionsand identifies the data to retrieve in the report. Reports that contain data from gridshave a global POV that applies to all of the grids and charts in the report. Optionally,you can also define local POVs for each grid and chart that override the global settingfor that intersection. See: Global versus Local Point of View.
As a report administrator, you set up the POV for the report viewers by performingthese tasks:
• Define one or more POV members for each dimension for the report viewer toselect
• Allow the report viewer to select any member in the dimension, or
• Lock a dimension selection for report viewers to a single member
• Hide one or more dimensions from the report viewer
Chapter 2Learning about the Point of View
2-12
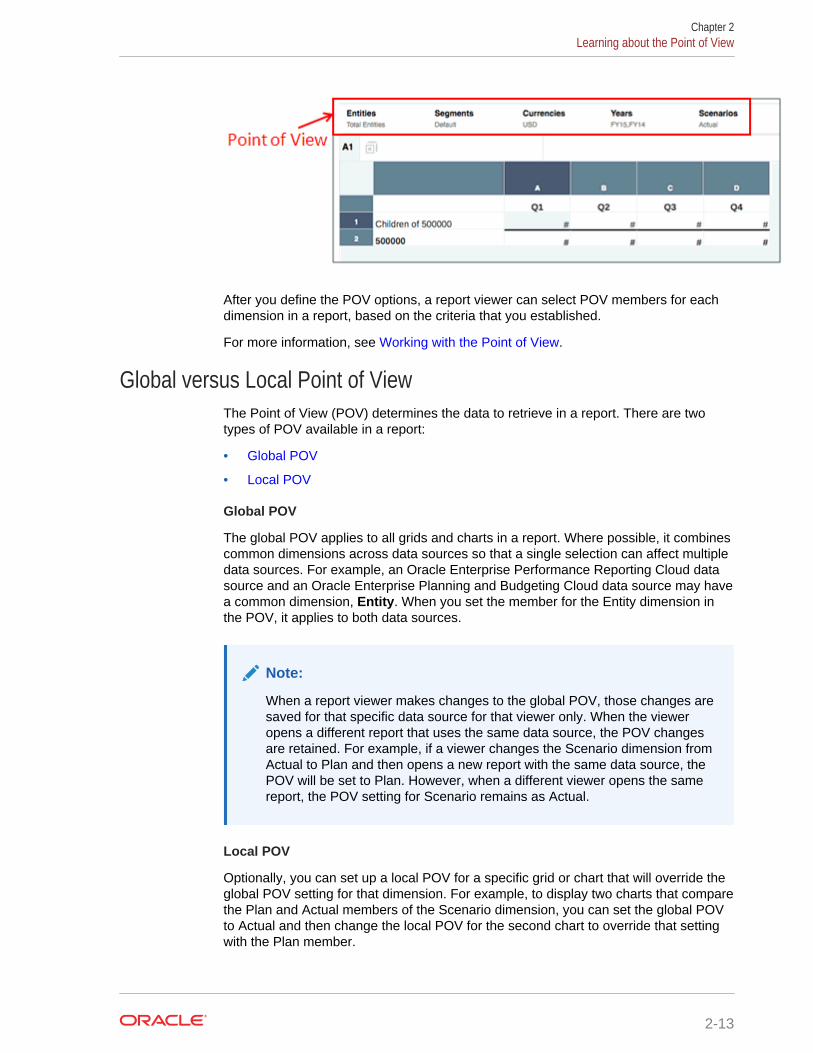
After you define the POV options, a report viewer can select POV members for eachdimension in a report, based on the criteria that you established.
For more information, see Working with the Point of View.
Global versus Local Point of ViewThe Point of View (POV) determines the data to retrieve in a report. There are twotypes of POV available in a report:
• Global POV
• Local POV
Global POV
The global POV applies to all grids and charts in a report. Where possible, it combinescommon dimensions across data sources so that a single selection can affect multipledata sources. For example, an Oracle Enterprise Performance Reporting Cloud datasource and an Oracle Enterprise Planning and Budgeting Cloud data source may havea common dimension, Entity. When you set the member for the Entity dimension inthe POV, it applies to both data sources.
Note:
When a report viewer makes changes to the global POV, those changes aresaved for that specific data source for that viewer only. When the vieweropens a different report that uses the same data source, the POV changesare retained. For example, if a viewer changes the Scenario dimension fromActual to Plan and then opens a new report with the same data source, thePOV will be set to Plan. However, when a different viewer opens the samereport, the POV setting for Scenario remains as Actual.
Local POV
Optionally, you can set up a local POV for a specific grid or chart that will override theglobal POV setting for that dimension. For example, to display two charts that comparethe Plan and Actual members of the Scenario dimension, you can set the global POVto Actual and then change the local POV for the second chart to override that settingwith the Plan member.
Chapter 2Learning about the Point of View
2-13
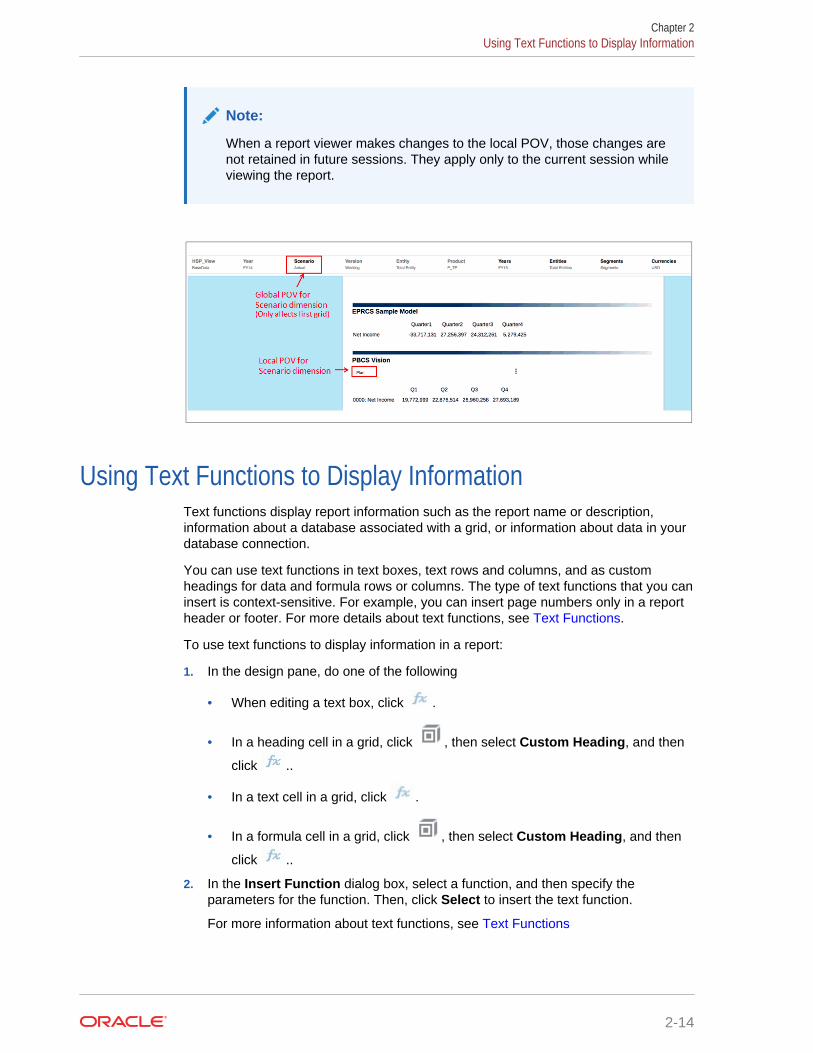
Note:
When a report viewer makes changes to the local POV, those changes arenot retained in future sessions. They apply only to the current session whileviewing the report.
Using Text Functions to Display InformationText functions display report information such as the report name or description,information about a database associated with a grid, or information about data in yourdatabase connection.
You can use text functions in text boxes, text rows and columns, and as customheadings for data and formula rows or columns. The type of text functions that you caninsert is context-sensitive. For example, you can insert page numbers only in a reportheader or footer. For more details about text functions, see Text Functions.
To use text functions to display information in a report:
1. In the design pane, do one of the following
• When editing a text box, click .
• In a heading cell in a grid, click , then select Custom Heading, and then
click ..
• In a text cell in a grid, click .
• In a formula cell in a grid, click , then select Custom Heading, and then
click ..
2. In the Insert Function dialog box, select a function, and then specify theparameters for the function. Then, click Select to insert the text function.
For more information about text functions, see Text Functions
Chapter 2Using Text Functions to Display Information
2-14
Correcting Report ErrorsYou may encounter errors on the entire report, or on a specific report object.
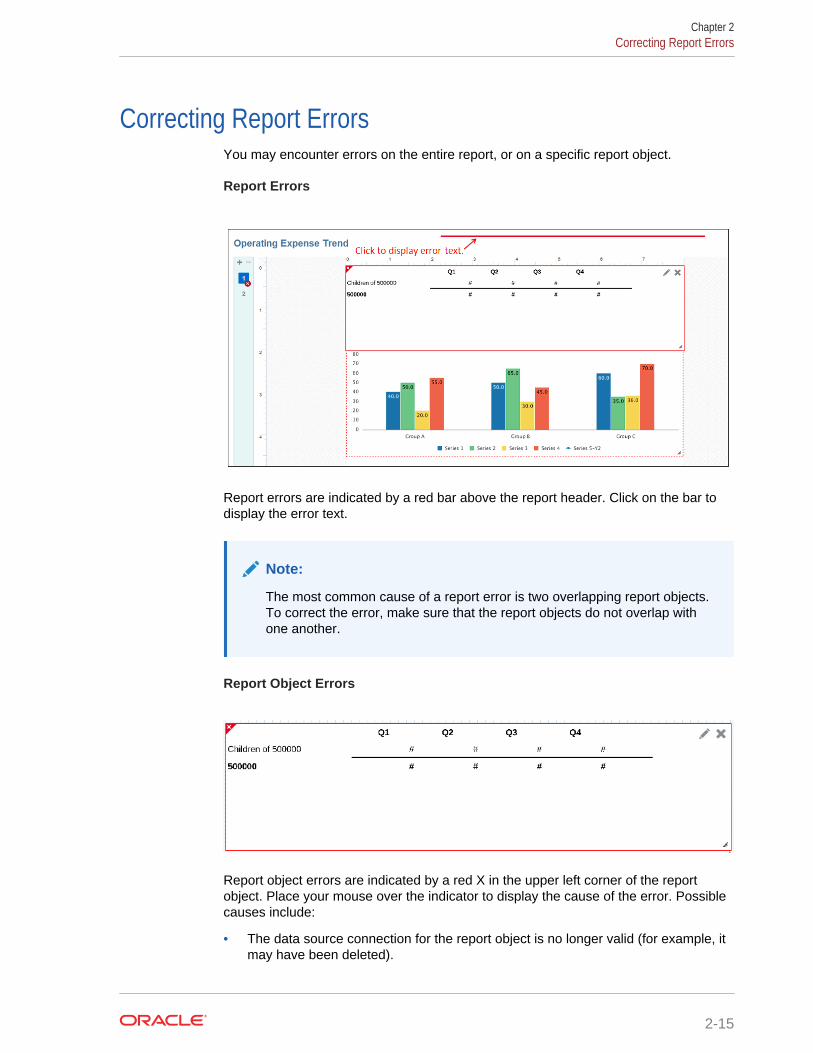
Report Errors
Report errors are indicated by a red bar above the report header. Click on the bar todisplay the error text.
Note:
The most common cause of a report error is two overlapping report objects.To correct the error, make sure that the report objects do not overlap withone another.
Report Object Errors
Report object errors are indicated by a red X in the upper left corner of the reportobject. Place your mouse over the indicator to display the cause of the error. Possiblecauses include:
• The data source connection for the report object is no longer valid (for example, itmay have been deleted).
Chapter 2Correcting Report Errors
2-15
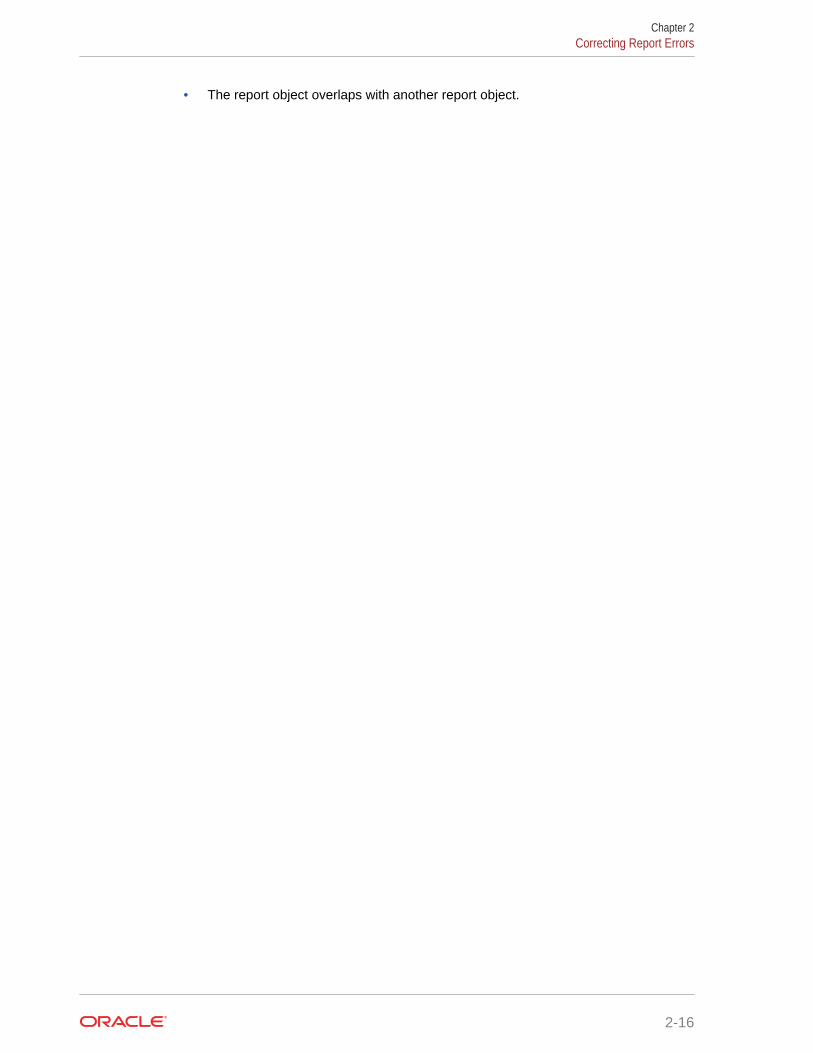
• The report object overlaps with another report object.
Chapter 2Correcting Report Errors
2-16

3Working With Grids
Related Topics
• About GridsGrids are tables that contain data from external database connections.
• Adding a GridAdd a grid to a report to display data from an external data source.
• Defining the Grid Point of ViewThe grid point of view determines the data that will be retrieved into your grid.
• Working With Rows and Columns in GridsYou organize and add content to grids by adding data, formula, text, and separatorrows and columns.
• Using the Formula BarThe formula bar provides a central location to create formulas and select memberswhen setting up grids in Management Reporting.
• Working with Conditional Formatting and SuppressionConditional formatting and suppression enables you to customize the cells, rows,and columns in your grid that meet the criteria that you specify.
• Zooming on Parent Members in GridsZoom allows you to expand a row or column parent member to see its children,descendants or bottom level members when you preview a report in HTML.
• Working with Drill To ContentDrill to content allows you to set up content links on grid cells, rows, columns andmember heading cells to enable end users to drill to Management Reportingreports, third-party documents in the Oracle Enterprise Performance ReportingCloud library and custom URL links.
• Defining Drill To Content Links
• Managing Drill To Content Definitions
• Passing the Point of View to the Target Report
• Examples of Drill to Content Results in Grid Cells
• Drilling to Cell File Attachments
About GridsGrids are tables that contain data from external database connections.
You can add a grid to your report, define its dimension layout, select members, andthen format the grid. You can use text, dimensions, members, and formulas to definethe grid content.
3-1
Adding a GridAdd a grid to a report to display data from an external data source.
To add a grid to a report:
1. Do one of the following:
• From the toolbar, click and select Grid.
• From a blank report, click .
• From the report body, right-click and select Add Report Content, and thenselect Grid.
2. Click Setup Grid.
3. In Select Source, select a data source for the grid.
Note:
You must have the Use permission on an Oracle EnterprisePerformance Reporting Cloud model in order to use that model as a datasource.
The grid is displayed in Grid Designer with a default dimension selection for therows and columns. Typically, the Time dimension is placed in the columns and theAccount dimension is placed in the rows.
When you add a new grid, the system assigns a default name to the grid. Thedefault name assigned is Grid n, where n is a system-assigned identificationnumber. For example, if you save a grid that is the sixth system-named grid savedin the report, the default name is Grid 6. You can rename the grid in GridProperties.
The system uses the grid name when a function or chart references the grid. Forexample, if you design a chart to graphically display the data from a grid, the chartproperties must reference the grid by its name.
About Grid DesignerThe grid designer has the following areas:
Chapter 3Adding a Grid
3-2
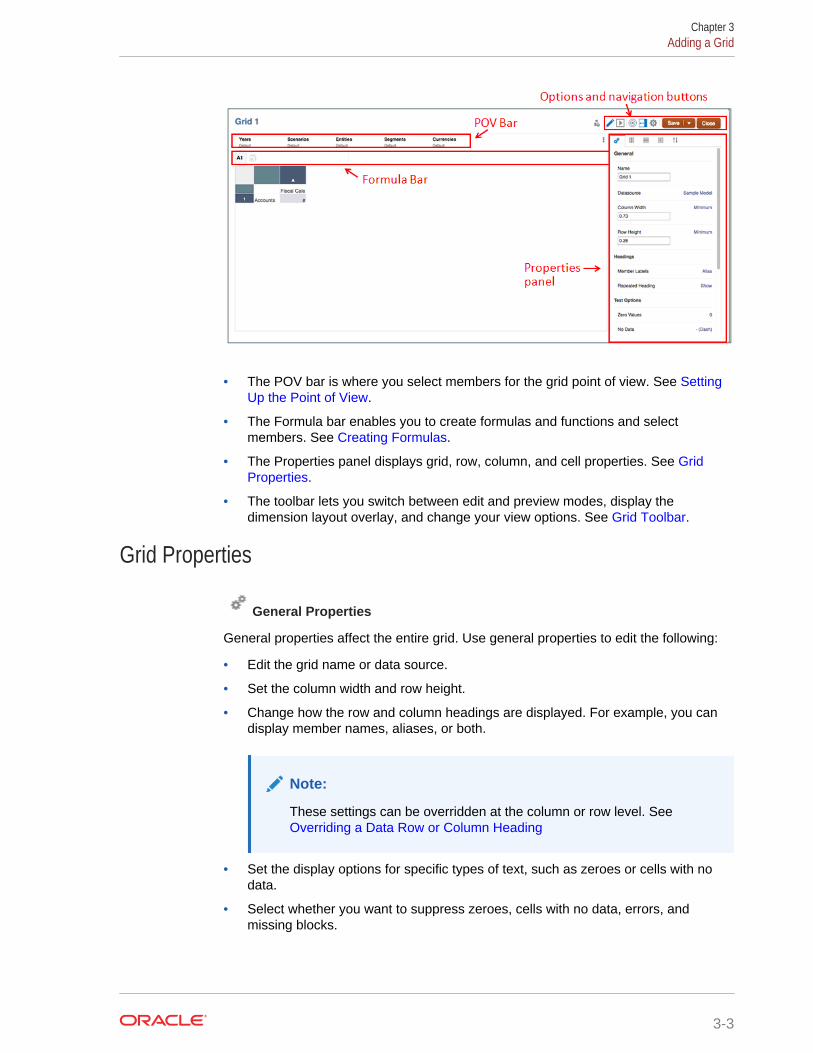
• The POV bar is where you select members for the grid point of view. See SettingUp the Point of View.
• The Formula bar enables you to create formulas and functions and selectmembers. See Creating Formulas.
• The Properties panel displays grid, row, column, and cell properties. See GridProperties.
• The toolbar lets you switch between edit and preview modes, display thedimension layout overlay, and change your view options. See Grid Toolbar.
Grid Properties
General Properties
General properties affect the entire grid. Use general properties to edit the following:
• Edit the grid name or data source.
• Set the column width and row height.
• Change how the row and column headings are displayed. For example, you candisplay member names, aliases, or both.
Note:
These settings can be overridden at the column or row level. See Overriding a Data Row or Column Heading
• Set the display options for specific types of text, such as zeroes or cells with nodata.
• Select whether you want to suppress zeroes, cells with no data, errors, andmissing blocks.
Chapter 3Adding a Grid
3-3
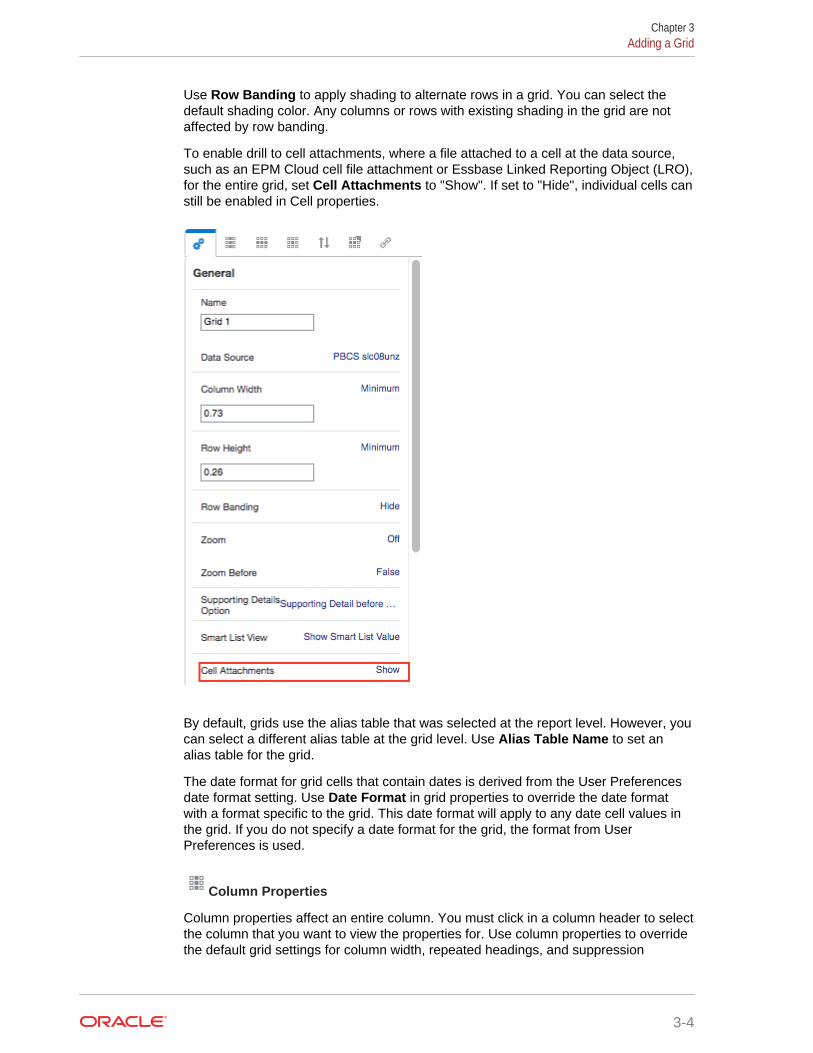
Use Row Banding to apply shading to alternate rows in a grid. You can select thedefault shading color. Any columns or rows with existing shading in the grid are notaffected by row banding.
To enable drill to cell attachments, where a file attached to a cell at the data source,such as an EPM Cloud cell file attachment or Essbase Linked Reporting Object (LRO),for the entire grid, set Cell Attachments to "Show". If set to "Hide", individual cells canstill be enabled in Cell properties.
By default, grids use the alias table that was selected at the report level. However, youcan select a different alias table at the grid level. Use Alias Table Name to set analias table for the grid.
The date format for grid cells that contain dates is derived from the User Preferencesdate format setting. Use Date Format in grid properties to override the date formatwith a format specific to the grid. This date format will apply to any date cell values inthe grid. If you do not specify a date format for the grid, the format from UserPreferences is used.
Column Properties
Column properties affect an entire column. You must click in a column header to selectthe column that you want to view the properties for. Use column properties to overridethe default grid settings for column width, repeated headings, and suppression
Chapter 3Adding a Grid
3-4
settings. The grid setting is displayed in brackets. For example, in the suppressionsetting for zeroes, Grid Setting (False) indicates that zero values are not suppressedat the grid level. Click the setting to override the suppression settings for the selectedcolumn with True (always suppress zeroes) or False (never suppress zeroes), or touse the default for the grid.
You can also hide a column and insert a page break before a column.
Row Properties
Row properties affect an entire row. You must click in a row header to select the rowthat you want to view the properties for. Use row properties to override the default gridsettings for row height, repeated headings, and suppression settings. You can alsohide a row and insert a page break before a row.
Cell Properties
Cell properties affect the selected range of cells in a grid. Use cell properties tochange the way cell text is formatted. For example, you can change the way positiveand negative numbers are displayed, and you can change the font, color, and size oftext within a cell. You can add borders or shading to a cell range, and specify zoomand indent options. You can also show or hide cell attachment links for selected cellsin the grid that have attachments at the data source. See Formatting Grid Cells.
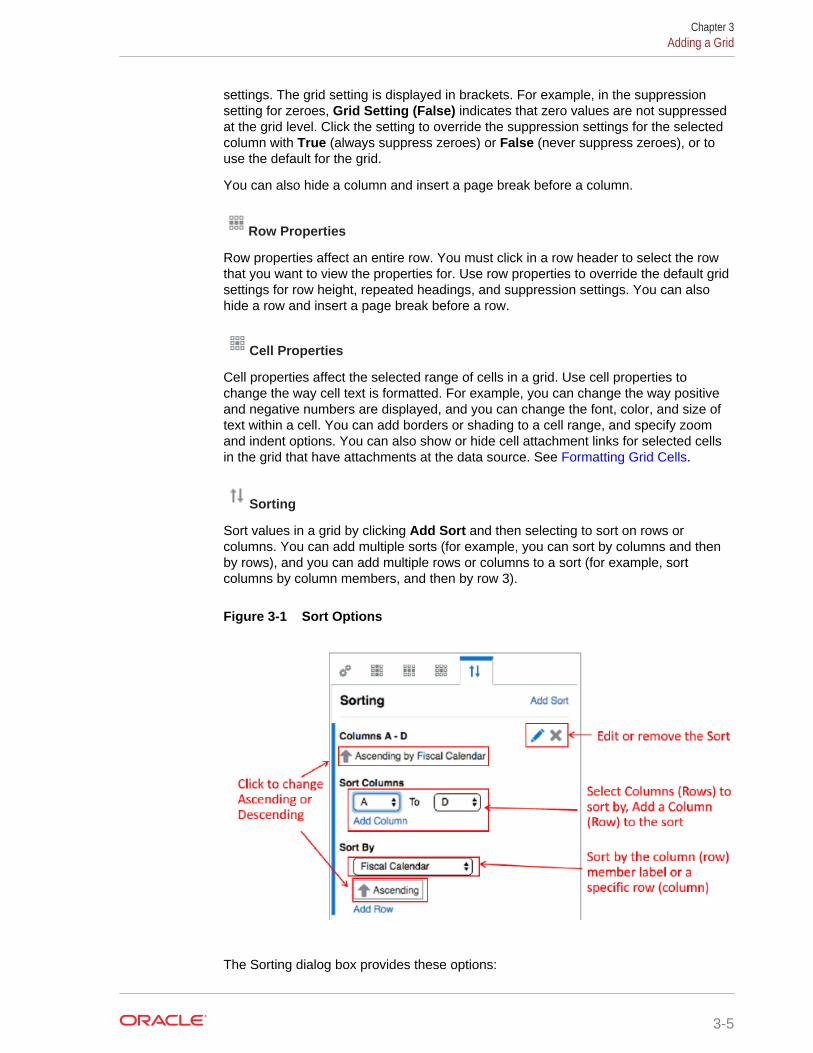
Sorting
Sort values in a grid by clicking Add Sort and then selecting to sort on rows orcolumns. You can add multiple sorts (for example, you can sort by columns and thenby rows), and you can add multiple rows or columns to a sort (for example, sortcolumns by column members, and then by row 3).
Figure 3-1 Sort Options
The Sorting dialog box provides these options:
Chapter 3Adding a Grid
3-5
• Ascending/Descending— toggles between ascending and descending sorts.
• Edit— enables you to edit the sort.
• Remove—deletes the sort.
• Add Column/Row—adds a column or row to the sort.
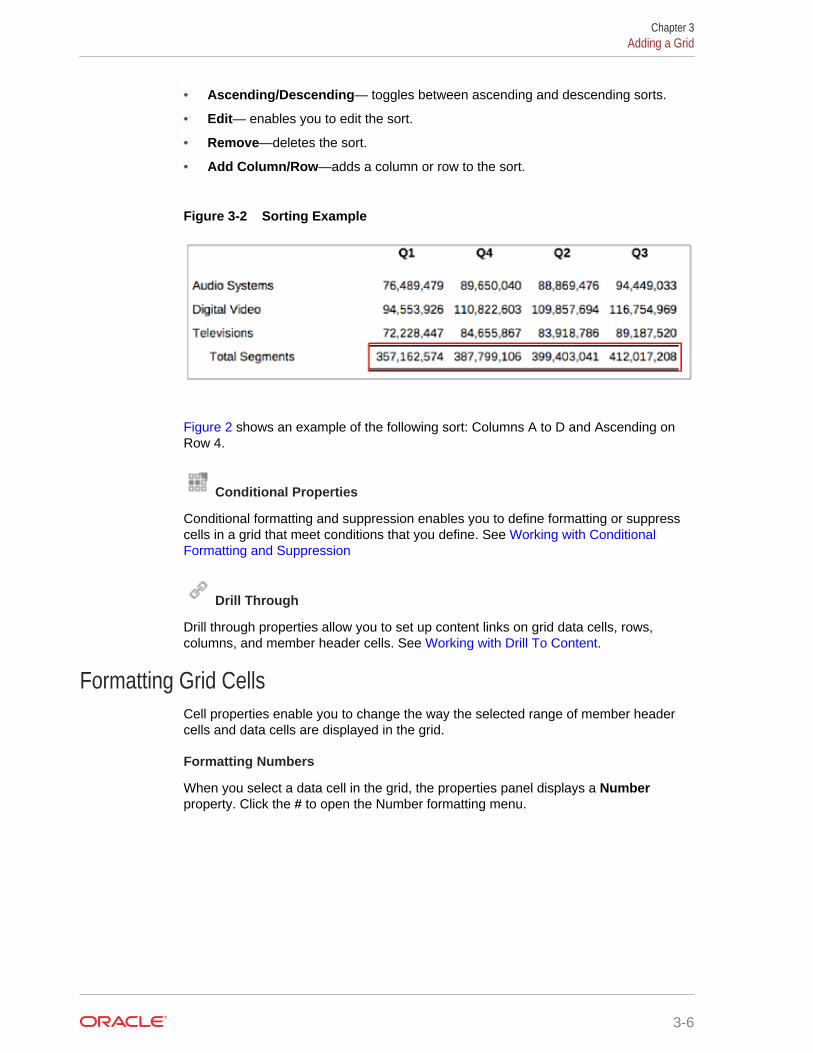
Figure 3-2 Sorting Example
Figure 2 shows an example of the following sort: Columns A to D and Ascending onRow 4.
Conditional Properties
Conditional formatting and suppression enables you to define formatting or suppresscells in a grid that meet conditions that you define. See Working with ConditionalFormatting and Suppression
Drill Through
Drill through properties allow you to set up content links on grid data cells, rows,columns, and member header cells. See Working with Drill To Content.
Formatting Grid CellsCell properties enable you to change the way the selected range of member headercells and data cells are displayed in the grid.
Formatting Numbers
When you select a data cell in the grid, the properties panel displays a Numberproperty. Click the # to open the Number formatting menu.
Chapter 3Adding a Grid
3-6

Use the Prefix and Suffix fields to format both positive and negative numbers in thecell with characters before or after the number (such as currency symbols, or openand close parentheses for negative numbers). You can manually enter the symbols
that you want to prefix or suffix the number by, or click to select commonly-usedcharacters from a list. You can enter more than one character as a prefix or suffix (forexample, -$). You can also display negative numbers in red text.
By default, number cells use the thousands and decimal separators from your UserPreferences. De-select the Use Default check box to manually specify a thousands ordecimal separator.
Use Decimal Places and Scale Values By to specify the scale and precision ofnumber values. If the number contains more decimal places than you specify, thesystem rounds the displayed number.
Tip:
In Scale Values By, use Custom to specify a scale that is not listed. Youcan also add a negative value in Custom to reverse the sign of the number.For example, to display a positive number as a negative number, selectCustom and then enter -1 for the scale. Click OK to accept your changes.
Chapter 3Adding a Grid
3-7
Formatting Font and Alignment
For both member heading and data cells, the Font and Alignment fields enable you tochange the font, size, color, and placement of text within a cell., and to reverse the textdirection for right-to-left languages. You can also specify an indent from the left cellmargin.
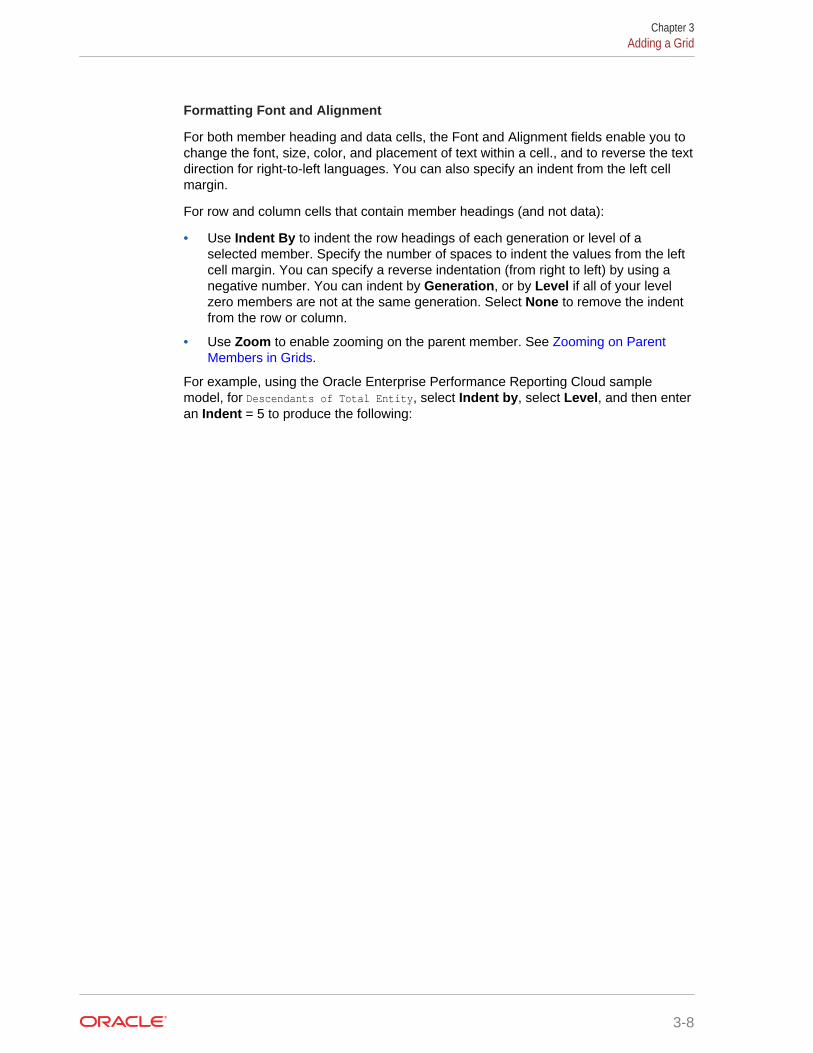
For row and column cells that contain member headings (and not data):
• Use Indent By to indent the row headings of each generation or level of aselected member. Specify the number of spaces to indent the values from the leftcell margin. You can specify a reverse indentation (from right to left) by using anegative number. You can indent by Generation, or by Level if all of your levelzero members are not at the same generation. Select None to remove the indentfrom the row or column.
• Use Zoom to enable zooming on the parent member. See Zooming on ParentMembers in Grids.
For example, using the Oracle Enterprise Performance Reporting Cloud samplemodel, for Descendants of Total Entity, select Indent by, select Level, and then enteran Indent = 5 to produce the following:
Chapter 3Adding a Grid
3-8
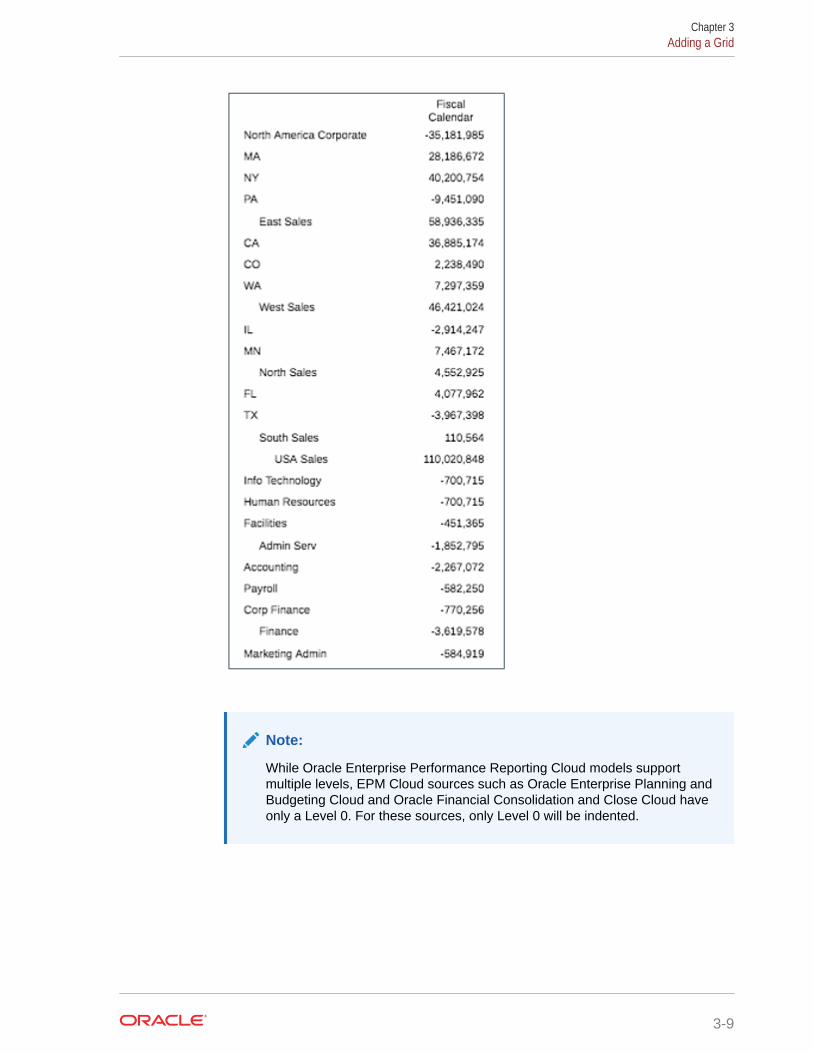
Note:
While Oracle Enterprise Performance Reporting Cloud models supportmultiple levels, EPM Cloud sources such as Oracle Enterprise Planning andBudgeting Cloud and Oracle Financial Consolidation and Close Cloud haveonly a Level 0. For these sources, only Level 0 will be indented.
Chapter 3Adding a Grid
3-9
Note:
When you select Indent by (generation or level), or Zoom, a RelativeIndent field is displayed. Use Relative Indent to adjust the size of the indentof the row member labels. This field displays the current indent in inches orcentimeters, depending on your user preference. (See Using the FormattingTab). The default value is .12 inches. You can adjust this value from -1.00 to1.00 inches. Use negative values to reverse the indent of the row memberlabels.
Formatting Borders and Shading
In Borders, click to open the border editor. Click top, bottom, left, right, or all tospecify a border, and then click the drop down arrow to specify a border style. Clickthe border color to change it. You can pick a color from the color picker or manuallyenter an RGB value. You must enable a border (for example, All) in order to specify astyle and color. Click OK to accept your changes.
In Shading, click to specify a background color for the selected cells. You canpick a color from the color picker or manually enter an RGB value.
Use Replace Text to replace the data value of a selected cell with a text string. Forexample, you can display "Confidential" in a cell that contains sensitive financialinformation. The text that you enter will be displayed in grid designer as well as allrendered output.
Note:
When you replace zero values, the text replacement is based on thedisplayed value of zero (which is not necessarily the actual data value). Forexample, if the data value is ".001" but it is formatted to display with nodecimal places, the displayed value for the data is zero and therefore it willbe replaced with the text that you specify. You can specify the number ofextra decimal places of precision to consider in determining that the value iszero.
Click Reset to Default to set all cell formatting for the selected cells back to theirdefault settings.
Formatting Best PracticesWhen formatting a report, keep in mind the following points:
• Cell formatting has precedence over row and column formatting and gridformatting.
• Cell formatting allows you to make exceptions to row and column formatting andgrid formatting.
Chapter 3Adding a Grid
3-10
• Row/column formatting has precedence over grid formatting.
• Row/column formatting allows you to make exceptions to grid formatting.
• The correct sequence in formatting a report is:
1. Format the grid.
2. Apply different formatting to rows and columns.
3. Apply specific cell formatting.
To copy formatting from a grid cell, row, or column:
1. Select your source cell, row, or column.
2. Right-click, and select Copy Formatting.
3. Select your destination cell, row, or column.
4. Right-click, and select Paste Formatting.
Grid ToolbarThe toolbar lets you do the following:
Edit/Preview
Use Edit and Preview to toggle between Edit and Preview mode. Edit mode allowsyou to make changes to the grid, while the preview mode enables you to see how the
grid will look when it is published. While in preview mode, use to toggle displayingthe POV.
Dimension Layout
Toggles the dimension layout overlay, which enables you to drag dimensions toreorder them or to move them from the Point of View, Rows, and Columns.
You can place multiple dimensions into rows and columns. The dimensions that arenot placed in rows or columns are displayed in the point of view bar located at the topof the grid designer.
You can layer multiple dimensions in a row or column. For example, you can place theScenario and Time dimensions on the same axis to show actual and budget data overa period of time.
Note:
If your data source contains attribute dimensions, click the + sign in the POV,row, or column to display attribute dimensions, and then select the dimensionto add. You can drag and drop attribute dimensions between axes, just likeregular dimensions. Click the X in the attribute dimension label to remove it.
Chapter 3Adding a Grid
3-11

Properties
Use Properties to display or hide the grid properties panel.
Actions
Use Actions to do the following:
• Show or hide the formula bar
• Set the default display settings for member labels (member name, alias, or both)for the member selector display, the row and column headers, and the global andlocal POV.
Note:
This default setting can be overridden in the row or column header byclicking the heading label in the formula bar.
• Select the alias table for the grid.
Defining the Grid Point of ViewThe grid point of view determines the data that will be retrieved into your grid.
Related Topics
• About the Grid Point of View
• Working with the Point of View
• Setting Up the Point of View
• Displaying the Printable Page Member
• Attribute Dimensions and the Point of View
• Point of View Examples
About the Grid Point of ViewGrids have a local point of view (POV) which contains all of the dimensions from anEPM data source that are not on the grid rows or columns, and which determines thedata that gets displayed in a grid. In addition to the local point of view, a report thatcontains the grid has a global point of view that applies to all report objects that displaydata. For more information on global and local POV, see Learning about the Point ofView
Chapter 3Defining the Grid Point of View
3-12
Note:
When you create a report, the first time you add a grid or a chart to thatreport, the POV of that grid or chart becomes the global POV for that report.When you add subsequent grids or charts to the report, any commondimensions across data sources are combined so that a single selection canaffect different data sources. You can override the global POV with a localPOV selection for any dimension. For example, if the Scenario dimension inthe global POV is set to Actual, you can override that selection on aparticular grid or chart with a local selection of Budget. This setting will affectonly that grid or chart; all other grids and charts will display the Actual datafrom the global POV.
Working with the Point of ViewDefault Setting
If you do not make any member selections or set any options for a POV dimension,that dimension is set to Default while you are in report edit mode.
When you preview a report, you can select any members in a dimension that you havesecurity access to in the data source. Members that you have recently selected aredisplayed so that you can select from them more conveniently.
Selecting Multiple Members
While you are in edit mode, you can select multiple members for a dimension, and youcan also use functions (for example, Children of Total Entities) to define a list ofmembers for the report viewer to choose from.
You can also set Display Suggestions Only to restrict viewers to select only from thelist of members that you choose. You can preview this list of members in Previewmode.
When multiple members are selected for a POV dimension, you can set the dimensionto Print All Selections. When you preview the report in PDF mode, each memberselection will be rendered on a different page.
Tip:
When a POV dimension has multiple members selected and Print AllSelections enabled, the PDF Preview of the report displays separate pagesfor each POV member, but the member name is not displayed in the PDFoutput of the report. You must use a MemberName or MemberAlias textfunction to display the member name. See Displaying the Printable PageMember.
Locking or Limiting User Selections
When you define members in a POV dimension, you control what a report viewer canselect from. Use Display Suggestions Only to either lock the selections so that a
Chapter 3Defining the Grid Point of View
3-13

report viewer cannot select any other members, or to enable viewers to selectmembers other than the ones that you defined.
If only one member is selected for each dimension, you can also hide the POV fromreport viewers.
Combining Dimensions from Multiple Grids in the POV
When there are multiple grids in the report that use the same data source, POVdimensions will be combined in the POV bar when previewing the report. For example,if the Scenario dimension is in the column of the first grid and in the POV of thesecond grid, the Scenario dimension will still appear in the global POV. However, itsselections will affect only the second grid.
Note:
If you have combined shared dimensions in the Global POV, you mustenable Display Suggestions Only.
If there are multiple grids in the report with different data sources, POV dimensions willbe combined in the POV bar when previewing the report. If the data sources share thesame dimension name, only one dimension will be displayed, with only commonmembers between the two data sources listed.
Note:
If you want each data source in the POV to list members for a commondimension, move one or both of the dimensions to the local POV.
Setting Up the Point of ViewTo set up the point of view:
1. Open a grid in edit mode of Grid Designer.
2. In the POV bar at the top of the grid, click on a dimension label to open themember selector for that dimension.
3. In the member selector, select one or more members for the dimension by clickingthe check mark next to a member name. You can select individual members, oryou can use lists or member selection functions to select multiple members.
Note:
If you do not define a selection for the dimension, the system displaysDefault, and the report viewer can select any member that they haveaccess to for that dimension.
Chapter 3Defining the Grid Point of View
3-14
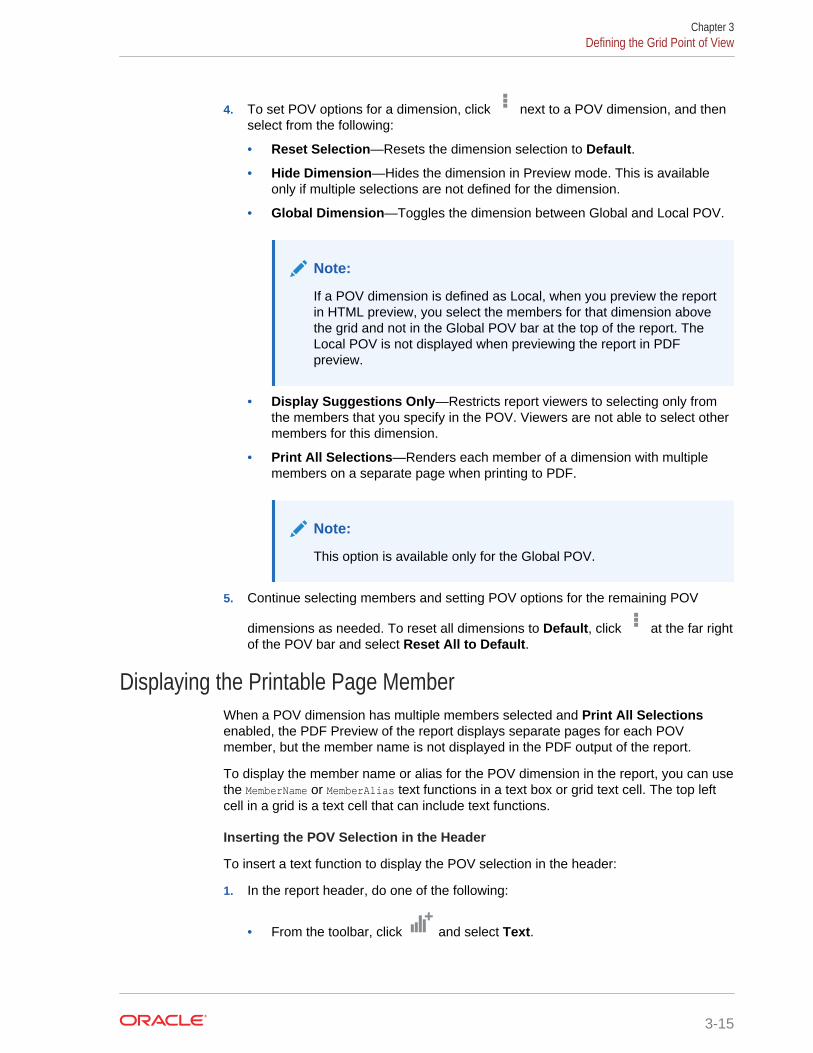
4. To set POV options for a dimension, click next to a POV dimension, and thenselect from the following:
• Reset Selection—Resets the dimension selection to Default.
• Hide Dimension—Hides the dimension in Preview mode. This is availableonly if multiple selections are not defined for the dimension.
• Global Dimension—Toggles the dimension between Global and Local POV.
Note:
If a POV dimension is defined as Local, when you preview the reportin HTML preview, you select the members for that dimension abovethe grid and not in the Global POV bar at the top of the report. TheLocal POV is not displayed when previewing the report in PDFpreview.
• Display Suggestions Only—Restricts report viewers to selecting only fromthe members that you specify in the POV. Viewers are not able to select othermembers for this dimension.
• Print All Selections—Renders each member of a dimension with multiplemembers on a separate page when printing to PDF.
Note:
This option is available only for the Global POV.
5. Continue selecting members and setting POV options for the remaining POV
dimensions as needed. To reset all dimensions to Default, click at the far rightof the POV bar and select Reset All to Default.
Displaying the Printable Page MemberWhen a POV dimension has multiple members selected and Print All Selectionsenabled, the PDF Preview of the report displays separate pages for each POVmember, but the member name is not displayed in the PDF output of the report.
To display the member name or alias for the POV dimension in the report, you can usethe MemberName or MemberAlias text functions in a text box or grid text cell. The top leftcell in a grid is a text cell that can include text functions.
Inserting the POV Selection in the Header
To insert a text function to display the POV selection in the header:
1. In the report header, do one of the following:
• From the toolbar, click and select Text.
Chapter 3Defining the Grid Point of View
3-15

• From a blank report page, click .
• From the report header, footer, or body, right-click and select Add ReportContent, and then select Text.
2. Click or Setup Text.
3. In the top right of the text box, click .
4. Select either MemberName or MemberAlias, and then specify the required parameterssuch as Grid and Dimension. The Dimension parameter is the POV dimensionwith multiple members selected and Print All Selections enabled.
5. Click Select to add the text function to the text box. You can add additional text asrequired, for example "Current Month:", before or after the text function.
6. Optional: Set the format for the text, such as font and alignment, in the text boxproperties panel.
7. Click Close to return to the report design. When previewing the report in PDF, thePOV dimension member will display for each page of the report in the pageheader.
Figure 1 shows an example of using the MemberAlias function to display the SegmentPOV member in the header, and Figure 2 shows the results of that formula, with "AllSegments" displaying in the header on page one and "Televisions" on page two.
Figure 3-3 Formula to Display Segment POV in Header
Chapter 3Defining the Grid Point of View
3-16
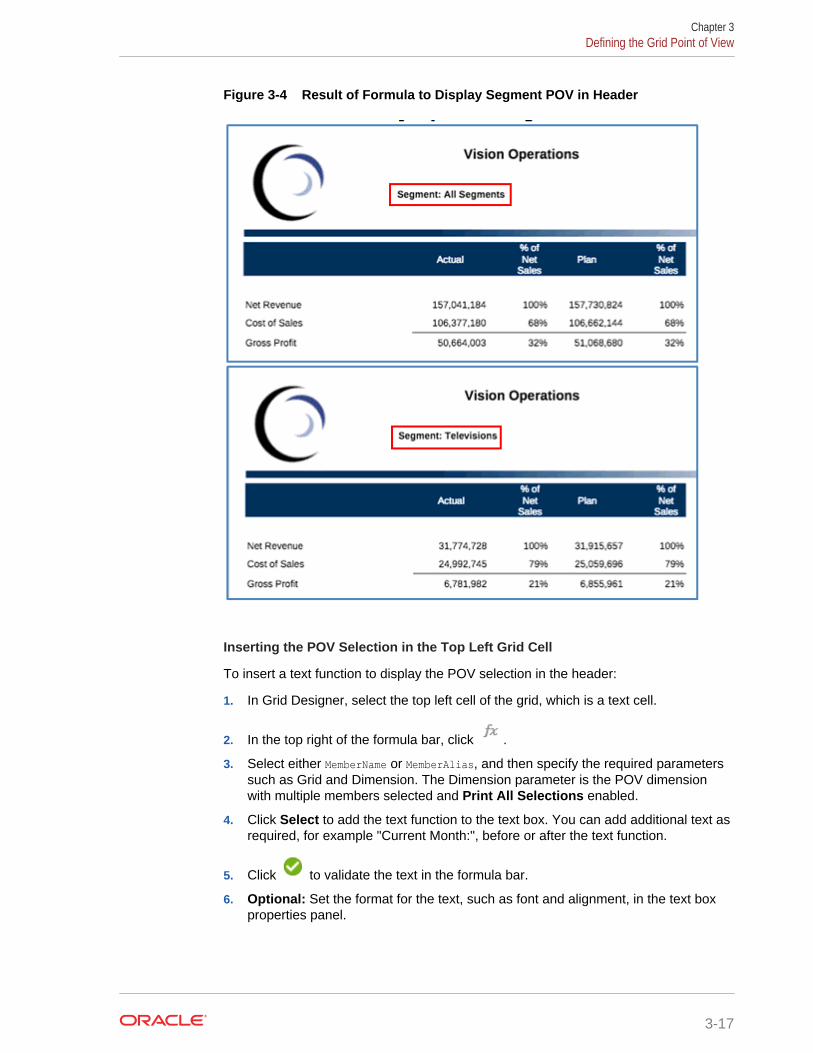
Figure 3-4 Result of Formula to Display Segment POV in Header
Inserting the POV Selection in the Top Left Grid Cell
To insert a text function to display the POV selection in the header:
1. In Grid Designer, select the top left cell of the grid, which is a text cell.
2. In the top right of the formula bar, click .
3. Select either MemberName or MemberAlias, and then specify the required parameterssuch as Grid and Dimension. The Dimension parameter is the POV dimensionwith multiple members selected and Print All Selections enabled.
4. Click Select to add the text function to the text box. You can add additional text asrequired, for example "Current Month:", before or after the text function.
5. Click to validate the text in the formula bar.
6. Optional: Set the format for the text, such as font and alignment, in the text boxproperties panel.
Chapter 3Defining the Grid Point of View
3-17
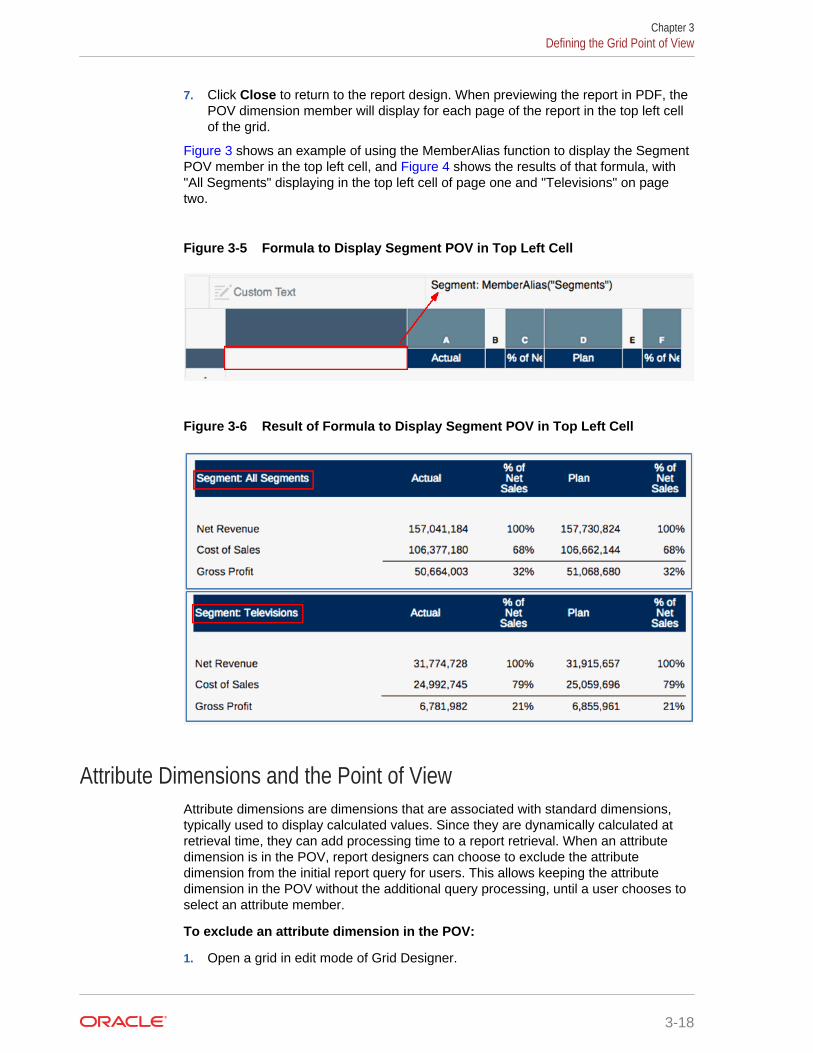
7. Click Close to return to the report design. When previewing the report in PDF, thePOV dimension member will display for each page of the report in the top left cellof the grid.
Figure 3 shows an example of using the MemberAlias function to display the SegmentPOV member in the top left cell, and Figure 4 shows the results of that formula, with"All Segments" displaying in the top left cell of page one and "Televisions" on pagetwo.
Figure 3-5 Formula to Display Segment POV in Top Left Cell
Figure 3-6 Result of Formula to Display Segment POV in Top Left Cell
Attribute Dimensions and the Point of ViewAttribute dimensions are dimensions that are associated with standard dimensions,typically used to display calculated values. Since they are dynamically calculated atretrieval time, they can add processing time to a report retrieval. When an attributedimension is in the POV, report designers can choose to exclude the attributedimension from the initial report query for users. This allows keeping the attributedimension in the POV without the additional query processing, until a user chooses toselect an attribute member.
To exclude an attribute dimension in the POV:
1. Open a grid in edit mode of Grid Designer.
Chapter 3Defining the Grid Point of View
3-18
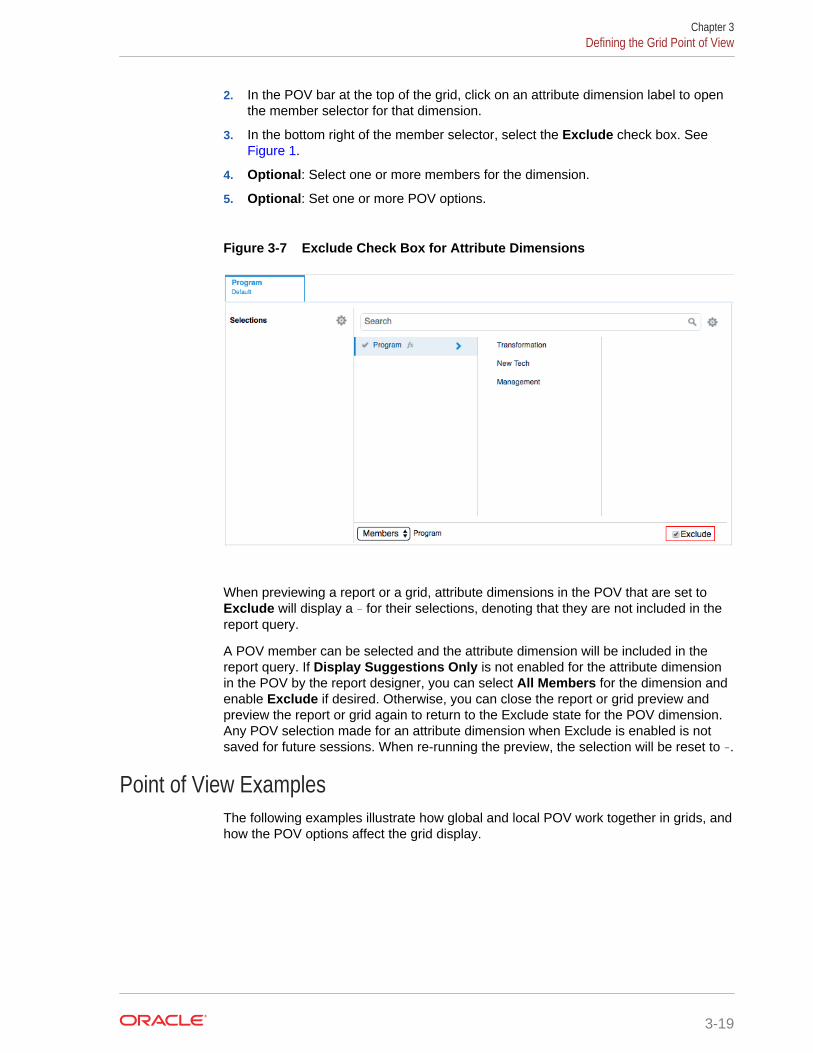
2. In the POV bar at the top of the grid, click on an attribute dimension label to openthe member selector for that dimension.
3. In the bottom right of the member selector, select the Exclude check box. See Figure 1.
4. Optional: Select one or more members for the dimension.
5. Optional: Set one or more POV options.
Figure 3-7 Exclude Check Box for Attribute Dimensions
When previewing a report or a grid, attribute dimensions in the POV that are set toExclude will display a - for their selections, denoting that they are not included in thereport query.
A POV member can be selected and the attribute dimension will be included in thereport query. If Display Suggestions Only is not enabled for the attribute dimensionin the POV by the report designer, you can select All Members for the dimension andenable Exclude if desired. Otherwise, you can close the report or grid preview andpreview the report or grid again to return to the Exclude state for the POV dimension.Any POV selection made for an attribute dimension when Exclude is enabled is notsaved for future sessions. When re-running the preview, the selection will be reset to -.
Point of View ExamplesThe following examples illustrate how global and local POV work together in grids, andhow the POV options affect the grid display.
Chapter 3Defining the Grid Point of View
3-19
Example 1: Two Grids with the Same Data Source
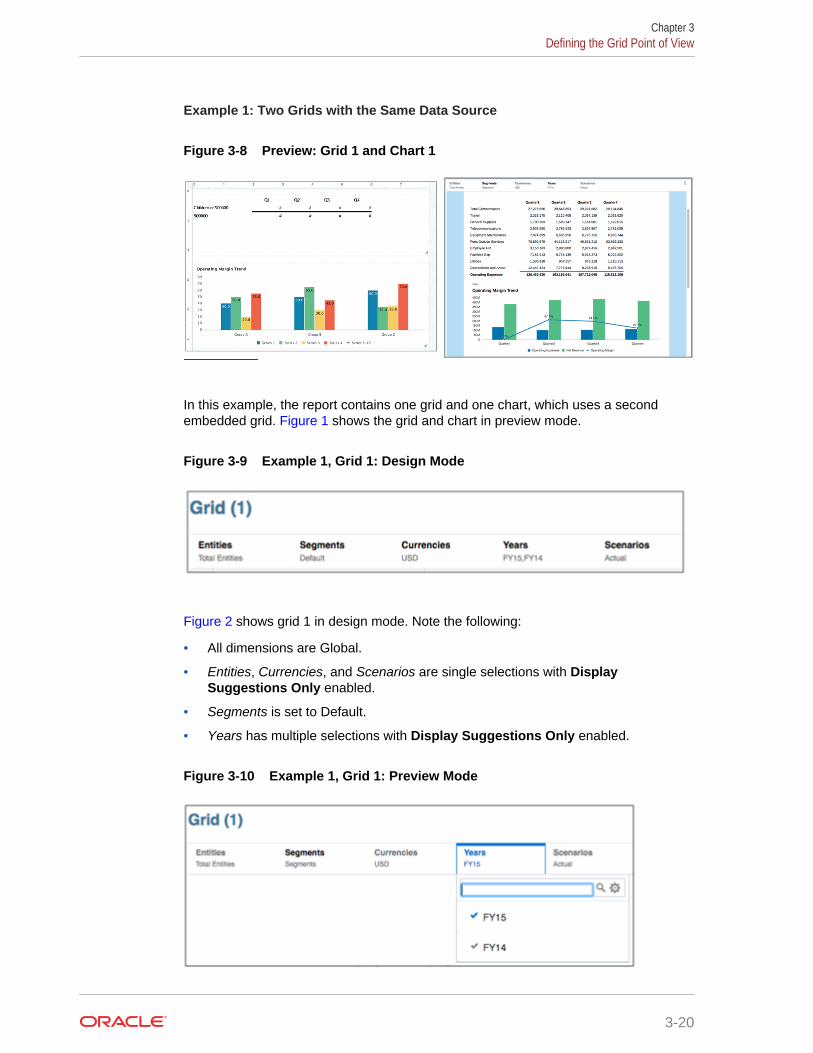
Figure 3-8 Preview: Grid 1 and Chart 1
In this example, the report contains one grid and one chart, which uses a secondembedded grid. Figure 1 shows the grid and chart in preview mode.
Figure 3-9 Example 1, Grid 1: Design Mode
Figure 2 shows grid 1 in design mode. Note the following:
• All dimensions are Global.
• Entities, Currencies, and Scenarios are single selections with DisplaySuggestions Only enabled.
• Segments is set to Default.
• Years has multiple selections with Display Suggestions Only enabled.
Figure 3-10 Example 1, Grid 1: Preview Mode
Chapter 3Defining the Grid Point of View
3-20

Figure 3 shows Grid 1 in preview mode. Note the following:
• Entities, Currencies, and Scenarios: viewer cannot change selections.
• Segments: viewers can select any member.
• Years: viewers can select only from the two members defined.
Figure 3-11 Example 1, Chart 1: Design Mode
Figure 4 shows Chart 1 in design mode. Note the following:
• Scenarios is set to local, with a single selection only (Plan). Display SuggestionsOnly is enabled.
• The remaining selections are set from the global POV.
Figure 3-12 Example 1, Chart 1: Preview Mode
Figure 5 shows Chart 1 in preview mode. Note that Scenarios is displayed in the localPOV, and cannot be changed.
Example 2: Two Grids with Different Data Sources
Figure 3-13 Preview: Two Grids with Different Data Sources
Chapter 3Defining the Grid Point of View
3-21
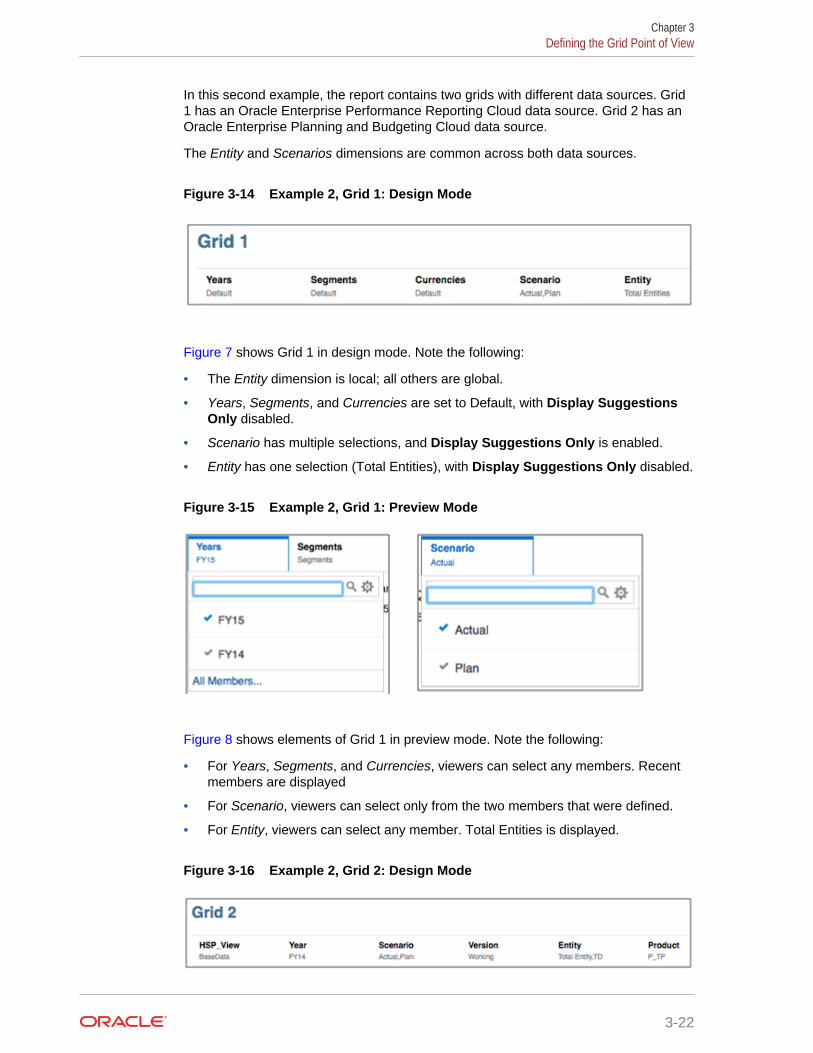
In this second example, the report contains two grids with different data sources. Grid1 has an Oracle Enterprise Performance Reporting Cloud data source. Grid 2 has anOracle Enterprise Planning and Budgeting Cloud data source.
The Entity and Scenarios dimensions are common across both data sources.
Figure 3-14 Example 2, Grid 1: Design Mode
Figure 7 shows Grid 1 in design mode. Note the following:
• The Entity dimension is local; all others are global.
• Years, Segments, and Currencies are set to Default, with Display SuggestionsOnly disabled.
• Scenario has multiple selections, and Display Suggestions Only is enabled.
• Entity has one selection (Total Entities), with Display Suggestions Only disabled.
Figure 3-15 Example 2, Grid 1: Preview Mode
Figure 8 shows elements of Grid 1 in preview mode. Note the following:
• For Years, Segments, and Currencies, viewers can select any members. Recentmembers are displayed
• For Scenario, viewers can select only from the two members that were defined.
• For Entity, viewers can select any member. Total Entities is displayed.
Figure 3-16 Example 2, Grid 2: Design Mode
Chapter 3Defining the Grid Point of View
3-22
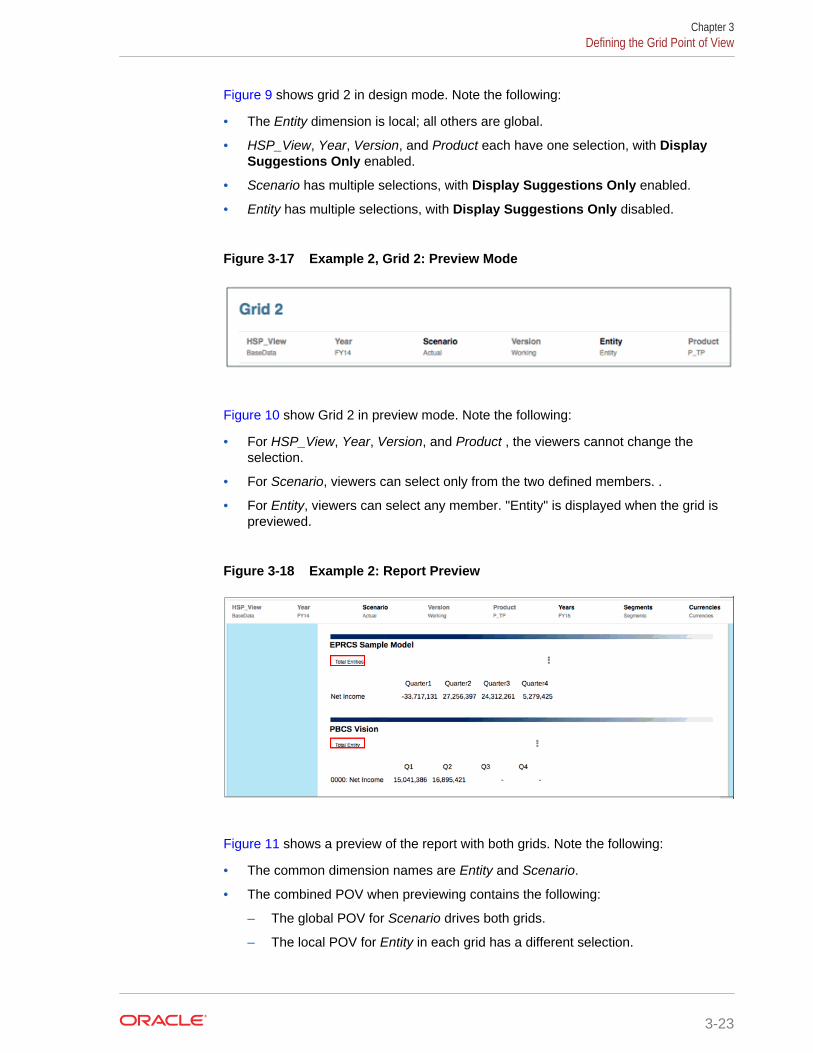
Figure 9 shows grid 2 in design mode. Note the following:
• The Entity dimension is local; all others are global.
• HSP_View, Year, Version, and Product each have one selection, with DisplaySuggestions Only enabled.
• Scenario has multiple selections, with Display Suggestions Only enabled.
• Entity has multiple selections, with Display Suggestions Only disabled.
Figure 3-17 Example 2, Grid 2: Preview Mode
Figure 10 show Grid 2 in preview mode. Note the following:
• For HSP_View, Year, Version, and Product , the viewers cannot change theselection.
• For Scenario, viewers can select only from the two defined members. .
• For Entity, viewers can select any member. "Entity" is displayed when the grid ispreviewed.
Figure 3-18 Example 2: Report Preview
Figure 11 shows a preview of the report with both grids. Note the following:
• The common dimension names are Entity and Scenario.
• The combined POV when previewing contains the following:
– The global POV for Scenario drives both grids.
– The local POV for Entity in each grid has a different selection.
Chapter 3Defining the Grid Point of View
3-23
– Years, Segments, and Currencies for Grid 1 can be changed.
– HSP_View, Year, Version, and Product for Grid 2 cannot be changed.
Example 3: Two Grids with Different Data Sources and Multiple Selections inCommon Dimension
Figure 3-19 Preview: Two Grids with Multiple Selections in a Dimension
In this third example, a report contains two grids with different data sources. Grid 1 hasan Oracle Enterprise Performance Reporting Cloud data source. Grid 2 has an OracleEnterprise Planning and Budgeting Cloud data source.
The Entity and Scenarios dimensions are common across both data sources. Inaddition, the Scenario dimension uses a member selection function to return multiplemembers.
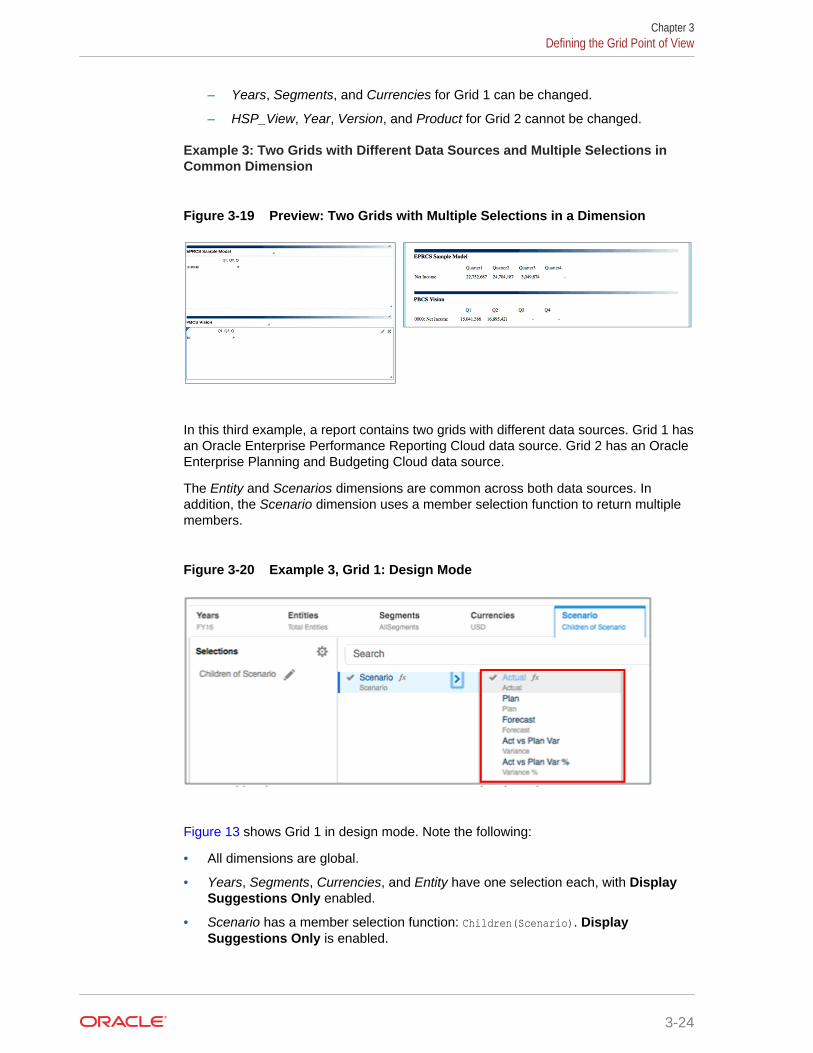
Figure 3-20 Example 3, Grid 1: Design Mode
Figure 13 shows Grid 1 in design mode. Note the following:
• All dimensions are global.
• Years, Segments, Currencies, and Entity have one selection each, with DisplaySuggestions Only enabled.
• Scenario has a member selection function: Children(Scenario). DisplaySuggestions Only is enabled.
Chapter 3Defining the Grid Point of View
3-24
Note:
Notice that there are five members listed for Scenario: Actual, Plan,Forecast, Act vs Plan Var, and Act vs Play Var %.
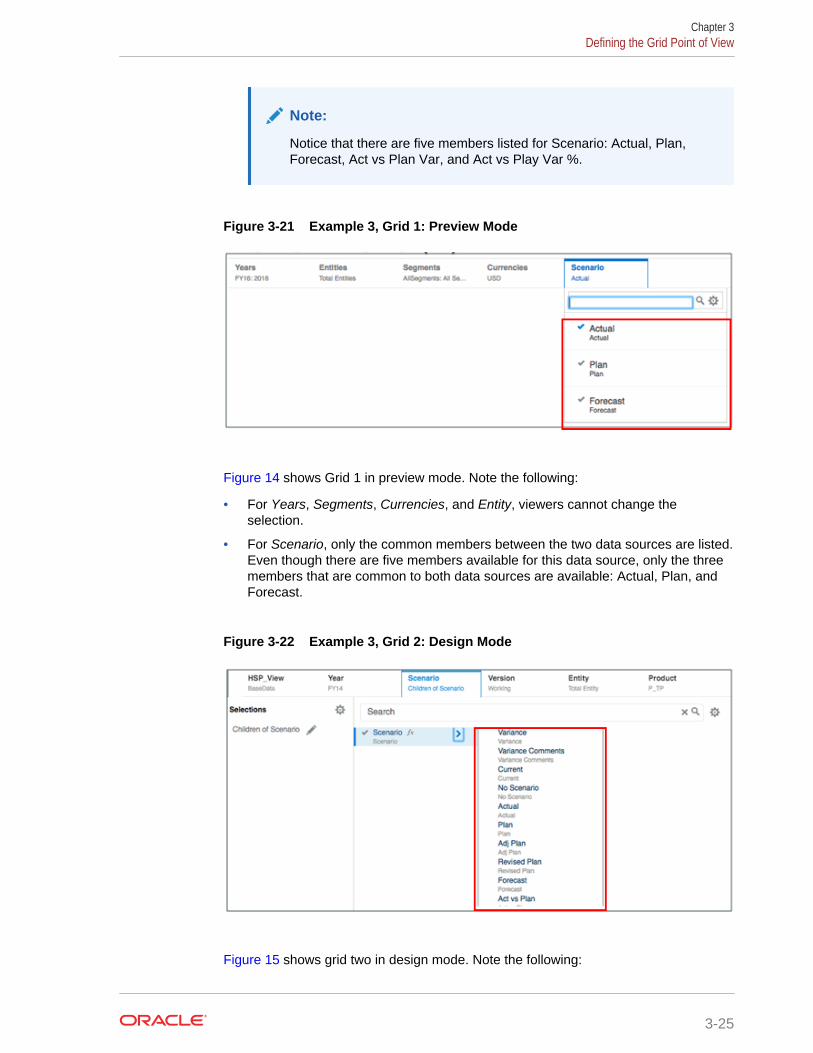
Figure 3-21 Example 3, Grid 1: Preview Mode
Figure 14 shows Grid 1 in preview mode. Note the following:
• For Years, Segments, Currencies, and Entity, viewers cannot change theselection.
• For Scenario, only the common members between the two data sources are listed.Even though there are five members available for this data source, only the threemembers that are common to both data sources are available: Actual, Plan, andForecast.
Figure 3-22 Example 3, Grid 2: Design Mode
Figure 15 shows grid two in design mode. Note the following:
Chapter 3Defining the Grid Point of View
3-25
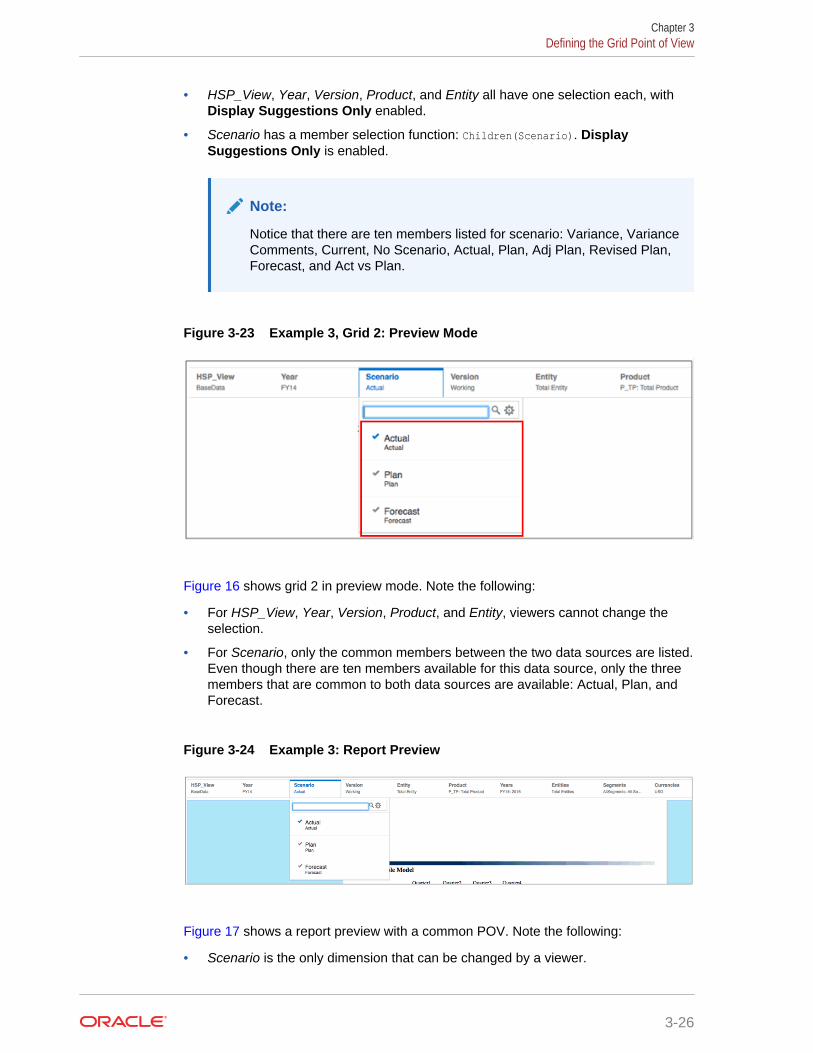
• HSP_View, Year, Version, Product, and Entity all have one selection each, withDisplay Suggestions Only enabled.
• Scenario has a member selection function: Children(Scenario). DisplaySuggestions Only is enabled.
Note:
Notice that there are ten members listed for scenario: Variance, VarianceComments, Current, No Scenario, Actual, Plan, Adj Plan, Revised Plan,Forecast, and Act vs Plan.
Figure 3-23 Example 3, Grid 2: Preview Mode
Figure 16 shows grid 2 in preview mode. Note the following:
• For HSP_View, Year, Version, Product, and Entity, viewers cannot change theselection.
• For Scenario, only the common members between the two data sources are listed.Even though there are ten members available for this data source, only the threemembers that are common to both data sources are available: Actual, Plan, andForecast.
Figure 3-24 Example 3: Report Preview
Figure 17 shows a report preview with a common POV. Note the following:
• Scenario is the only dimension that can be changed by a viewer.
Chapter 3Defining the Grid Point of View
3-26
• Only the Scenario members that are common to both data sources are able to beselected: Actual, Plan, and Forecast.
Working With Rows and Columns in GridsYou organize and add content to grids by adding data, formula, text, and separatorrows and columns.
Related Topics
• Inserting Rows and Columns
• Copying, Moving, and Deleting Rows and Columns
• Hiding Rows or Columns
• Merging and Separating Rows or Columns
• Inserting Page Breaks Before a Row or Column
• Defining Formula Rows and Columns
Inserting Rows and ColumnsYou insert rows or columns into a grid to add content, such as data, formulas, and text,to the grid. Types of rows and columns include:
• Data—Members of dimensions that are retrieved from a database connection. Themember in a data row or column defaults to the top-level member of thedimension.
Note:
A data segment is a row or column that retrieves data from a database.An expanded data segment is a row or column that can expand, so thatthe resulting grid expands to two or more rows or columns when viewed.Often, expanded data segments use functions such as Children Of orDescendants Of. A single data segment is a row or column that remainsa single row or column when shown in the viewer.
A # symbol in the cell, row, or column indicates that it is a data cell, row, orcolumn.
• Formula—Values based on formulas. Commonly used to calculate totals,averages, and variances on data rows or columns.
An = # symbol in the cell, row, or column indicates that it is a formula cell, row, orcolumn.
• Text—Text typed into the cells or returned dynamically through a text function.
Text rows, columns, or cells in grids do not contain symbols when added to a grid.They are initially blank until populated with text.
• Separator—Inserts a blank row or column.
Separator rows do not contain data or text. They serve as a visual dividing linebetween rows or columns in a grid.
Chapter 3Working With Rows and Columns in Grids
3-27

To insert a row or a column in a grid:
1. In an existing grid, select a row or column header.
2. Right-click, or click the arrow next to the column or row header cell, and selectInsert Before or Insert After, and then select Data, Formula, Text, or Separator.
3. Populate the row or column:
• For a data row or column, right-click the row or column heading or click thearrow next to the column or row header cell, and then select dimensionmembers to place in the row or column. See Assigning Members to DataRows or Columns.
• For a formula row or column, select the row or column heading and build aformula in the formula bar at the top of the Report Designer. See DefiningFormula Rows and Columns
• For a text row or column, enter text or text function directly in the row, column,or cell, in the formula bar at the top of the Report Designer, or in TextProperties. See Formatting Text Boxes.
Copying, Moving, and Deleting Rows and ColumnsWhen copying, moving, and deleting rows and columns, keep in mind the followingpoints:
• Moving a row or column will delete the source row or column after you paste thecontents in a new position.
• Copying a row or column will keep the source row or column after you paste thecontents in a new position.
• If you copy or move a row or column, you can paste it only in the same grid.
• You must copy or move the entire row or column.
To copy or move rows and columns in grids, select the desired rows or columns, andthen right-click or click the down arrow in the header, and select either Copy or Move.Then, select the row or column that you want to move the rows or columns, and right-click or click the down arrow in the header, and select Paste Before or Paste After.
To delete rows or columns, select the desired rows or columns, and then right-click orclick the down arrow in the header and select Delete.
Hiding Rows or ColumnsYou can hide rows or columns in a grid so that the values are not displayed when youprint or view a report.
Note:
The data and calculations in rows or columns are evaluated, regardless ofthe formatting that is applied to them.
To hide a row or column in a grid:
Chapter 3Working With Rows and Columns in Grids
3-28
1. In the Grid Designer, select a row or a column.
2. In the Properties panel, click for columns, or for rows.
3. In Display, click Show to toggle it to Hide.
Merging and Separating Rows or ColumnsYou can separate multiple member selections in a data row or column, or you cancombine multiple data row or column selections into a single data row or column.
Merging Rows or Columns
To merge rows or columns, select multiple rows or columns, right-click, and selectMerge Rows or Merge Columns.
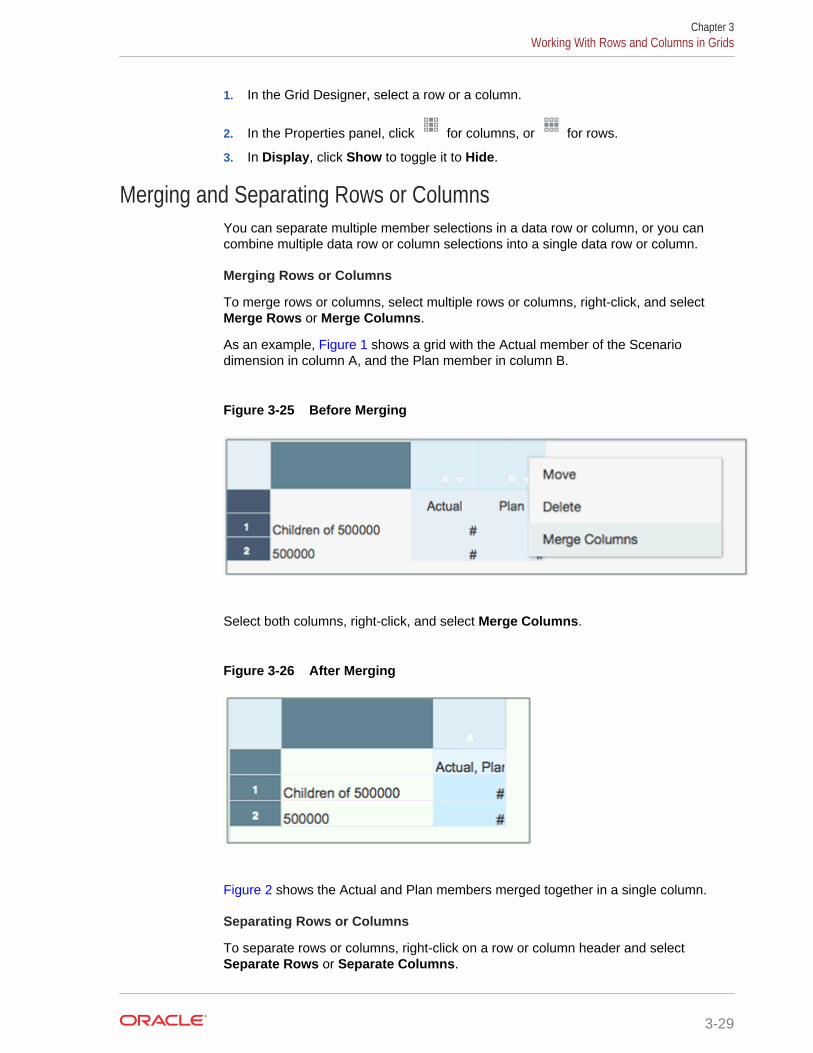
As an example, Figure 1 shows a grid with the Actual member of the Scenariodimension in column A, and the Plan member in column B.
Figure 3-25 Before Merging
Select both columns, right-click, and select Merge Columns.
Figure 3-26 After Merging
Figure 2 shows the Actual and Plan members merged together in a single column.
Separating Rows or Columns
To separate rows or columns, right-click on a row or column header and selectSeparate Rows or Separate Columns.
Chapter 3Working With Rows and Columns in Grids
3-29

As an example, Figure 3 shows a grid with the Actual and Plan members of theScenario dimension in column A.
Figure 3-27 Before Separating
Select the column, right-click, and select Separate Columns.
Figure 3-28 After Separating
Figure 4 shows the Actual and Plan members separated into two columns.
Inserting Page Breaks Before a Row or ColumnInserting a page break before a row or column in a grid enables you to break thereport data at a specified location while keeping required line items together. Pagebreaks are indicated with a heavy, dashed line.
To insert a page break before a row or column in a grid:
1. With a grid displayed in the Report Designer, select a row or column.
You cannot insert a page break before the first column in a report or above the firstrow in a report.
Chapter 3Working With Rows and Columns in Grids
3-30
2. In the Properties panel, click for columns, or for rows.
3. In Page Break Before, click No to toggle it to Yes.
Defining Formula Rows and ColumnsA formula consists of a combination of grid references, mathematical functions, andarithmetic operators. A grid reference uses values from the current grid or another gridin a calculation. You can define arithmetic formulas on formula rows, columns, cells, ora range of formula cells in a grid. For example, you can build a formula that adds oneor more rows. Or, you can multiply two rows, add a third row, then display the result.For an explanation of the mathematical functions you can use in formulas, see Mathematical Functions.
When defining formula rows or columns, keep in mind the following points:
• Formula results are calculated based on the underlying data values in one or morespecified cells. If the cells used in a formula are formatted to use scaling, theformula results may differ from the displayed values for the cells, since theunderlying, unformatted data values are used in the formula.
• By default, cells that contain missing data (#MISSING) are not treated as zero (0) informulas, unless specified differently using the "IfNonNumber" property. In aformula that uses division, an error is returned.
Inserting a Formula Row or ColumnTo insert a formula row or column:
1. Select a row or column, then select Insert Before or Insert After, and then selectFormula
The formula row or columns is inserted with a = #
2. In the formula bar at the top of the Grid Designer, enter a formula, or click toselect from a list of formulas.
See Using the Formula Bar.
Calculating at the Cell LevelYou can create a custom cell-level formula on cells in a formula row or column.
Figure 1 shows an example of a cell that is calculated to display the % variance. CellD4 displays the % variance between the sum of "Jan" and the sum of "Feb";specifically, ((356-350)/350) *100=1.71%. A cell level formula gives the intended resultby placing a custom formula in the cell D4. The formula needed to get the correctresult is (([B]-[A])/[A])* 100.
Chapter 3Working With Rows and Columns in Grids
3-31

Figure 3-29 Reason for Using Cell Level Calculation
To calculate at the cell level:
1. Select a formula cell or cells.
2. In the formula bar at the top of the Report Designer, click , and perform anaction:
• Select Use the Column/Row Formula to use the default formula for thecolumn or row.
• Select Custom Formula to create your own formula. Enter the formula in the
formula text box to the right, or click to select from a list of formulas.
See Using the Formula Bar.
Using the Formula BarThe formula bar provides a central location to create formulas and select memberswhen setting up grids in Management Reporting.
.The formula bar provides different functionality depending on the row or column type:
• For formula rows and columns, you enter formulas and set the row or columnheader label.
• For data rows and columns, you select members and set the row or columnheader label.
• For text rows and columns, you enter text to display in the grid.
The formula bar is displayed below the POV bar so you can easily access itsfunctionality.
Creating FormulasWhen you select a cell, column, or row containing a formula, you can apply a uniqueformula to that cell. When you create formulas, keep in mind the following points:
• For optimal performance, use row or column formulas as opposed to cell formulaswhenever possible.
• Avoid using cross-axis references and consider using a cell reference if possible.
To create a formula:
Chapter 3Using the Formula Bar
3-32
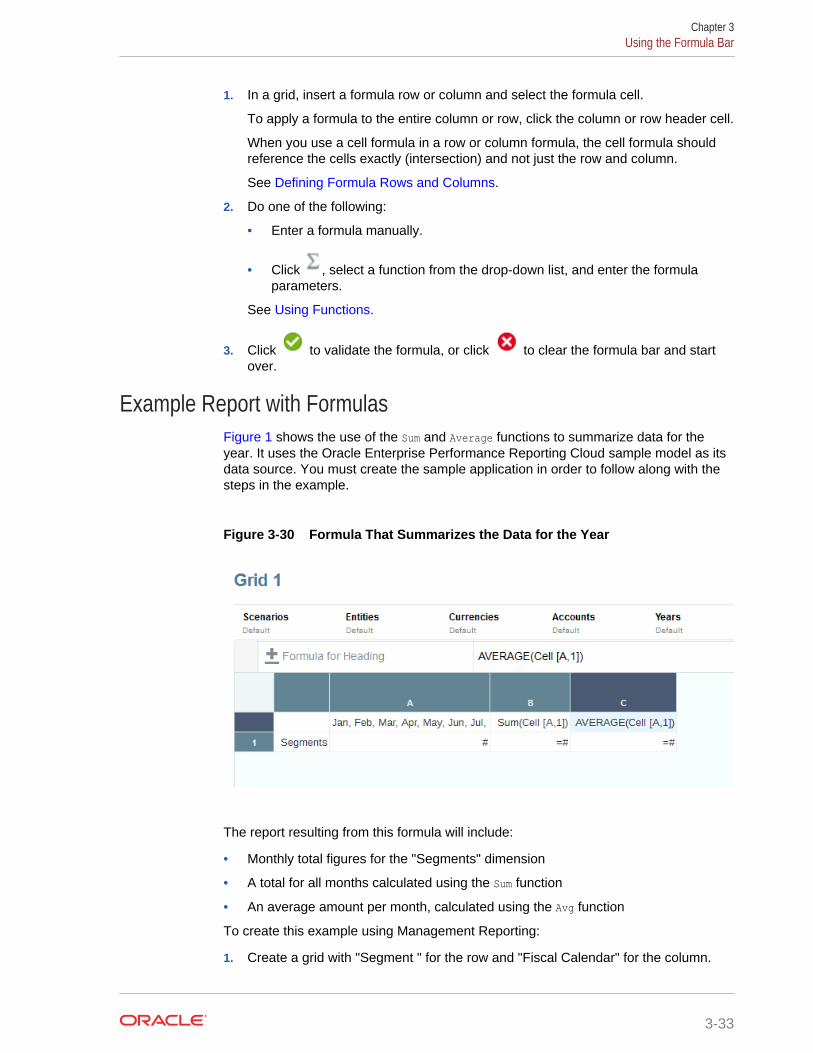
1. In a grid, insert a formula row or column and select the formula cell.
To apply a formula to the entire column or row, click the column or row header cell.
When you use a cell formula in a row or column formula, the cell formula shouldreference the cells exactly (intersection) and not just the row and column.
See Defining Formula Rows and Columns.
2. Do one of the following:
• Enter a formula manually.
• Click , select a function from the drop-down list, and enter the formulaparameters.
See Using Functions.
3. Click to validate the formula, or click to clear the formula bar and startover.
Example Report with FormulasFigure 1 shows the use of the Sum and Average functions to summarize data for theyear. It uses the Oracle Enterprise Performance Reporting Cloud sample model as itsdata source. You must create the sample application in order to follow along with thesteps in the example.
Figure 3-30 Formula That Summarizes the Data for the Year
The report resulting from this formula will include:
• Monthly total figures for the "Segments" dimension
• A total for all months calculated using the Sum function
• An average amount per month, calculated using the Avg function
To create this example using Management Reporting:
1. Create a grid with "Segment " for the row and "Fiscal Calendar" for the column.
Chapter 3Using the Formula Bar
3-33

2. Select the cell that contains "Fiscal Calendar", and then click to bring upmember selection.
3. Place all twelve months in the selected pane and remove "Fiscal Calendar".
4. Insert two formula columns: one for the annual total and another for the averagemonthly amount.
In this example:
• The first formula column that falls outside the months of the "Fiscal Calendar"member contains a Sum function that adds the figures for each month. Since allmonths are defined in one cell, the reference is to that cell location.
The formula is:
Sum(Cell [A,1])
• The second formula column calculates the average of the months for the "FiscalCalendar" member. Because there are 12 months in a year, the Avg function addsall monthly totals and divides the total by 12.
The formula is:
Average(Cell [A,1])
In general, there are two ways to specify a data formula in a grid, a row or columnformula, or a cell formula:
• Row/Column—Apply a formula to the entire row or column, relative to each cell inthat row or column.
To define the formula, select the formula row or column header, and then enter theformula in the formula bar. There are some performance benefits when applyingrow/column formulas.
• Cell—Apply a formula only to cells in a formula row or column.
To define the formula, select the cell, click , select Custom Formula , andthen enter the formula in the formula bar.
If the cell intersects a formula row and formula column, you can select to use therow formula or the column formula as the cell formula. For more information, see Calculating at the Cell Level.
If a formula repeats for each cell in a row or column, use a "Row/Column" formula. Ifdifferent formulas are performed on each cell, use a "cell" formula.
Modifying Member Selection Using the Formula BarWhen working with members in a grid, you use the formula bar to modify the selectedmembers.
To modify member selection using the formula bar:
1. In a grid, select a heading cell of a data row or column.
2. Do one or more of the following:
• Click the X next to a member name to remove it from the grid.
• Manually enter a member name to add it to the grid.
Chapter 3Using the Formula Bar
3-34
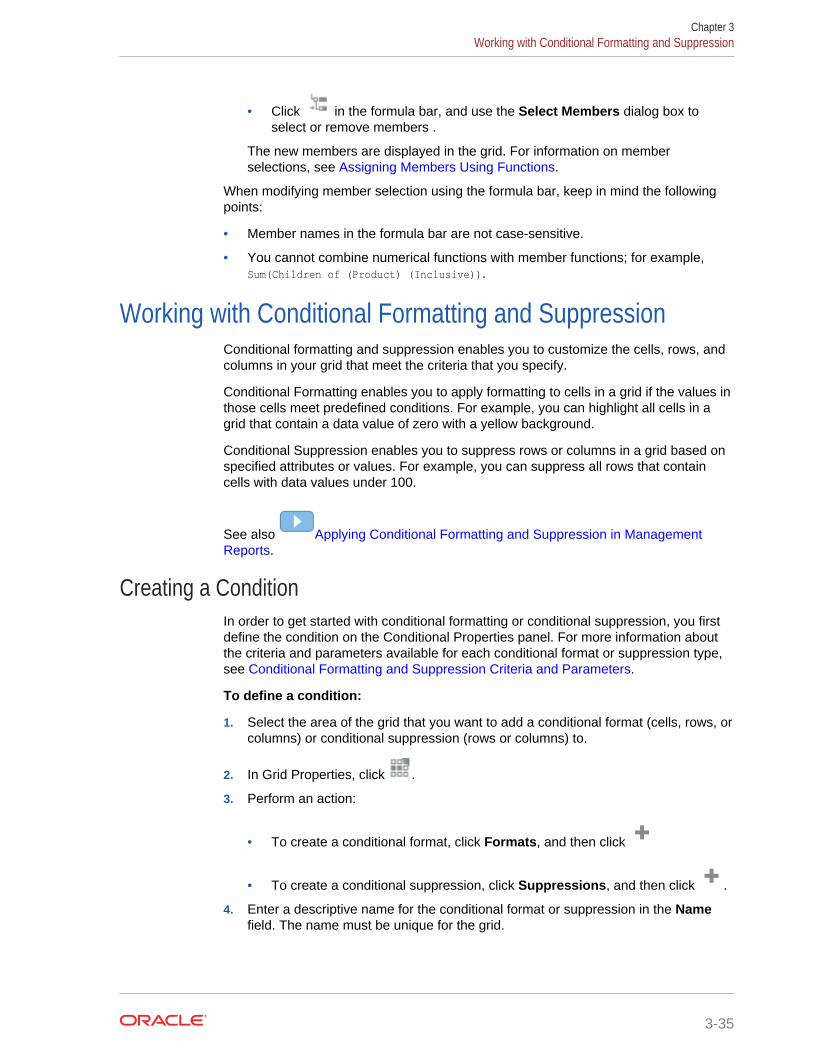
• Click in the formula bar, and use the Select Members dialog box toselect or remove members .
The new members are displayed in the grid. For information on memberselections, see Assigning Members Using Functions.
When modifying member selection using the formula bar, keep in mind the followingpoints:
• Member names in the formula bar are not case-sensitive.
• You cannot combine numerical functions with member functions; for example,Sum(Children of (Product) (Inclusive)).
Working with Conditional Formatting and SuppressionConditional formatting and suppression enables you to customize the cells, rows, andcolumns in your grid that meet the criteria that you specify.
Conditional Formatting enables you to apply formatting to cells in a grid if the values inthose cells meet predefined conditions. For example, you can highlight all cells in agrid that contain a data value of zero with a yellow background.
Conditional Suppression enables you to suppress rows or columns in a grid based onspecified attributes or values. For example, you can suppress all rows that containcells with data values under 100.
See also Applying Conditional Formatting and Suppression in ManagementReports.
Creating a ConditionIn order to get started with conditional formatting or conditional suppression, you firstdefine the condition on the Conditional Properties panel. For more information aboutthe criteria and parameters available for each conditional format or suppression type,see Conditional Formatting and Suppression Criteria and Parameters.
To define a condition:
1. Select the area of the grid that you want to add a conditional format (cells, rows, orcolumns) or conditional suppression (rows or columns) to.
2. In Grid Properties, click .
3. Perform an action:
• To create a conditional format, click Formats, and then click
• To create a conditional suppression, click Suppressions, and then click .
4. Enter a descriptive name for the conditional format or suppression in the Namefield. The name must be unique for the grid.
Chapter 3Working with Conditional Formatting and Suppression
3-35
Note:
You do not need to enter anything in the Applies To field. After youcreate the condition, the Applies To field will list the areas of the grid thatyou identified in step 1. You can modify the values in the Applies To fieldto change the area of the grid that you want the condition to apply to.
5. In the expression builder, click Type to select the type of condition you want to testfor. For example, you can test on the current cell value, or a member name.
After you select the Type, the Qualifier and Operator fields will change to reflectthe available parameters.
6. If applicable, specify a Qualifier. For example, if you selected Member Name forthe type, you then enter the name of the member that you want to test for as thequalifier.
7. Select an Operator.
• For numerical conditions (data values), use a numerical operator (equal to, notequal to, greater than, less than, and so on.).
• For textual conditions (for example, Member Name) use a textual operator(starts with, ends with, and so on).
8. Select or enter a Right Qualifier, which is the condition that you are testing for.
• For numeric qualifiers, you can use delimiters and the negative sign (-). Allother prefixes and suffixes are ignored.
• For textual qualifiers (such as Member Name), manually enter the text stringthat you want to test for.
Note:
Member Selector is not available in the expression builder.
9. Optional: Click to insert additional expression condition rows.
Use AND or OR to combine or differentiate the conditions. For example, you cancreate a condition that tests for data values greater than or equal to 100 AND lessthan or equal to 1000.
Click to remove an expression condition row.
10. Formatting Only: In the right panel, specify the format (for example, font size,border, and shading) for the condition. Click # to open the number formattingmenu. See Formatting Numbers in Formatting Grid Cells.
The format that you specify is displayed in the sample at the top of the panel.
11. Optional: Select (or multi-select) an expression condition row, and then right-click
or select to group, remove, duplicate, or move them up or down.
12. Click OK to save the condition.
Chapter 3Working with Conditional Formatting and Suppression
3-36
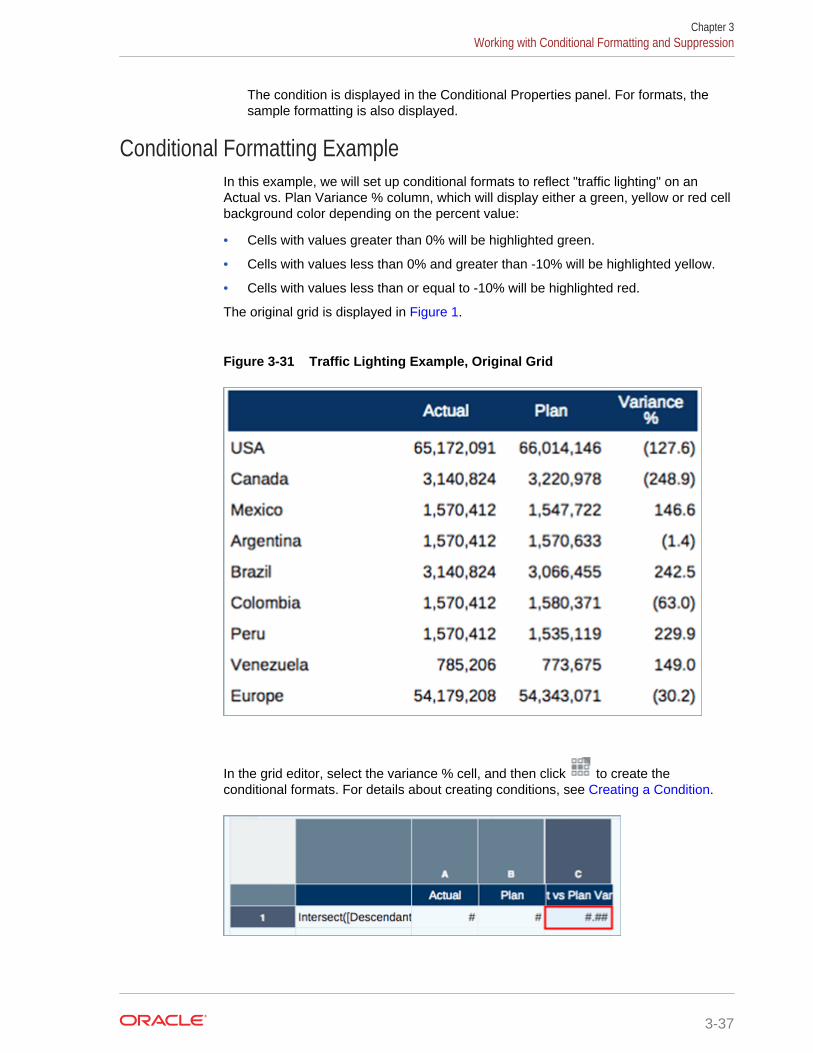
The condition is displayed in the Conditional Properties panel. For formats, thesample formatting is also displayed.
Conditional Formatting ExampleIn this example, we will set up conditional formats to reflect "traffic lighting" on anActual vs. Plan Variance % column, which will display either a green, yellow or red cellbackground color depending on the percent value:
• Cells with values greater than 0% will be highlighted green.
• Cells with values less than 0% and greater than -10% will be highlighted yellow.
• Cells with values less than or equal to -10% will be highlighted red.
The original grid is displayed in Figure 1.
Figure 3-31 Traffic Lighting Example, Original Grid
In the grid editor, select the variance % cell, and then click to create theconditional formats. For details about creating conditions, see Creating a Condition.
Chapter 3Working with Conditional Formatting and Suppression
3-37

For the Green condition, create a conditional format where the Current Cell Value isgreater than 0:
For the Yellow condition, create a conditional format with two expressions:
• Current Cell Value is less than 0, AND
• Current Cell Value is greater than -10
For the Red condition, create a conditional format where the Current Cell Value is lessthan -10:
Chapter 3Working with Conditional Formatting and Suppression
3-38
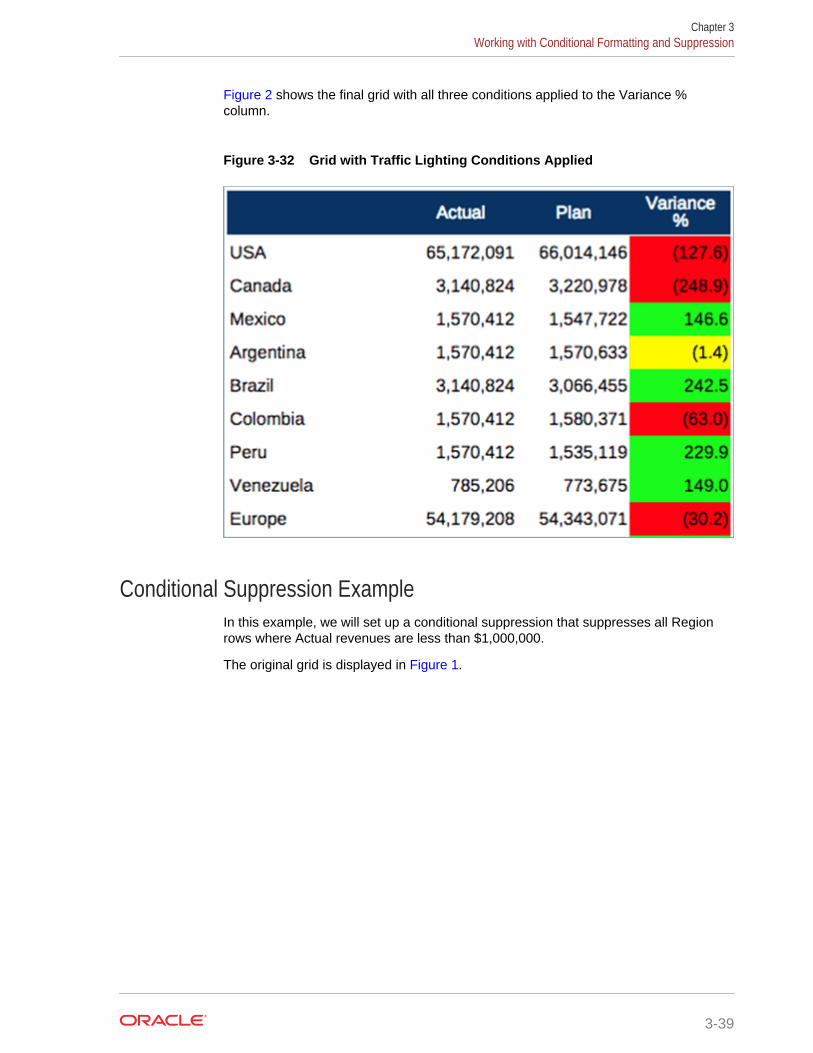
Figure 2 shows the final grid with all three conditions applied to the Variance %column.
Figure 3-32 Grid with Traffic Lighting Conditions Applied
Conditional Suppression ExampleIn this example, we will set up a conditional suppression that suppresses all Regionrows where Actual revenues are less than $1,000,000.
The original grid is displayed in Figure 1.
Chapter 3Working with Conditional Formatting and Suppression
3-39
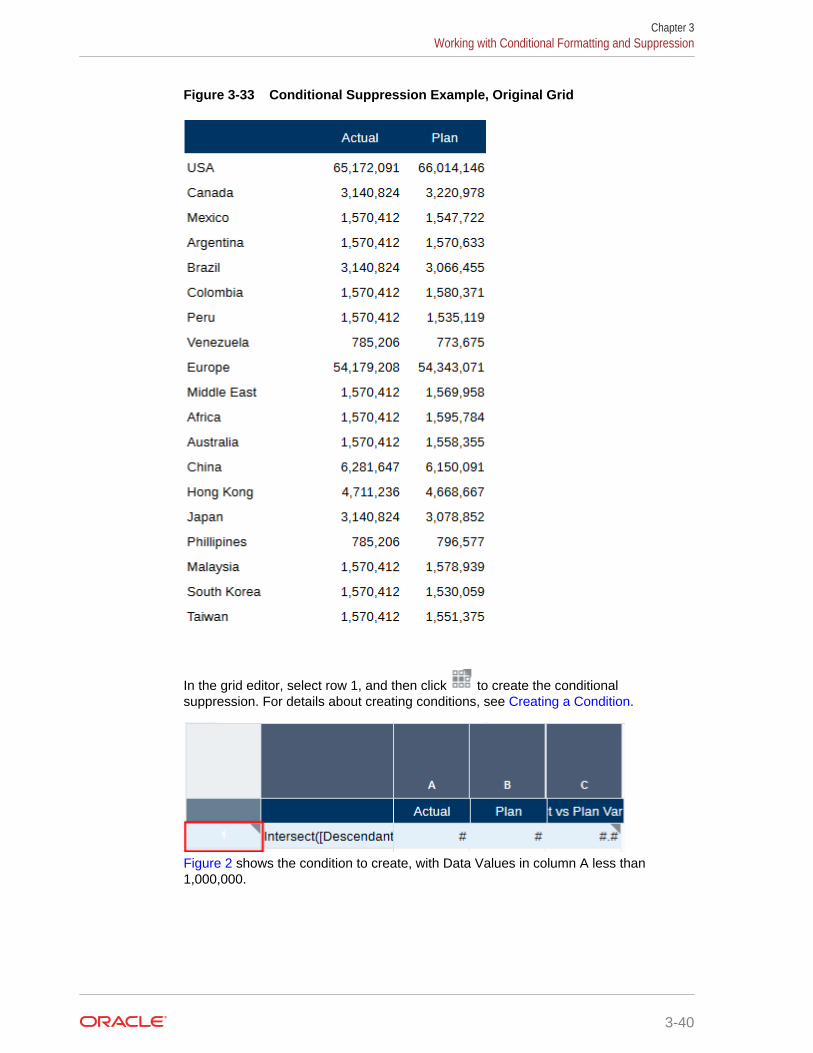
Figure 3-33 Conditional Suppression Example, Original Grid
In the grid editor, select row 1, and then click to create the conditionalsuppression. For details about creating conditions, see Creating a Condition.
Figure 2 shows the condition to create, with Data Values in column A less than1,000,000.
Chapter 3Working with Conditional Formatting and Suppression
3-40
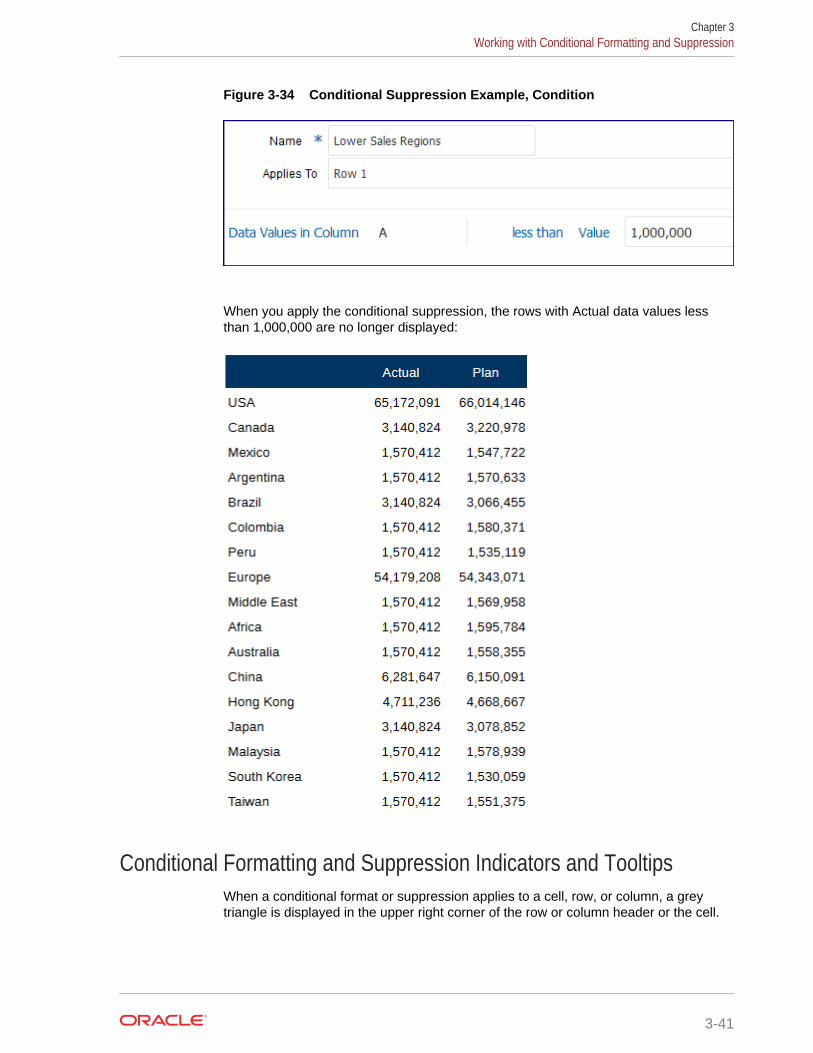
Figure 3-34 Conditional Suppression Example, Condition
When you apply the conditional suppression, the rows with Actual data values lessthan 1,000,000 are no longer displayed:
Conditional Formatting and Suppression Indicators and TooltipsWhen a conditional format or suppression applies to a cell, row, or column, a greytriangle is displayed in the upper right corner of the row or column header or the cell.
Chapter 3Working with Conditional Formatting and Suppression
3-41
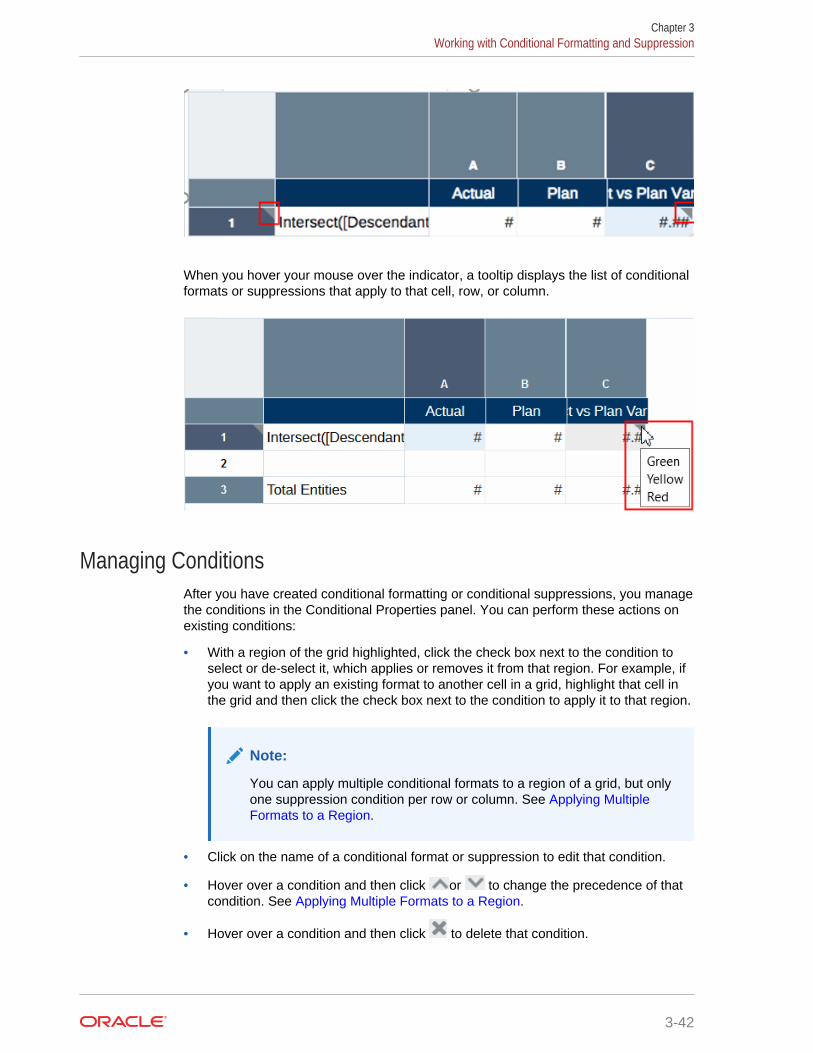
When you hover your mouse over the indicator, a tooltip displays the list of conditionalformats or suppressions that apply to that cell, row, or column.
Managing ConditionsAfter you have created conditional formatting or conditional suppressions, you managethe conditions in the Conditional Properties panel. You can perform these actions onexisting conditions:
• With a region of the grid highlighted, click the check box next to the condition toselect or de-select it, which applies or removes it from that region. For example, ifyou want to apply an existing format to another cell in a grid, highlight that cell inthe grid and then click the check box next to the condition to apply it to that region.
Note:
You can apply multiple conditional formats to a region of a grid, but onlyone suppression condition per row or column. See Applying MultipleFormats to a Region.
• Click on the name of a conditional format or suppression to edit that condition.
• Hover over a condition and then click or to change the precedence of thatcondition. See Applying Multiple Formats to a Region.
• Hover over a condition and then click to delete that condition.
Chapter 3Working with Conditional Formatting and Suppression
3-42

Applying Multiple Formats to a Region
You can apply multiple formats to a selected region of a grid. When conditions overlap,conditional formats are applied in an order of precedence from top to bottom in the list.For example, Figure 1 shows three conditional formats that are active for a selectedregion (note that all three formats have check marks next to them). In this example,the Green format has precedence over Yellow and Red, and the Yellow format hasprecedence over Red.
Figure 3-35 Multiple Formats Example
To change the order of precedence, hover over a conditional format, and then click
or .
Conditional Formatting and Suppression ConsiderationsPerformance Considerations
Conditional formatting and suppression can impact performance depending on thesize of the report, the criteria used, and the frequency of use (that is, how many cellshave conditional formatting or suppression applied to them). Keep in the mind thefollowing considerations for performance:
• Data value comparisons are the fastest.
• Criteria such as Member Name and Member Alias/Description are also fastbecause they are part of the metadata or data query.
• Avoid criteria such as Generation, Level, and Account Type whenever possible, asperformance is slower because those criteria are not part of the regular metadataor data query.
Chapter 3Working with Conditional Formatting and Suppression
3-43

Error Handling
Syntax errors are typically displayed in the Conditional Format/Suppression editor:
Non-syntax errors are displayed when you preview the report or grid. For example, if aconditional suppression on a row refers to Column B and that column is deleted fromthe grid, an error is displayed when you preview the report:
Chapter 3Working with Conditional Formatting and Suppression
3-44
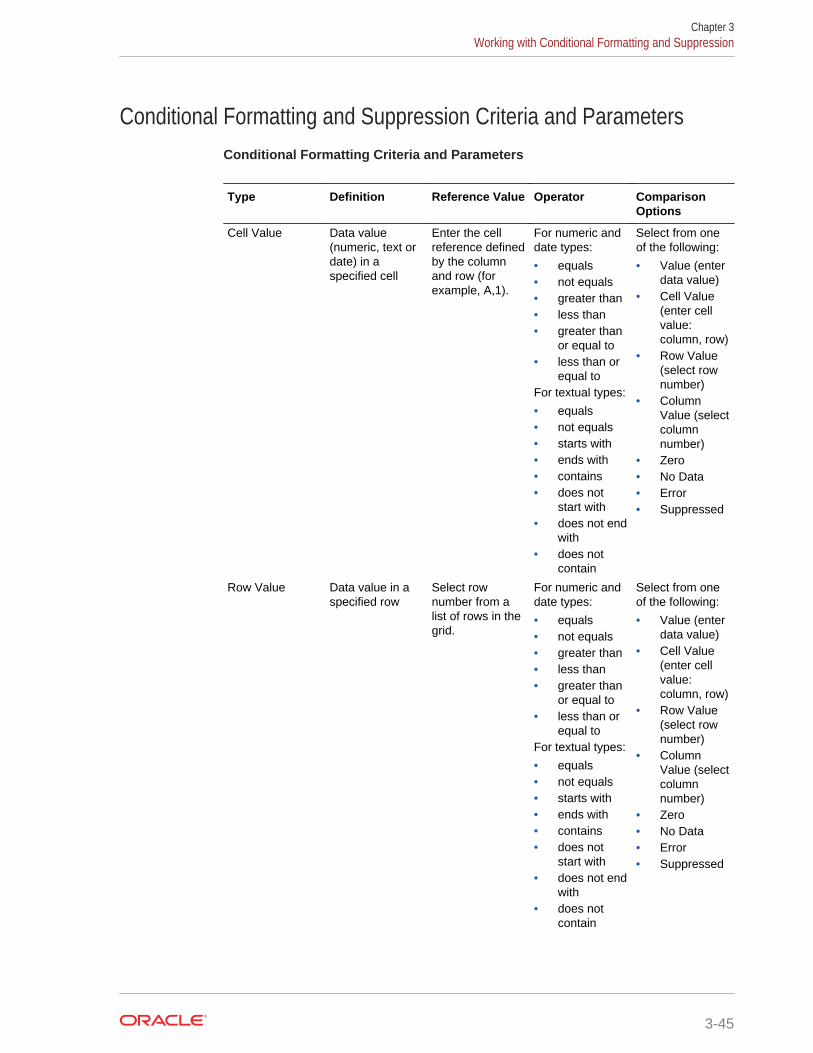
Conditional Formatting and Suppression Criteria and ParametersConditional Formatting Criteria and Parameters
Type Definition Reference Value Operator ComparisonOptions
Cell Value Data value(numeric, text ordate) in aspecified cell
Enter the cellreference definedby the columnand row (forexample, A,1).
For numeric anddate types:
• equals• not equals• greater than• less than• greater than
or equal to• less than or
equal toFor textual types:
• equals• not equals• starts with• ends with• contains• does not
start with• does not end
with• does not
contain
Select from oneof the following:
• Value (enterdata value)
• Cell Value(enter cellvalue:column, row)
• Row Value(select rownumber)
• ColumnValue (selectcolumnnumber)
• Zero• No Data• Error• Suppressed
Row Value Data value in aspecified row
Select rownumber from alist of rows in thegrid.
For numeric anddate types:
• equals• not equals• greater than• less than• greater than
or equal to• less than or
equal toFor textual types:
• equals• not equals• starts with• ends with• contains• does not
start with• does not end
with• does not
contain
Select from oneof the following:
• Value (enterdata value)
• Cell Value(enter cellvalue:column, row)
• Row Value(select rownumber)
• ColumnValue (selectcolumnnumber)
• Zero• No Data• Error• Suppressed
Chapter 3Working with Conditional Formatting and Suppression
3-45
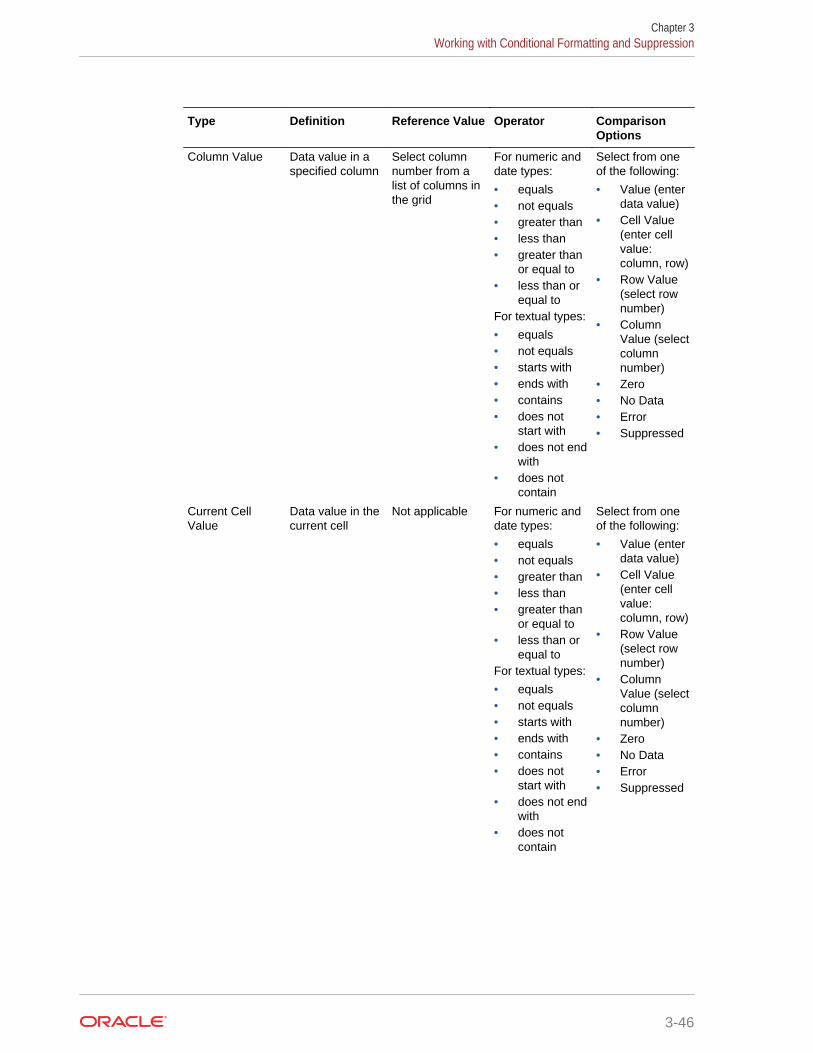
Type Definition Reference Value Operator ComparisonOptions
Column Value Data value in aspecified column
Select columnnumber from alist of columns inthe grid
For numeric anddate types:
• equals• not equals• greater than• less than• greater than
or equal to• less than or
equal toFor textual types:
• equals• not equals• starts with• ends with• contains• does not
start with• does not end
with• does not
contain
Select from oneof the following:
• Value (enterdata value)
• Cell Value(enter cellvalue:column, row)
• Row Value(select rownumber)
• ColumnValue (selectcolumnnumber)
• Zero• No Data• Error• Suppressed
Current CellValue
Data value in thecurrent cell
Not applicable For numeric anddate types:
• equals• not equals• greater than• less than• greater than
or equal to• less than or
equal toFor textual types:
• equals• not equals• starts with• ends with• contains• does not
start with• does not end
with• does not
contain
Select from oneof the following:
• Value (enterdata value)
• Cell Value(enter cellvalue:column, row)
• Row Value(select rownumber)
• ColumnValue (selectcolumnnumber)
• Zero• No Data• Error• Suppressed
Chapter 3Working with Conditional Formatting and Suppression
3-46
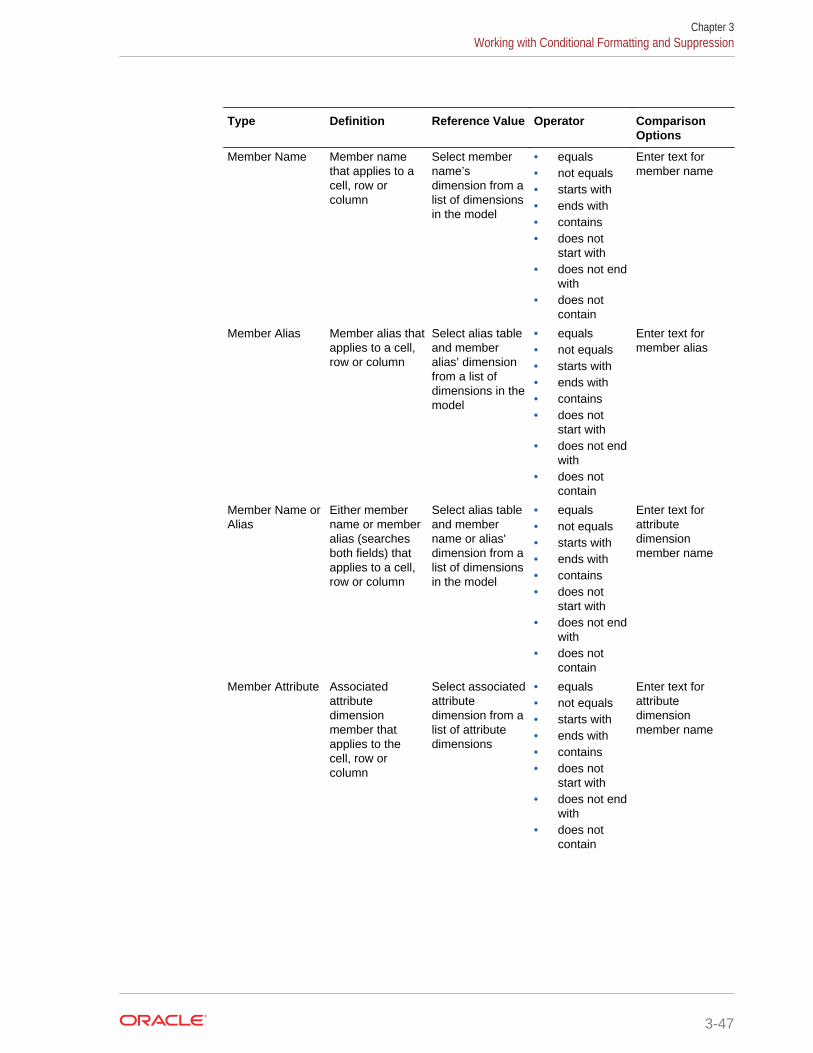
Type Definition Reference Value Operator ComparisonOptions
Member Name Member namethat applies to acell, row orcolumn
Select membername’sdimension from alist of dimensionsin the model
• equals• not equals• starts with• ends with• contains• does not
start with• does not end
with• does not
contain
Enter text formember name
Member Alias Member alias thatapplies to a cell,row or column
Select alias tableand memberalias’ dimensionfrom a list ofdimensions in themodel
• equals• not equals• starts with• ends with• contains• does not
start with• does not end
with• does not
contain
Enter text formember alias
Member Name orAlias
Either membername or memberalias (searchesboth fields) thatapplies to a cell,row or column
Select alias tableand membername or alias'dimension from alist of dimensionsin the model
• equals• not equals• starts with• ends with• contains• does not
start with• does not end
with• does not
contain
Enter text forattributedimensionmember name
Member Attribute Associatedattributedimensionmember thatapplies to thecell, row orcolumn
Select associatedattributedimension from alist of attributedimensions
• equals• not equals• starts with• ends with• contains• does not
start with• does not end
with• does not
contain
Enter text forattributedimensionmember name
Chapter 3Working with Conditional Formatting and Suppression
3-47
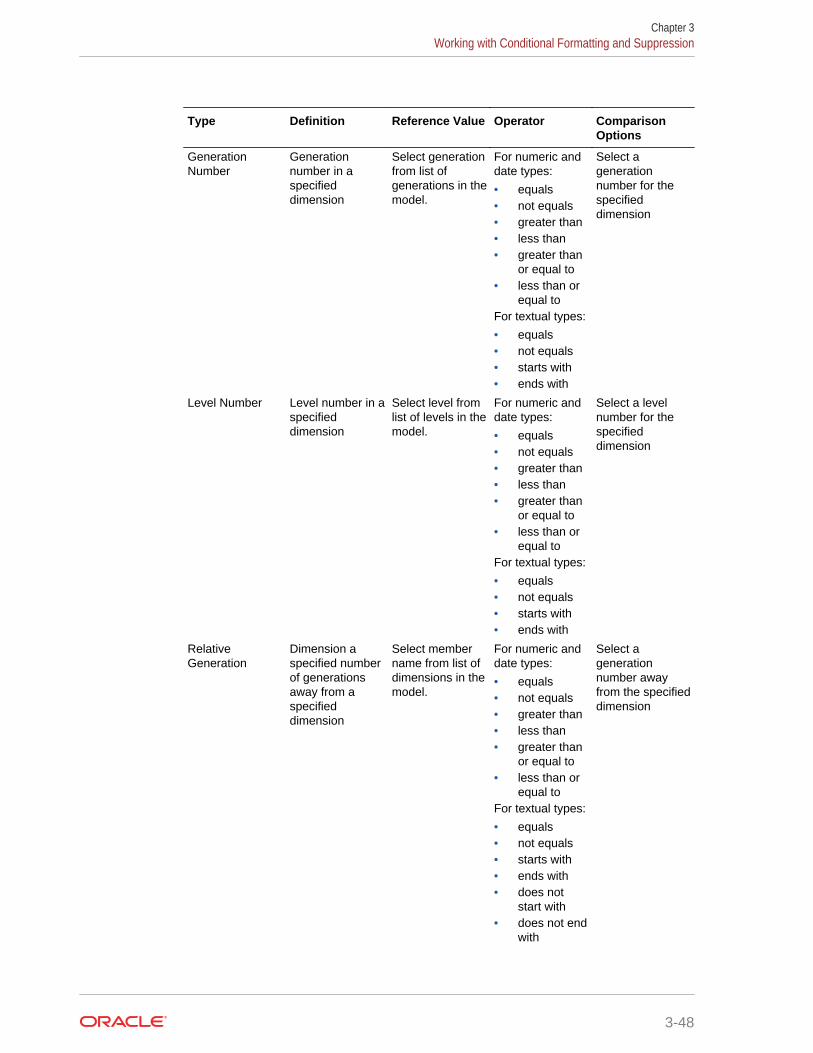
Type Definition Reference Value Operator ComparisonOptions
GenerationNumber
Generationnumber in aspecifieddimension
Select generationfrom list ofgenerations in themodel.
For numeric anddate types:
• equals• not equals• greater than• less than• greater than
or equal to• less than or
equal toFor textual types:
• equals• not equals• starts with• ends with
Select agenerationnumber for thespecifieddimension
Level Number Level number in aspecifieddimension
Select level fromlist of levels in themodel.
For numeric anddate types:
• equals• not equals• greater than• less than• greater than
or equal to• less than or
equal toFor textual types:
• equals• not equals• starts with• ends with
Select a levelnumber for thespecifieddimension
RelativeGeneration
Dimension aspecified numberof generationsaway from aspecifieddimension
Select membername from list ofdimensions in themodel.
For numeric anddate types:
• equals• not equals• greater than• less than• greater than
or equal to• less than or
equal toFor textual types:
• equals• not equals• starts with• ends with• does not
start with• does not end
with
Select agenerationnumber awayfrom the specifieddimension
Chapter 3Working with Conditional Formatting and Suppression
3-48
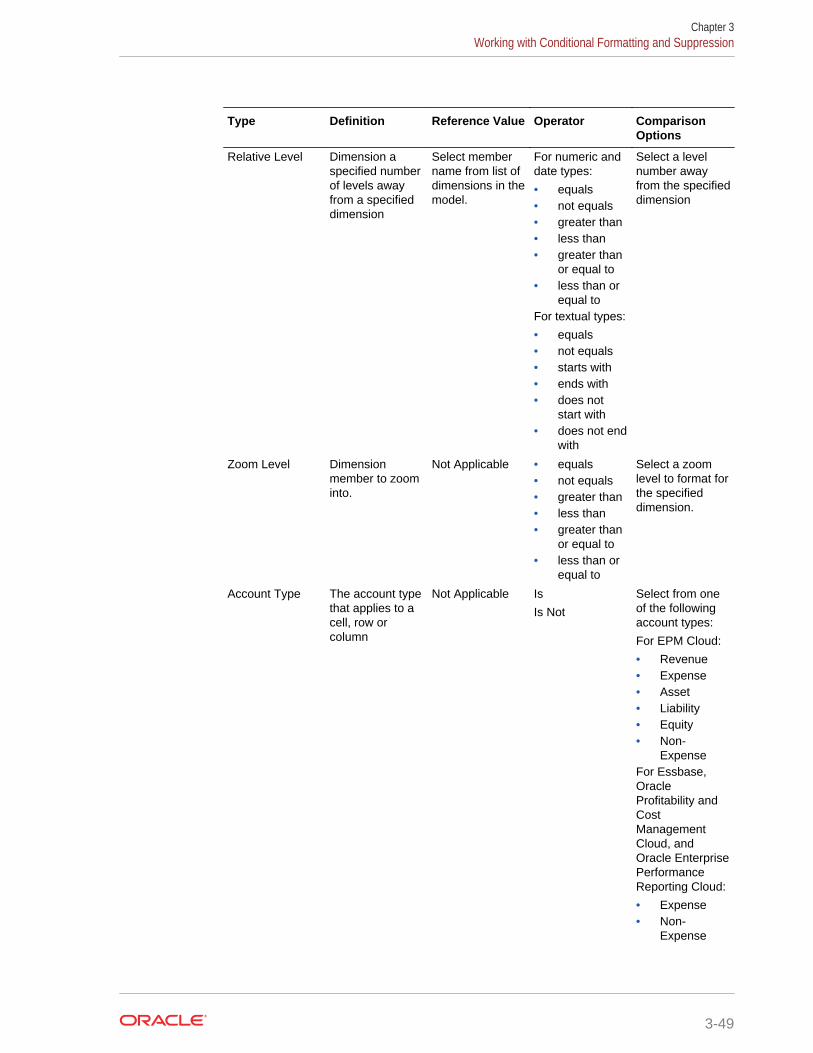
Type Definition Reference Value Operator ComparisonOptions
Relative Level Dimension aspecified numberof levels awayfrom a specifieddimension
Select membername from list ofdimensions in themodel.
For numeric anddate types:
• equals• not equals• greater than• less than• greater than
or equal to• less than or
equal toFor textual types:
• equals• not equals• starts with• ends with• does not
start with• does not end
with
Select a levelnumber awayfrom the specifieddimension
Zoom Level Dimensionmember to zoominto.
Not Applicable • equals• not equals• greater than• less than• greater than
or equal to• less than or
equal to
Select a zoomlevel to format forthe specifieddimension.
Account Type The account typethat applies to acell, row orcolumn
Not Applicable Is
Is Not
Select from oneof the followingaccount types:
For EPM Cloud:
• Revenue• Expense• Asset• Liability• Equity• Non-
ExpenseFor Essbase,OracleProfitability andCostManagementCloud, andOracle EnterprisePerformanceReporting Cloud:
• Expense• Non-
Expense
Chapter 3Working with Conditional Formatting and Suppression
3-49
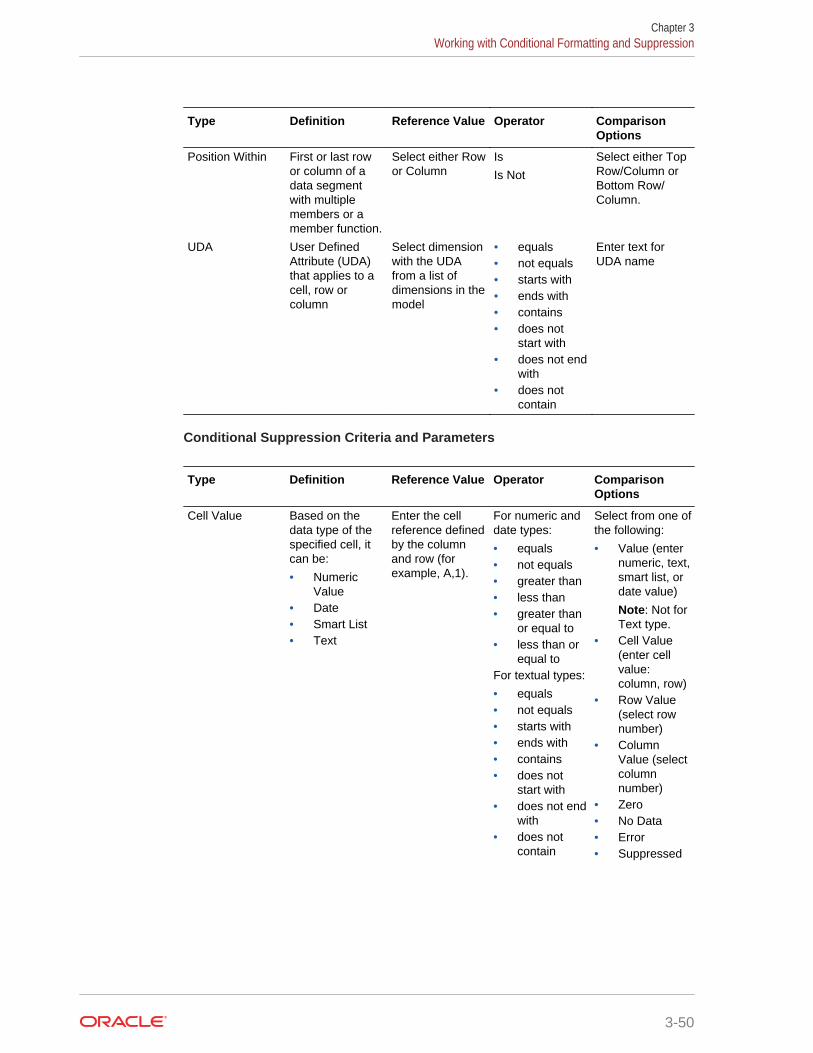
Type Definition Reference Value Operator ComparisonOptions
Position Within First or last rowor column of adata segmentwith multiplemembers or amember function.
Select either Rowor Column
Is
Is Not
Select either TopRow/Column orBottom Row/Column.
UDA User DefinedAttribute (UDA)that applies to acell, row orcolumn
Select dimensionwith the UDAfrom a list ofdimensions in themodel
• equals• not equals• starts with• ends with• contains• does not
start with• does not end
with• does not
contain
Enter text forUDA name
Conditional Suppression Criteria and Parameters
Type Definition Reference Value Operator ComparisonOptions
Cell Value Based on thedata type of thespecified cell, itcan be:
• NumericValue
• Date• Smart List• Text
Enter the cellreference definedby the columnand row (forexample, A,1).
For numeric anddate types:
• equals• not equals• greater than• less than• greater than
or equal to• less than or
equal toFor textual types:
• equals• not equals• starts with• ends with• contains• does not
start with• does not end
with• does not
contain
Select from one ofthe following:
• Value (enternumeric, text,smart list, ordate value)
Note: Not forText type.
• Cell Value(enter cellvalue:column, row)
• Row Value(select rownumber)
• ColumnValue (selectcolumnnumber)
• Zero• No Data• Error• Suppressed
Chapter 3Working with Conditional Formatting and Suppression
3-50
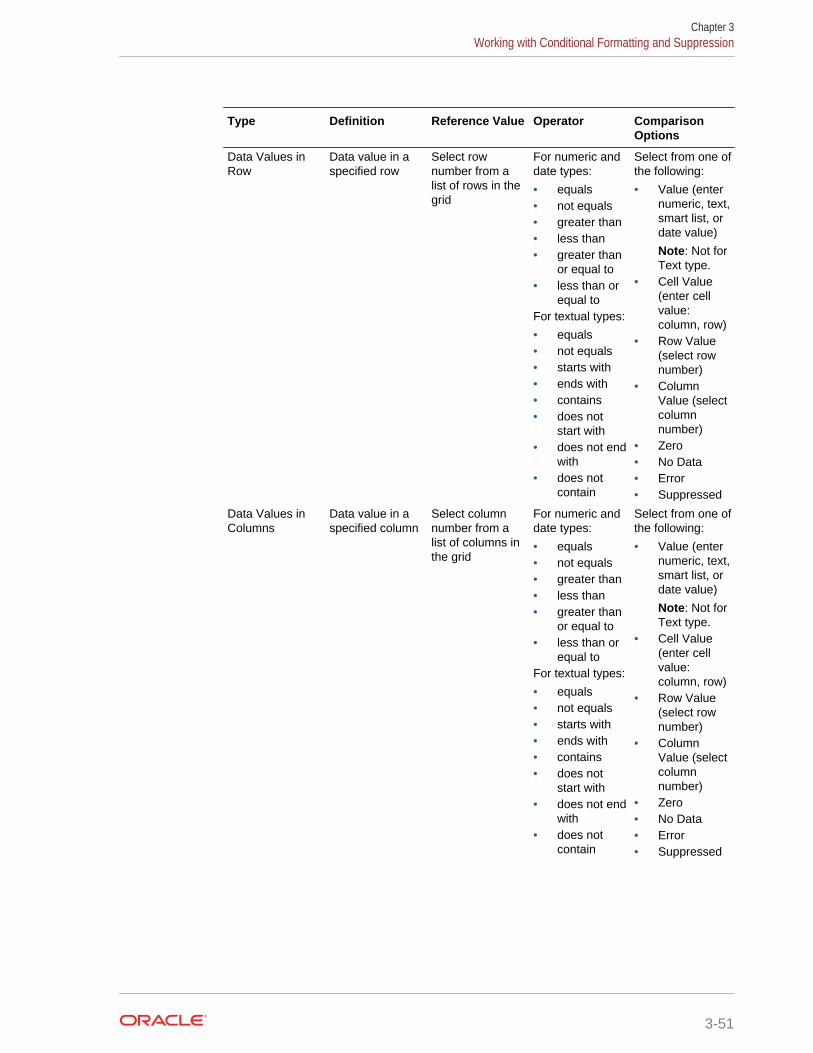
Type Definition Reference Value Operator ComparisonOptions
Data Values inRow
Data value in aspecified row
Select rownumber from alist of rows in thegrid
For numeric anddate types:
• equals• not equals• greater than• less than• greater than
or equal to• less than or
equal toFor textual types:
• equals• not equals• starts with• ends with• contains• does not
start with• does not end
with• does not
contain
Select from one ofthe following:
• Value (enternumeric, text,smart list, ordate value)
Note: Not forText type.
• Cell Value(enter cellvalue:column, row)
• Row Value(select rownumber)
• ColumnValue (selectcolumnnumber)
• Zero• No Data• Error• Suppressed
Data Values inColumns
Data value in aspecified column
Select columnnumber from alist of columns inthe grid
For numeric anddate types:
• equals• not equals• greater than• less than• greater than
or equal to• less than or
equal toFor textual types:
• equals• not equals• starts with• ends with• contains• does not
start with• does not end
with• does not
contain
Select from one ofthe following:
• Value (enternumeric, text,smart list, ordate value)
Note: Not forText type.
• Cell Value(enter cellvalue:column, row)
• Row Value(select rownumber)
• ColumnValue (selectcolumnnumber)
• Zero• No Data• Error• Suppressed
Chapter 3Working with Conditional Formatting and Suppression
3-51

Type Definition Reference Value Operator ComparisonOptions
Data Values inCurrent Row/Column
Data value in acurrent row orcolumn
Not Applicable For numeric anddate types:
• equals• not equals• greater than• less than• greater than
or equal to• less than or
equal toFor textual types:
• equals• not equals• starts with• ends with• contains• does not
start with• does not end
with• does not
contain
Select from one ofthe following:
• Value (enternumeric, text,smart list, ordate value)
Note: Not forText type.
• Cell Value(enter cellvalue:column, row)
• Row Value(select rownumber)
• ColumnValue (selectcolumnnumber)
• Zero• No Data• Error• Suppressed
Member Name Member namethat applies to acell, row orcolumn
Select membername’sdimension from alist of dimensionsin the model
• equals• not equals• starts with• ends with• contains• does not
start with• does not end
with• does not
contain
Enter text formember name
Member Alias Member alias thatapplies to a cell,row or column
Select alias tableand memberalias' dimensionfrom a list ofdimensions in themodel
• equals• not equals• starts with• ends with• contains• does not
start with• does not end
with• does not
contain
Enter text formemberdimension
Chapter 3Working with Conditional Formatting and Suppression
3-52

Type Definition Reference Value Operator ComparisonOptions
Member Name orAlias
Either membername or memberalias (searchesboth fields) thatapplies to a cell,row or column
Select alias tableand membername or alias'dimension from alist of dimensionsin the model
• equals• not equals• starts with• ends with• contains• does not
start with• does not end
with• does not
contain
Enter text formember name oralias
Member Attribute Associatedattributedimensionmember thatapplies to thecell, row orcolumn
Select associatedattributedimension from alist of attributedimensions
• equals• not equals• starts with• ends with• contains• does not
start with• does not end
with• does not
contain
Enter text forattributedimensionmember name
GenerationNumber
Generationnumber in aspecifieddimension
Select generationfrom list ofgenerations in themodel.
For numeric anddate types:
• equals• not equals• greater than• less than• greater than
or equal to• less than or
equal toFor textual types:
• equals• not equals• starts with• ends with
Select agenerationnumber for thespecifieddimension
Chapter 3Working with Conditional Formatting and Suppression
3-53
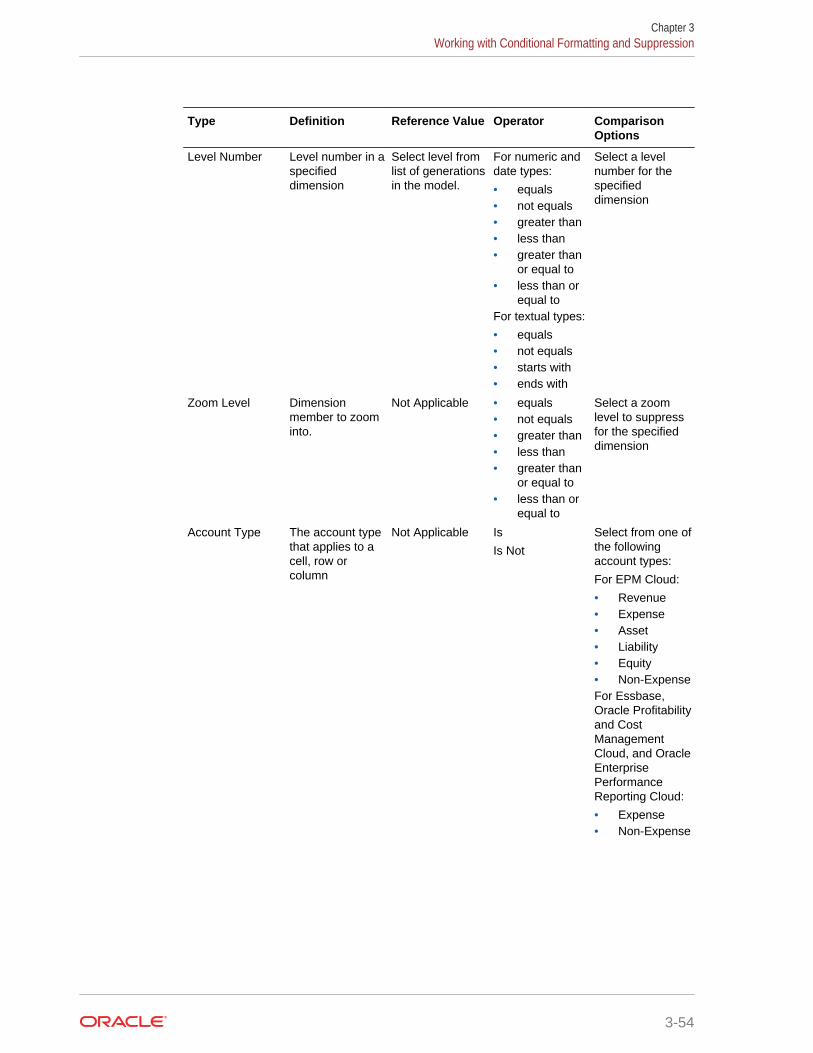
Type Definition Reference Value Operator ComparisonOptions
Level Number Level number in aspecifieddimension
Select level fromlist of generationsin the model.
For numeric anddate types:
• equals• not equals• greater than• less than• greater than
or equal to• less than or
equal toFor textual types:
• equals• not equals• starts with• ends with
Select a levelnumber for thespecifieddimension
Zoom Level Dimensionmember to zoominto.
Not Applicable • equals• not equals• greater than• less than• greater than
or equal to• less than or
equal to
Select a zoomlevel to suppressfor the specifieddimension
Account Type The account typethat applies to acell, row orcolumn
Not Applicable Is
Is Not
Select from one ofthe followingaccount types:
For EPM Cloud:
• Revenue• Expense• Asset• Liability• Equity• Non-ExpenseFor Essbase,Oracle Profitabilityand CostManagementCloud, and OracleEnterprisePerformanceReporting Cloud:
• Expense• Non-Expense
Chapter 3Working with Conditional Formatting and Suppression
3-54
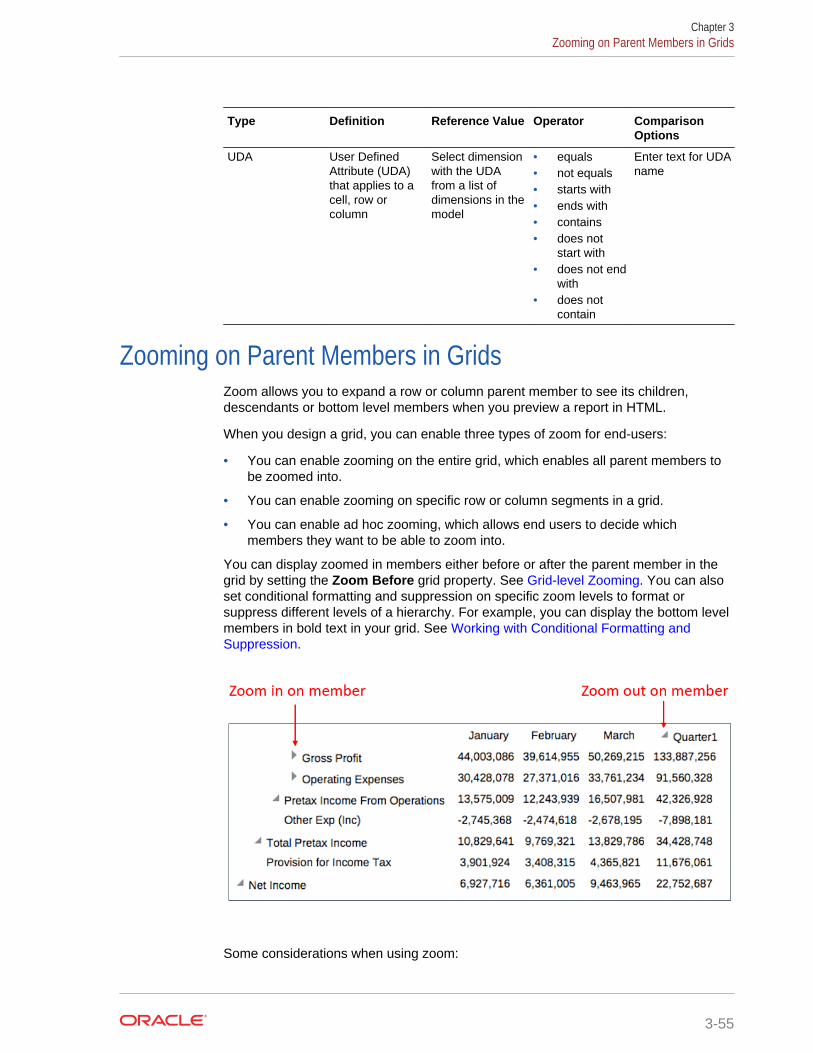
Type Definition Reference Value Operator ComparisonOptions
UDA User DefinedAttribute (UDA)that applies to acell, row orcolumn
Select dimensionwith the UDAfrom a list ofdimensions in themodel
• equals• not equals• starts with• ends with• contains• does not
start with• does not end
with• does not
contain
Enter text for UDAname
Zooming on Parent Members in GridsZoom allows you to expand a row or column parent member to see its children,descendants or bottom level members when you preview a report in HTML.
When you design a grid, you can enable three types of zoom for end-users:
• You can enable zooming on the entire grid, which enables all parent members tobe zoomed into.
• You can enable zooming on specific row or column segments in a grid.
• You can enable ad hoc zooming, which allows end users to decide whichmembers they want to be able to zoom into.
You can display zoomed in members either before or after the parent member in thegrid by setting the Zoom Before grid property. See Grid-level Zooming. You can alsoset conditional formatting and suppression on specific zoom levels to format orsuppress different levels of a hierarchy. For example, you can display the bottom levelmembers in bold text in your grid. See Working with Conditional Formatting andSuppression.
Some considerations when using zoom:
Chapter 3Zooming on Parent Members in Grids
3-55

• If you define grid sorting for a parent member in the rows or columns where zoomis enabled, the sort will be applied to any zoomed members for each zoom level.
• You cannot zoom in snapshot reports.
• If you insert a Management Reporting report that contains a grid with zoomenabled into a report package, it is inserted as a reference doclet and zoom isdisabled. As a best practice, you should design grids for reference doclets todisplay the members that you want in the report package without relying on zoomto display members under a parent.
• The zooming interaction is not available in PDF previewing. However, if you zooma grid in HTML preview and then switch to PDF, the zoomed members will beretained and displayed.
Grid-level ZoomingWhen you enable zooming on an entire grid, users will have the ability to zoom in onany parent member when they preview the report or grid in HTML. You can enablezoom to the Children, Bottom-level, or Descendants of parent members.
To enable zoom on the grid level:
1. On the Grid Properties panel, click Off next to Zoom.
2. Select the zoom level that you want to enable:
• Off (default)
• Zoom to Children
• Zoom to Bottom
• Zoom to Descendants
Chapter 3Zooming on Parent Members in Grids
3-56
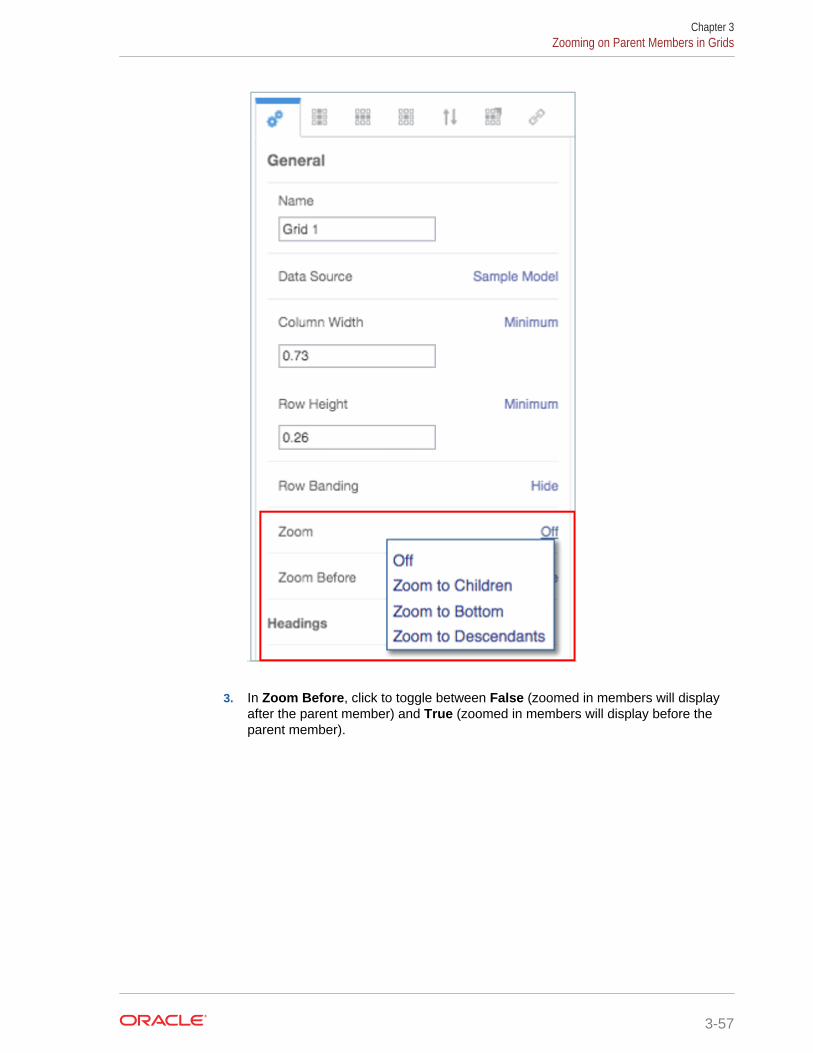
3. In Zoom Before, click to toggle between False (zoomed in members will displayafter the parent member) and True (zoomed in members will display before theparent member).
Chapter 3Zooming on Parent Members in Grids
3-57
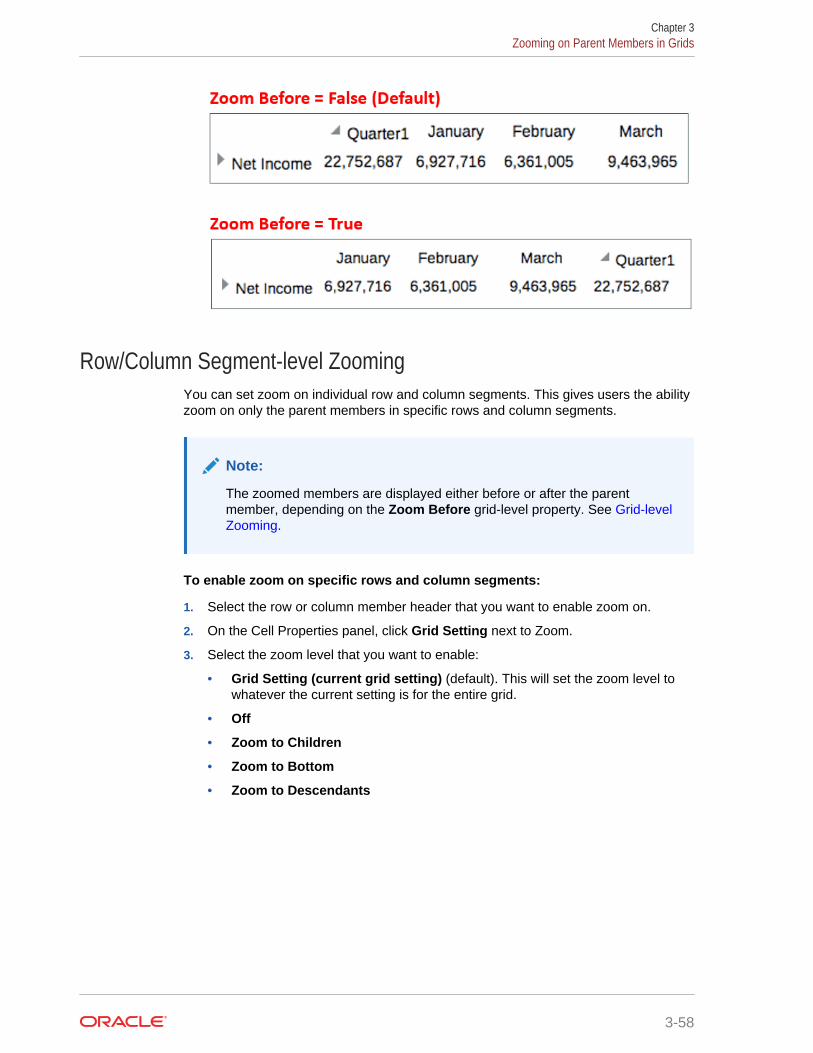
Row/Column Segment-level ZoomingYou can set zoom on individual row and column segments. This gives users the abilityzoom on only the parent members in specific rows and column segments.
Note:
The zoomed members are displayed either before or after the parentmember, depending on the Zoom Before grid-level property. See Grid-levelZooming.
To enable zoom on specific rows and column segments:
1. Select the row or column member header that you want to enable zoom on.
2. On the Cell Properties panel, click Grid Setting next to Zoom.
3. Select the zoom level that you want to enable:
• Grid Setting (current grid setting) (default). This will set the zoom level towhatever the current setting is for the entire grid.
• Off
• Zoom to Children
• Zoom to Bottom
• Zoom to Descendants
Chapter 3Zooming on Parent Members in Grids
3-58
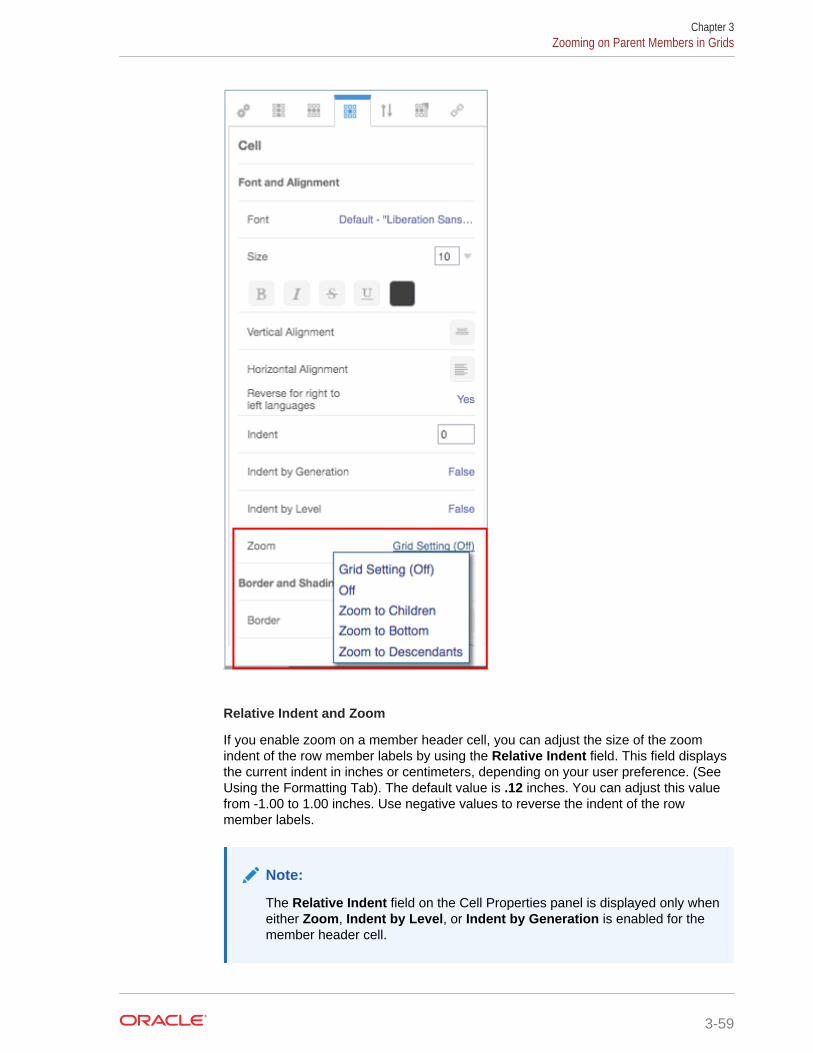
Relative Indent and Zoom
If you enable zoom on a member header cell, you can adjust the size of the zoomindent of the row member labels by using the Relative Indent field. This field displaysthe current indent in inches or centimeters, depending on your user preference. (See Using the Formatting Tab). The default value is .12 inches. You can adjust this valuefrom -1.00 to 1.00 inches. Use negative values to reverse the indent of the rowmember labels.
Note:
The Relative Indent field on the Cell Properties panel is displayed only wheneither Zoom, Indent by Level, or Indent by Generation is enabled for themember header cell.
Chapter 3Zooming on Parent Members in Grids
3-59
Ad hoc ZoomingAd hoc mode enables report previewers to zoom into any parent member on all gridsin the report. You enable ad hoc mode at the report level, not the grid level. After youenable ad hoc analysis on the report, report previewers will need to set their zoomoptions in order to use ad hoc mode. See Viewing Reports.
To enable ad hoc analysis on a report:
1. Open the General Properties panel for the report.
2. In the Allow ad hoc analysis field, click False to toggle between False (default)and True.
Chapter 3Zooming on Parent Members in Grids
3-60
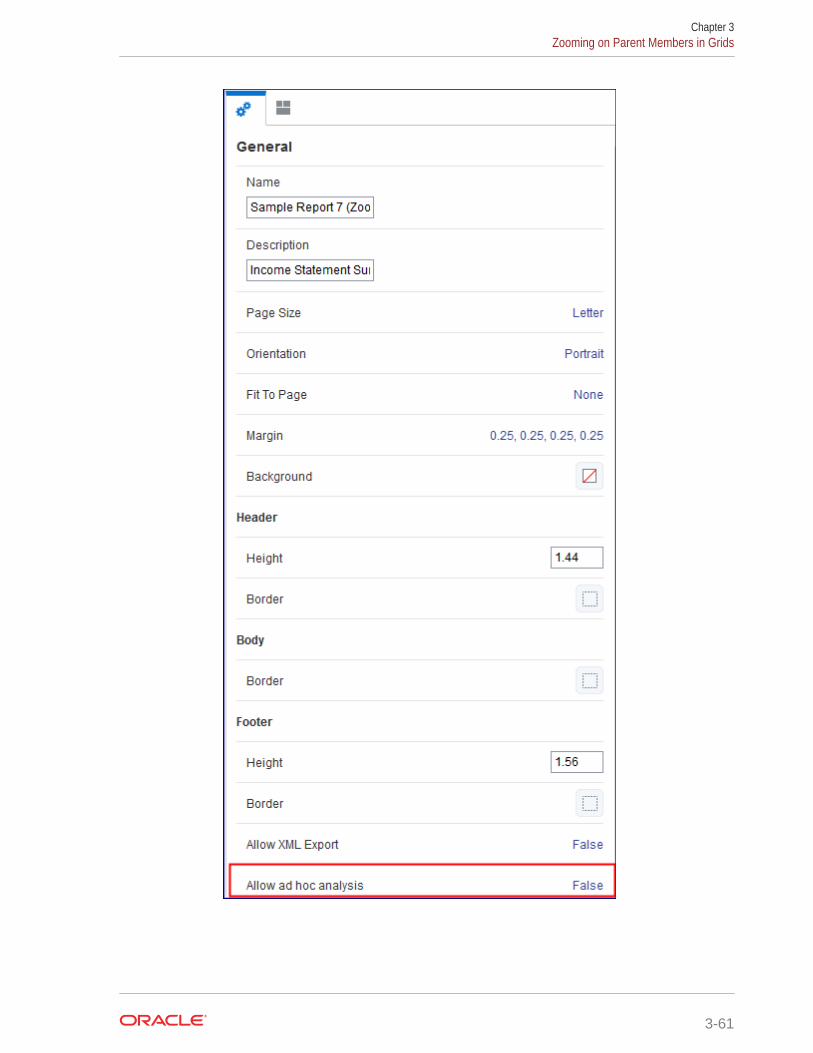
Chapter 3Zooming on Parent Members in Grids
3-61
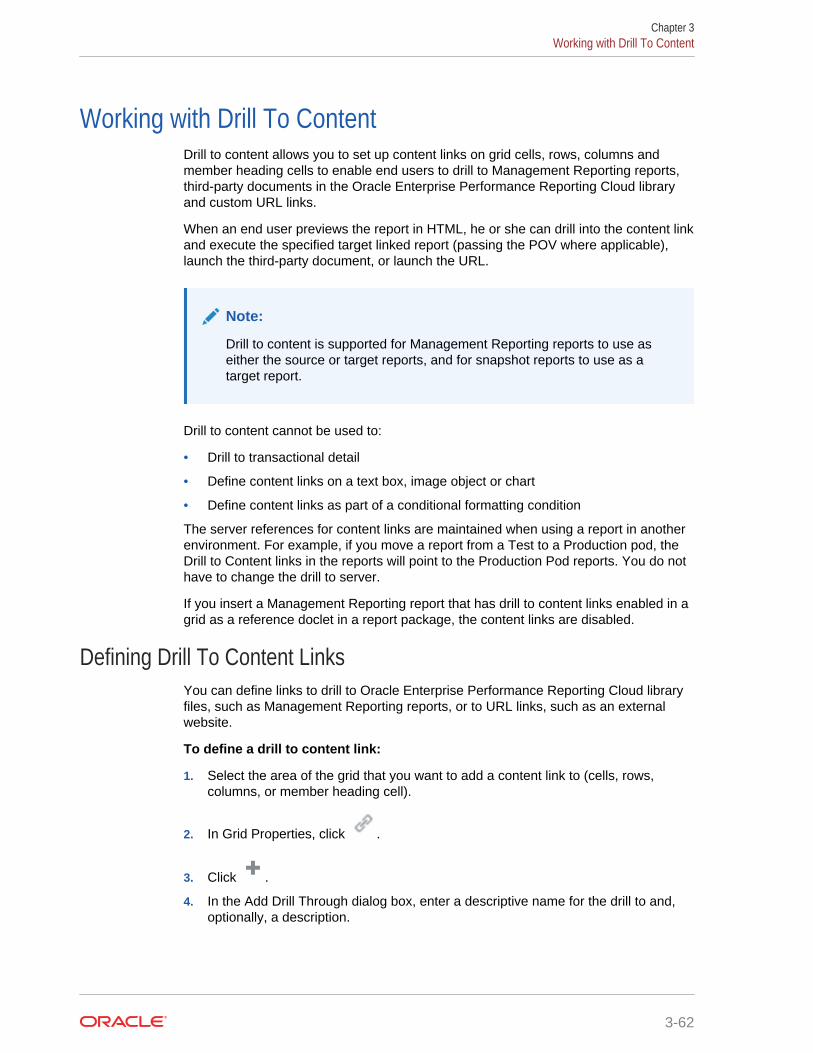
Working with Drill To ContentDrill to content allows you to set up content links on grid cells, rows, columns andmember heading cells to enable end users to drill to Management Reporting reports,third-party documents in the Oracle Enterprise Performance Reporting Cloud libraryand custom URL links.
When an end user previews the report in HTML, he or she can drill into the content linkand execute the specified target linked report (passing the POV where applicable),launch the third-party document, or launch the URL.
Note:
Drill to content is supported for Management Reporting reports to use aseither the source or target reports, and for snapshot reports to use as atarget report.
Drill to content cannot be used to:
• Drill to transactional detail
• Define content links on a text box, image object or chart
• Define content links as part of a conditional formatting condition
The server references for content links are maintained when using a report in anotherenvironment. For example, if you move a report from a Test to a Production pod, theDrill to Content links in the reports will point to the Production Pod reports. You do nothave to change the drill to server.
If you insert a Management Reporting report that has drill to content links enabled in agrid as a reference doclet in a report package, the content links are disabled.
Defining Drill To Content LinksYou can define links to drill to Oracle Enterprise Performance Reporting Cloud libraryfiles, such as Management Reporting reports, or to URL links, such as an externalwebsite.
To define a drill to content link:
1. Select the area of the grid that you want to add a content link to (cells, rows,columns, or member heading cell).
2. In Grid Properties, click .
3. Click .
4. In the Add Drill Through dialog box, enter a descriptive name for the drill to and,optionally, a description.
Chapter 3Working with Drill To Content
3-62
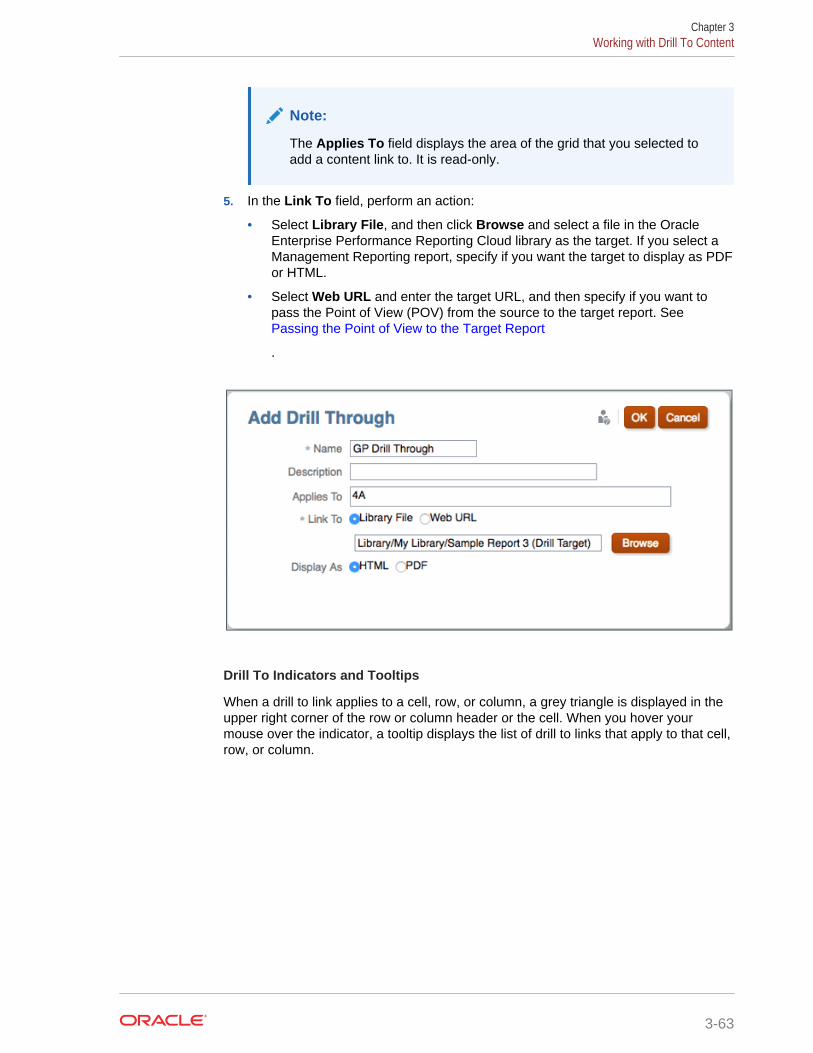
Note:
The Applies To field displays the area of the grid that you selected toadd a content link to. It is read-only.
5. In the Link To field, perform an action:
• Select Library File, and then click Browse and select a file in the OracleEnterprise Performance Reporting Cloud library as the target. If you select aManagement Reporting report, specify if you want the target to display as PDFor HTML.
• Select Web URL and enter the target URL, and then specify if you want topass the Point of View (POV) from the source to the target report. See Passing the Point of View to the Target Report
.
Drill To Indicators and Tooltips
When a drill to link applies to a cell, row, or column, a grey triangle is displayed in theupper right corner of the row or column header or the cell. When you hover yourmouse over the indicator, a tooltip displays the list of drill to links that apply to that cell,row, or column.
Chapter 3Working with Drill To Content
3-63

Managing Drill To Content DefinitionsAfter you define drill to content links, you manage the links in the Drill Throughproperties panel. You can perform these actions on existing drill to links:
• With a region of the grid highlighted, click the check box next to the drill to link toselect or de-select it, which applies or removes it from that region.
Note:
You can apply multiple drill to links to a cell, row, or column in the grid.When a user clicks the drill to link, a list of target links is displayed.
• Click on the name of a link definition to edit that definition.
• Hover over a definition and then click or to reorder the display ofdefinitions.
• Hover over a definition and then click to delete that definition.
Chapter 3Working with Drill To Content
3-64

Passing the Point of View to the Target ReportWhen you define a URL link, you have the option of passing the point of view (POV) ofthe source report to the target. If you select to pass the POV through, the followingconditions apply:
• The POV context will be passed to the Global POV of the target report fordimensions that exist in the target report data source.
– POV context in the source report includes POV and cell member selections
– The Local POV of the target report is not updated upon drill through
• If the source and target report data sources are different, only the POV dimensions(and selected members) that exist in the source will be passed to the target report.
– If the dimension from the source report is not found on the Global POV of thetarget report, the passed POV selection will not be used
– If the source report dimension exists, but the passed POV member doesn’texist, then the user will receive an invalid member validation and won’t be ableto view the report results
• POV context that is passed will be applied to the target report POV, regardless ifthe POV member selection is valid as defined in the target report definition. Forexample, if the source report POV context has "Currency" = USD, it will be usedas POV selection in the target report, even if USD is not a valid selection for POVDimension Currency in the target report’s definition.
Examples of Drill to Content Results in Grid CellsThe following report has drill to content defined on all cells. Years, Entities andAccounts are on the Point of View (POV), Segments are on rows 1 to 4, FiscalCalendar and Scenarios are on columns A and B. Column C is a formula column andcolumn D is a text column. Row 5 is a text row.
Chapter 3Working with Drill To Content
3-65
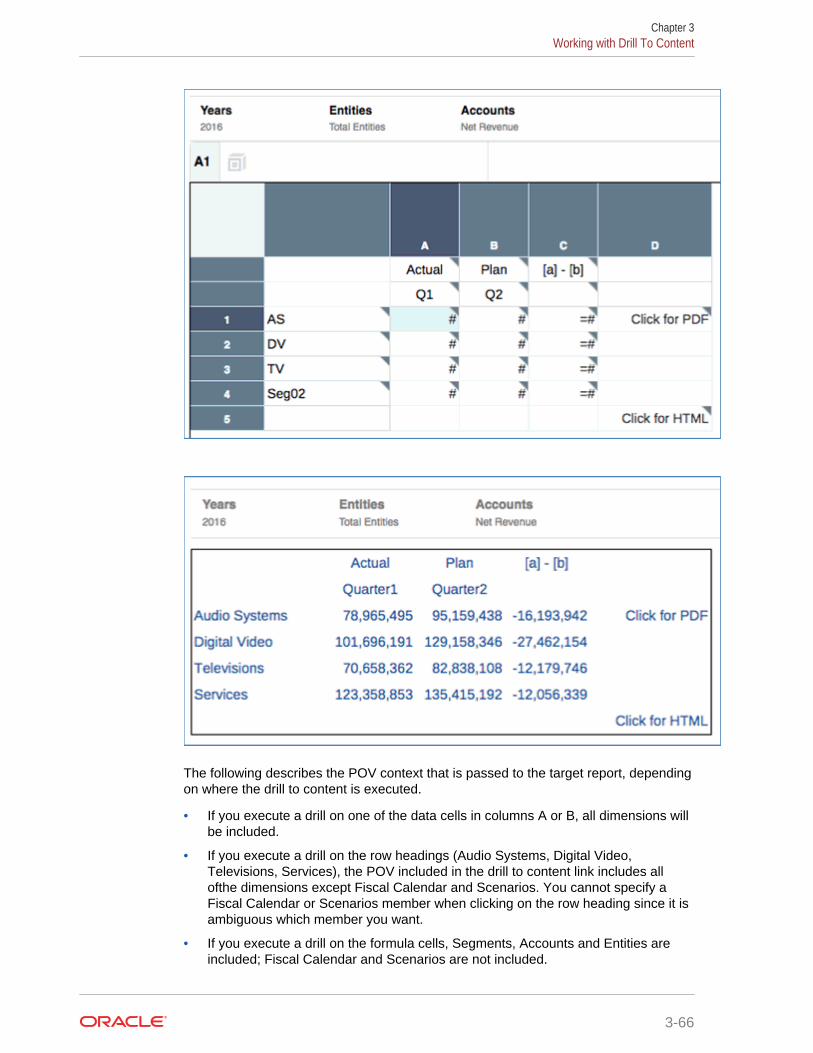
The following describes the POV context that is passed to the target report, dependingon where the drill to content is executed.
• If you execute a drill on one of the data cells in columns A or B, all dimensions willbe included.
• If you execute a drill on the row headings (Audio Systems, Digital Video,Televisions, Services), the POV included in the drill to content link includes allofthe dimensions except Fiscal Calendar and Scenarios. You cannot specify aFiscal Calendar or Scenarios member when clicking on the row heading since it isambiguous which member you want.
• If you execute a drill on the formula cells, Segments, Accounts and Entities areincluded; Fiscal Calendar and Scenarios are not included.
Chapter 3Working with Drill To Content
3-66
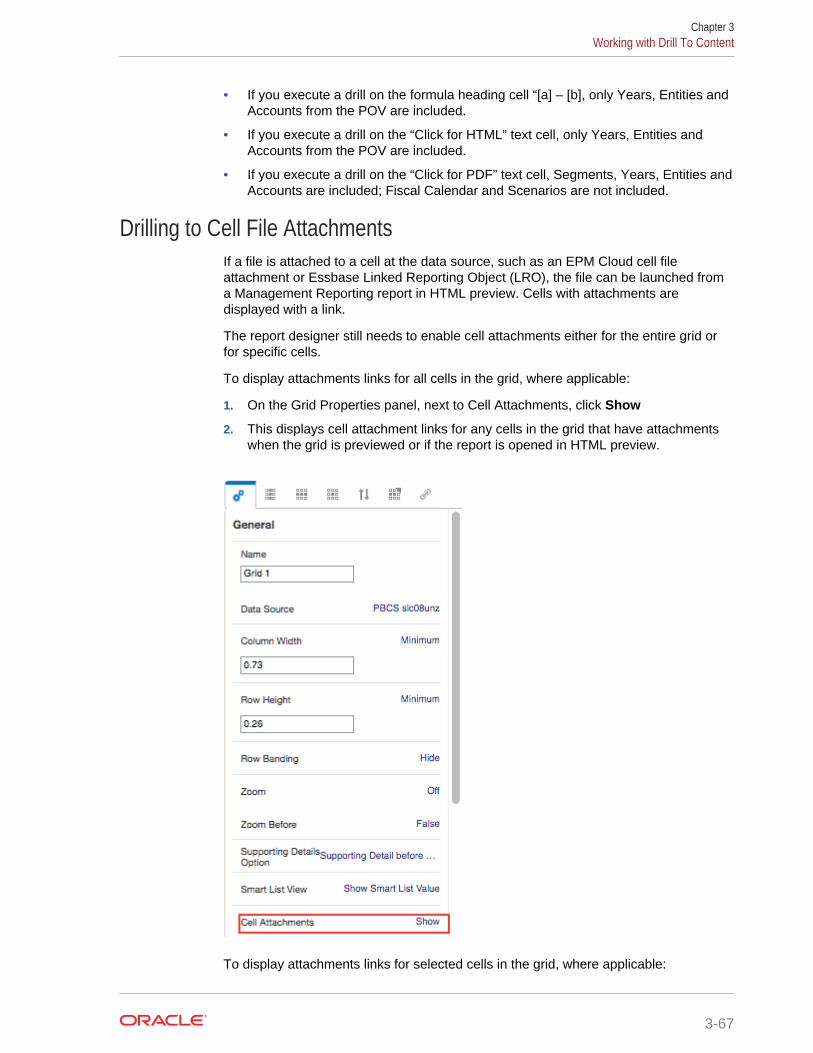
• If you execute a drill on the formula heading cell “[a] – [b], only Years, Entities andAccounts from the POV are included.
• If you execute a drill on the “Click for HTML” text cell, only Years, Entities andAccounts from the POV are included.
• If you execute a drill on the “Click for PDF” text cell, Segments, Years, Entities andAccounts are included; Fiscal Calendar and Scenarios are not included.
Drilling to Cell File AttachmentsIf a file is attached to a cell at the data source, such as an EPM Cloud cell fileattachment or Essbase Linked Reporting Object (LRO), the file can be launched froma Management Reporting report in HTML preview. Cells with attachments aredisplayed with a link.
The report designer still needs to enable cell attachments either for the entire grid orfor specific cells.
To display attachments links for all cells in the grid, where applicable:
1. On the Grid Properties panel, next to Cell Attachments, click Show
2. This displays cell attachment links for any cells in the grid that have attachmentswhen the grid is previewed or if the report is opened in HTML preview.
To display attachments links for selected cells in the grid, where applicable:
Chapter 3Working with Drill To Content
3-67
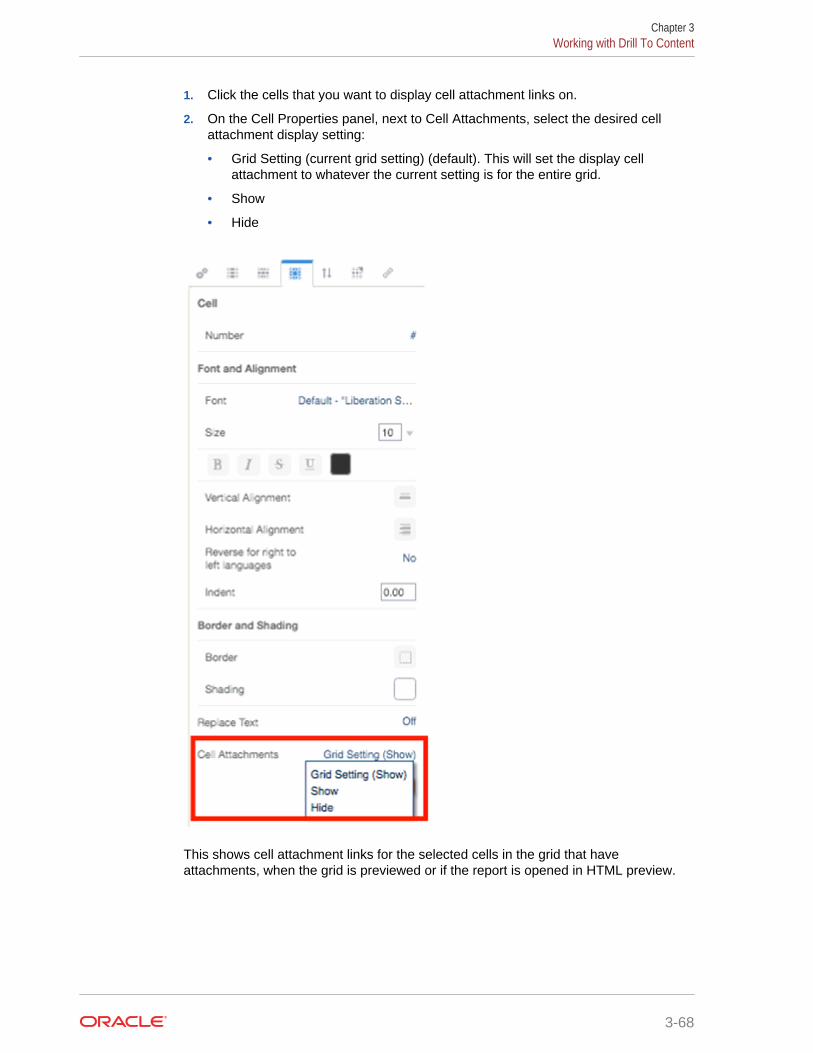
1. Click the cells that you want to display cell attachment links on.
2. On the Cell Properties panel, next to Cell Attachments, select the desired cellattachment display setting:
• Grid Setting (current grid setting) (default). This will set the display cellattachment to whatever the current setting is for the entire grid.
• Show
• Hide
This shows cell attachment links for the selected cells in the grid that haveattachments, when the grid is previewed or if the report is opened in HTML preview.
Chapter 3Working with Drill To Content
3-68
4Working With Text Boxes
Related Topics
• Adding a Text Box
• Formatting Text Boxes
Adding a Text BoxText boxes are report objects that can contain text and text functions. For example,you can enter a label, description, or a function that retrieves the current date in a textbox. You can enter multiple paragraphs of text. Like other report objects, you canmove, resize, or reposition the area containing the text.
To add a new text box:
1. Do one of the following:
• From the toolbar, click and select Text.
• From a blank report page, click .
• From the report header, footer, or body, right-click and select Add ReportContent, and then select Text.
2. Click or Setup Text.
3. Enter the text in the text box.
Use the properties panel to format the text. To insert a function in the text box,
click . See Text Functions
Formatting Text BoxesYou format the text in a text box in two places:
• Use the properties panel to edit properties for the entire text box, such as thename, background color and vertical alignment.
• Use the text editor toolbar to format the text within the text box.
You can also format the display of text boxes in a report. For example, once you placea text box, you can move or resize the text box, specify horizontal and verticalpositions for the text box, and place a border around the text box.
4-1
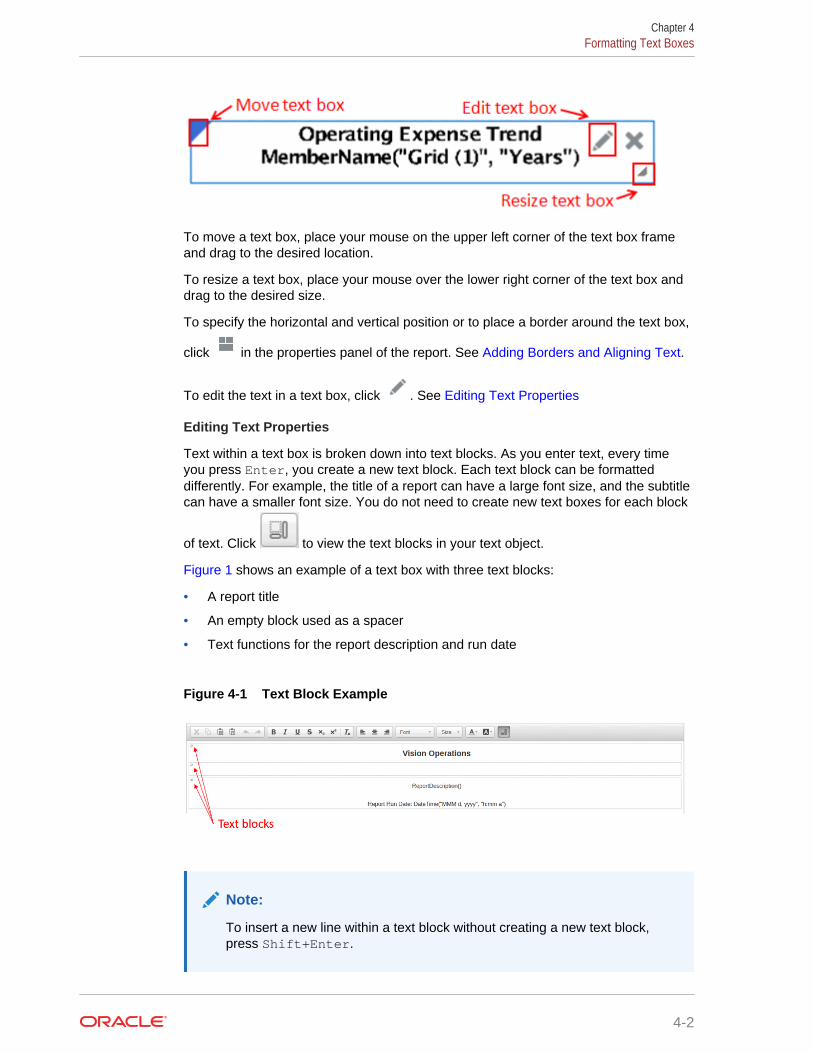
To move a text box, place your mouse on the upper left corner of the text box frameand drag to the desired location.
To resize a text box, place your mouse over the lower right corner of the text box anddrag to the desired size.
To specify the horizontal and vertical position or to place a border around the text box,
click in the properties panel of the report. See Adding Borders and Aligning Text.
To edit the text in a text box, click . See Editing Text Properties
Editing Text Properties
Text within a text box is broken down into text blocks. As you enter text, every timeyou press Enter, you create a new text block. Each text block can be formatteddifferently. For example, the title of a report can have a large font size, and the subtitlecan have a smaller font size. You do not need to create new text boxes for each block
of text. Click to view the text blocks in your text object.
Figure 1 shows an example of a text box with three text blocks:
• A report title
• An empty block used as a spacer
• Text functions for the report description and run date
Figure 4-1 Text Block Example
Note:
To insert a new line within a text block without creating a new text block,press Shift+Enter.
Chapter 4Formatting Text Boxes
4-2

To define font for text:
1. Edit a text box.
2. In the toolbar, use the Font and Size drop down boxes to define the font.
The following default fonts are available:
• Liberation Sans (Arial)
• Liberation Serif (Times New Roman)
• Liberation Mono (Courier New)
• Albany (Japanese)
• Albany (Korean)
• Albany (Simplified Chinese)
• Albany (Traditional Chinese)
Note:
You cannot enter a custom size for the font. You must pick from the list ofavailable font sizes.
In addition to the default fonts, you can upload your own fonts by navigating to theFonts folder in the Library, clicking Create, and then Upload File. Uploaded fonts willbe displayed in the Font drop down box.
Use the buttons to format text with bold,italics, underline, strikethrough, subscript, or superscript.
Use to remove formatting from text.
Use to select the color and background color of the text.
Note:
You must pick a color from the color palette. You cannot manually enter anRGB value for a color.
Use to cut, copy, paste, or paste as text.
Use to undo or redo an action.
Chapter 4Formatting Text Boxes
4-3
Use to align the text in a text block to the left, center or right of thetext blox.
Inserting Text Functions
Click to insert a text function into a text object. For example, you can insert thecurrent date, or the report description. See Text Functions.
Adding Borders and Aligning Text
In the report editor, click in the properties panel to add borders and align the textbox within the report.
To add a border to the text box:
1. In the layout panel, click .
2. From the Border dialog box, select a border type (upper, lower, left, right, or all).
3. Optional: After you enable a border type, click the Line Type and Color dropdown boxes next to that type to change the line style and color of that border.
Use Horizontal Alignment and Vertical Alignment to modify the placement,alignment, and indent of the text within a text box.
Chapter 4Formatting Text Boxes
4-4
5Working With Images
Related Topics
• Inserting Images
• Formatting Images
Inserting ImagesYou can add images to the header, footer, or body of a report. After you add an imageto a report, you can format the image. The following image formats can be insertedinto a report in Management Reporting:
• Portable Network Graphics: .png
• Graphics Interchange Format (GIF): .gif
• Joint Photographic Experts Group (JPEG): .jpg
Note:
Image are saved with the report. As a result, the speed of the renderedreport may be affected by the size of the image.
To insert an image:
1. Do one of the following:
• From the toolbar, click and select Image.
• From a blank report page, click .
• From the report header, footer, or body, right-click and select Add ReportContent, and then select Image.
2. Browse to select the image, and click OK to upload it.
Formatting ImagesYou can format the display of images in a report. For example, once you place animage, you can move or resize the image, specify horizontal and vertical positions forthe image, and place a border around the image.
5-1

To move an image, place your mouse on the upper left corner of the image frame anddrag to the desired location.
To resize an image, place your mouse over the lower right corner of the image anddrag to the desired size. The image stretches automatically to fit the new size.
To specify horizontal and vertical positions for the image, select the image, and in the
properties panel, click . Use the Placement, Alignment, and Indent fields toadjust the horizontal and vertical position.
To place a border around an image:
1. On the image, click .
2. In the properties panel, click Border to toggle the border on and off.
3. Optional: Click the color drop down to select a color for the border. Choose fromthe default colors, or you can select a custom color.
Chapter 5Formatting Images
5-2
6Working With Charts
Related Topics
• About Charts
• Inserting a Chart
• About Chart Designer
• Chart Designer Views
• Chart Properties
• Understanding the Dual Y Axis in Charts
• About Waterfall Charts
• About Scatter and Bubble Charts
About ChartsA chart is a graphical representation of report data from a grid on a report. The chartretrieves data dynamically from the grid, so if data in the grid changes, the chart isupdated automatically. You create charts to portray data graphically in your reports.You can use the different chart types to illustrate trends and tendencies or to highlightdifferences and improvements.
Types of Charts
• Bar
• Stacked Bar
• Horizontal Bar
• Horizontal Stacked Bar
• Line
• Area
• Combination
• Waterfall
• Pie
• Doughnut
• Polar Bar
• Polar Line
• Polar Fill
• Radar Line
• Radar Fill
• Scatter
6-1
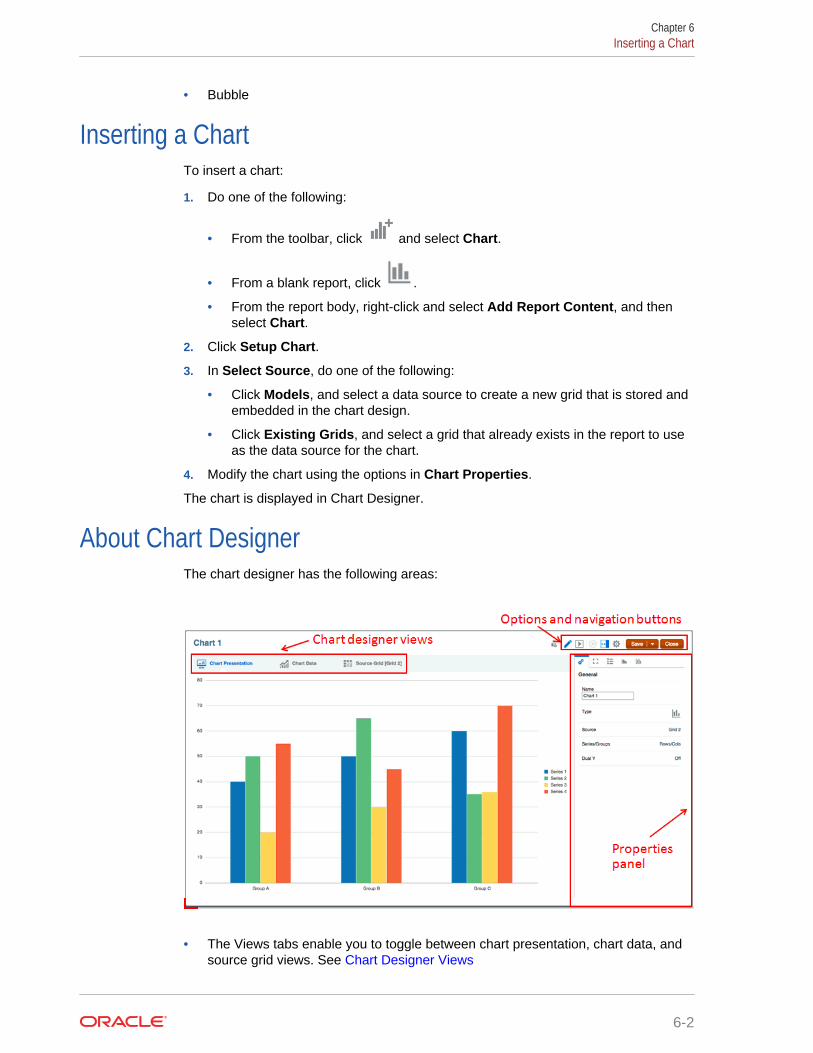
• Bubble
Inserting a ChartTo insert a chart:
1. Do one of the following:
• From the toolbar, click and select Chart.
• From a blank report, click .
• From the report body, right-click and select Add Report Content, and thenselect Chart.
2. Click Setup Chart.
3. In Select Source, do one of the following:
• Click Models, and select a data source to create a new grid that is stored andembedded in the chart design.
• Click Existing Grids, and select a grid that already exists in the report to useas the data source for the chart.
4. Modify the chart using the options in Chart Properties.
The chart is displayed in Chart Designer.
About Chart DesignerThe chart designer has the following areas:
• The Views tabs enable you to toggle between chart presentation, chart data, andsource grid views. See Chart Designer Views
Chapter 6Inserting a Chart
6-2
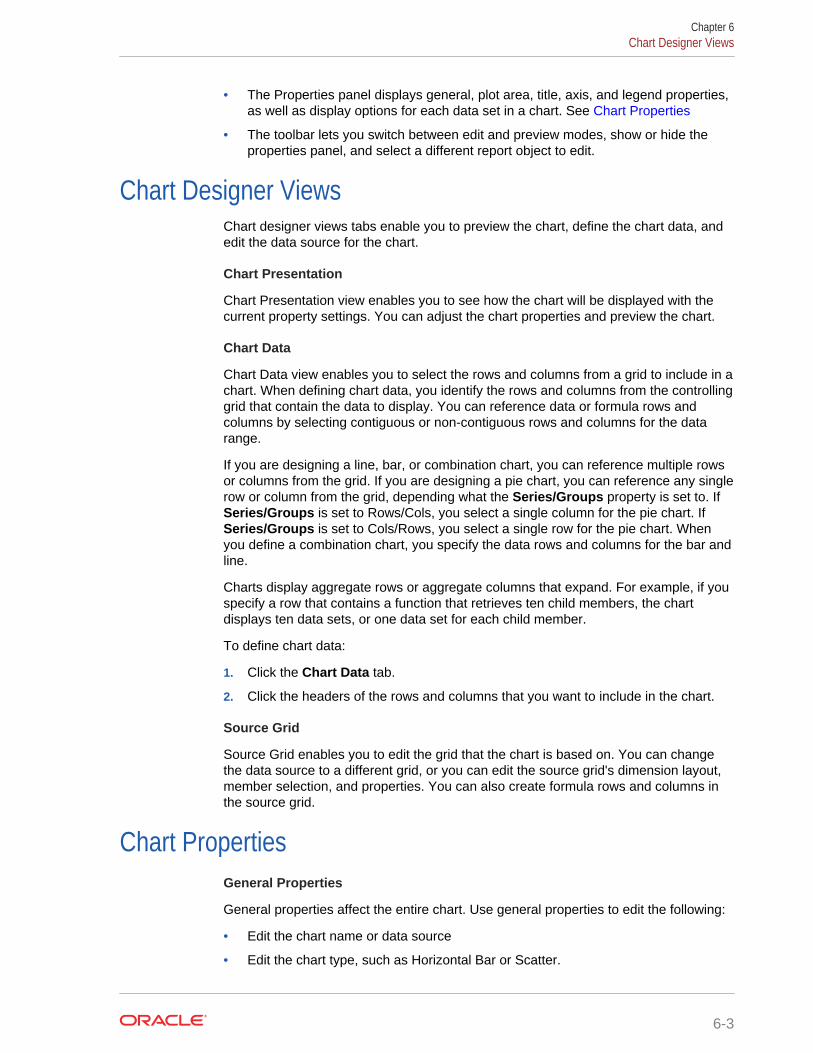
• The Properties panel displays general, plot area, title, axis, and legend properties,as well as display options for each data set in a chart. See Chart Properties
• The toolbar lets you switch between edit and preview modes, show or hide theproperties panel, and select a different report object to edit.
Chart Designer ViewsChart designer views tabs enable you to preview the chart, define the chart data, andedit the data source for the chart.
Chart Presentation
Chart Presentation view enables you to see how the chart will be displayed with thecurrent property settings. You can adjust the chart properties and preview the chart.
Chart Data
Chart Data view enables you to select the rows and columns from a grid to include in achart. When defining chart data, you identify the rows and columns from the controllinggrid that contain the data to display. You can reference data or formula rows andcolumns by selecting contiguous or non-contiguous rows and columns for the datarange.
If you are designing a line, bar, or combination chart, you can reference multiple rowsor columns from the grid. If you are designing a pie chart, you can reference any singlerow or column from the grid, depending what the Series/Groups property is set to. IfSeries/Groups is set to Rows/Cols, you select a single column for the pie chart. IfSeries/Groups is set to Cols/Rows, you select a single row for the pie chart. Whenyou define a combination chart, you specify the data rows and columns for the bar andline.
Charts display aggregate rows or aggregate columns that expand. For example, if youspecify a row that contains a function that retrieves ten child members, the chartdisplays ten data sets, or one data set for each child member.
To define chart data:
1. Click the Chart Data tab.
2. Click the headers of the rows and columns that you want to include in the chart.
Source Grid
Source Grid enables you to edit the grid that the chart is based on. You can changethe data source to a different grid, or you can edit the source grid's dimension layout,member selection, and properties. You can also create formula rows and columns inthe source grid.
Chart PropertiesGeneral Properties
General properties affect the entire chart. Use general properties to edit the following:
• Edit the chart name or data source
• Edit the chart type, such as Horizontal Bar or Scatter.
Chapter 6Chart Designer Views
6-3
• Select the grouping for the legend elements by Rows/Columns (each row is adifferent chart element, such as a bar or line) or Columns/Rows (each column isa different chart element).
• Toggle a dual-Y split. See Understanding the Dual Y Axis in Charts.
• Set the background color for the chart. The background color applies to the entirechart area from border to border.
Plot Area
Plot Area properties affect the visual display of the chart. Use plot area properties to:
• Show or hide the chart title and subtitle.
• Edit the chart title and subtitle style, size, alignment (left, center, right), and font.
• Adjust the background color.
• Display grid lines (horizontal, vertical, or both).
• Adjust the color of the grid lines.
Legend
Legend properties affect the visual display of the chart's legend. You can change theposition of the legend, as well as displaying a title for the legend, changing thebackground and border colors, and editing the font and format of chart labels.
Chart Axes
Chart Axes properties affect the visual display of the chart's axis labels. You cancreate a title and label for the X-axis, and the primary and secondary Y-axes of thechart. You can also edit the text and number format of the Y-axes, and define acustom range for both Y-axes.
Note:
The custom scaling for the Y-axis is based on the displayed data values inthe grid (with number formatting scaling applied) and not the unformattedand underlying data values.
Options
Chart Options enable you to set visual properties, such as fill style and color, for eachdata set in a chart. The properties are specific to the type of chart selected. Forexample, for bar charts you can set the bar width, labels, and borders.
Understanding the Dual Y Axis in Charts
Chapter 6Understanding the Dual Y Axis in Charts
6-4
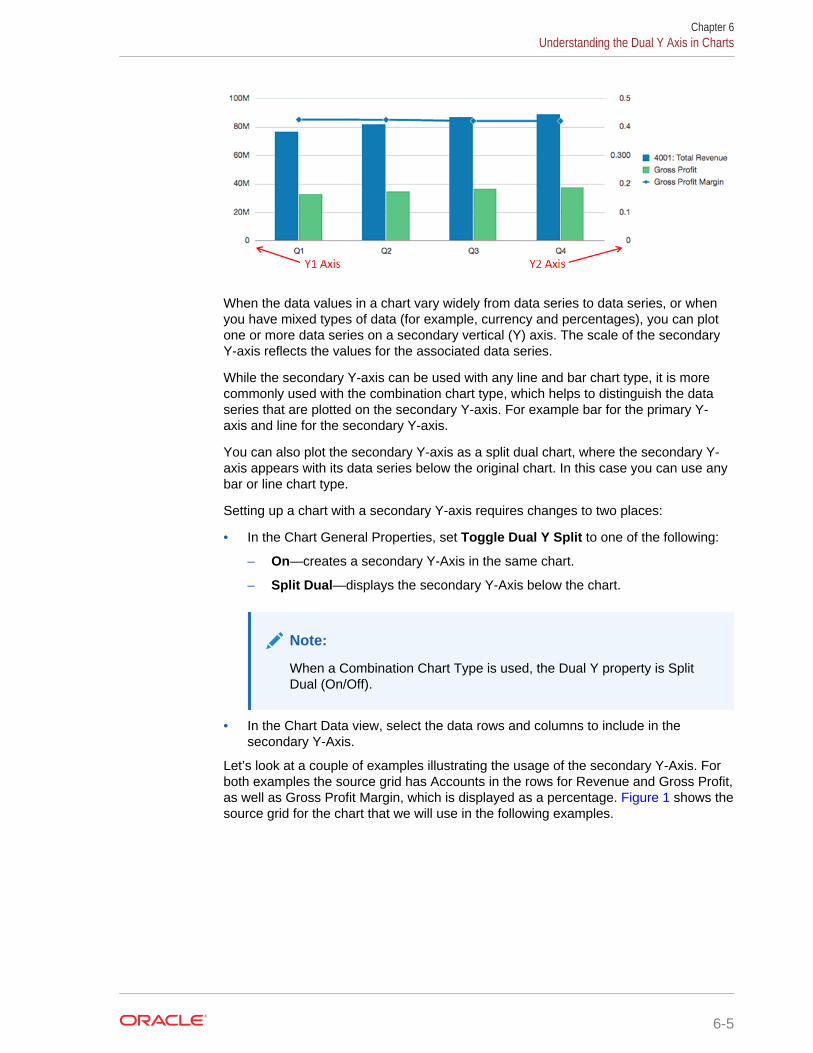
When the data values in a chart vary widely from data series to data series, or whenyou have mixed types of data (for example, currency and percentages), you can plotone or more data series on a secondary vertical (Y) axis. The scale of the secondaryY-axis reflects the values for the associated data series.
While the secondary Y-axis can be used with any line and bar chart type, it is morecommonly used with the combination chart type, which helps to distinguish the dataseries that are plotted on the secondary Y-axis. For example bar for the primary Y-axis and line for the secondary Y-axis.
You can also plot the secondary Y-axis as a split dual chart, where the secondary Y-axis appears with its data series below the original chart. In this case you can use anybar or line chart type.
Setting up a chart with a secondary Y-axis requires changes to two places:
• In the Chart General Properties, set Toggle Dual Y Split to one of the following:
– On—creates a secondary Y-Axis in the same chart.
– Split Dual—displays the secondary Y-Axis below the chart.
Note:
When a Combination Chart Type is used, the Dual Y property is SplitDual (On/Off).
• In the Chart Data view, select the data rows and columns to include in thesecondary Y-Axis.
Let’s look at a couple of examples illustrating the usage of the secondary Y-Axis. Forboth examples the source grid has Accounts in the rows for Revenue and Gross Profit,as well as Gross Profit Margin, which is displayed as a percentage. Figure 1 shows thesource grid for the chart that we will use in the following examples.
Chapter 6Understanding the Dual Y Axis in Charts
6-5
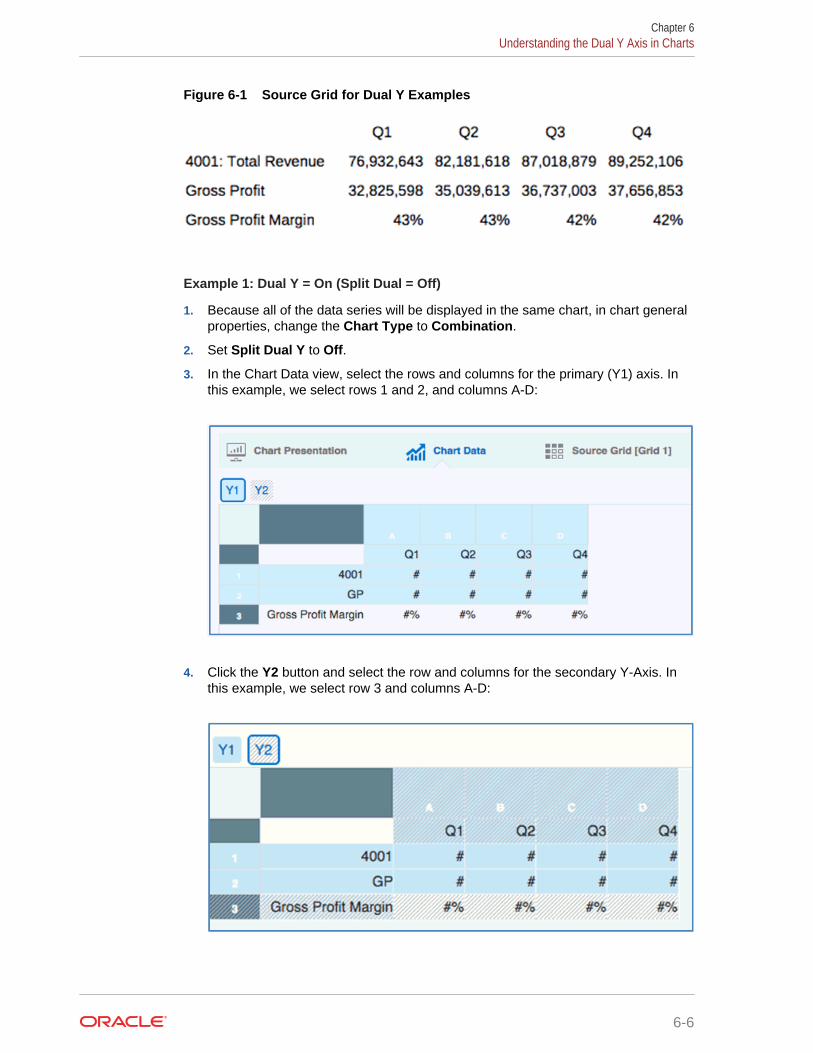
Figure 6-1 Source Grid for Dual Y Examples
Example 1: Dual Y = On (Split Dual = Off)
1. Because all of the data series will be displayed in the same chart, in chart generalproperties, change the Chart Type to Combination.
2. Set Split Dual Y to Off.
3. In the Chart Data view, select the rows and columns for the primary (Y1) axis. Inthis example, we select rows 1 and 2, and columns A-D:
4. Click the Y2 button and select the row and columns for the secondary Y-Axis. Inthis example, we select row 3 and columns A-D:
Chapter 6Understanding the Dual Y Axis in Charts
6-6
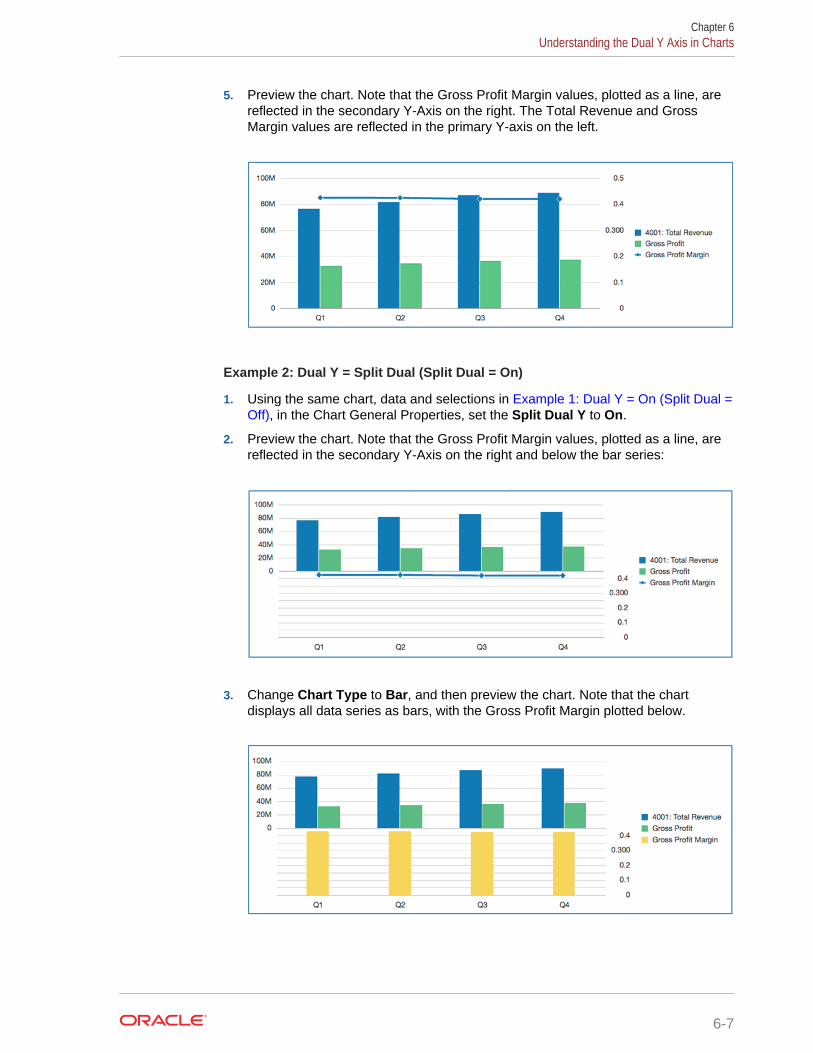
5. Preview the chart. Note that the Gross Profit Margin values, plotted as a line, arereflected in the secondary Y-Axis on the right. The Total Revenue and GrossMargin values are reflected in the primary Y-axis on the left.
Example 2: Dual Y = Split Dual (Split Dual = On)
1. Using the same chart, data and selections in Example 1: Dual Y = On (Split Dual =Off), in the Chart General Properties, set the Split Dual Y to On.
2. Preview the chart. Note that the Gross Profit Margin values, plotted as a line, arereflected in the secondary Y-Axis on the right and below the bar series:
3. Change Chart Type to Bar, and then preview the chart. Note that the chartdisplays all data series as bars, with the Gross Profit Margin plotted below.
Chapter 6Understanding the Dual Y Axis in Charts
6-7
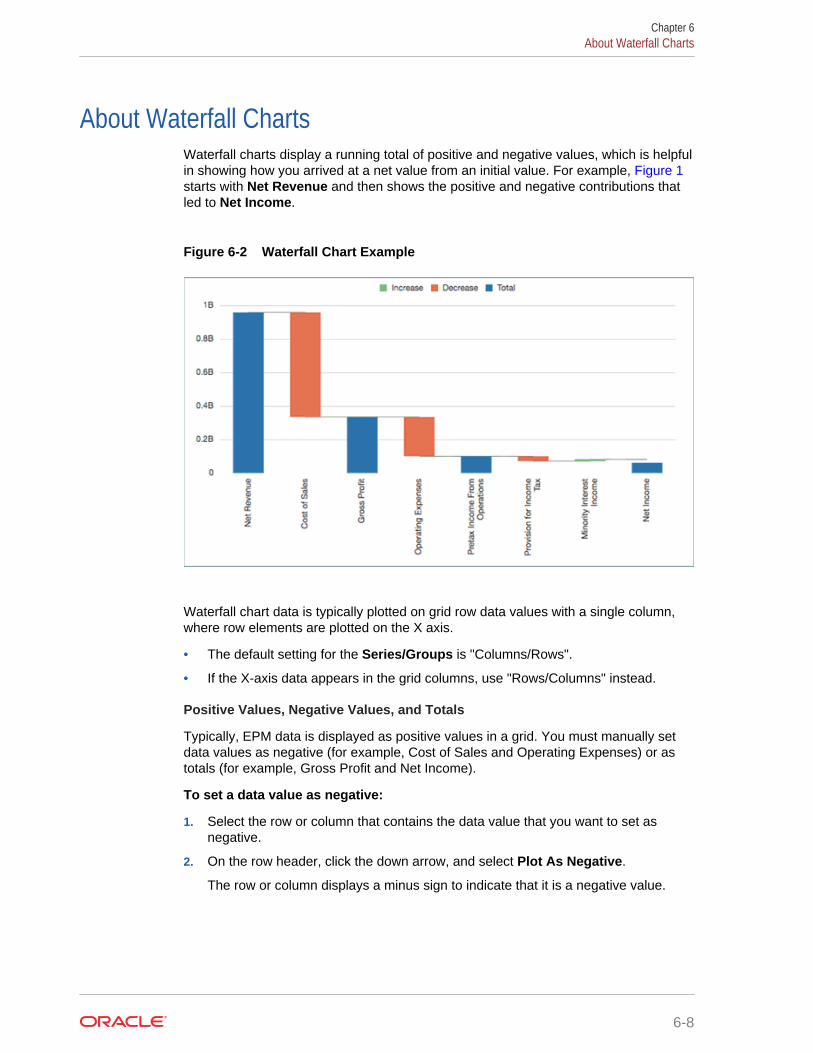
About Waterfall ChartsWaterfall charts display a running total of positive and negative values, which is helpfulin showing how you arrived at a net value from an initial value. For example, Figure 1starts with Net Revenue and then shows the positive and negative contributions thatled to Net Income.
Figure 6-2 Waterfall Chart Example
Waterfall chart data is typically plotted on grid row data values with a single column,where row elements are plotted on the X axis.
• The default setting for the Series/Groups is "Columns/Rows".
• If the X-axis data appears in the grid columns, use "Rows/Columns" instead.
Positive Values, Negative Values, and Totals
Typically, EPM data is displayed as positive values in a grid. You must manually setdata values as negative (for example, Cost of Sales and Operating Expenses) or astotals (for example, Gross Profit and Net Income).
To set a data value as negative:
1. Select the row or column that contains the data value that you want to set asnegative.
2. On the row header, click the down arrow, and select Plot As Negative.
The row or column displays a minus sign to indicate that it is a negative value.
Chapter 6About Waterfall Charts
6-8
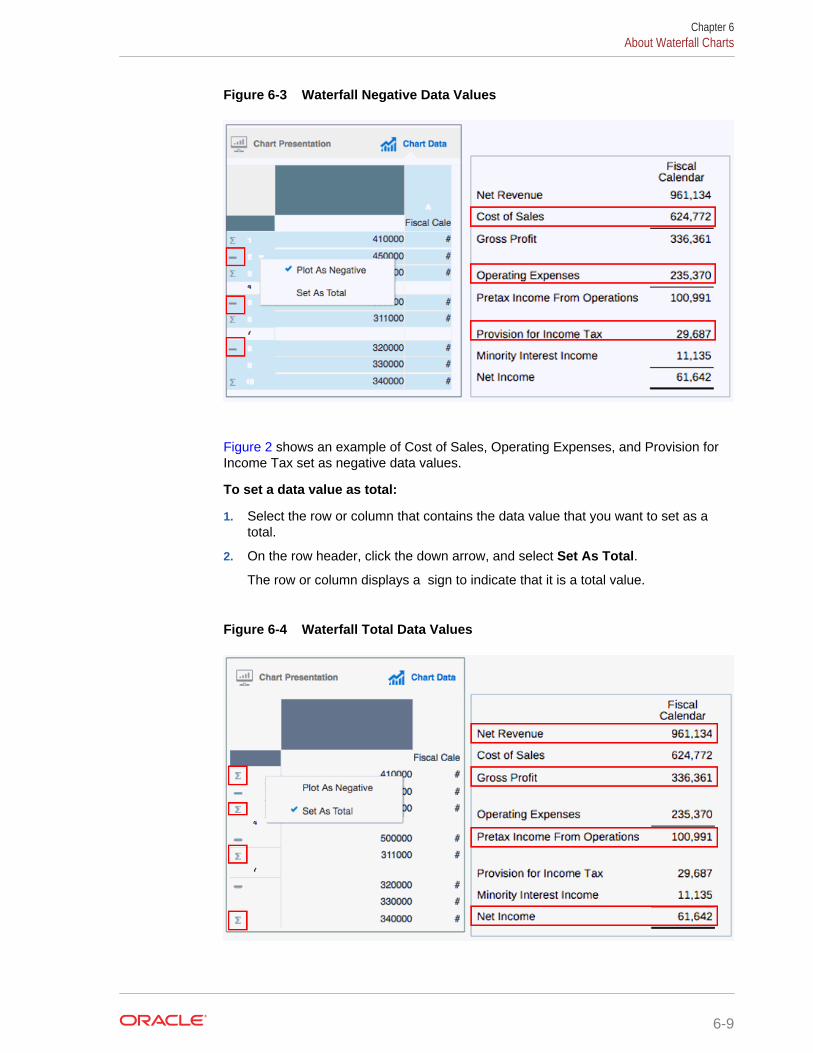
Figure 6-3 Waterfall Negative Data Values
Figure 2 shows an example of Cost of Sales, Operating Expenses, and Provision forIncome Tax set as negative data values.
To set a data value as total:
1. Select the row or column that contains the data value that you want to set as atotal.
2. On the row header, click the down arrow, and select Set As Total.
The row or column displays a � sign to indicate that it is a total value.
Figure 6-4 Waterfall Total Data Values
Chapter 6About Waterfall Charts
6-9
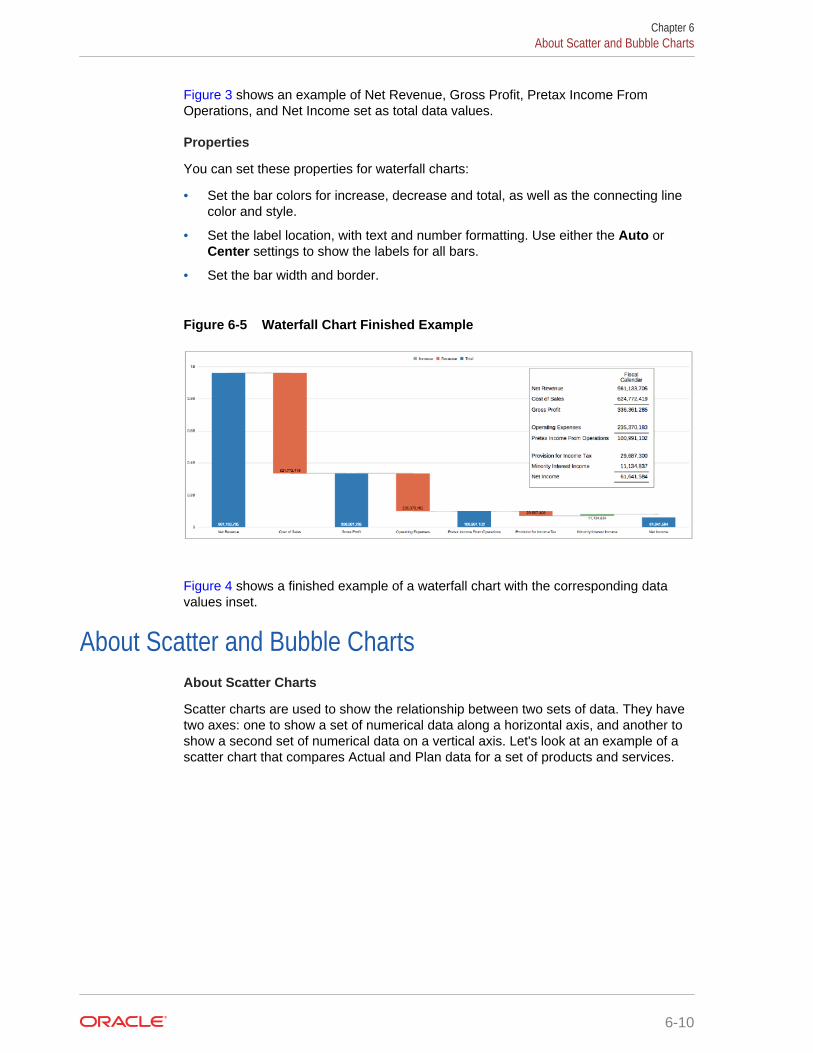
Figure 3 shows an example of Net Revenue, Gross Profit, Pretax Income FromOperations, and Net Income set as total data values.
Properties
You can set these properties for waterfall charts:
• Set the bar colors for increase, decrease and total, as well as the connecting linecolor and style.
• Set the label location, with text and number formatting. Use either the Auto orCenter settings to show the labels for all bars.
• Set the bar width and border.
Figure 6-5 Waterfall Chart Finished Example
Figure 4 shows a finished example of a waterfall chart with the corresponding datavalues inset.
About Scatter and Bubble ChartsAbout Scatter Charts
Scatter charts are used to show the relationship between two sets of data. They havetwo axes: one to show a set of numerical data along a horizontal axis, and another toshow a second set of numerical data on a vertical axis. Let's look at an example of ascatter chart that compares Actual and Plan data for a set of products and services.
Chapter 6About Scatter and Bubble Charts
6-10
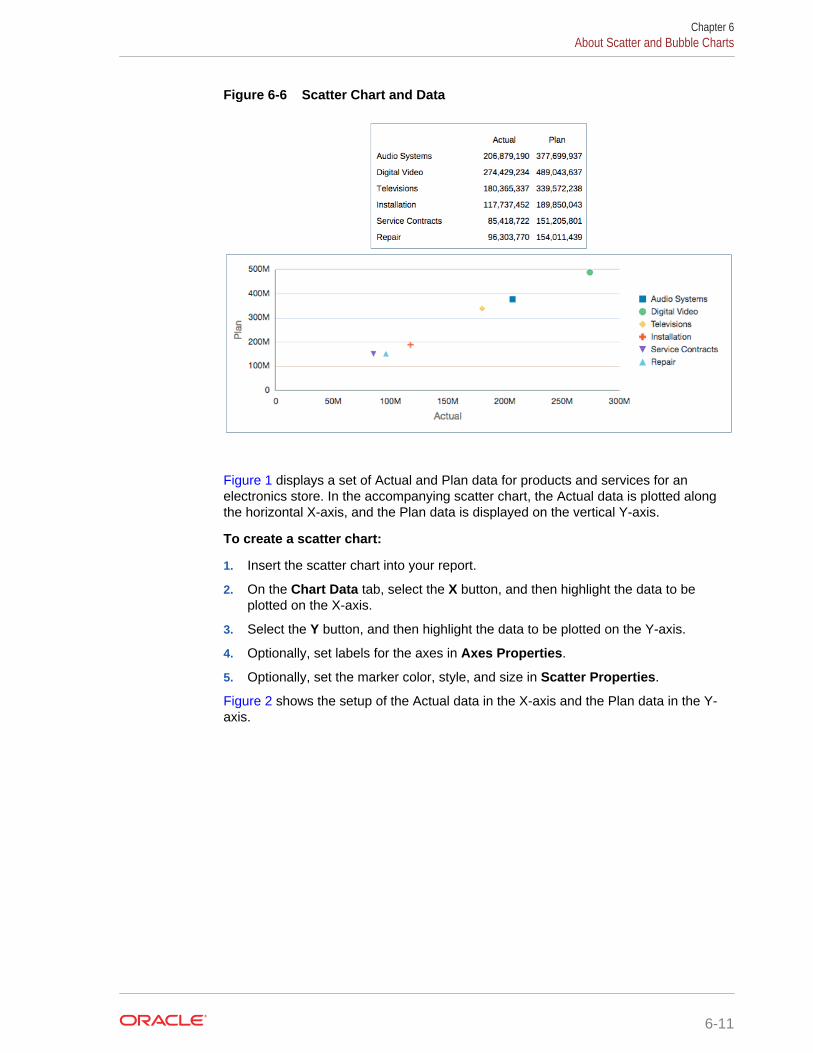
Figure 6-6 Scatter Chart and Data
Figure 1 displays a set of Actual and Plan data for products and services for anelectronics store. In the accompanying scatter chart, the Actual data is plotted alongthe horizontal X-axis, and the Plan data is displayed on the vertical Y-axis.
To create a scatter chart:
1. Insert the scatter chart into your report.
2. On the Chart Data tab, select the X button, and then highlight the data to beplotted on the X-axis.
3. Select the Y button, and then highlight the data to be plotted on the Y-axis.
4. Optionally, set labels for the axes in Axes Properties.
5. Optionally, set the marker color, style, and size in Scatter Properties.
Figure 2 shows the setup of the Actual data in the X-axis and the Plan data in the Y-axis.
Chapter 6About Scatter and Bubble Charts
6-11
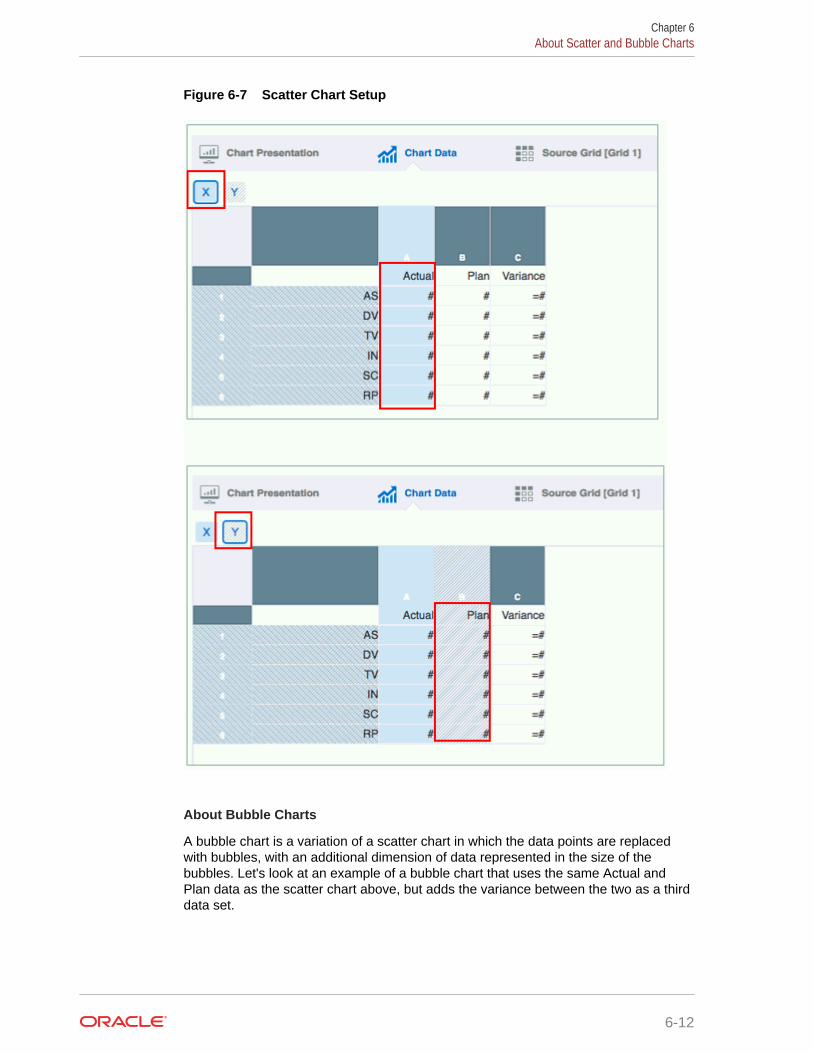
Figure 6-7 Scatter Chart Setup
About Bubble Charts
A bubble chart is a variation of a scatter chart in which the data points are replacedwith bubbles, with an additional dimension of data represented in the size of thebubbles. Let's look at an example of a bubble chart that uses the same Actual andPlan data as the scatter chart above, but adds the variance between the two as a thirddata set.
Chapter 6About Scatter and Bubble Charts
6-12
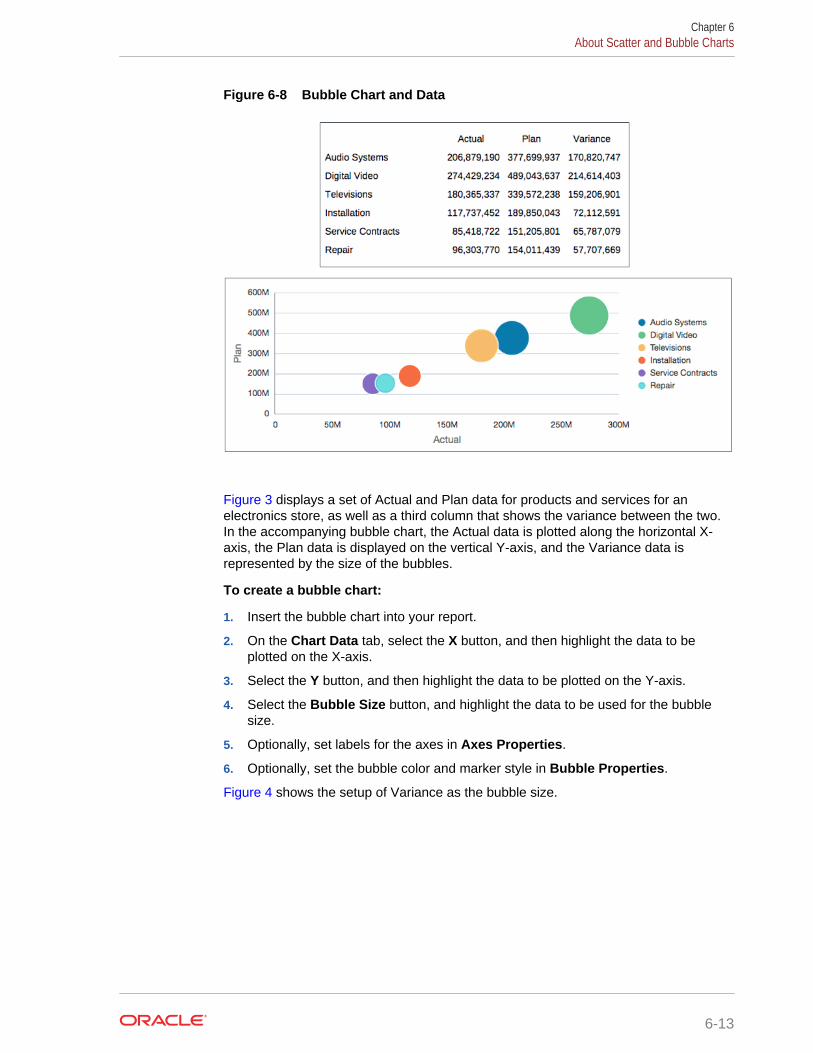
Figure 6-8 Bubble Chart and Data
Figure 3 displays a set of Actual and Plan data for products and services for anelectronics store, as well as a third column that shows the variance between the two.In the accompanying bubble chart, the Actual data is plotted along the horizontal X-axis, the Plan data is displayed on the vertical Y-axis, and the Variance data isrepresented by the size of the bubbles.
To create a bubble chart:
1. Insert the bubble chart into your report.
2. On the Chart Data tab, select the X button, and then highlight the data to beplotted on the X-axis.
3. Select the Y button, and then highlight the data to be plotted on the Y-axis.
4. Select the Bubble Size button, and highlight the data to be used for the bubblesize.
5. Optionally, set labels for the axes in Axes Properties.
6. Optionally, set the bubble color and marker style in Bubble Properties.
Figure 4 shows the setup of Variance as the bubble size.
Chapter 6About Scatter and Bubble Charts
6-13
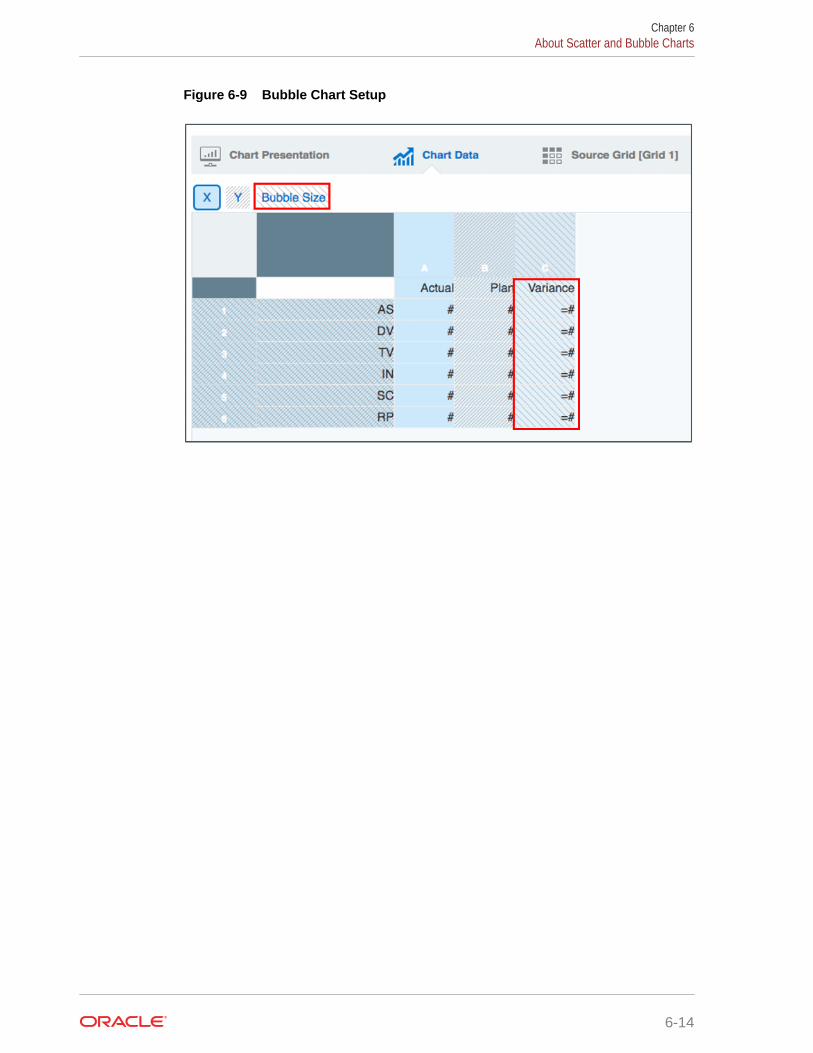
Figure 6-9 Bubble Chart Setup
Chapter 6About Scatter and Bubble Charts
6-14
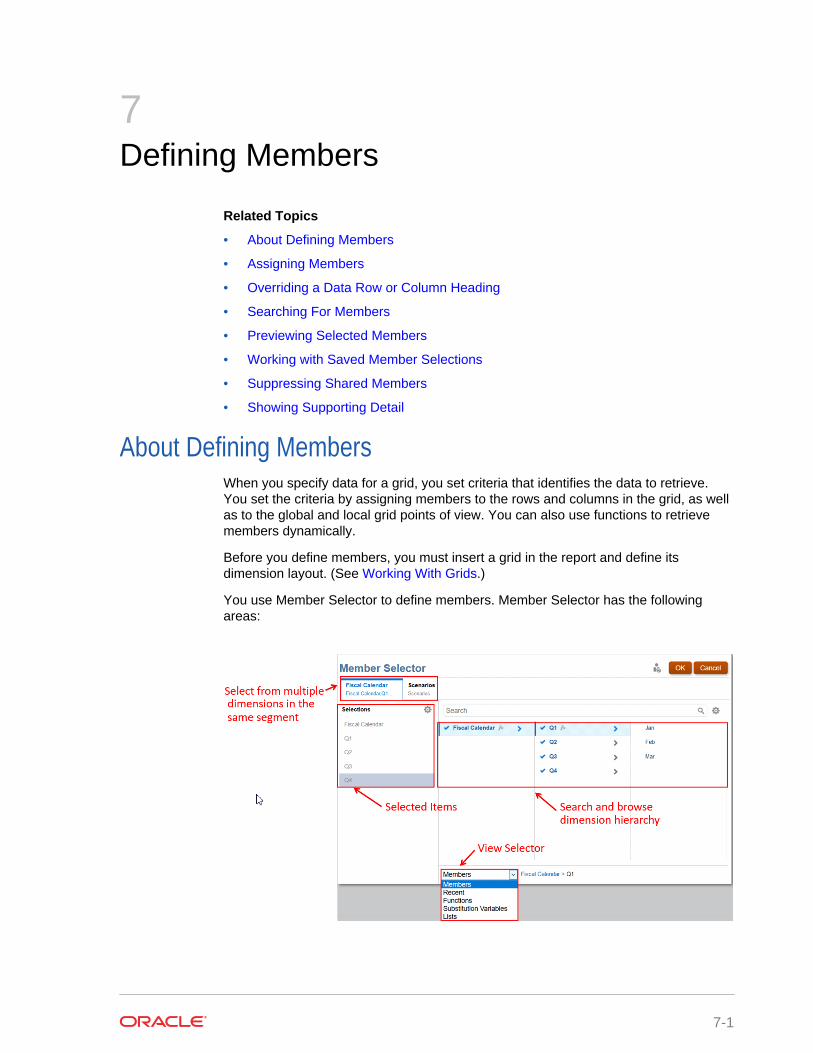
7Defining Members
Related Topics
• About Defining Members
• Assigning Members
• Overriding a Data Row or Column Heading
• Searching For Members
• Previewing Selected Members
• Working with Saved Member Selections
• Suppressing Shared Members
• Showing Supporting Detail
About Defining MembersWhen you specify data for a grid, you set criteria that identifies the data to retrieve.You set the criteria by assigning members to the rows and columns in the grid, as wellas to the global and local grid points of view. You can also use functions to retrievemembers dynamically.
Before you define members, you must insert a grid in the report and define itsdimension layout. (See Working With Grids.)
You use Member Selector to define members. Member Selector has the followingareas:
7-1
• The dimensions tabs on the top enable you to select from multiple dimensions inthe same segment.
• The Selections panel displays your currently selected items.
• The View Selector changes your view from Members, Recent, Functions,Substitution Variables, and Lists.
• The Selector Pane lets you search and browse the dimension hierarchy.
Note:
You can change the way members are displayed (for example, member
names or aliases) in the menu for the grid.
Assigning MembersYou assign members, functions, substitution variables, and lists to retrieve data foryour reports. You can select members to be displayed in your report, or you can usefunctions to select dimension members dynamically. You can insert a separate row orcolumn in a grid for each selected member, or you can place all of the selectedmembers in one row or column. If the selected members need different formatting (forexample, font, border, etc.). they must be placed in separate rows or columns.
Assigning Members to Data Rows or ColumnsTo assign members to data rows or columns:
1. Open a report and select a grid.
2. Open the Select Members dialog box by doing one of the following:
• Right-click a dimension, or click the down arrow next to a row or columnheading, and click Select Members.
• Select a dimension in the grid, and then click in the formula bar with thedimension name.
3. In the Select Members dialog box, select the members, members lists,substitution variables, or functions to assign to the selected data row or column.
Use the following conventions to select members.
• Click to drill into a parent member.
• Click to select and deselect a member.
Chapter 7Assigning Members
7-2
Note:
A blue check indicates that a member is currently selected. A greycheck when hovering over a member indicates that the member isnot currently selected.
• Click next to a member to select the member using a function. See Assigning Members Using Functions
• Click in the Selector Pane to sort the members.
4. Optional: To change the order of a selected member in the Selections list, selecta member and drag it to the desired location, or right-click and select Move Up orMove Down. To remove a member from the Selections list, right-click the memberand select Delete . You can also right-click and select Show in Hierarchy toexpand the parent members of that member and show it in the member hierarchy.
5. Optional: To edit the parameters of a selected member function, select the
member function in the Selections list and click . For example, selectInclusive in a member function to include that member in the function.
6. Click OK.
Assigning Members Using FunctionsYou use functions to select members dynamically. After you select a function, you canedit its parameters.
You create functions in two ways:
• Using a quick-select function
• Using the full Function Builder to select a function and then specifying itsparameters
Assigning Members Using Quick-Select Functions
To assign members using a quick-select function:
1. Open a report and select a grid.
2. Open the Select Members dialog box by doing one of the following:
• Right-click a dimension in the grid and click Select Members.
• Select a dimension in the grid, and then click in the formula bar with thedimension name.
3. In the Select Members dialog box, click next to a member to open functionbuilder.
4. Select a quick function from the list. Quick functions include:
• Bottom
Chapter 7Assigning Members
7-3
• Children
• Descendants
• Parent
• SameGeneration
• SameLevel
• Siblings
5. Optional: Click to include the selected member with the function. Forexample, Children of 500000 will retrieve the child members of Account 500000only, while Children of 500000 (Inclusive) will return the child members ofAccount 500000, as well as Account 500000 itself.
The selected function is added to the Selections panel.
Assigning Members Using the Full Function Builder
To assign members using the full function builder:
1. Open a report and select a grid.
2. Open the Select Members dialog box by doing one of the following:
• Right-click a dimension in the grid and click Select Members.
• Select a dimension in the grid, and then click in the formula bar with thedimension name.
3. In the Select Members dialog box, perform an action:
• Click next to a member, and then select View All Functions to openfunction builder.
• Select Functions in the View Selector drop down menu at the bottom of thedialog box.
4. Select a function from the list.
5. Enter the parameters for the function in the Parameters pane. The parametersdepend on the type of function selected. For example, for the Range function,specify the From and To members.
6. In the Parameters pane, click Select to add the function to the Selections panel.
Tip:
You may have to scroll down to see the Select button if a function hasseveral parameter fields.
The selected function is added to the Selections panel.
Functions Available Through Member SelectionThe functions listed in Table 1 can be selected from the Functions tab in the SelectMember dialog box.
Chapter 7Assigning Members
7-4
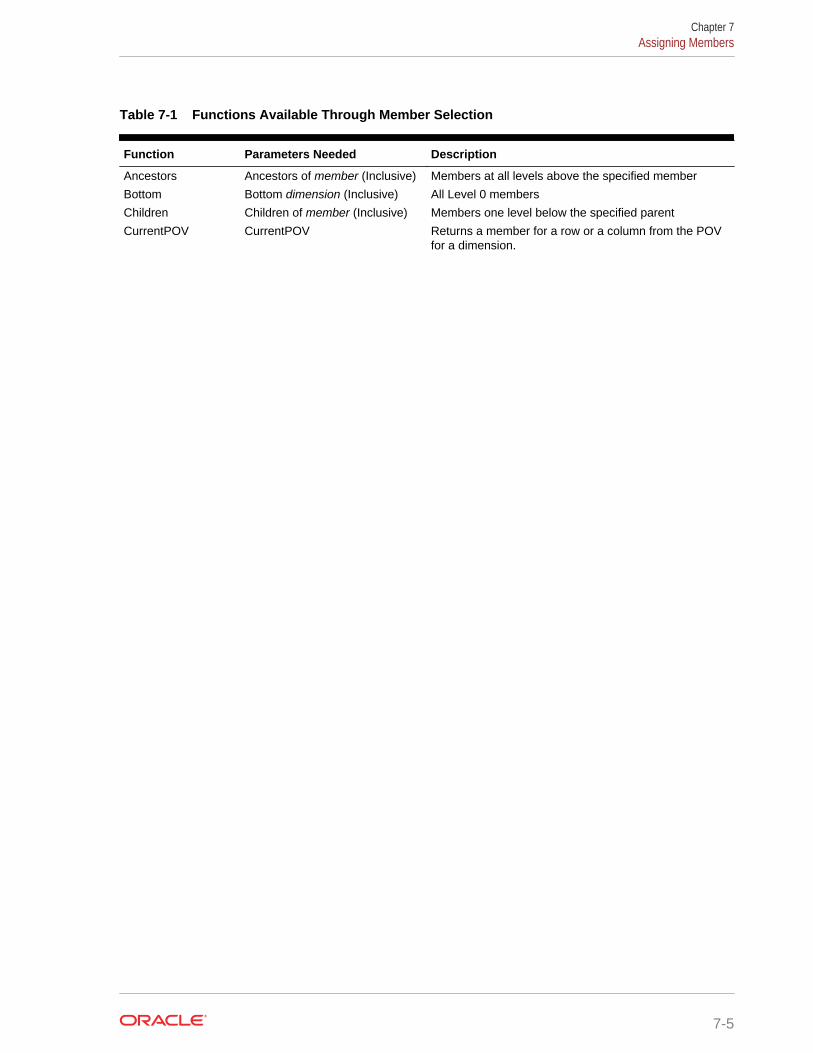
Table 7-1 Functions Available Through Member Selection
Function Parameters Needed Description
Ancestors Ancestors of member (Inclusive) Members at all levels above the specified member
Bottom Bottom dimension (Inclusive) All Level 0 members
Children Children of member (Inclusive) Members one level below the specified parent
CurrentPOV CurrentPOV Returns a member for a row or a column from the POVfor a dimension.
Chapter 7Assigning Members
7-5
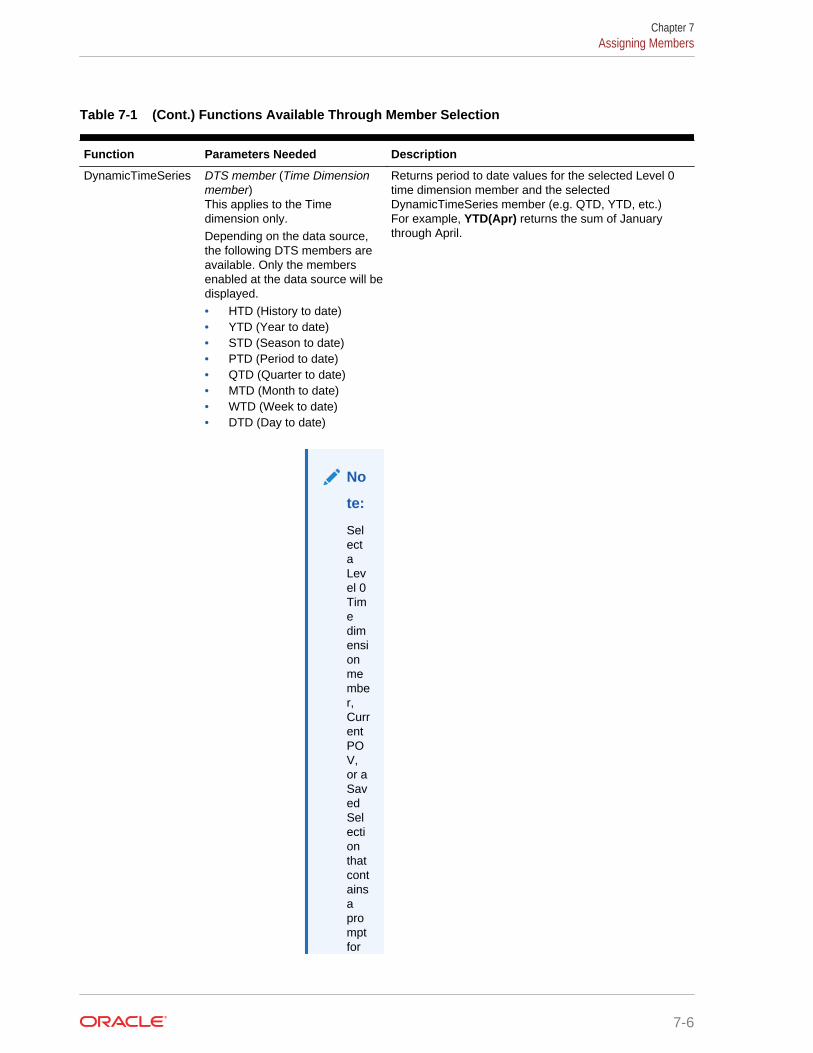
Table 7-1 (Cont.) Functions Available Through Member Selection
Function Parameters Needed Description
DynamicTimeSeries DTS member (Time Dimensionmember)This applies to the Timedimension only.Depending on the data source,the following DTS members areavailable. Only the membersenabled at the data source will bedisplayed.• HTD (History to date)• YTD (Year to date)• STD (Season to date)• PTD (Period to date)• QTD (Quarter to date)• MTD (Month to date)• WTD (Week to date)• DTD (Day to date)
No
te:
SelectaLevel 0Timedimensionmember,CurrentPOV,or aSavedSelectionthatcontainsapromptfor
Returns period to date values for the selected Level 0time dimension member and the selectedDynamicTimeSeries member (e.g. QTD, YTD, etc.)For example, YTD(Apr) returns the sum of Januarythrough April.
Chapter 7Assigning Members
7-6
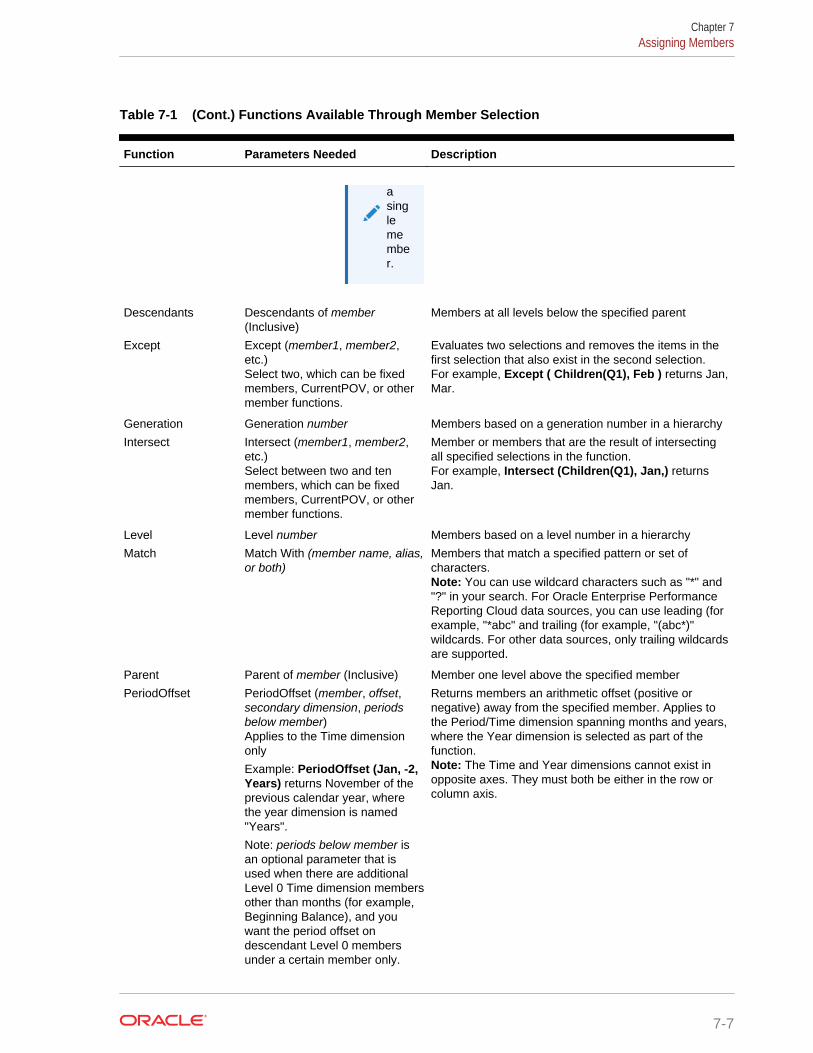
Table 7-1 (Cont.) Functions Available Through Member Selection
Function Parameters Needed Description
asinglemember.
Descendants Descendants of member(Inclusive)
Members at all levels below the specified parent
Except Except (member1, member2,etc.)Select two, which can be fixedmembers, CurrentPOV, or othermember functions.
Evaluates two selections and removes the items in thefirst selection that also exist in the second selection.For example, Except ( Children(Q1), Feb ) returns Jan,Mar.
Generation Generation number Members based on a generation number in a hierarchy
Intersect Intersect (member1, member2,etc.)Select between two and tenmembers, which can be fixedmembers, CurrentPOV, or othermember functions.
Member or members that are the result of intersectingall specified selections in the function.For example, Intersect (Children(Q1), Jan,) returnsJan.
Level Level number Members based on a level number in a hierarchy
Match Match With (member name, alias,or both)
Members that match a specified pattern or set ofcharacters.Note: You can use wildcard characters such as "*" and"?" in your search. For Oracle Enterprise PerformanceReporting Cloud data sources, you can use leading (forexample, "*abc" and trailing (for example, "(abc*)"wildcards. For other data sources, only trailing wildcardsare supported.
Parent Parent of member (Inclusive) Member one level above the specified member
PeriodOffset PeriodOffset (member, offset,secondary dimension, periodsbelow member)Applies to the Time dimensiononly
Example: PeriodOffset (Jan, -2,Years) returns November of theprevious calendar year, wherethe year dimension is named"Years".
Note: periods below member isan optional parameter that isused when there are additionalLevel 0 Time dimension membersother than months (for example,Beginning Balance), and youwant the period offset ondescendant Level 0 membersunder a certain member only.
Returns members an arithmetic offset (positive ornegative) away from the specified member. Applies tothe Period/Time dimension spanning months and years,where the Year dimension is selected as part of thefunction.Note: The Time and Year dimensions cannot exist inopposite axes. They must both be either in the row orcolumn axis.
Chapter 7Assigning Members
7-7
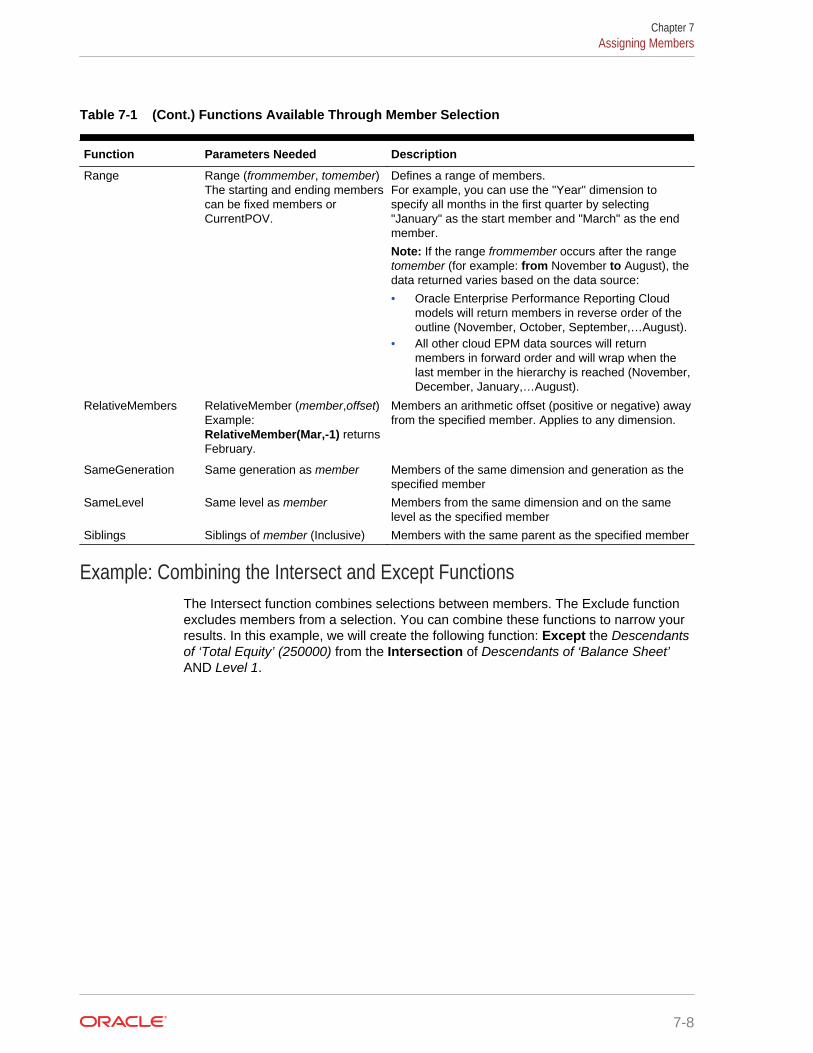
Table 7-1 (Cont.) Functions Available Through Member Selection
Function Parameters Needed Description
Range Range (frommember, tomember)The starting and ending memberscan be fixed members orCurrentPOV.
Defines a range of members.For example, you can use the "Year" dimension tospecify all months in the first quarter by selecting"January" as the start member and "March" as the endmember.
Note: If the range frommember occurs after the rangetomember (for example: from November to August), thedata returned varies based on the data source:
• Oracle Enterprise Performance Reporting Cloudmodels will return members in reverse order of theoutline (November, October, September,…August).
• All other cloud EPM data sources will returnmembers in forward order and will wrap when thelast member in the hierarchy is reached (November,December, January,…August).
RelativeMembers RelativeMember (member,offset)Example:RelativeMember(Mar,-1) returnsFebruary.
Members an arithmetic offset (positive or negative) awayfrom the specified member. Applies to any dimension.
SameGeneration Same generation as member Members of the same dimension and generation as thespecified member
SameLevel Same level as member Members from the same dimension and on the samelevel as the specified member
Siblings Siblings of member (Inclusive) Members with the same parent as the specified member
Example: Combining the Intersect and Except FunctionsThe Intersect function combines selections between members. The Exclude functionexcludes members from a selection. You can combine these functions to narrow yourresults. In this example, we will create the following function: Except the Descendantsof ‘Total Equity’ (250000) from the Intersection of Descendants of ‘Balance Sheet’AND Level 1.
Chapter 7Assigning Members
7-8
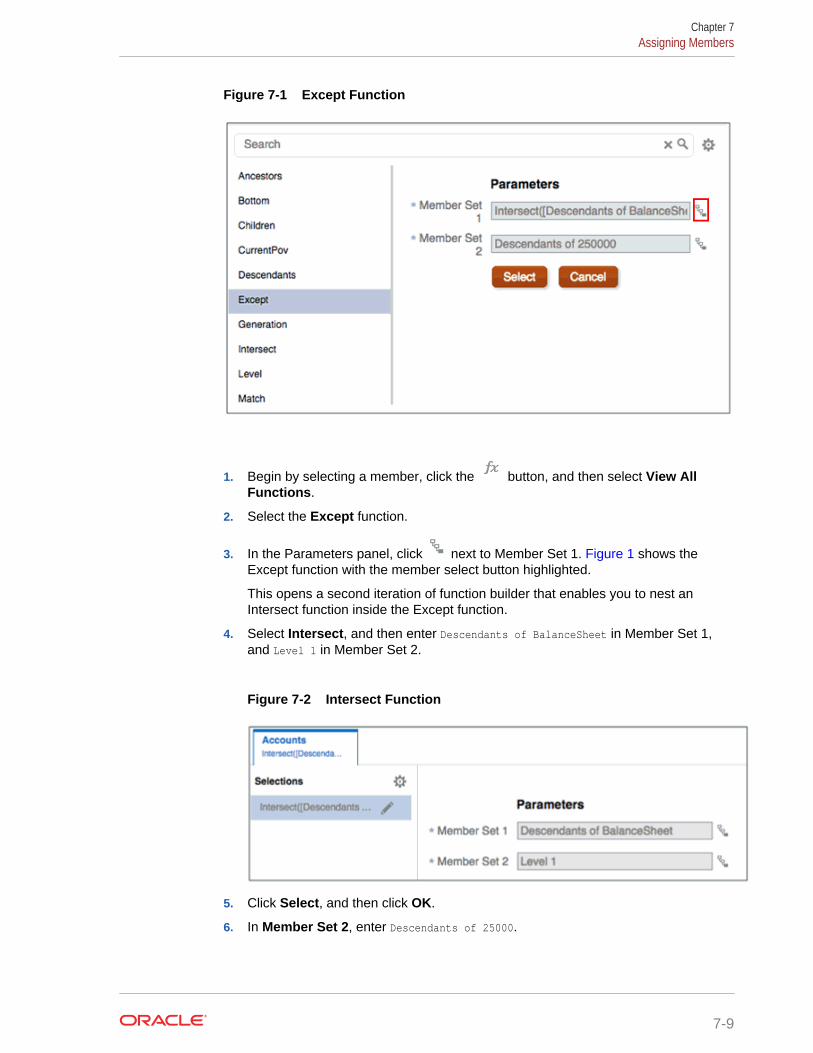
Figure 7-1 Except Function
1. Begin by selecting a member, click the button, and then select View AllFunctions.
2. Select the Except function.
3. In the Parameters panel, click next to Member Set 1. Figure 1 shows theExcept function with the member select button highlighted.
This opens a second iteration of function builder that enables you to nest anIntersect function inside the Except function.
4. Select Intersect, and then enter Descendants of BalanceSheet in Member Set 1,and Level 1 in Member Set 2.
Figure 7-2 Intersect Function
5. Click Select, and then click OK.
6. In Member Set 2, enter Descendants of 25000.
Chapter 7Assigning Members
7-9
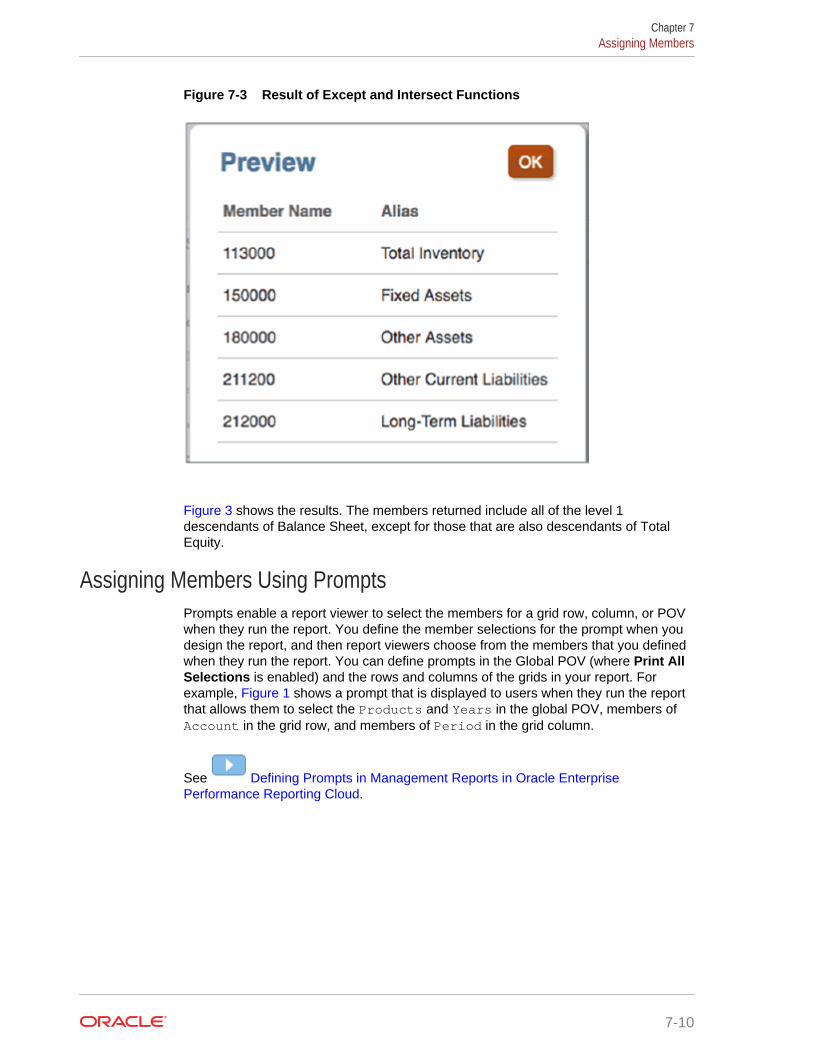
Figure 7-3 Result of Except and Intersect Functions
Figure 3 shows the results. The members returned include all of the level 1descendants of Balance Sheet, except for those that are also descendants of TotalEquity.
Assigning Members Using PromptsPrompts enable a report viewer to select the members for a grid row, column, or POVwhen they run the report. You define the member selections for the prompt when youdesign the report, and then report viewers choose from the members that you definedwhen they run the report. You can define prompts in the Global POV (where Print AllSelections is enabled) and the rows and columns of the grids in your report. Forexample, Figure 1 shows a prompt that is displayed to users when they run the reportthat allows them to select the Products and Years in the global POV, members ofAccount in the grid row, and members of Period in the grid column.
See Defining Prompts in Management Reports in Oracle EnterprisePerformance Reporting Cloud.
Chapter 7Assigning Members
7-10
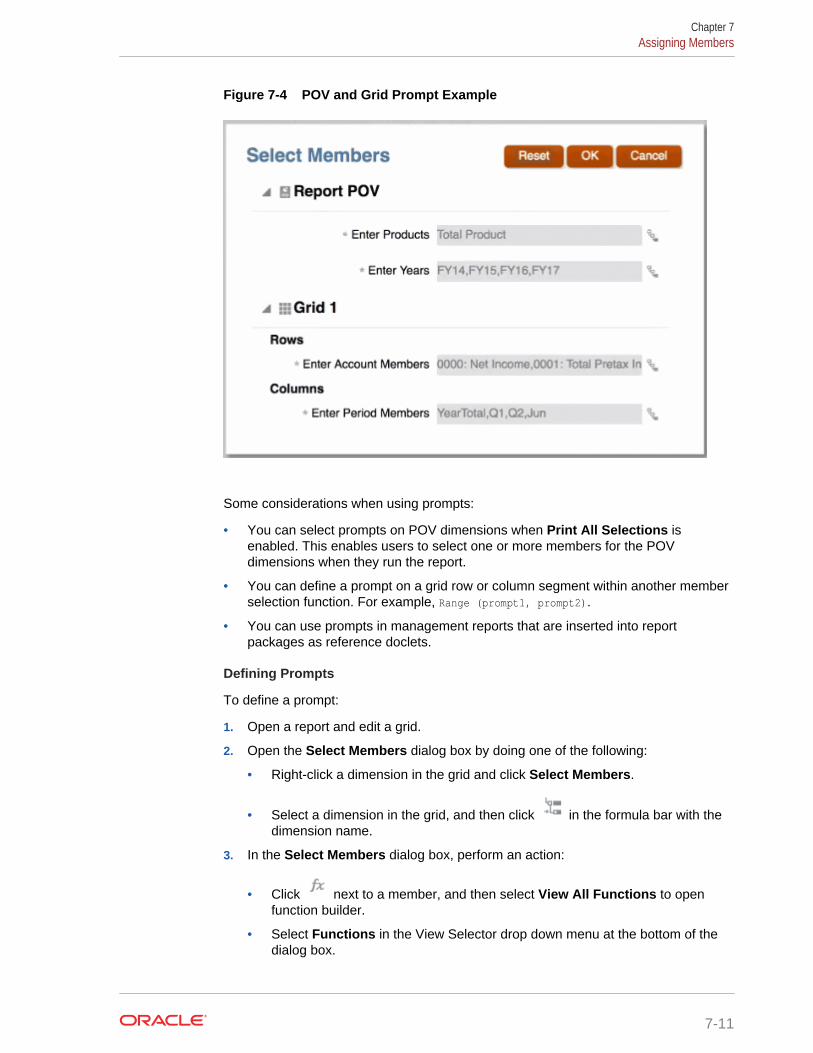
Figure 7-4 POV and Grid Prompt Example
Some considerations when using prompts:
• You can select prompts on POV dimensions when Print All Selections isenabled. This enables users to select one or more members for the POVdimensions when they run the report.
• You can define a prompt on a grid row or column segment within another memberselection function. For example, Range (prompt1, prompt2).
• You can use prompts in management reports that are inserted into reportpackages as reference doclets.
Defining Prompts
To define a prompt:
1. Open a report and edit a grid.
2. Open the Select Members dialog box by doing one of the following:
• Right-click a dimension in the grid and click Select Members.
• Select a dimension in the grid, and then click in the formula bar with thedimension name.
3. In the Select Members dialog box, perform an action:
• Click next to a member, and then select View All Functions to openfunction builder.
• Select Functions in the View Selector drop down menu at the bottom of thedialog box.
Chapter 7Assigning Members
7-11
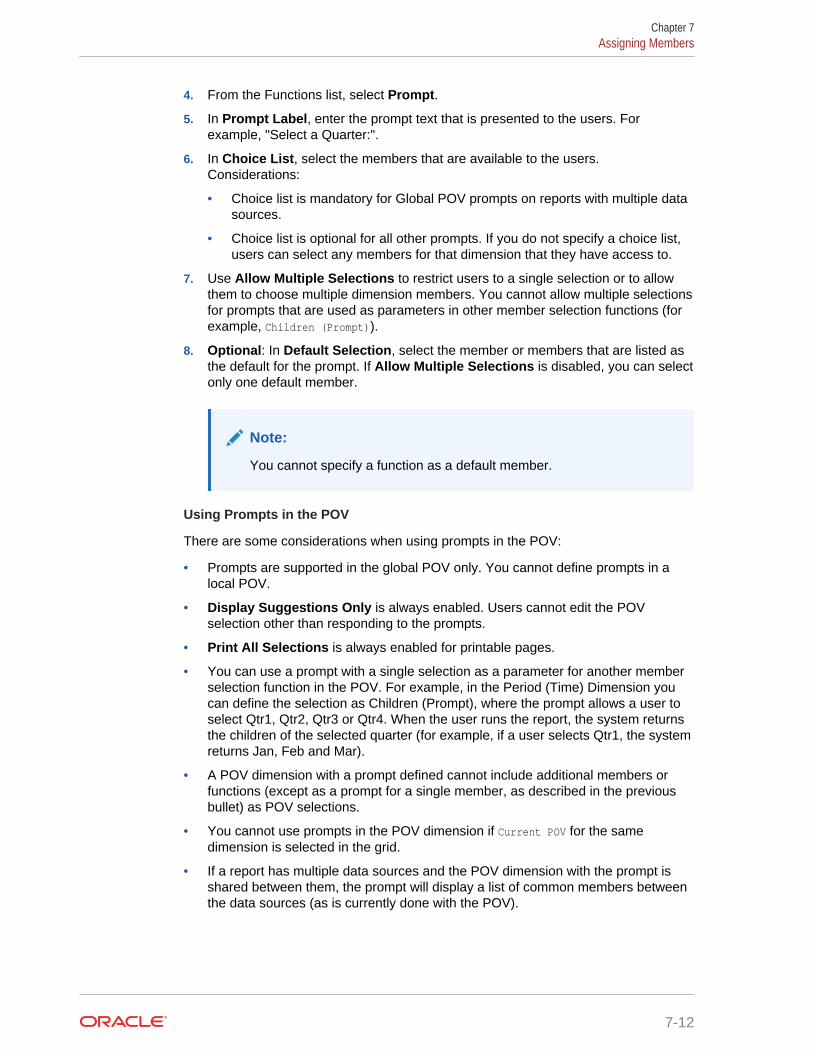
4. From the Functions list, select Prompt.
5. In Prompt Label, enter the prompt text that is presented to the users. Forexample, "Select a Quarter:".
6. In Choice List, select the members that are available to the users.Considerations:
• Choice list is mandatory for Global POV prompts on reports with multiple datasources.
• Choice list is optional for all other prompts. If you do not specify a choice list,users can select any members for that dimension that they have access to.
7. Use Allow Multiple Selections to restrict users to a single selection or to allowthem to choose multiple dimension members. You cannot allow multiple selectionsfor prompts that are used as parameters in other member selection functions (forexample, Children (Prompt)).
8. Optional: In Default Selection, select the member or members that are listed asthe default for the prompt. If Allow Multiple Selections is disabled, you can selectonly one default member.
Note:
You cannot specify a function as a default member.
Using Prompts in the POV
There are some considerations when using prompts in the POV:
• Prompts are supported in the global POV only. You cannot define prompts in alocal POV.
• Display Suggestions Only is always enabled. Users cannot edit the POVselection other than responding to the prompts.
• Print All Selections is always enabled for printable pages.
• You can use a prompt with a single selection as a parameter for another memberselection function in the POV. For example, in the Period (Time) Dimension youcan define the selection as Children (Prompt), where the prompt allows a user toselect Qtr1, Qtr2, Qtr3 or Qtr4. When the user runs the report, the system returnsthe children of the selected quarter (for example, if a user selects Qtr1, the systemreturns Jan, Feb and Mar).
• A POV dimension with a prompt defined cannot include additional members orfunctions (except as a prompt for a single member, as described in the previousbullet) as POV selections.
• You cannot use prompts in the POV dimension if Current POV for the samedimension is selected in the grid.
• If a report has multiple data sources and the POV dimension with the prompt isshared between them, the prompt will display a list of common members betweenthe data sources (as is currently done with the POV).
Chapter 7Assigning Members
7-12
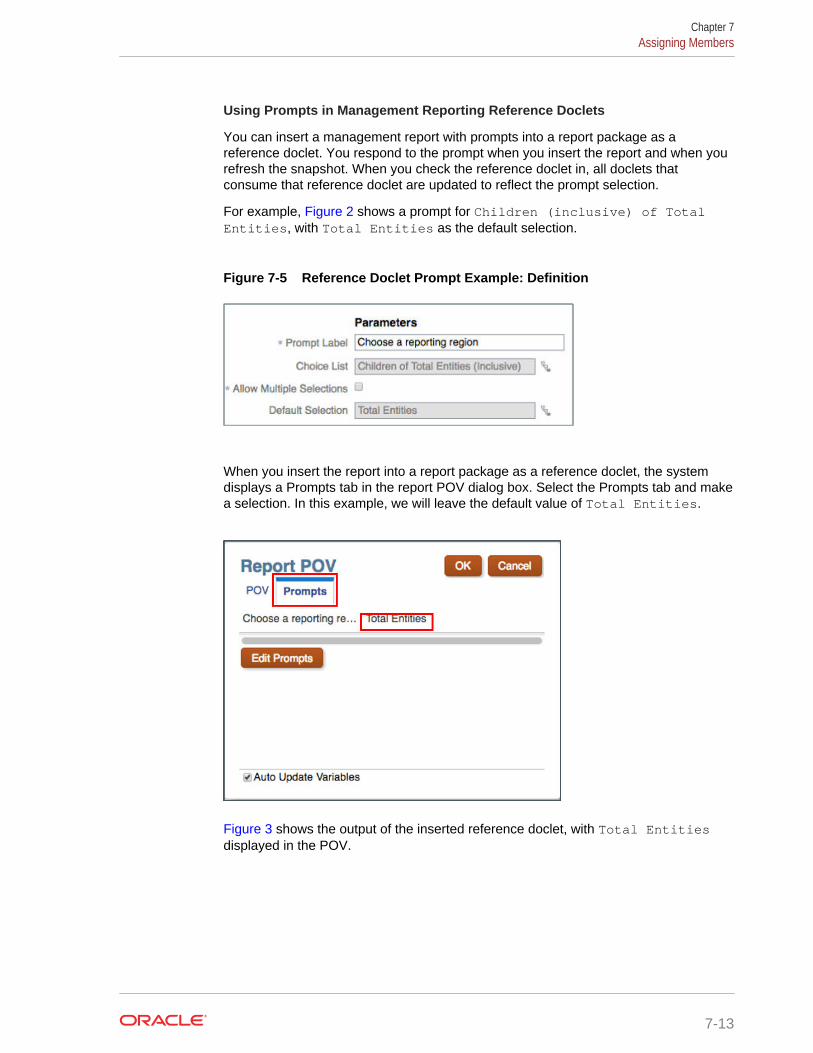
Using Prompts in Management Reporting Reference Doclets
You can insert a management report with prompts into a report package as areference doclet. You respond to the prompt when you insert the report and when yourefresh the snapshot. When you check the reference doclet in, all doclets thatconsume that reference doclet are updated to reflect the prompt selection.
For example, Figure 2 shows a prompt for Children (inclusive) of TotalEntities, with Total Entities as the default selection.
Figure 7-5 Reference Doclet Prompt Example: Definition
When you insert the report into a report package as a reference doclet, the systemdisplays a Prompts tab in the report POV dialog box. Select the Prompts tab and makea selection. In this example, we will leave the default value of Total Entities.
Figure 3 shows the output of the inserted reference doclet, with Total Entitiesdisplayed in the POV.
Chapter 7Assigning Members
7-13

Figure 7-6 Reference Doclet Prompt Example: Output
Working with Substitution VariablesSubstitution variables are variables that are defined at the EPM Cloud or Essbase datasource that serve as a placeholders for specific members that change regularly. Forexample, you can use the variable CurrMonth to represent the current month (Jan),and you can insert it as a member selection in a report. Create substitution variables atthe data source by creating the variable and the string value. You can then change thevalue of the variable at the data source at any time.
When you select members for a grid, the member selector displays the substitutionvariables that are available for the selected dimension. Both the substitution variablename and the value are displayed for grid columns, rows and point of view (POV).Substitution variables are prefixed with an "&" (for example, &CurrMonth).
Some considerations when working with substitution variables:
• You can use substitution variables as member selections within other memberselection functions, just as you would use a regular member. For example,"Children (&CurrentQuarter)".
• You can enable report previewers to select substitution variables in POVselections.
• Substitution variable values are retrieved when the system connects to the datasource. Therefore, if a substitution variable value changes, the change will not bereflected in Management Reporting until the system reconnects to a new session.
• For Management Reporting reference doclets in a report package, you can selectsubstitution variables from the member selector.
Overriding a Data Row or Column HeadingBy default, labels for data row and column headings, such as member name, alias, orboth, are inherited from the Headings section of the grid properties. You can overridethe default settings at the row or column level.
Chapter 7Overriding a Data Row or Column Heading
7-14

To override a specific data row or column heading in the grid:
1. In a data row or column heading cell, click .
Tip:
You can select multiple header cells for the same dimension.
2. Select a display option:
• Accept the grid default for the label.
• Display the member name only.
• Display the member alias only.
• Display the member name and alias.
• Create a custom header.
Note:
For custom headers, enter the text, text function, or both, that you
want to display for the header, or click to select a text function.See About Text Functions
Searching For MembersYou can perform searches for members to edit. Search uses the Member Labelssetting from the grid Actions menu to search on Member Name, Alias, or Both.
Search uses the Member Labels setting from the grid Actions menu to search onMember Name, Alias, or Both.
To search for a member:
1. Open a report and select a grid.
2. Open the Select Members dialog box by doing one of the following:
• Right-click a dimension in the grid and click Select Members.
• Select a dimension in the grid, and then click in the formula bar with thedimension name.
3. In the Member Selector dialog box, enter the text to search for in the search box
and click .
The system displays the fully-qualified member name of the search result, as wellas its ancestors where applicable.
4. Optional: In the search results, click to expand the parent members of thatmember and show it in the member hierarchy
Chapter 7Searching For Members
7-15
5. Optional: Use the View Selector drop down menu to change your view from yoursearch results to the member hierarchy, recent, functions, or lists.
Previewing Selected MembersYou can preview the members, functions, and lists selected for your report before yourun it. The members that you view result from an evaluated member list or function.
To preview members:
1. Open a report and select a grid.
2. Open the Select Members dialog box by doing one of the following:
• Right-click a dimension in the grid and click Select Members.
• Select a dimension in the grid, and then click in the formula bar with thedimension name.
3. In the Select Members dialog box, in the Selections pane, click .
4. Select Preview.
Working with Saved Member SelectionsSaved member selections enable you to define a list of members that can be reusedas a member selection within a report. You can save one or more members, functions,or a prompt as your saved member selection, and then use that selection in multiplesegments in a report.
Some considerations when working with saved member selections:
• You can use a saved selection as a member selection parameter in a functionwhen a single member or prompt result is defined.
• You must be a report designer to view and use saved selections. View-only userscannot view or use saved selections.
• At this time, saved selections can be used only in the report in which they werecreated. You cannot use a saved member selection across reports (like User-defined lists).
• If you insert a Management Reporting report with saved selections as a referencedoclet into a report package, the saved selections are not exposed when yougenerate a report snapshot.
• When working with report packages, saved selections are available only when youedit the report definition.
Creating, Editing, Deleting, Renaming and Duplicating Saved MemberSelections
Creating Saved Member Selections
To create a saved member selection:
Chapter 7Previewing Selected Members
7-16
1. In Member Selector, select one or more of the following:
• Members
• Functions
• Prompts
2. From the
menu, select Save Selection.
3. Enter a name for the saved selection, and click OK.
Editing, Deleting, Duplicating or Renaming Saved Member Selections
To edit or delete a saved member selection:
1. Open the member selector dialog for the dimension where the saved selectionexists.
2. From the View Selector drop-down menu, select Saved Selections.
3. Perform an action:
• To edit the saved selection, click the Saved Selection Actions drop-downmenu next to the saved selection and then Edit.
• To delete the saved selection, click the Saved Selection Actions drop-downmenu next to the saved selection and then Delete.
• From the Saved Selection Actions drop-down menu next to the savedselection, select Duplicate.
• From the Saved Selection Actions drop-down menu next to the savedselection, select Rename.
Using Saved Selections in Member SelectionAfter you have created a saved member selection (see Creating, Editing, Deleting,Renaming and Duplicating Saved Member Selections), you can use the savedselection as a member selection.
To use a saved selection as a member selection:
1. Open the member selector dialog for the member on which you want to use asaved selection.
2. From the View Selector drop down menu, select Saved Selections. The SaveSelection dialog is displayed.
3. Select a saved selection to use as a member selection.
Note:
Click a saved selection to view its definition in the right panel. You canalso search on saved selections.
Chapter 7Working with Saved Member Selections
7-17

Suppressing Shared MembersTo suppress the display of shared members in a grid:
1. Open the Member Selector.
2. In the Selections pane, click .
3. Click next to Suppress Shared Members.
Showing Supporting DetailWhen you use an applicable EPM Cloud data source and select a row with theAccount dimension in it, you can display supporting detail for a member. If supportingdetail exists for one or more cells in the selected row, additional rows are inserted toshow the supporting detail.
Note:
Supporting detail is available only in the rows, and only for the Accountdimension. Also, the Account dimension must be the only dimension in therow.
To show supporting detail:
1. In a grid, select a row with the Account dimension in it that contains a member withsupporting detail.
2. Right-click, or click the down arrow in the header, and choose Select Members.
Chapter 7Suppressing Shared Members
7-18

3. In Selections, click , and then click the check mark next to Show SupportingDetail.
4. Click OK.
Cells with supporting detail enabled are indicated with a triangle in the upper rightcorner of the cell.
Chapter 7Showing Supporting Detail
7-19
8Using Functions
Related Topics
• Mathematical Functions
• Text Functions
• Conditional Functions
Mathematical FunctionsRelated Topics
• About Mathematical Functions
• Absolute
• Average
• AverageA
• Count
• CountA
• Difference
• Eval
• IFThen
• Max
• Min
• PercentofTotal
• Product
• Rank
• Round
• Sum
• Truncate
• Variance
• VariancePercent
About Mathematical FunctionsMathematical functions perform calculations on numeric values or data from a grid.Mathematical functions, formulas, and their syntax are not case-sensitive.
The syntax for a mathematical function is:
FunctionName(arguments)
8-1
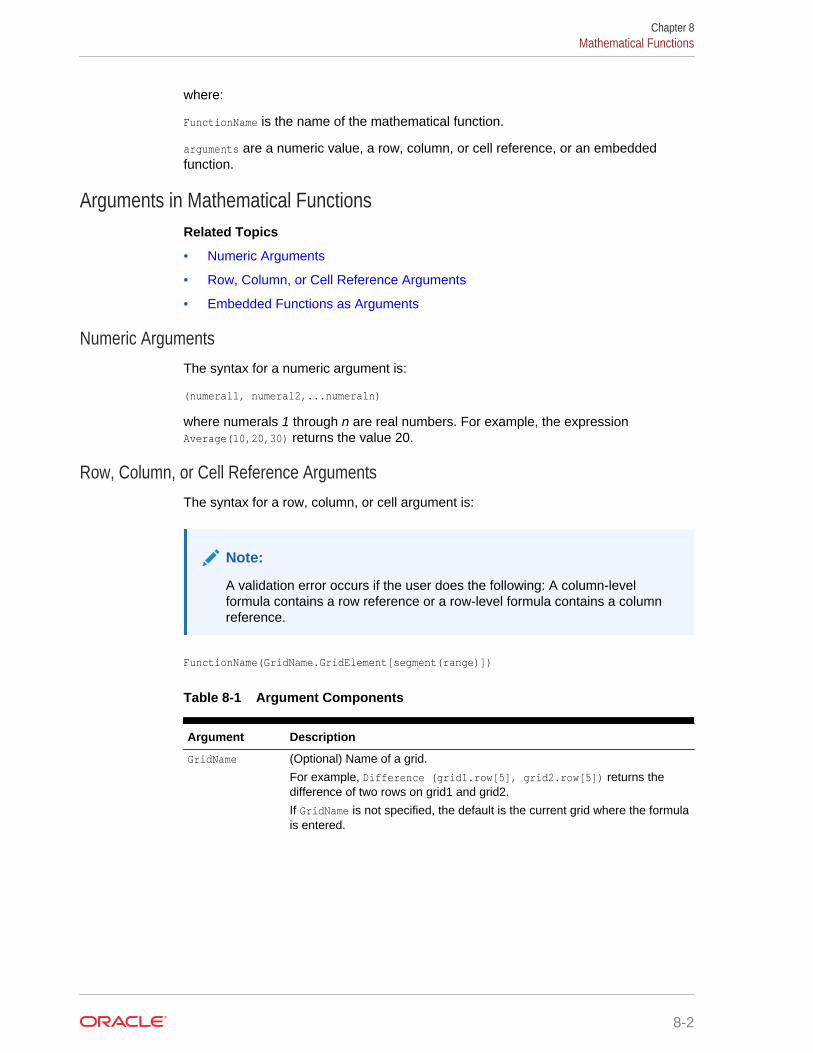
where:
FunctionName is the name of the mathematical function.
arguments are a numeric value, a row, column, or cell reference, or an embeddedfunction.
Arguments in Mathematical FunctionsRelated Topics
• Numeric Arguments
• Row, Column, or Cell Reference Arguments
• Embedded Functions as Arguments
Numeric ArgumentsThe syntax for a numeric argument is:
(numeral1, numeral2,...numeraln)
where numerals 1 through n are real numbers. For example, the expressionAverage(10,20,30) returns the value 20.
Row, Column, or Cell Reference ArgumentsThe syntax for a row, column, or cell argument is:
Note:
A validation error occurs if the user does the following: A column-levelformula contains a row reference or a row-level formula contains a columnreference.
FunctionName(GridName.GridElement[segment(range)])
Table 8-1 Argument Components
Argument Description
GridName (Optional) Name of a grid.
For example, Difference (grid1.row[5], grid2.row[5]) returns thedifference of two rows on grid1 and grid2.
If GridName is not specified, the default is the current grid where the formulais entered.
Chapter 8Mathematical Functions
8-2
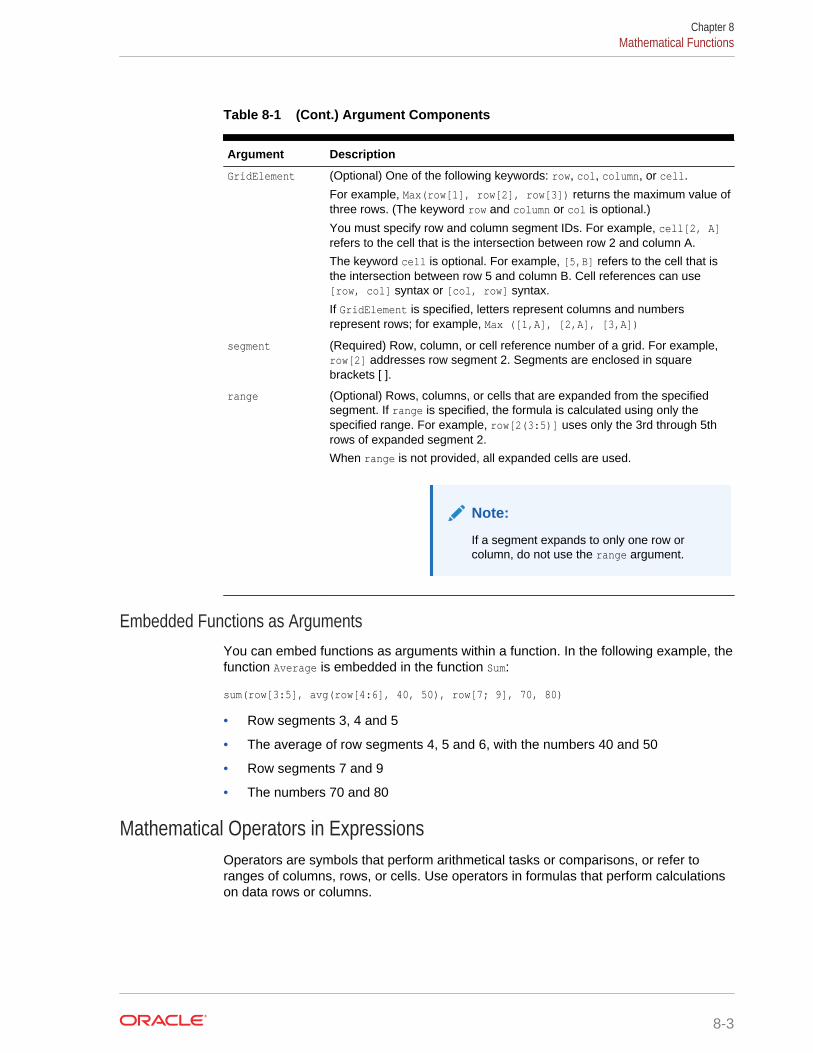
Table 8-1 (Cont.) Argument Components
Argument Description
GridElement (Optional) One of the following keywords: row, col, column, or cell.
For example, Max(row[1], row[2], row[3]) returns the maximum value ofthree rows. (The keyword row and column or col is optional.)
You must specify row and column segment IDs. For example, cell[2, A]refers to the cell that is the intersection between row 2 and column A.
The keyword cell is optional. For example, [5,B] refers to the cell that isthe intersection between row 5 and column B. Cell references can use[row, col] syntax or [col, row] syntax.
If GridElement is specified, letters represent columns and numbersrepresent rows; for example, Max ([1,A], [2,A], [3,A])
segment (Required) Row, column, or cell reference number of a grid. For example,row[2] addresses row segment 2. Segments are enclosed in squarebrackets [ ].
range (Optional) Rows, columns, or cells that are expanded from the specifiedsegment. If range is specified, the formula is calculated using only thespecified range. For example, row[2(3:5)] uses only the 3rd through 5throws of expanded segment 2.
When range is not provided, all expanded cells are used.
Note:
If a segment expands to only one row orcolumn, do not use the range argument.
Embedded Functions as ArgumentsYou can embed functions as arguments within a function. In the following example, thefunction Average is embedded in the function Sum:
sum(row[3:5], avg(row[4:6], 40, 50), row[7; 9], 70, 80)
• Row segments 3, 4 and 5
• The average of row segments 4, 5 and 6, with the numbers 40 and 50
• Row segments 7 and 9
• The numbers 70 and 80
Mathematical Operators in ExpressionsOperators are symbols that perform arithmetical tasks or comparisons, or refer toranges of columns, rows, or cells. Use operators in formulas that perform calculationson data rows or columns.
Chapter 8Mathematical Functions
8-3
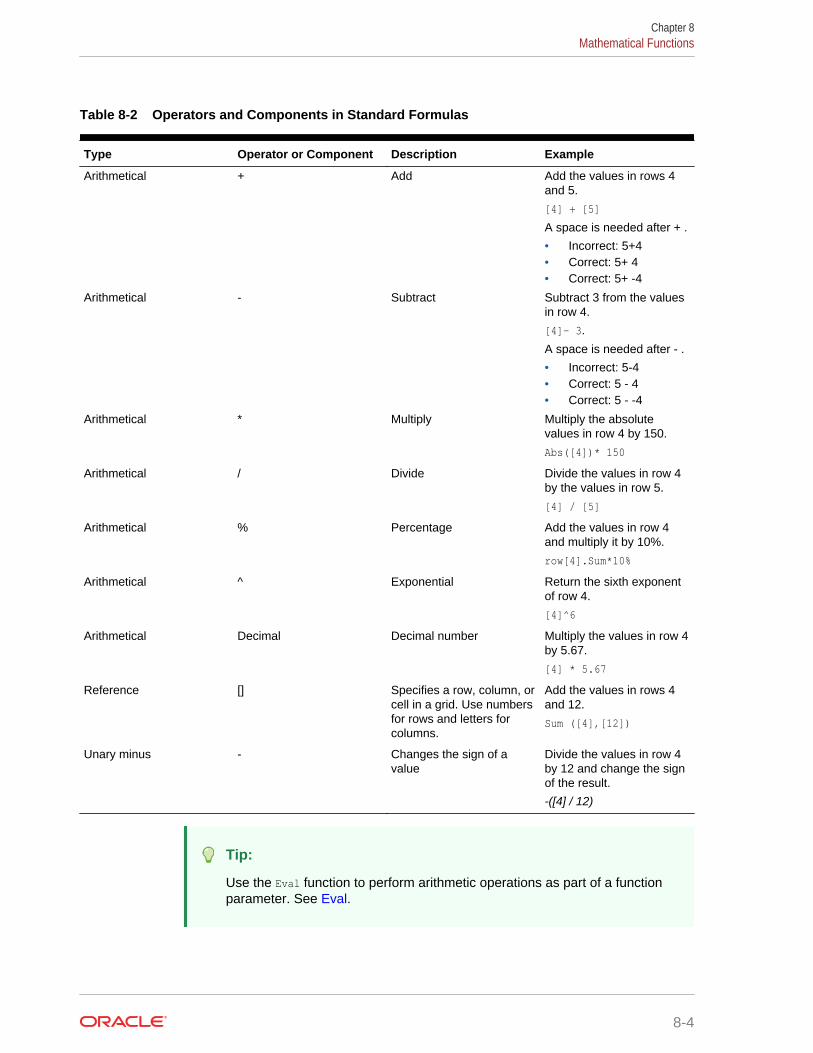
Table 8-2 Operators and Components in Standard Formulas
Type Operator or Component Description Example
Arithmetical + Add Add the values in rows 4and 5.
[4] + [5]
A space is needed after + .
• Incorrect: 5+4• Correct: 5+ 4• Correct: 5+ -4
Arithmetical - Subtract Subtract 3 from the valuesin row 4.
[4]- 3.
A space is needed after - .
• Incorrect: 5-4• Correct: 5 - 4• Correct: 5 - -4
Arithmetical * Multiply Multiply the absolutevalues in row 4 by 150.
Abs([4])* 150
Arithmetical / Divide Divide the values in row 4by the values in row 5.
[4] / [5]
Arithmetical % Percentage Add the values in row 4and multiply it by 10%.
row[4].Sum*10%
Arithmetical ^ Exponential Return the sixth exponentof row 4.
[4]^6
Arithmetical Decimal Decimal number Multiply the values in row 4by 5.67.
[4] * 5.67
Reference [] Specifies a row, column, orcell in a grid. Use numbersfor rows and letters forcolumns.
Add the values in rows 4and 12.
Sum ([4],[12])
Unary minus - Changes the sign of avalue
Divide the values in row 4by 12 and change the signof the result.
-([4] / 12)
Tip:
Use the Eval function to perform arithmetic operations as part of a functionparameter. See Eval.
Chapter 8Mathematical Functions
8-4
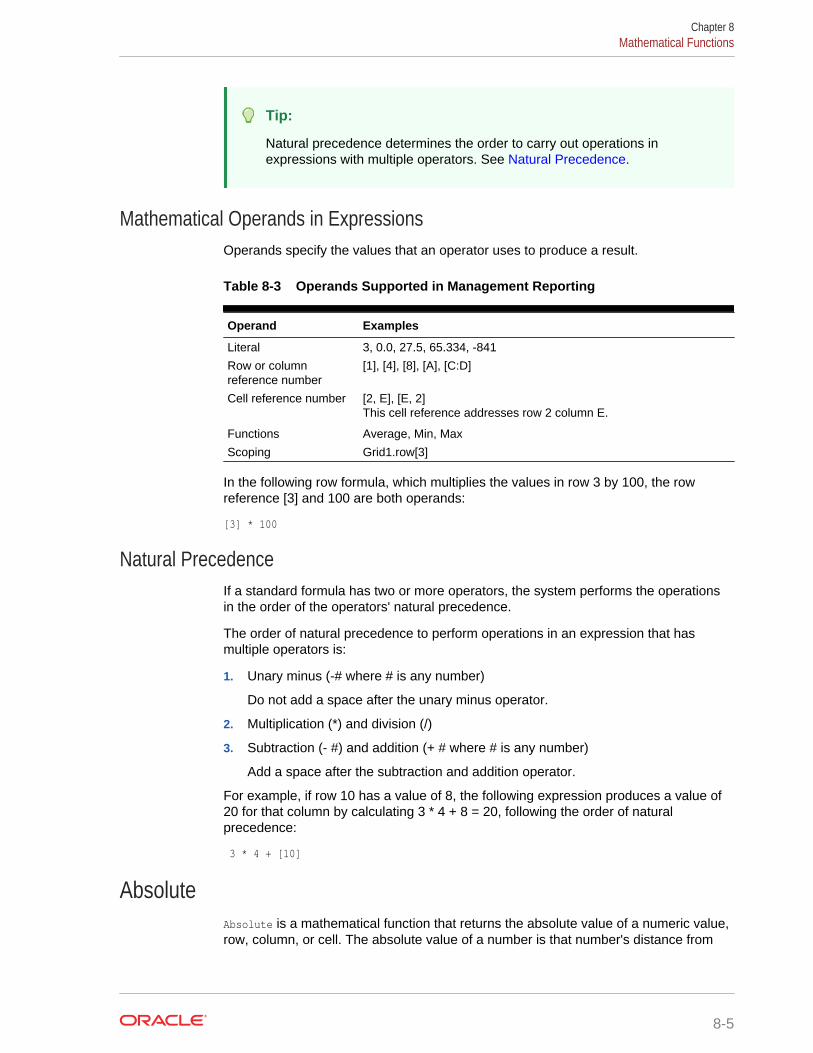
Tip:
Natural precedence determines the order to carry out operations inexpressions with multiple operators. See Natural Precedence.
Mathematical Operands in ExpressionsOperands specify the values that an operator uses to produce a result.
Table 8-3 Operands Supported in Management Reporting
Operand Examples
Literal 3, 0.0, 27.5, 65.334, -841
Row or columnreference number
[1], [4], [8], [A], [C:D]
Cell reference number [2, E], [E, 2]This cell reference addresses row 2 column E.
Functions Average, Min, Max
Scoping Grid1.row[3]
In the following row formula, which multiplies the values in row 3 by 100, the rowreference [3] and 100 are both operands:
[3] * 100
Natural PrecedenceIf a standard formula has two or more operators, the system performs the operationsin the order of the operators' natural precedence.
The order of natural precedence to perform operations in an expression that hasmultiple operators is:
1. Unary minus (-# where # is any number)
Do not add a space after the unary minus operator.
2. Multiplication (*) and division (/)
3. Subtraction (- #) and addition (+ # where # is any number)
Add a space after the subtraction and addition operator.
For example, if row 10 has a value of 8, the following expression produces a value of20 for that column by calculating 3 * 4 + 8 = 20, following the order of naturalprecedence:
3 * 4 + [10]
AbsoluteAbsolute is a mathematical function that returns the absolute value of a numeric value,row, column, or cell. The absolute value of a number is that number's distance from
Chapter 8Mathematical Functions
8-5
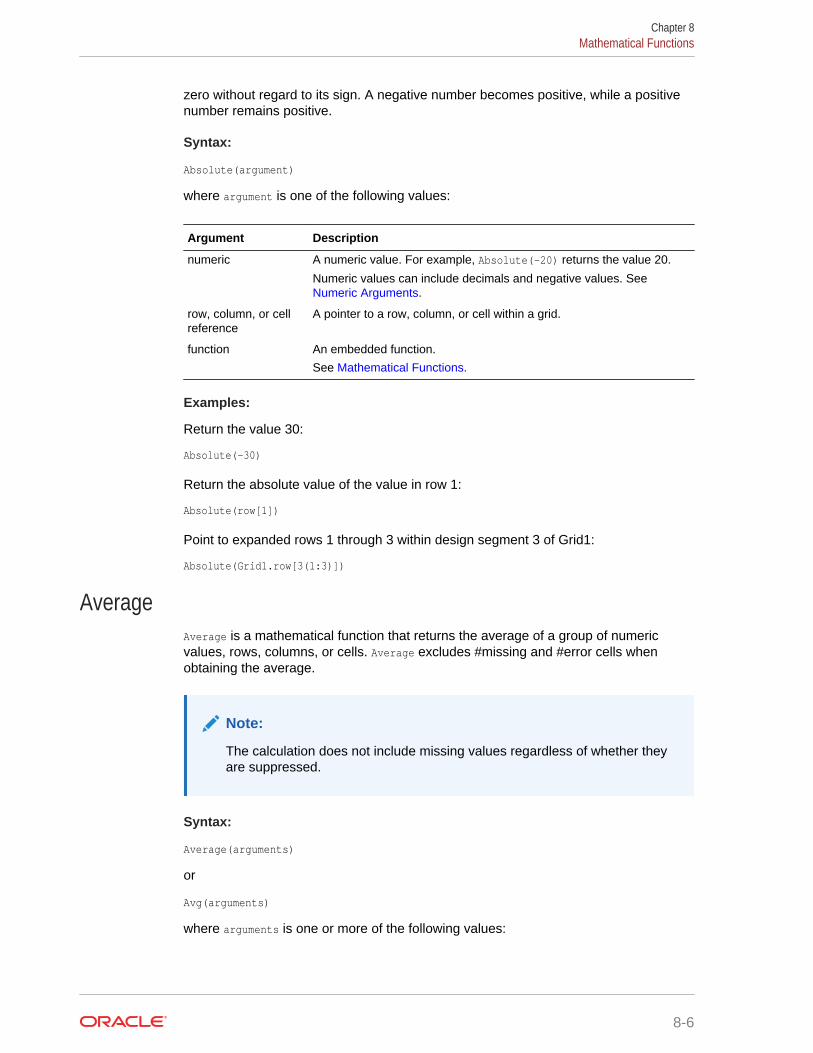
zero without regard to its sign. A negative number becomes positive, while a positivenumber remains positive.
Syntax:
Absolute(argument)
where argument is one of the following values:
Argument Description
numeric A numeric value. For example, Absolute(-20) returns the value 20.
Numeric values can include decimals and negative values. See Numeric Arguments.
row, column, or cellreference
A pointer to a row, column, or cell within a grid.
function An embedded function.
See Mathematical Functions.
Examples:
Return the value 30:
Absolute(-30)
Return the absolute value of the value in row 1:
Absolute(row[1])
Point to expanded rows 1 through 3 within design segment 3 of Grid1:
Absolute(Grid1.row[3(1:3)])
AverageAverage is a mathematical function that returns the average of a group of numericvalues, rows, columns, or cells. Average excludes #missing and #error cells whenobtaining the average.
Note:
The calculation does not include missing values regardless of whether theyare suppressed.
Syntax:
Average(arguments)
or
Avg(arguments)
where arguments is one or more of the following values:
Chapter 8Mathematical Functions
8-6
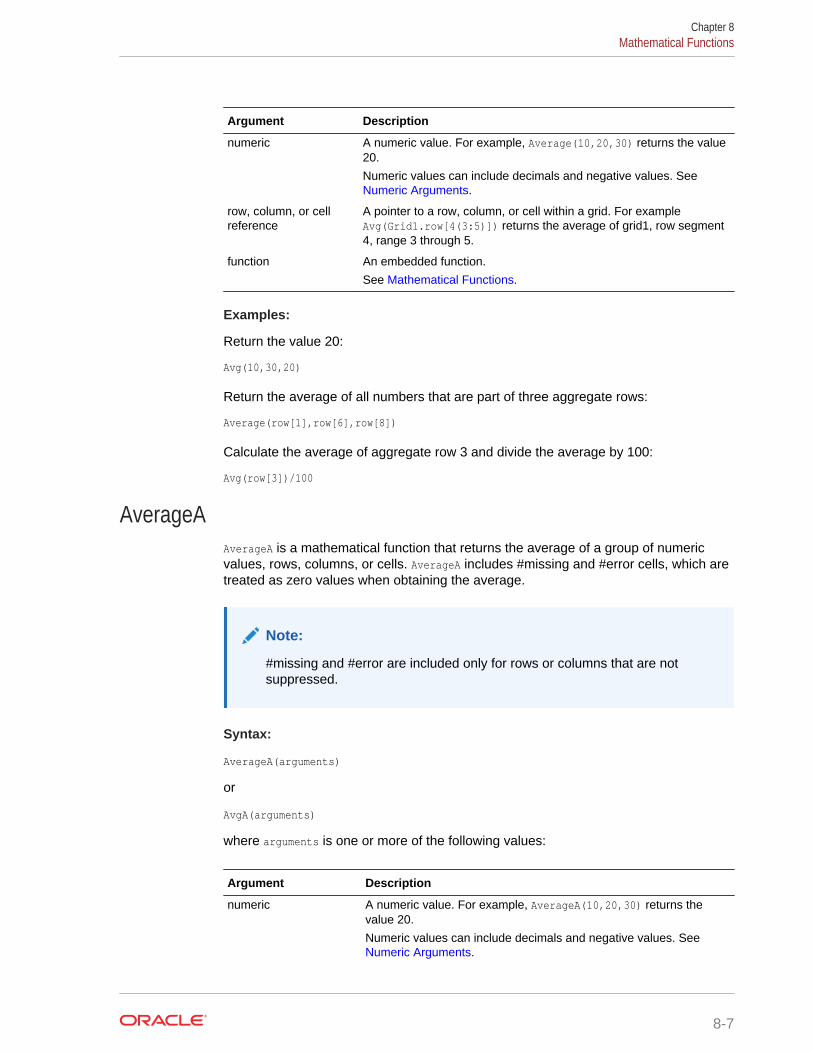
Argument Description
numeric A numeric value. For example, Average(10,20,30) returns the value20.
Numeric values can include decimals and negative values. See Numeric Arguments.
row, column, or cellreference
A pointer to a row, column, or cell within a grid. For exampleAvg(Grid1.row[4(3:5)]) returns the average of grid1, row segment4, range 3 through 5.
function An embedded function.
See Mathematical Functions.
Examples:
Return the value 20:
Avg(10,30,20)
Return the average of all numbers that are part of three aggregate rows:
Average(row[1],row[6],row[8])
Calculate the average of aggregate row 3 and divide the average by 100:
Avg(row[3])/100
AverageAAverageA is a mathematical function that returns the average of a group of numericvalues, rows, columns, or cells. AverageA includes #missing and #error cells, which aretreated as zero values when obtaining the average.
Note:
#missing and #error are included only for rows or columns that are notsuppressed.
Syntax:
AverageA(arguments)
or
AvgA(arguments)
where arguments is one or more of the following values:
Argument Description
numeric A numeric value. For example, AverageA(10,20,30) returns thevalue 20.
Numeric values can include decimals and negative values. See Numeric Arguments.
Chapter 8Mathematical Functions
8-7

Argument Description
row, column, or cellreference
A pointer to a row, column, or cell within a grid.
For example, AvgA(Grid1.row[4(3:5)] returns the average of grid1,row segment 4, range 3 through 5.
function An embedded function.
See Mathematical Functions.
Example:
If a grid has four rows with the values 10, 20, 30, and #error, the following formula inthe 5th row returns the value 15:
AverageA([1:4])
CountCount is a mathematical function that returns the number of values in a group ofnumeric values, rows, columns, or cells. Count excludes #missing and #error whenobtaining the count.
Syntax:
Count(arguments)
where arguments is one or more of the following values:
Argument Description
numeric A numeric value. For example, Count (10, 20, 30) returns the value3.
Numeric values can include decimals and negative values. See Numeric Arguments.
row, column, or cellreference
A pointer to a row, column, or cell within a grid.
function An embedded function.
See Mathematical Functions.
Examples:
If a grid has four rows with the values 10, 20, 30, and #error, the following formula inthe 5th row returns the count of three rows:
Count([1:4])
Return the count of three rows:
Count(row[1], row[6], row[8]])
CountACountA is a mathematical function that returns the number of values in a group ofnumeric values, rows, columns, or cells. CountA includes #missing and #error cellswhen obtaining the count only for rows or columns that are not suppressed.
Chapter 8Mathematical Functions
8-8
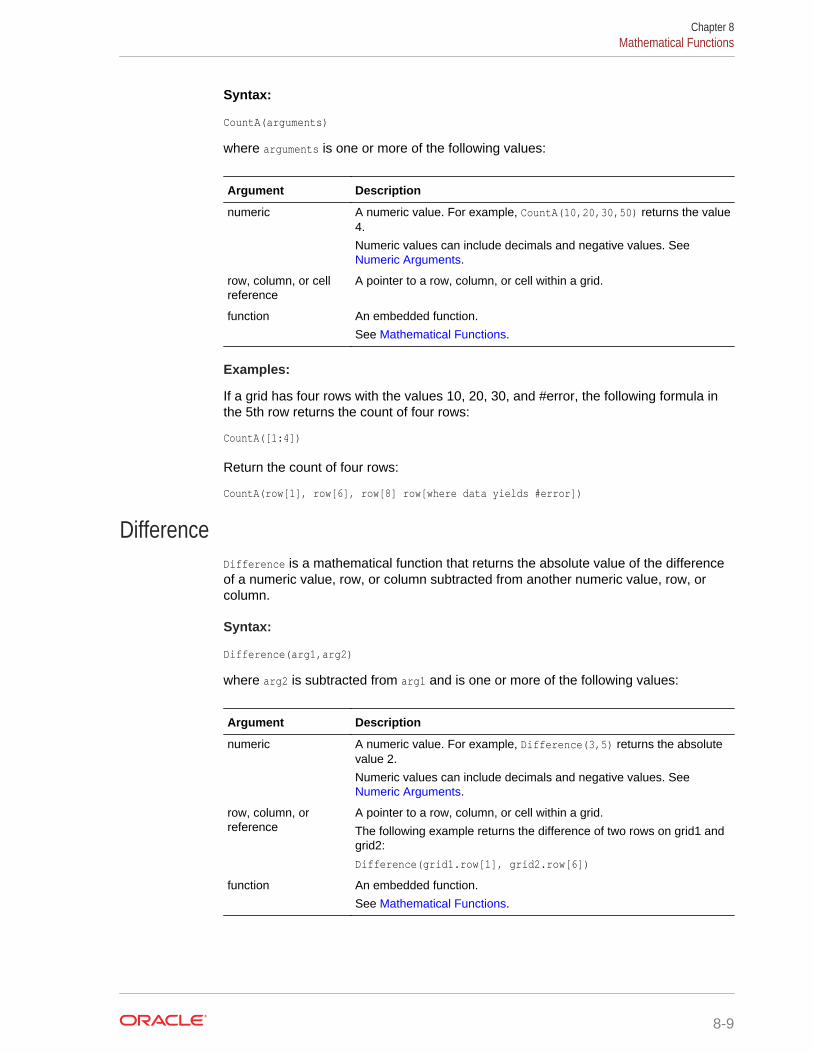
Syntax:
CountA(arguments)
where arguments is one or more of the following values:
Argument Description
numeric A numeric value. For example, CountA(10,20,30,50) returns the value4.
Numeric values can include decimals and negative values. See Numeric Arguments.
row, column, or cellreference
A pointer to a row, column, or cell within a grid.
function An embedded function.
See Mathematical Functions.
Examples:
If a grid has four rows with the values 10, 20, 30, and #error, the following formula inthe 5th row returns the count of four rows:
CountA([1:4])
Return the count of four rows:
CountA(row[1], row[6], row[8] row[where data yields #error])
DifferenceDifference is a mathematical function that returns the absolute value of the differenceof a numeric value, row, or column subtracted from another numeric value, row, orcolumn.
Syntax:
Difference(arg1,arg2)
where arg2 is subtracted from arg1 and is one or more of the following values:
Argument Description
numeric A numeric value. For example, Difference(3,5) returns the absolutevalue 2.
Numeric values can include decimals and negative values. See Numeric Arguments.
row, column, orreference
A pointer to a row, column, or cell within a grid.
The following example returns the difference of two rows on grid1 andgrid2:
Difference(grid1.row[1], grid2.row[6])
function An embedded function.
See Mathematical Functions.
Chapter 8Mathematical Functions
8-9
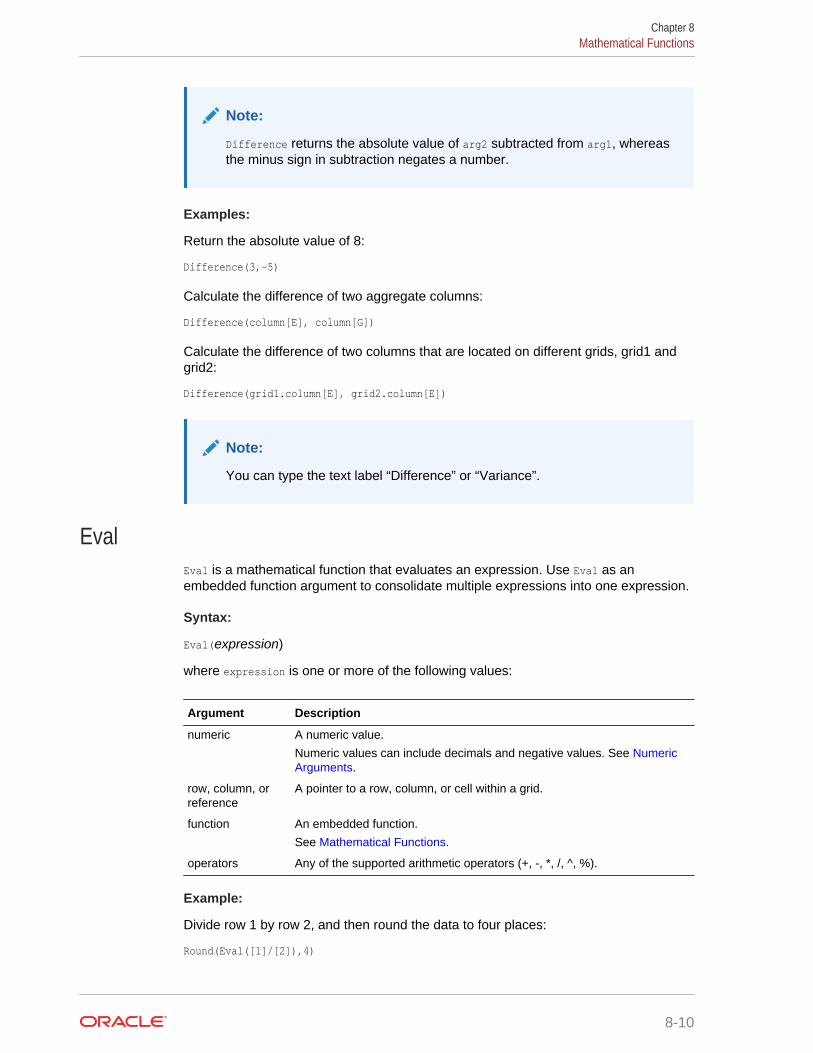
Note:
Difference returns the absolute value of arg2 subtracted from arg1, whereasthe minus sign in subtraction negates a number.
Examples:
Return the absolute value of 8:
Difference(3,-5)
Calculate the difference of two aggregate columns:
Difference(column[E], column[G])
Calculate the difference of two columns that are located on different grids, grid1 andgrid2:
Difference(grid1.column[E], grid2.column[E])
Note:
You can type the text label “Difference” or “Variance”.
EvalEval is a mathematical function that evaluates an expression. Use Eval as anembedded function argument to consolidate multiple expressions into one expression.
Syntax:
Eval(expression)
where expression is one or more of the following values:
Argument Description
numeric A numeric value.
Numeric values can include decimals and negative values. See NumericArguments.
row, column, orreference
A pointer to a row, column, or cell within a grid.
function An embedded function.
See Mathematical Functions.
operators Any of the supported arithmetic operators (+, -, *, /, ^, %).
Example:
Divide row 1 by row 2, and then round the data to four places:
Round(Eval([1]/[2]),4)
Chapter 8Mathematical Functions
8-10
Note:
In this example, you must use EVAL to get the desired result. The followingdoes not work: Round(([1]/[2]),4).
IFThenIfThen is a conditional function that returns a value when the condition equals True,and another value when the condition equals False. For more information aboutworking with conditional functions, see Conditional Functions
MaxMax is a mathematical function that returns the maximum value in a group of numericvalues, rows, columns, or cells.
Syntax:
Max(arguments)
where arguments is one or more of the following values:
Argument Description
numeric A numeric value. For example, Max(10,20,30) returns the value 30.
Numeric values can include decimals and negative values. See NumericArguments.
row, column, orcell reference
A pointer to a row, column, or cell within a grid.
function An embedded function.
See Mathematical Functions.
Examples:
Return the maximum value in rows 1, 6, and 8:
Max(row[1], row[6], row[8])
MinMin is a mathematical function that returns the minimum value in a group of numericvalues, rows, columns, or cells.
Syntax:
Min(arguments)
where arguments is one or more of the following values:
Chapter 8Mathematical Functions
8-11
Argument Description
numeric A numeric value. For example, Min(10,20,30) returns the value 10.
Numeric values can include decimals and negative values. See Numeric Arguments.
row, column, or cellreference
A pointer to a row, column, or cell within a grid.
function An embedded function.
See Mathematical Functions.
Example:
Return the minimum value in rows 1, 6, and 8:
Min (row[1], row[6], row[8])
PercentofTotalPercentOfTotal is a mathematical function that returns the result of a numeric value,row, column, or cell divided by another numeric value, row, column, or cell which ismultiplied by 100.
Syntax:
PercentOfTotal (arg1,arg2)
where:
• arg1 is a component of the running total (arg2), usually a row or column reference.
• arg2 is the running total relative to arg1, usually a cell reference containing thegrand total.
• arg1 is divided by arg2 with the result multiplied by 100. Arg1 and arg2 are one ormore of the following values:
Argument Description
numeric A numeric value. For example, PercentofTotal(100,20) returnsthe value 500.
Numeric values can include decimals and negative values. See Numeric Arguments.
row, column, or cellreference
A pointer to a row, column, or cell within a grid.
function An embedded function.
See Mathematical Functions.
Examples:
Return the value of 5.
PercentofTotal(20,400)
Divide the value of each cell in column A by the total market value in cell A5, multiplythe result by 100, and display the resulting PercentOfTotal in column B.
Chapter 8Mathematical Functions
8-12
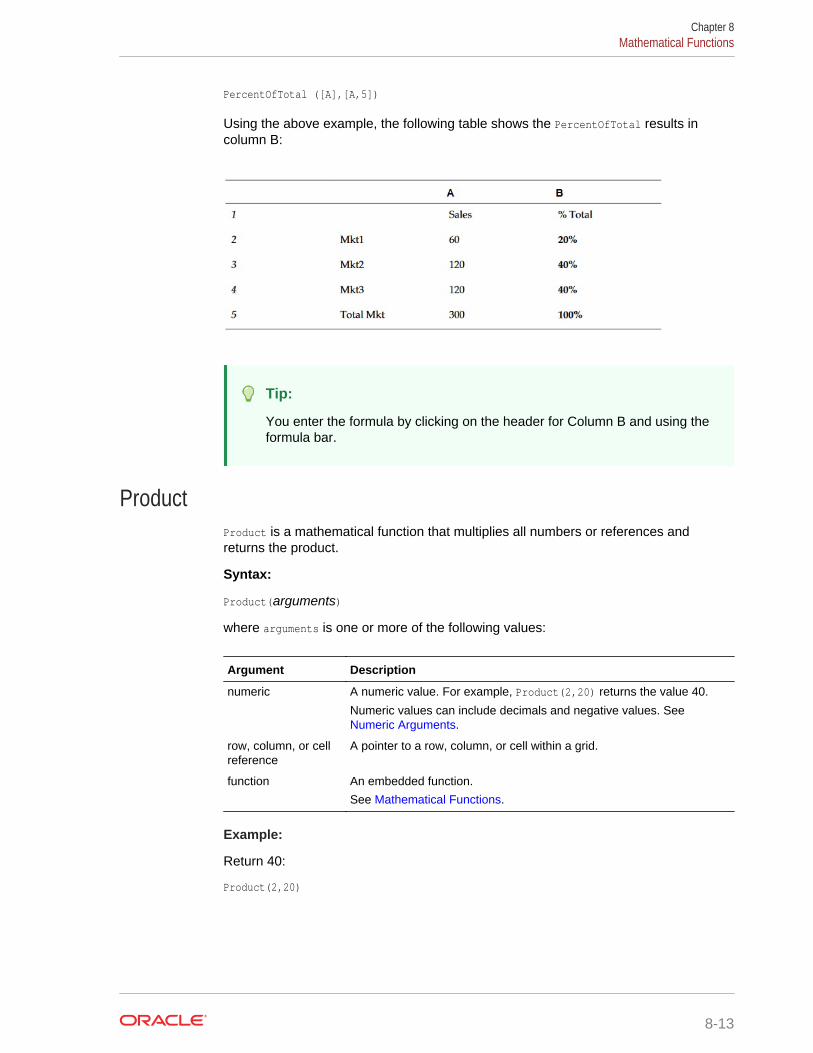
PercentOfTotal ([A],[A,5])
Using the above example, the following table shows the PercentOfTotal results incolumn B:
Tip:
You enter the formula by clicking on the header for Column B and using theformula bar.
ProductProduct is a mathematical function that multiplies all numbers or references andreturns the product.
Syntax:
Product(arguments)
where arguments is one or more of the following values:
Argument Description
numeric A numeric value. For example, Product(2,20) returns the value 40.
Numeric values can include decimals and negative values. See Numeric Arguments.
row, column, or cellreference
A pointer to a row, column, or cell within a grid.
function An embedded function.
See Mathematical Functions.
Example:
Return 40:
Product(2,20)
Chapter 8Mathematical Functions
8-13

RankRank is a financial function that provides a rank value for a value in a specified range.Rank is processed by Financial Reporting and does not depend on the databaseconnection.
Syntax:
Rank([Reference], Order)
Rank([Reference], Order, Unique)
Argument Description
Reference The range of cells, rows, or columns to rank, with letters identifying columnsand numbers identifying rows. For example, specify [A,1:5] to rank the valuesfor rows 1 through 5 in column A.
You can use the .ifNN property with a range of cells to assign numbers to anycells with nonnumeric values so that those cells can be ranked. For example,you can use .ifNN(-1) to assign the value -1 to any cell with a missing value.
Order Indicates the order by which the values are ranked. The lowest value ranked inascending order receives a rank result of 1. The largest value ranked indescending order receives a rank result of 1. The order can be indicated by anyof the following keywords or values:
• Ascending• Descending• Asc• Des• Desc• 1 (the number 1 is the same as Ascending)• 0 (zero is the same as Descending)The keywords are not case-sensitive.
Do not enclose the number or keyword indicating order in quotation marks.
Unique (Optional) A Boolean keyword indicating how to treat equal values in theReference parameter where:
• false (or omitted) — equal values receive the same ranking ; rankedresults may be duplicated
• true — equal values receive a unique ranking; there are no duplicaterankings. Values in the Reference parameter are ranked on a first come,first ranked basis. For example, if values in rows 2 and 5 are equal, thevalue in row 2 is ranked before that of row 5.
Examples:
This formula in column B ranks the values in rows 1 through 5 in column A indescending order:
Rank([A,1:5], descending)
The result might be as follows:
Chapter 8Mathematical Functions
8-14
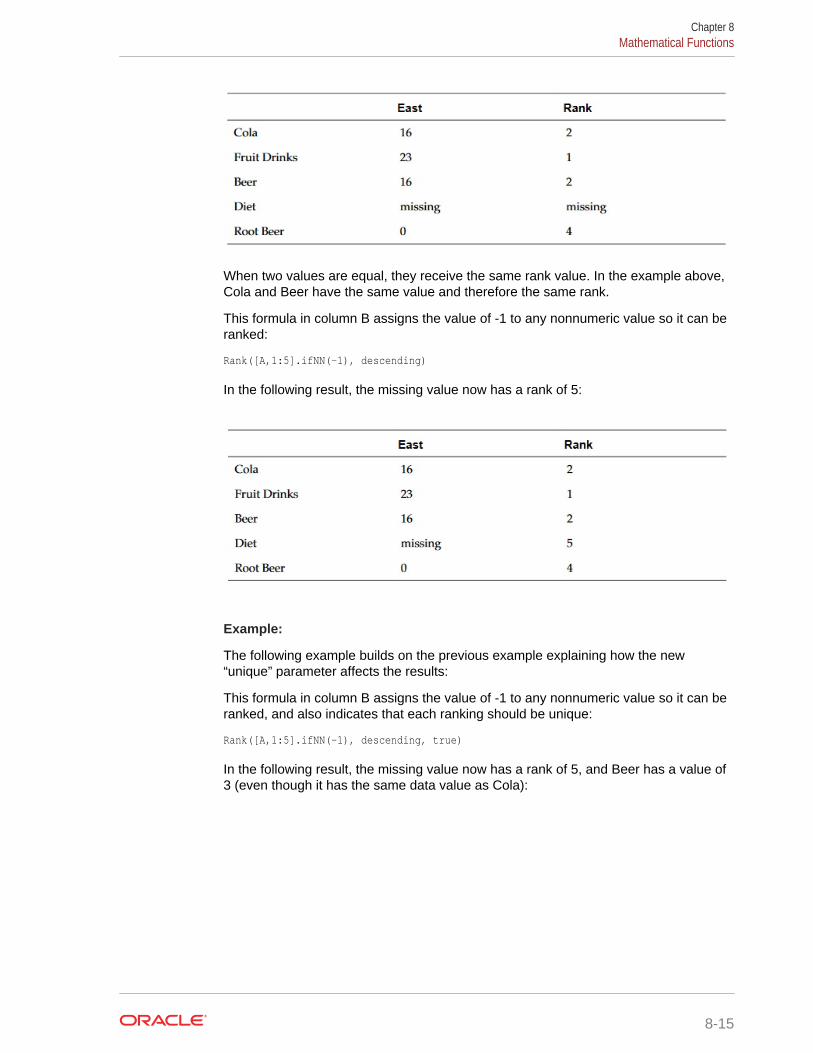
When two values are equal, they receive the same rank value. In the example above,Cola and Beer have the same value and therefore the same rank.
This formula in column B assigns the value of -1 to any nonnumeric value so it can beranked:
Rank([A,1:5].ifNN(-1), descending)
In the following result, the missing value now has a rank of 5:
Example:
The following example builds on the previous example explaining how the new“unique” parameter affects the results:
This formula in column B assigns the value of -1 to any nonnumeric value so it can beranked, and also indicates that each ranking should be unique:
Rank([A,1:5].ifNN(-1), descending, true)
In the following result, the missing value now has a rank of 5, and Beer has a value of3 (even though it has the same data value as Cola):
Chapter 8Mathematical Functions
8-15
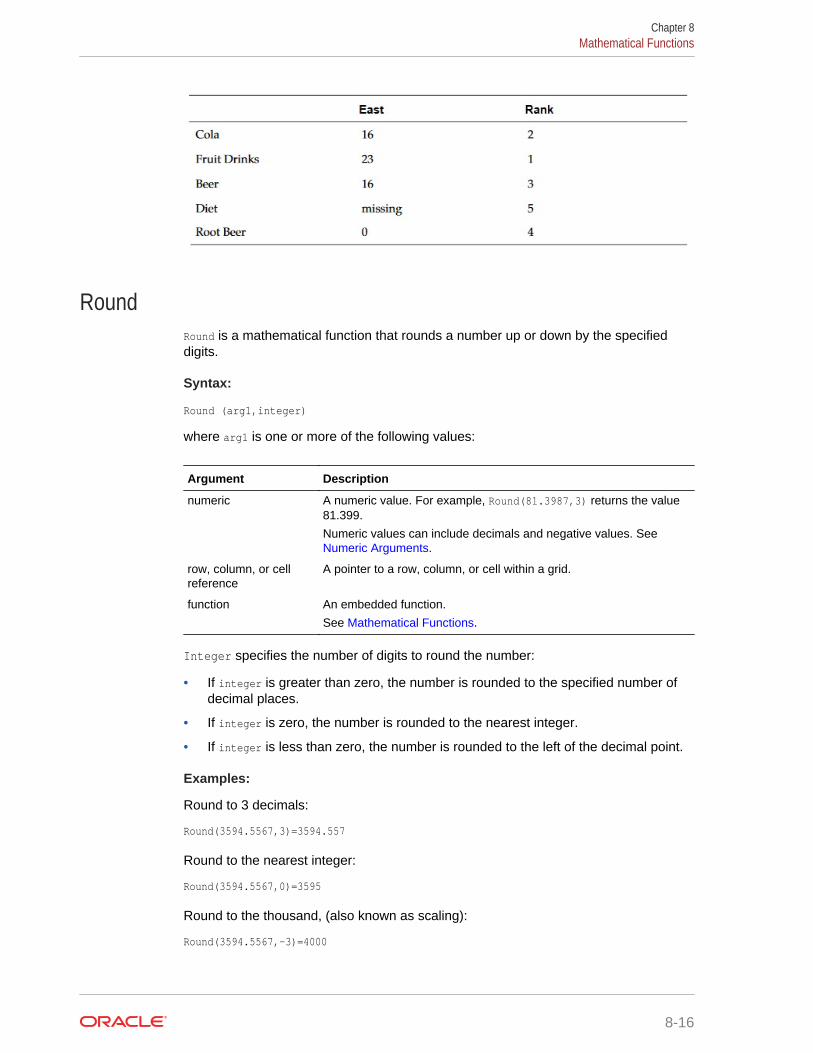
RoundRound is a mathematical function that rounds a number up or down by the specifieddigits.
Syntax:
Round (arg1,integer)
where arg1 is one or more of the following values:
Argument Description
numeric A numeric value. For example, Round(81.3987,3) returns the value81.399.
Numeric values can include decimals and negative values. See Numeric Arguments.
row, column, or cellreference
A pointer to a row, column, or cell within a grid.
function An embedded function.
See Mathematical Functions.
Integer specifies the number of digits to round the number:
• If integer is greater than zero, the number is rounded to the specified number ofdecimal places.
• If integer is zero, the number is rounded to the nearest integer.
• If integer is less than zero, the number is rounded to the left of the decimal point.
Examples:
Round to 3 decimals:
Round(3594.5567,3)=3594.557
Round to the nearest integer:
Round(3594.5567,0)=3595
Round to the thousand, (also known as scaling):
Round(3594.5567,-3)=4000
Chapter 8Mathematical Functions
8-16
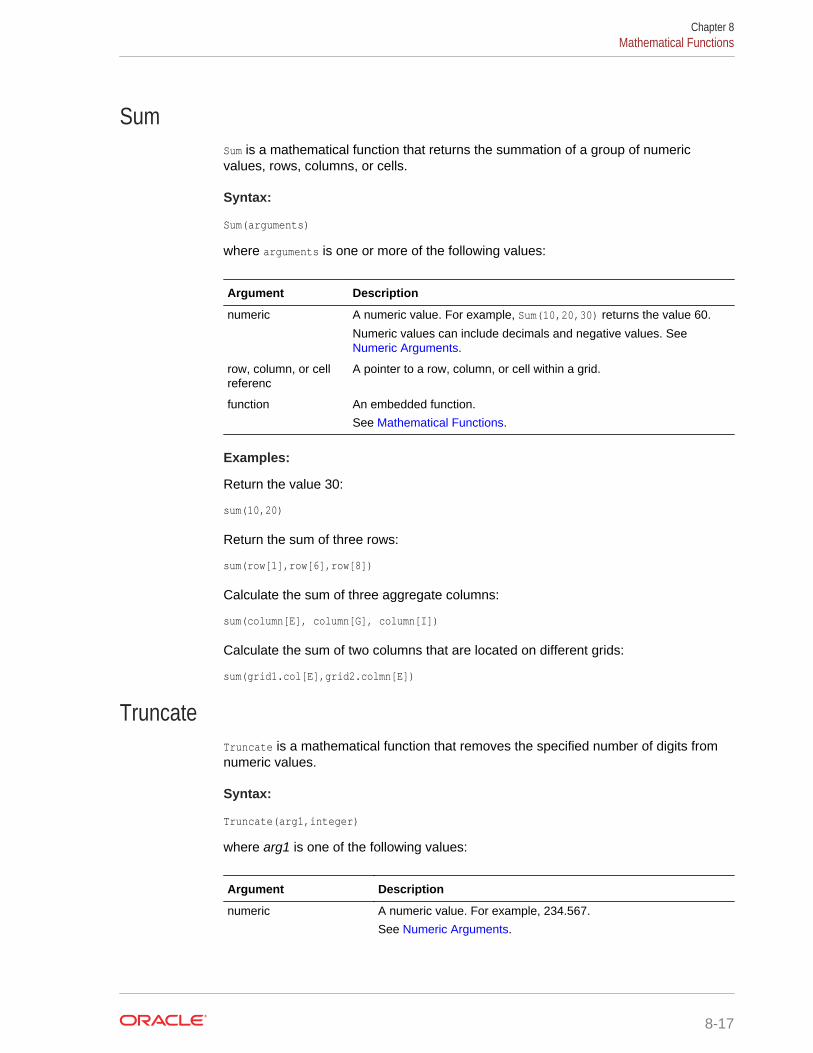
SumSum is a mathematical function that returns the summation of a group of numericvalues, rows, columns, or cells.
Syntax:
Sum(arguments)
where arguments is one or more of the following values:
Argument Description
numeric A numeric value. For example, Sum(10,20,30) returns the value 60.
Numeric values can include decimals and negative values. See Numeric Arguments.
row, column, or cellreferenc
A pointer to a row, column, or cell within a grid.
function An embedded function.
See Mathematical Functions.
Examples:
Return the value 30:
sum(10,20)
Return the sum of three rows:
sum(row[1],row[6],row[8])
Calculate the sum of three aggregate columns:
sum(column[E], column[G], column[I])
Calculate the sum of two columns that are located on different grids:
sum(grid1.col[E],grid2.colmn[E])
TruncateTruncate is a mathematical function that removes the specified number of digits fromnumeric values.
Syntax:
Truncate(arg1,integer)
where arg1 is one of the following values:
Argument Description
numeric A numeric value. For example, 234.567.
See Numeric Arguments.
Chapter 8Mathematical Functions
8-17
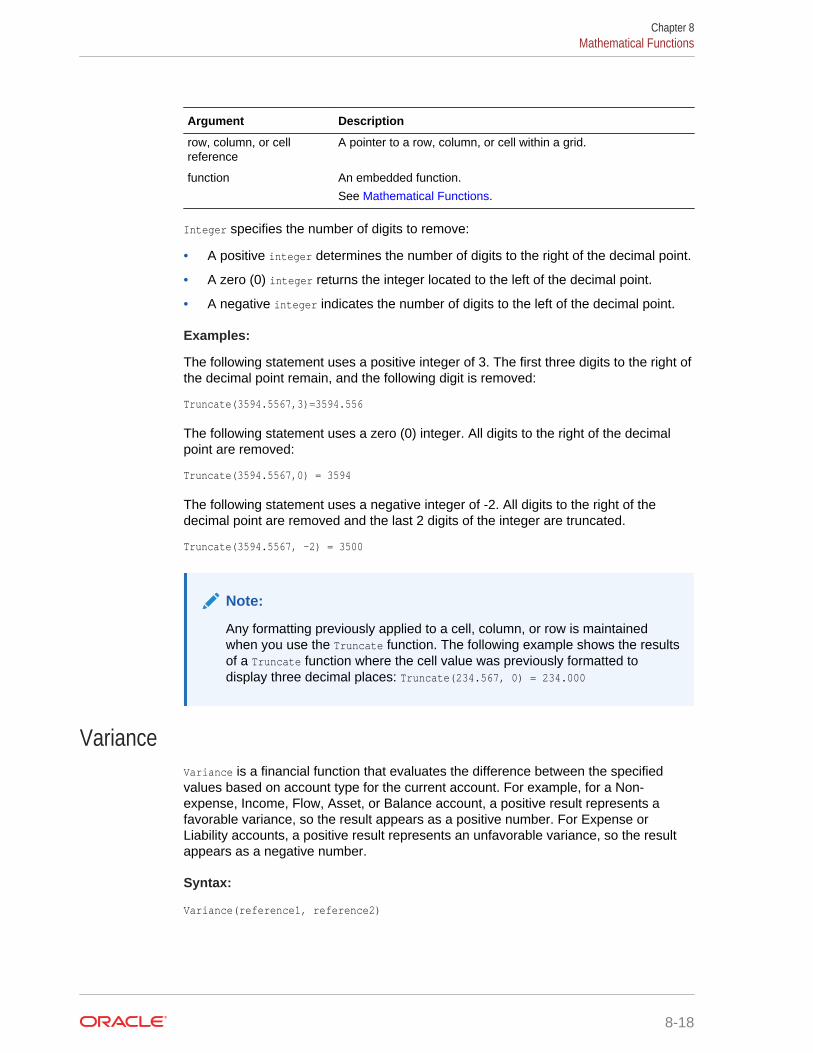
Argument Description
row, column, or cellreference
A pointer to a row, column, or cell within a grid.
function An embedded function.
See Mathematical Functions.
Integer specifies the number of digits to remove:
• A positive integer determines the number of digits to the right of the decimal point.
• A zero (0) integer returns the integer located to the left of the decimal point.
• A negative integer indicates the number of digits to the left of the decimal point.
Examples:
The following statement uses a positive integer of 3. The first three digits to the right ofthe decimal point remain, and the following digit is removed:
Truncate(3594.5567,3)=3594.556
The following statement uses a zero (0) integer. All digits to the right of the decimalpoint are removed:
Truncate(3594.5567,0) = 3594
The following statement uses a negative integer of -2. All digits to the right of thedecimal point are removed and the last 2 digits of the integer are truncated.
Truncate(3594.5567, -2) = 3500
Note:
Any formatting previously applied to a cell, column, or row is maintainedwhen you use the Truncate function. The following example shows the resultsof a Truncate function where the cell value was previously formatted todisplay three decimal places: Truncate(234.567, 0) = 234.000
VarianceVariance is a financial function that evaluates the difference between the specifiedvalues based on account type for the current account. For example, for a Non-expense, Income, Flow, Asset, or Balance account, a positive result represents afavorable variance, so the result appears as a positive number. For Expense orLiability accounts, a positive result represents an unfavorable variance, so the resultappears as a negative number.
Syntax:
Variance(reference1, reference2)
Chapter 8Mathematical Functions
8-18
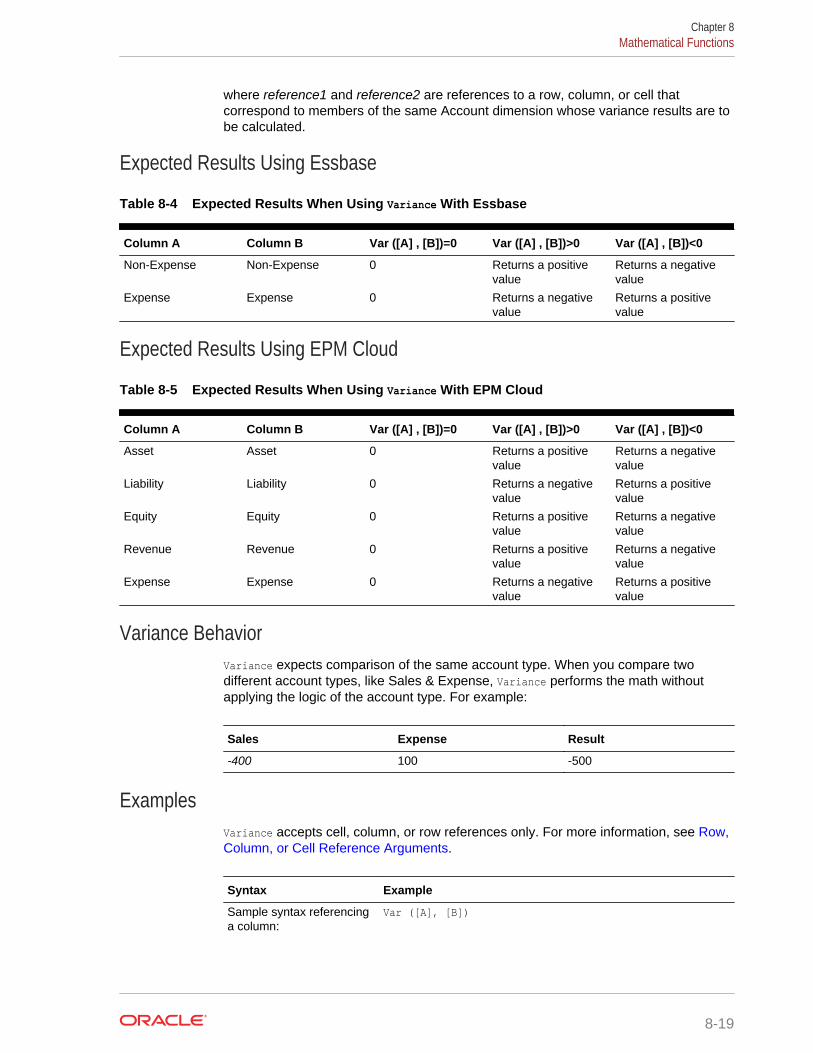
where reference1 and reference2 are references to a row, column, or cell thatcorrespond to members of the same Account dimension whose variance results are tobe calculated.
Expected Results Using Essbase
Table 8-4 Expected Results When Using Variance With Essbase
Column A Column B Var ([A] , [B])=0 Var ([A] , [B])>0 Var ([A] , [B])<0
Non-Expense Non-Expense 0 Returns a positivevalue
Returns a negativevalue
Expense Expense 0 Returns a negativevalue
Returns a positivevalue
Expected Results Using EPM Cloud
Table 8-5 Expected Results When Using Variance With EPM Cloud
Column A Column B Var ([A] , [B])=0 Var ([A] , [B])>0 Var ([A] , [B])<0
Asset Asset 0 Returns a positivevalue
Returns a negativevalue
Liability Liability 0 Returns a negativevalue
Returns a positivevalue
Equity Equity 0 Returns a positivevalue
Returns a negativevalue
Revenue Revenue 0 Returns a positivevalue
Returns a negativevalue
Expense Expense 0 Returns a negativevalue
Returns a positivevalue
Variance BehaviorVariance expects comparison of the same account type. When you compare twodifferent account types, like Sales & Expense, Variance performs the math withoutapplying the logic of the account type. For example:
Sales Expense Result
-400 100 -500
ExamplesVariance accepts cell, column, or row references only. For more information, see Row,Column, or Cell Reference Arguments.
Syntax Example
Sample syntax referencinga column:
Var ([A], [B])
Chapter 8Mathematical Functions
8-19
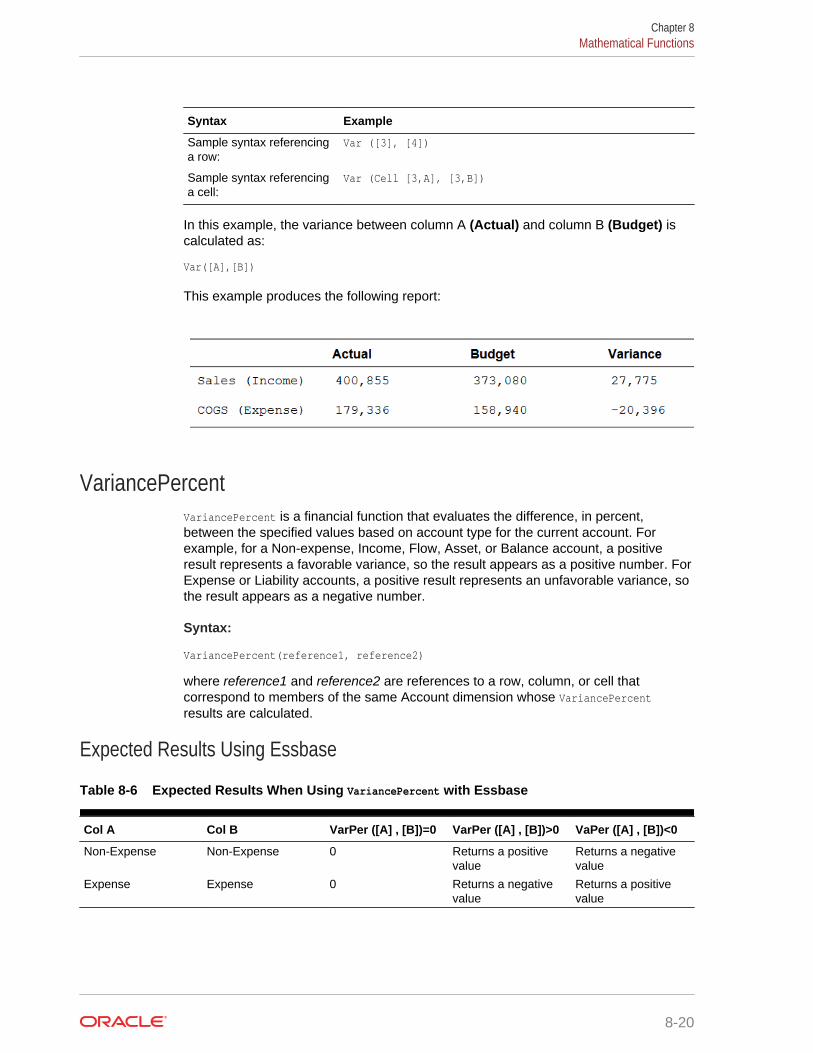
Syntax Example
Sample syntax referencinga row:
Var ([3], [4])
Sample syntax referencinga cell:
Var (Cell [3,A], [3,B])
In this example, the variance between column A (Actual) and column B (Budget) iscalculated as:
Var([A],[B])
This example produces the following report:
VariancePercentVariancePercent is a financial function that evaluates the difference, in percent,between the specified values based on account type for the current account. Forexample, for a Non-expense, Income, Flow, Asset, or Balance account, a positiveresult represents a favorable variance, so the result appears as a positive number. ForExpense or Liability accounts, a positive result represents an unfavorable variance, sothe result appears as a negative number.
Syntax:
VariancePercent(reference1, reference2)
where reference1 and reference2 are references to a row, column, or cell thatcorrespond to members of the same Account dimension whose VariancePercentresults are calculated.
Expected Results Using Essbase
Table 8-6 Expected Results When Using VariancePercent with Essbase
Col A Col B VarPer ([A] , [B])=0 VarPer ([A] , [B])>0 VaPer ([A] , [B])<0
Non-Expense Non-Expense 0 Returns a positivevalue
Returns a negativevalue
Expense Expense 0 Returns a negativevalue
Returns a positivevalue
Chapter 8Mathematical Functions
8-20
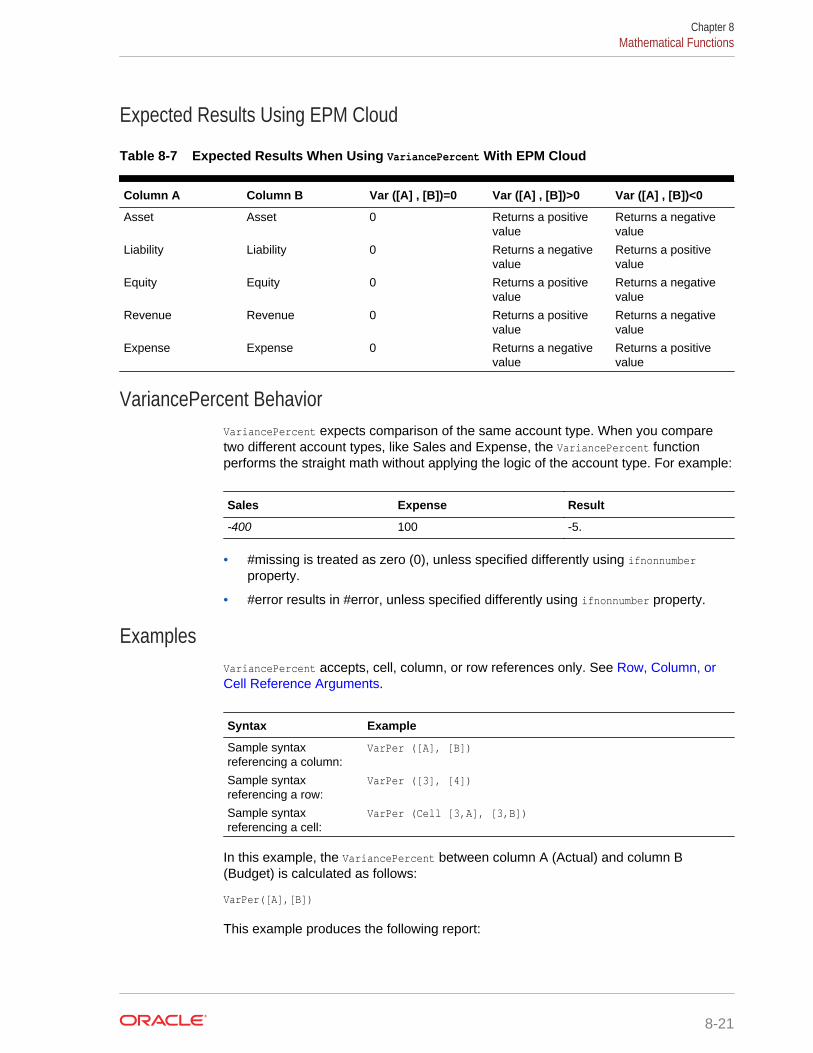
Expected Results Using EPM Cloud
Table 8-7 Expected Results When Using VariancePercent With EPM Cloud
Column A Column B Var ([A] , [B])=0 Var ([A] , [B])>0 Var ([A] , [B])<0
Asset Asset 0 Returns a positivevalue
Returns a negativevalue
Liability Liability 0 Returns a negativevalue
Returns a positivevalue
Equity Equity 0 Returns a positivevalue
Returns a negativevalue
Revenue Revenue 0 Returns a positivevalue
Returns a negativevalue
Expense Expense 0 Returns a negativevalue
Returns a positivevalue
VariancePercent BehaviorVariancePercent expects comparison of the same account type. When you comparetwo different account types, like Sales and Expense, the VariancePercent functionperforms the straight math without applying the logic of the account type. For example:
Sales Expense Result
-400 100 -5.
• #missing is treated as zero (0), unless specified differently using ifnonnumberproperty.
• #error results in #error, unless specified differently using ifnonnumber property.
ExamplesVariancePercent accepts, cell, column, or row references only. See Row, Column, orCell Reference Arguments.
Syntax Example
Sample syntaxreferencing a column:
VarPer ([A], [B])
Sample syntaxreferencing a row:
VarPer ([3], [4])
Sample syntaxreferencing a cell:
VarPer (Cell [3,A], [3,B])
In this example, the VariancePercent between column A (Actual) and column B(Budget) is calculated as follows:
VarPer([A],[B])
This example produces the following report:
Chapter 8Mathematical Functions
8-21
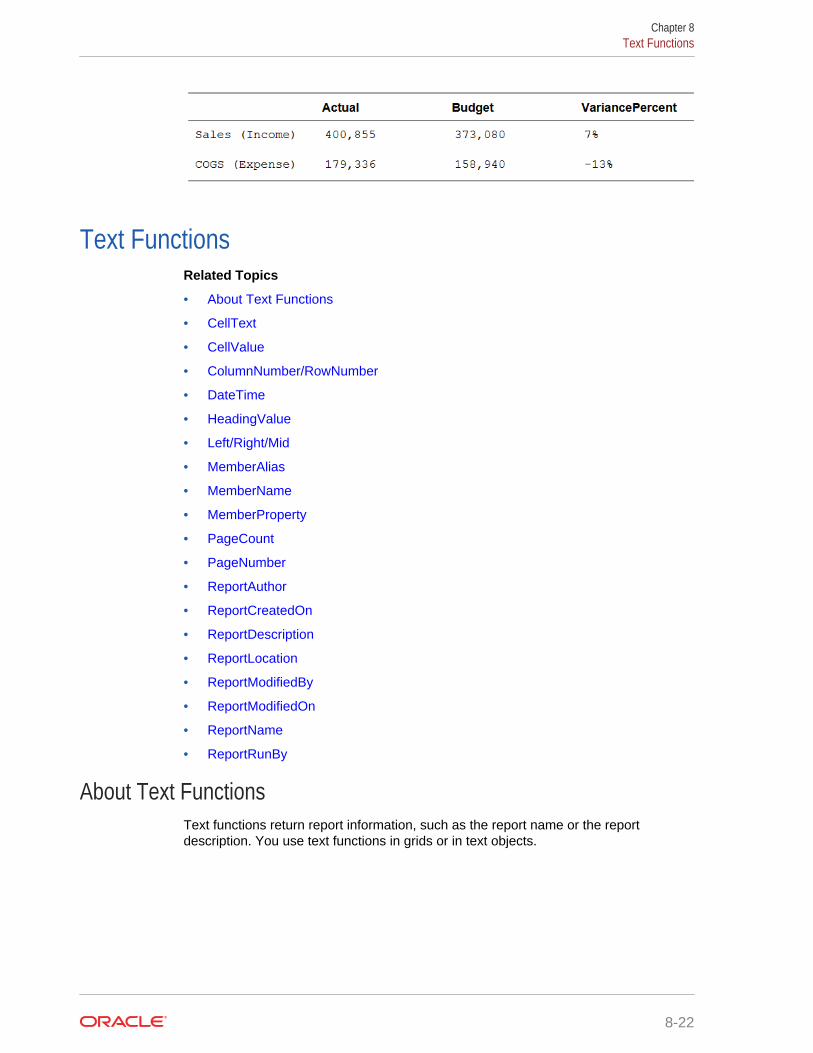
Text FunctionsRelated Topics
• About Text Functions
• CellText
• CellValue
• ColumnNumber/RowNumber
• DateTime
• HeadingValue
• Left/Right/Mid
• MemberAlias
• MemberName
• MemberProperty
• PageCount
• PageNumber
• ReportAuthor
• ReportCreatedOn
• ReportDescription
• ReportLocation
• ReportModifiedBy
• ReportModifiedOn
• ReportName
• ReportRunBy
About Text FunctionsText functions return report information, such as the report name or the reportdescription. You use text functions in grids or in text objects.
Chapter 8Text Functions
8-22

Text Function Considerations
Note:
If you don’t explicitly specify a row or column in a text function that supportsrow or column, then the current row or column is used by default.
• You can use spaces between arguments.
• All arguments are enclosed in quotes, except for numeric arguments.
For example, the parameter “NYC, New York” in the function MemberName("Grid1",NYC, New York) should be restated as MemberName("Grid1", "NYC, New York").
• Arguments related to date formatting are case-sensitive.
• Text functions can be entered in a text box, row, or column.
• To apply text functions to a grid, create a text row or column, or a heading cell,and then insert the text function.
• When you insert a text function into a text row or column, by default the textfunction applies to the current grid. Therefore, the text function builder does notinclude a selection for the Grid parameter. If the text function refers to another gridin the report, specify the Grid parameter after you insert the function.
List of Functions in the User Interface
When you launch the function builder, a list of functions that are appropriate based onthe context of that function is displayed. While any text function is allowed in either atext object or grid object text or heading cell (with the exception of RowNumber/ColumnNumber, as described in Validation Errors), to provide guidance about whichfunctions are most relevant for a given context, we show one of the following filteredlists:
• Grid text cell: CellValue, CellText, HeadingValue, MemberName, MemberAlias,MemberProperty, RowNumber, ColumnNumber
• Text Object in report body: CellValue, CellText, DateTime, MemberName,MemberAlias, MemberProperty
• Text Object in header/footer: DateTime, CellValue, CellText, MemberName,MemberAlias, MemberProperty, PageNumber, PageCount, ReportAuthor, ReportCreatedOn,ReportModifiedBy, ReportModifiedOn, ReportName, ReportDescription, ReportLocation,ReportRunBy
Parameters for Text FunctionsThe following table describes the parameters that you can use in text functions. Not allparameters can be used in all functions. Refer to the section about a specific functionto see which parameters apply to that function.
Chapter 8Text Functions
8-23

Table 8-8 Text Function Parameters
Parameter Definition
Grid The name of the grid. If the function occurs within a grid, or if the functionoccurs within a text object and there is only a single grid in the report, thegrid parameter is optional. If there is more then one grid in the report, thegrid parameter is required when the function occurs in a text object and isoptional for text cells in a grid where the "current" grid is assumed if notspecified.
Row/Column Either the row number or the column reference (letter) on the grid. The row/column parameter is optional if the function occurs within a grid. If notprovided, the "current" row or column is assumed based on the axis of thegiven dimension. If the dimension occurs on the POV, the row/columnparameter is ignored. If the function occurs in a text object, the row/columnparameter is required unless the given dimension occurs on the POV
Row The row number on the grid. It is optional for the CellText function. It isrequired for the CellValue function. For the CellText function, if you donot specify the row, the cell text for all rows are returned. The rowparameter value must be between 1 and row-count.
Column The column number on the grid. It is optional for the CellText function. It isrequired for the CellValue function. For the CellText function, if you donot specify the column, the cell text for all columns are returned. Thecolumn parameter value is a letter sequence corresponding the availablecolumns (for example: A to AC in a grid with 29 columns).
Dimension The dimension name. The dimension parameter is required. If thedimension refers to a dimension which is on the POV, the Row/Columnparameters are ignored.
DateFormat Format of a date field. The date-format parameter is optional. If you do notspecify the format, the date-format from the user preference is used.
TimeFormat Format of a time field. The time-format parameter is optional. If you do notspecify the format, the time-format from the user preference is used.
Property The value of the property parameter is specific to the underlyingdatasource. The property parameter is required. Commonly used propertyvalues are "Level", "Gen" or "Generation", "AccountType", "IsExpense",and "UDA".) For dimensions which have member-attributes, the attributename ( (for example, "Pkg Type" )can be used as a member property. Fordata sources which have multiple alias tables, an alias table name can beused as a member property.You can also use an alias table name for aproperty value to return a different alias from the one specified on the userPOV (for example, the "LongNames" property for the alias table with thename "LongNames").
SkipEmpty An optional true/false parameter. When the parameter is true, any text orseparator rows/columns would be skipped in the given row or columnnumbering.For example, if rows 1, 3, and 5 are data rows and row 2 and 4are text or separator rows, the RowNumber(SkipEmpty) function will return avalue of 1, 3, and 5 for the data rows and no value for rows 2 and 4. TheRowNumber() function (with no skip-empty parameter) would return a valueof 1, 2, 3, 4, and 5 for each respective row.
If you do not specify this parameter, the default value is False.
Chapter 8Text Functions
8-24

Table 8-8 (Cont.) Text Function Parameters
Parameter Definition
Qualified An optional true/false parameter. When the parameter is true, the membername shown is the fully-qualified member name. In Essbase outlines whichallow non-unique member names, a member which is not unique will havea unique name which includes enough ancestor members to make thename unique. For example if a member called Coke is a child of a membercalled Colas and also a child of a member called Sodas, then the memberunique name would be either Colas.Coke or [Sodas].[Coke].If you do not specify this parameter, the default value is False.
CellTextCellText retrieves the textual content attached to a cell from the data source. Thisapplies to all data sources, except Oracle Enterprise Performance Reporting Cloudmodel.
The row and column arguments apply to the intersection in a grid that contains thelinked text or note.
Syntax:
CellText("Grid", Row, Column)
Note:
See Parameters for Text Functions for parameter definitions.
If a row parameter is not included, the cell text for all rows will be returned. If a columnparameter is not included, the cell text for all columns will be returned. If both the rowand column parameters are not included, the cell text for all cells in the grid will bereturned.
Example:
Create a report with linked text in the cell that is in row 21, column B of a grid.
CellText("mygrid",21,B)
CellValueCellValue is a text function that returns a data value from cell in a grid.
Syntax:
CellValue("GridName", Row, Column)
Chapter 8Text Functions
8-25

Note:
See Parameters for Text Functions for parameter definitions.
Consideration when using CellValue:
If the row or column parameters refer to a segment that expands, all of the cells arereturned, separated by commas. You can refer to any expanded cell using the “range”notation.
Example:
Set up a grid to show the net income for several quarters, and display this value in atext box that contains an executive summary of the report.
The grand total for the period was CellValue("mygrid",21,B).
The report is created with the value in the cell that is in row 21, column B of a grid.
ColumnNumber/RowNumberColumnNumber or RowNumber are functions that return the column number or row numberin a grid.
Syntax:
ColumnNumber(SkipEmpty)
Note:
See Parameters for Text Functions for parameter definitions.
Example:
Returns the column number for data and columns, but not text or separator columns.
ColumnNumber(true)
Returns the row number for all rows (data, formula, text and/or separator).
RowNumber()
Validation Errors
A validation error will occur if the following situations occur in the report:
• The RowNumber and ColumnNumber functions are not allowed in text boxes.
• The RowNumber function cannot be used in column heading cells, and theColumnNumber function cannot be used in row heading cells.
• The RowNumber and ColumnNumber functions cannot be used in the corner cells(upper left corner of the grid).
Chapter 8Text Functions
8-26
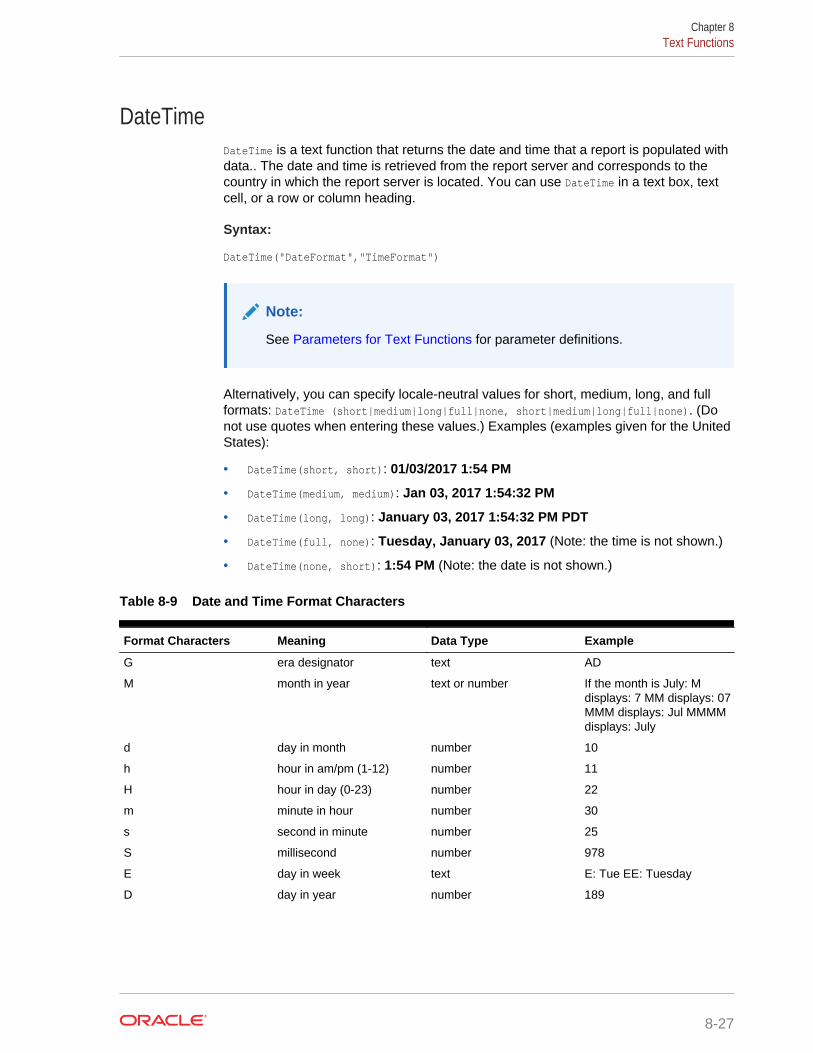
DateTimeDateTime is a text function that returns the date and time that a report is populated withdata.. The date and time is retrieved from the report server and corresponds to thecountry in which the report server is located. You can use DateTime in a text box, textcell, or a row or column heading.
Syntax:
DateTime("DateFormat","TimeFormat")
Note:
See Parameters for Text Functions for parameter definitions.
Alternatively, you can specify locale-neutral values for short, medium, long, and fullformats: DateTime (short|medium|long|full|none, short|medium|long|full|none). (Donot use quotes when entering these values.) Examples (examples given for the UnitedStates):
• DateTime(short, short): 01/03/2017 1:54 PM
• DateTime(medium, medium): Jan 03, 2017 1:54:32 PM
• DateTime(long, long): January 03, 2017 1:54:32 PM PDT
• DateTime(full, none): Tuesday, January 03, 2017 (Note: the time is not shown.)
• DateTime(none, short): 1:54 PM (Note: the date is not shown.)
Table 8-9 Date and Time Format Characters
Format Characters Meaning Data Type Example
G era designator text AD
M month in year text or number If the month is July: Mdisplays: 7 MM displays: 07MMM displays: Jul MMMMdisplays: July
d day in month number 10
h hour in am/pm (1-12) number 11
H hour in day (0-23) number 22
m minute in hour number 30
s second in minute number 25
S millisecond number 978
E day in week text E: Tue EE: Tuesday
D day in year number 189
Chapter 8Text Functions
8-27

Table 8-9 (Cont.) Date and Time Format Characters
Format Characters Meaning Data Type Example
F day of week in month number Date(“dd-MMM-yy ‘is the’ F'th ' E 'of' ‘MMM”) displays:
24-Dec-02 is the 4th Tue ofDec
w week in year number 27
W week in month number 2
a am/pm marker text PM
k hour in day (1-24) number 23
K hour in am/pm (0-11) number In the United States, if thetime is 3:37 PM: 3
z time zone text Pacific Standard Time
y year number 2017,02
' literal text text Date(“ D’the day of ’yyyy”)displays:105th day of 2017
' ' two single quotes toproduce one single quote
text Date(“k:mm ‘O’’Clock’ a”)displays: 6:15 O’Clock PM
Use 2 single quotationmarks to produce a singlequote or an apostrophe asin O’Clock (O’’Clock).
Considerations when using format characters:
• The number or count of format characters determines the format:
– For text, less than four pattern letters means use a short or abbreviated form,if it exists.
– Four or more pattern letters means use full form.
– M or MM means use the month as a number.
– MMM means use the three-letter abbreviation for the month.
– MMMM means use the full name of the month.
For example, if the date is April 24:
Date("dd-M-yy") displays 24-4-17
Date("dd-MM-yy”) displays 24-04-17
Date("dd-MMM-yy") displays 24-Apr-17
Date("dd-MMMM-yy") displays 24-April-17
• For numbers, the number of pattern letters is the minimum number of digits.Shorter numbers are padded with zeros. Year is a special case. If you use “yy”,the last two digits of the year are displayed, but if you use “yyyy,” the four-digityear is displayed.
For example, if the month is February:
Date("MM-yyyy") displays 02-2017
Chapter 8Text Functions
8-28
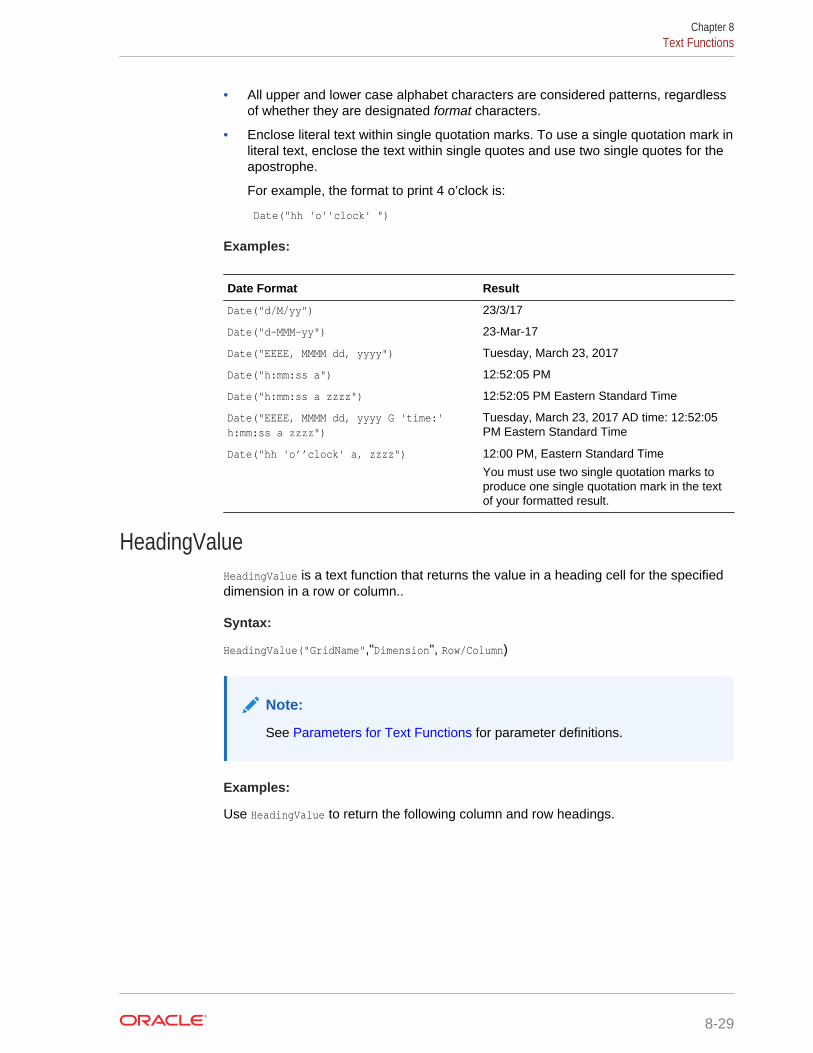
• All upper and lower case alphabet characters are considered patterns, regardlessof whether they are designated format characters.
• Enclose literal text within single quotation marks. To use a single quotation mark inliteral text, enclose the text within single quotes and use two single quotes for theapostrophe.
For example, the format to print 4 o’clock is:
Date("hh 'o''clock' ")
Examples:
Date Format Result
Date("d/M/yy") 23/3/17
Date("d-MMM-yy") 23-Mar-17
Date("EEEE, MMMM dd, yyyy") Tuesday, March 23, 2017
Date("h:mm:ss a") 12:52:05 PM
Date("h:mm:ss a zzzz") 12:52:05 PM Eastern Standard Time
Date("EEEE, MMMM dd, yyyy G 'time:'h:mm:ss a zzzz")
Tuesday, March 23, 2017 AD time: 12:52:05PM Eastern Standard Time
Date("hh 'o’’clock' a, zzzz") 12:00 PM, Eastern Standard Time
You must use two single quotation marks toproduce one single quotation mark in the textof your formatted result.
HeadingValueHeadingValue is a text function that returns the value in a heading cell for the specifieddimension in a row or column..
Syntax:
HeadingValue("GridName","Dimension", Row/Column)
Note:
See Parameters for Text Functions for parameter definitions.
Examples:
Use HeadingValue to return the following column and row headings.
Chapter 8Text Functions
8-29
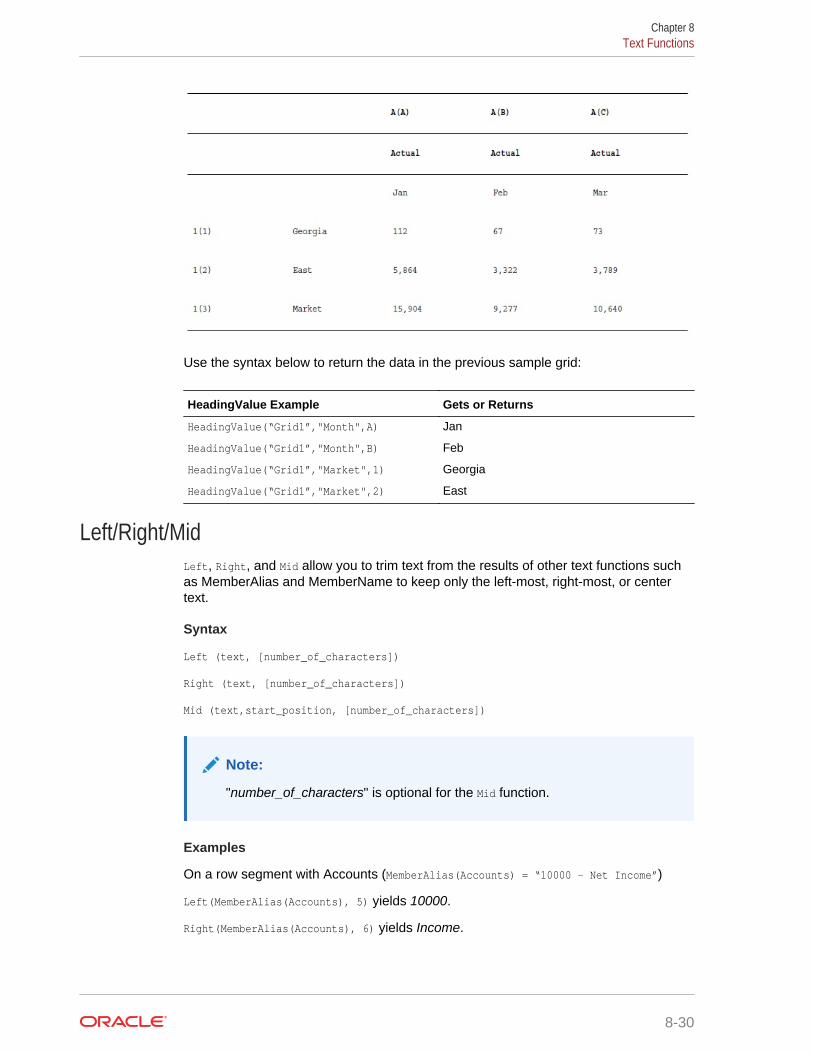
Use the syntax below to return the data in the previous sample grid:
HeadingValue Example Gets or Returns
HeadingValue(“Grid1”,"Month",A) Jan
HeadingValue(“Grid1”,"Month",B) Feb
HeadingValue(“Grid1”,"Market",1) Georgia
HeadingValue(“Grid1”,"Market",2) East
Left/Right/MidLeft, Right, and Mid allow you to trim text from the results of other text functions suchas MemberAlias and MemberName to keep only the left-most, right-most, or centertext.
Syntax
Left (text, [number_of_characters])
Right (text, [number_of_characters])
Mid (text,start_position, [number_of_characters])
Note:
"number_of_characters" is optional for the Mid function.
Examples
On a row segment with Accounts (MemberAlias(Accounts) = “10000 - Net Income”)
Left(MemberAlias(Accounts), 5) yields 10000.
Right(MemberAlias(Accounts), 6) yields Income.
Chapter 8Text Functions
8-30

Mid(MemberAlias(Accounts), 9) yields Net Income. (In this example, 9 is the startingposition for the Mid function.)
MemberAliasMemberAlias is a text function. Based on the syntax used, it returns the alias of themember assigned to a dimension in the row, column, or Point of View (POV).
Syntax
MemberAlias("Grid", "Dimension", Row/Col, Qualified)
• The following syntax returns the alias of a row or column heading. The syntax canbe deployed from any heading cell, text cell, or text box object and can referenceany grid in a current report.
MemberAlias ("Dimension")
• The following syntax returns the alias of a POV. The syntax can be deployed fromany text cell or text box object and can reference any grid and corresponding POVin a current report.
MemberAlias ("Grid", "Dimension")
Note:
See Parameters for Text Functions for parameter definitions.
Examples:
Yield the alias Diet Root Beer, which is the alias that is assigned to the Productdimension in Grid1, column A:
MemberAlias("Grid1", "Product", A)
Yield the alias for the Year dimension. The syntax is placed on the grid’s customheading:
MemberAlias("Year")
Yield the alias for the Scenario dimension for the POV associated with Grid1:
MemberAlias("Grid1", "Scenario")
MemberNameMemberName returns the name of the member assigned to a dimension in the grid row orcolumn.
Syntax:
MemberName("Grid", "Dimension", Row/Col, Qualified)
• The following syntax returns the name of a row or column heading. The syntax canbe deployed from any heading cell, text cell, or text box object and can referenceany grid in a current report.
Chapter 8Text Functions
8-31
MemberName ("Dimension")
• The following syntax returns the name of a POV. The syntax can be deployed fromany text cell or text box object and can reference any grid and corresponding POVin a current report.
MemberName ("Grid", "Dimension")
Note:
See Parameters for Text Functions for parameter definitions.
Examples:
Return the name assigned to the Product dimension in Grid1, column A:
MemberName("Grid1", "Product", A)
Return the name for the Year dimension. The syntax is placed on the grid’s customheading:
MemberName(“Year”)
Return the name for the Scenario dimension for the POV associated with Grid1:
MemberName("Grid1", "Scenario")
MemberPropertyMemberProperty returns the member property value of a dimension member in the row,column or in a text box, page, or Point of View (POV). You can use this function todisplay a member property in a text row or column or in a text box.
Syntax:
MemberProperty("Grid", "Dimension", Row/Col, "Property")
Property can be any of the following:
• attribute dimensions ( for example, “Pkg Type”) – associated attribute dimensionmember
• UDA - User-defined attributes
• Generation
• Level
• IsExpense - a true/false field that signifies if an account type is an expense type ornot
• AccountType - Expense or Non-Expense for Essbase data sources; or Revenue,Expense, Asset, Liability, Equity, or Non-Expense for other EPM Cloud datasources
• The following syntax returns the member property in a row heading or columnheading. The syntax can be deployed from any row or column heading in a gridthat is designated as a custom heading.
Chapter 8Text Functions
8-32
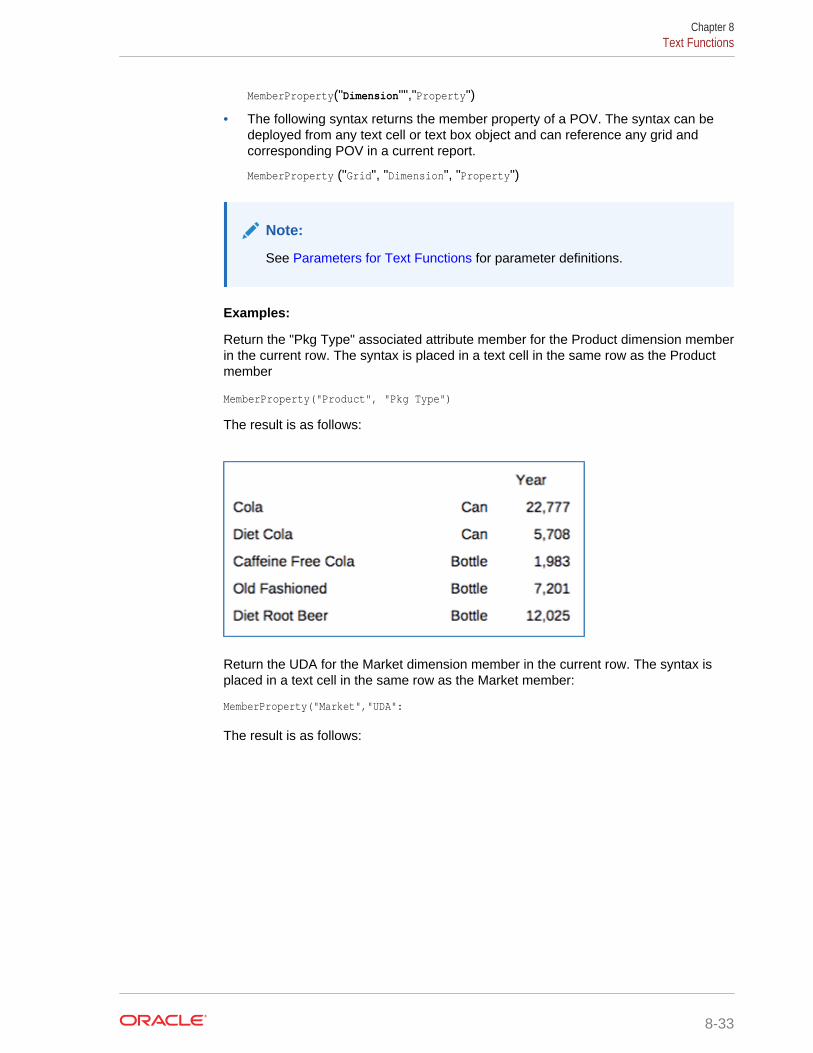
MemberProperty("Dimension"","Property")
• The following syntax returns the member property of a POV. The syntax can bedeployed from any text cell or text box object and can reference any grid andcorresponding POV in a current report.
MemberProperty ("Grid", "Dimension", "Property")
Note:
See Parameters for Text Functions for parameter definitions.
Examples:
Return the "Pkg Type" associated attribute member for the Product dimension memberin the current row. The syntax is placed in a text cell in the same row as the Productmember
MemberProperty("Product", "Pkg Type")
The result is as follows:
Return the UDA for the Market dimension member in the current row. The syntax isplaced in a text cell in the same row as the Market member:
MemberProperty("Market","UDA":
The result is as follows:
Chapter 8Text Functions
8-33

Return the Generation, Level and IsExpense properties for a Measures member in thecurrent row. The syntax is placed in text cells in the same row as the Measuresmember:
MemberProperty("Measures", "Generation")
MemberProperty("Measures", "Level")
MemberProperty("Measures", "IsExpense")
Note:
If you use MemberProperty in a grid cell but you do not specify a row orcolumn, the current row or column is used by default.
PageCountPageCount returns the total number of pages in report that is previewed in PDF. Usethis function in a text object.
Syntax:
PageCount()
Chapter 8Text Functions
8-34

Example:
If the current page count is 6, yields: "The total number of pages is: 6".
The total number of pages is: PageCount().
Note:
PageCount works for reports that are previewed in PDF only. HTML reports donot have multiple pages, so the PageCount returned will be: 1.
PageNumberPageNumber returns the current page number of a report previewed in PDF. Use thisfunction in a text object.
Syntax:
PageNumber()
Example:
If the current page is eight, yield: Page 8.
Page PageNumber()
Note:
PageNumber works for reports previewed in PDF only. HTML reports do nothave multiple pages, so the PageNumber returned will be: 1.
ReportAuthorReportAuthor returns the user name of the person who created the report. Use thisfunction in a text box, text cell, row, or column heading.
Syntax:
ReportAuthor()
Example:
Return Bob Johnson, if the user name of the person who created the report is BobJohnson:
ReportAuthor()
Chapter 8Text Functions
8-35
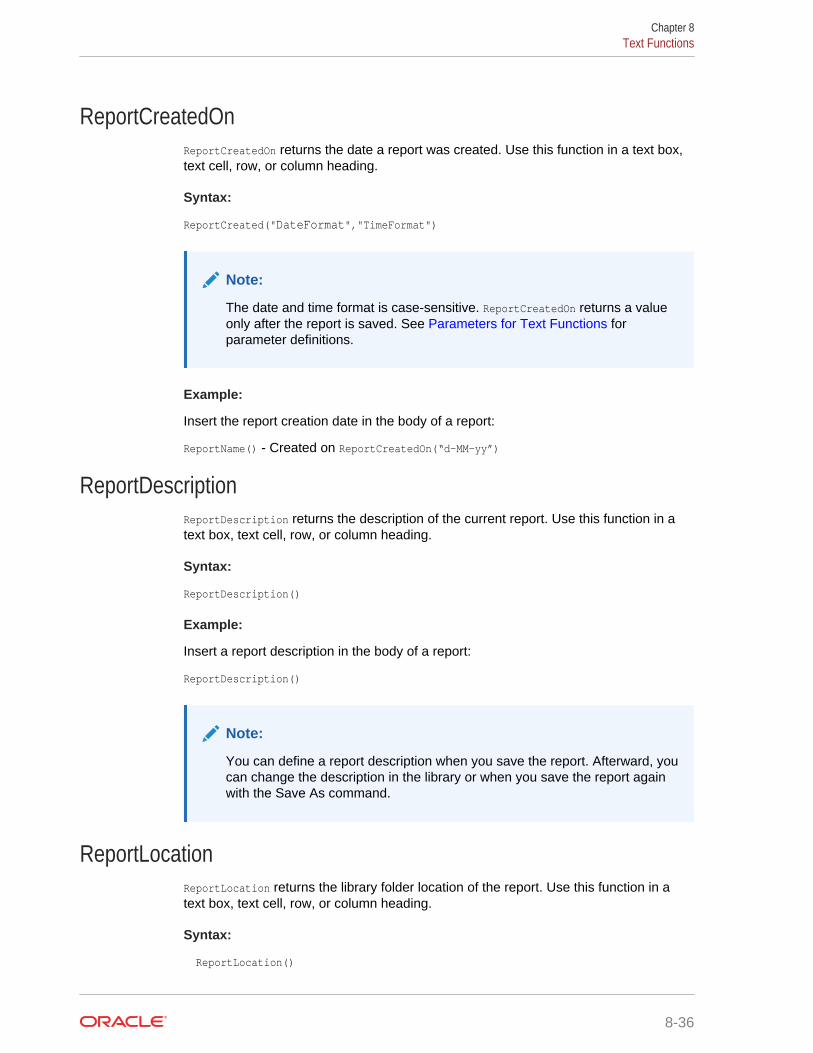
ReportCreatedOnReportCreatedOn returns the date a report was created. Use this function in a text box,text cell, row, or column heading.
Syntax:
ReportCreated("DateFormat","TimeFormat")
Note:
The date and time format is case-sensitive. ReportCreatedOn returns a valueonly after the report is saved. See Parameters for Text Functions forparameter definitions.
Example:
Insert the report creation date in the body of a report:
ReportName() - Created on ReportCreatedOn(“d-MM-yy”)
ReportDescriptionReportDescription returns the description of the current report. Use this function in atext box, text cell, row, or column heading.
Syntax:
ReportDescription()
Example:
Insert a report description in the body of a report:
ReportDescription()
Note:
You can define a report description when you save the report. Afterward, youcan change the description in the library or when you save the report againwith the Save As command.
ReportLocationReportLocation returns the library folder location of the report. Use this function in atext box, text cell, row, or column heading.
Syntax:
ReportLocation()
Chapter 8Text Functions
8-36
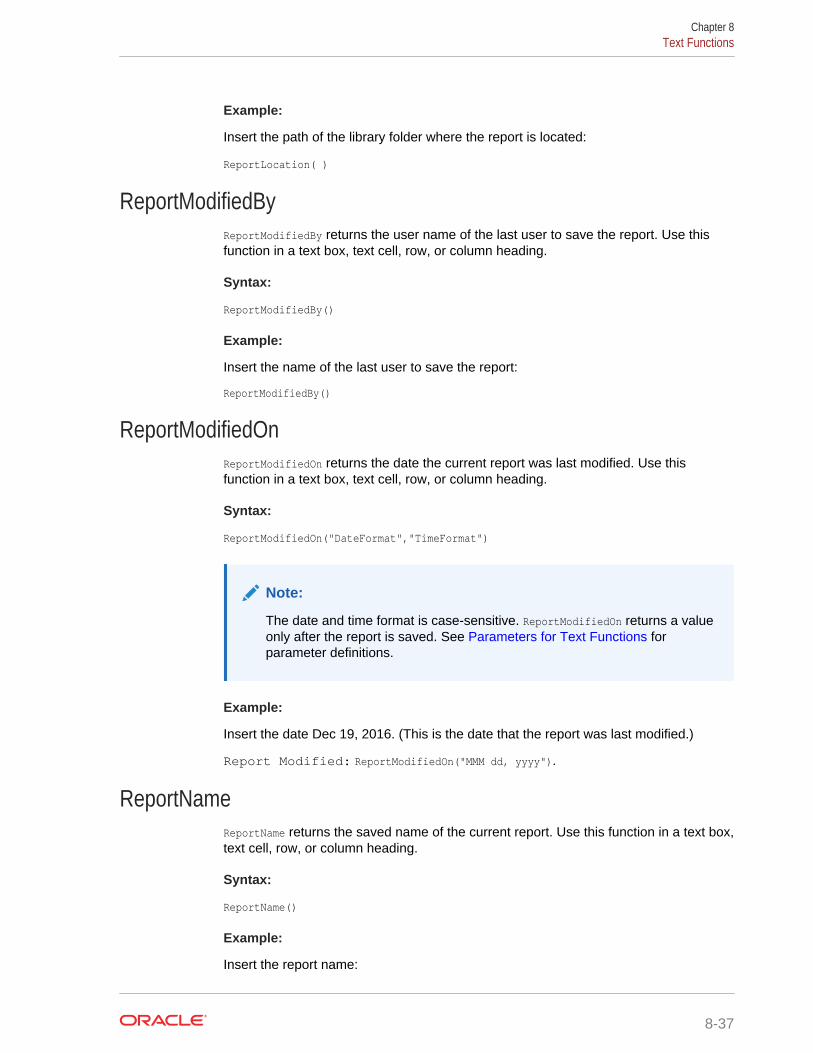
Example:
Insert the path of the library folder where the report is located:
ReportLocation( )
ReportModifiedByReportModifiedBy returns the user name of the last user to save the report. Use thisfunction in a text box, text cell, row, or column heading.
Syntax:
ReportModifiedBy()
Example:
Insert the name of the last user to save the report:
ReportModifiedBy()
ReportModifiedOnReportModifiedOn returns the date the current report was last modified. Use thisfunction in a text box, text cell, row, or column heading.
Syntax:
ReportModifiedOn("DateFormat","TimeFormat")
Note:
The date and time format is case-sensitive. ReportModifiedOn returns a valueonly after the report is saved. See Parameters for Text Functions forparameter definitions.
Example:
Insert the date Dec 19, 2016. (This is the date that the report was last modified.)
Report Modified: ReportModifiedOn("MMM dd, yyyy").
ReportNameReportName returns the saved name of the current report. Use this function in a text box,text cell, row, or column heading.
Syntax:
ReportName()
Example:
Insert the report name:
Chapter 8Text Functions
8-37
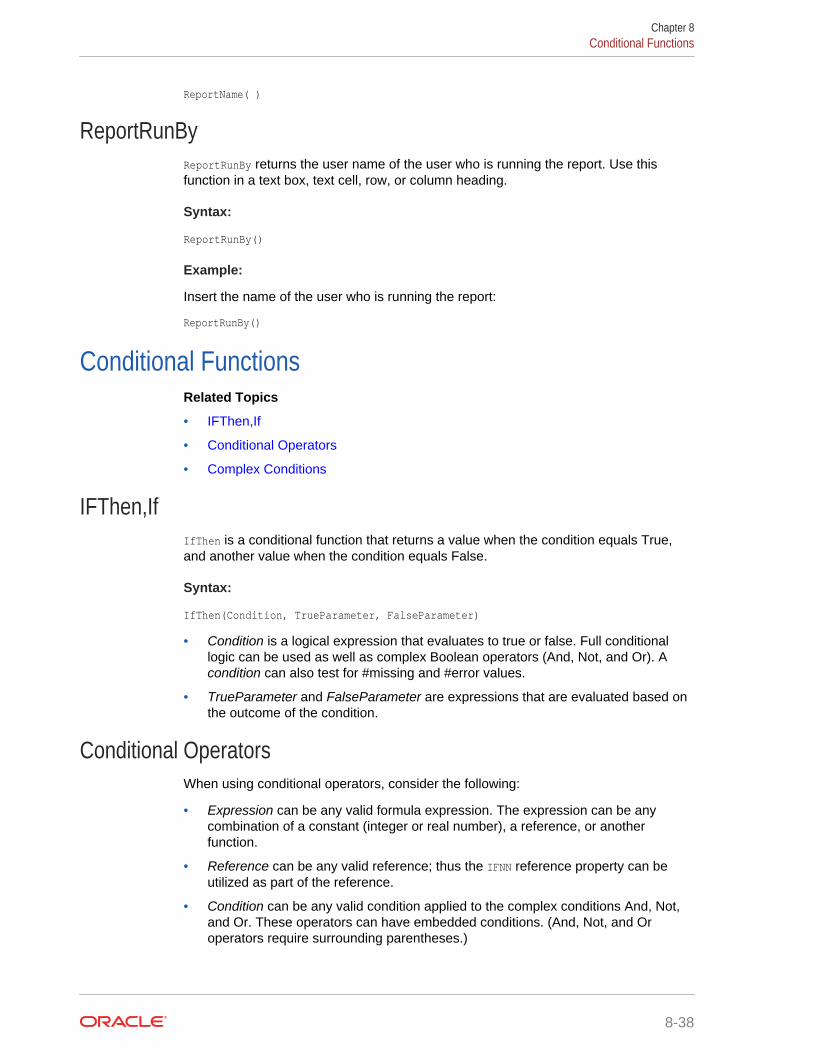
ReportName( )
ReportRunByReportRunBy returns the user name of the user who is running the report. Use thisfunction in a text box, text cell, row, or column heading.
Syntax:
ReportRunBy()
Example:
Insert the name of the user who is running the report:
ReportRunBy()
Conditional FunctionsRelated Topics
• IFThen,If
• Conditional Operators
• Complex Conditions
IFThen,IfIfThen is a conditional function that returns a value when the condition equals True,and another value when the condition equals False.
Syntax:
IfThen(Condition, TrueParameter, FalseParameter)
• Condition is a logical expression that evaluates to true or false. Full conditionallogic can be used as well as complex Boolean operators (And, Not, and Or). Acondition can also test for #missing and #error values.
• TrueParameter and FalseParameter are expressions that are evaluated based onthe outcome of the condition.
Conditional OperatorsWhen using conditional operators, consider the following:
• Expression can be any valid formula expression. The expression can be anycombination of a constant (integer or real number), a reference, or anotherfunction.
• Reference can be any valid reference; thus the IFNN reference property can beutilized as part of the reference.
• Condition can be any valid condition applied to the complex conditions And, Not,and Or. These operators can have embedded conditions. (And, Not, and Oroperators require surrounding parentheses.)
Chapter 8Conditional Functions
8-38
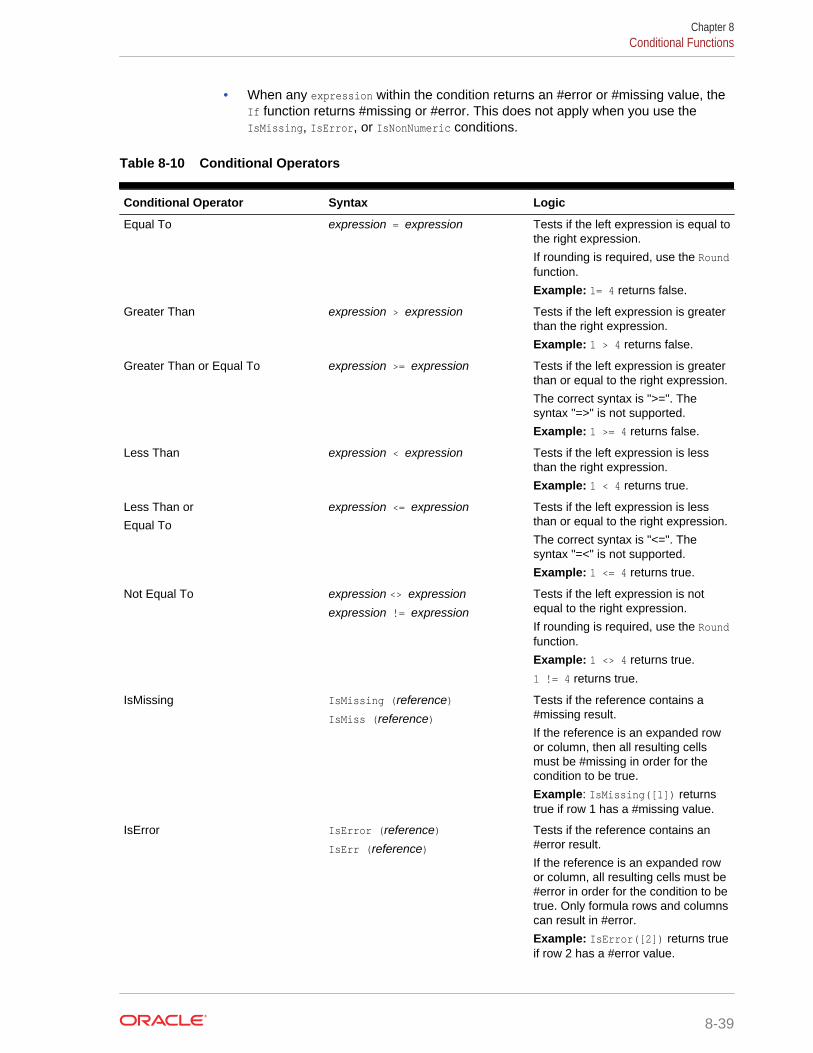
• When any expression within the condition returns an #error or #missing value, theIf function returns #missing or #error. This does not apply when you use theIsMissing, IsError, or IsNonNumeric conditions.
Table 8-10 Conditional Operators
Conditional Operator Syntax Logic
Equal To expression = expression Tests if the left expression is equal tothe right expression.
If rounding is required, use the Roundfunction.
Example: 1= 4 returns false.
Greater Than expression > expression Tests if the left expression is greaterthan the right expression.
Example: 1 > 4 returns false.
Greater Than or Equal To expression >= expression Tests if the left expression is greaterthan or equal to the right expression.
The correct syntax is ">=". Thesyntax "=>" is not supported.
Example: 1 >= 4 returns false.
Less Than expression < expression Tests if the left expression is lessthan the right expression.
Example: 1 < 4 returns true.
Less Than or
Equal To
expression <= expression Tests if the left expression is lessthan or equal to the right expression.
The correct syntax is "<=". Thesyntax "=<" is not supported.
Example: 1 <= 4 returns true.
Not Equal To expression <> expressionexpression != expression
Tests if the left expression is notequal to the right expression.
If rounding is required, use the Roundfunction.
Example: 1 <> 4 returns true.
1 != 4 returns true.
IsMissing IsMissing (reference)IsMiss (reference)
Tests if the reference contains a#missing result.
If the reference is an expanded rowor column, then all resulting cellsmust be #missing in order for thecondition to be true.
Example: IsMissing([1]) returnstrue if row 1 has a #missing value.
IsError IsError (reference)IsErr (reference)
Tests if the reference contains an#error result.
If the reference is an expanded rowor column, all resulting cells must be#error in order for the condition to betrue. Only formula rows and columnscan result in #error.
Example: IsError([2]) returns trueif row 2 has a #error value.
Chapter 8Conditional Functions
8-39
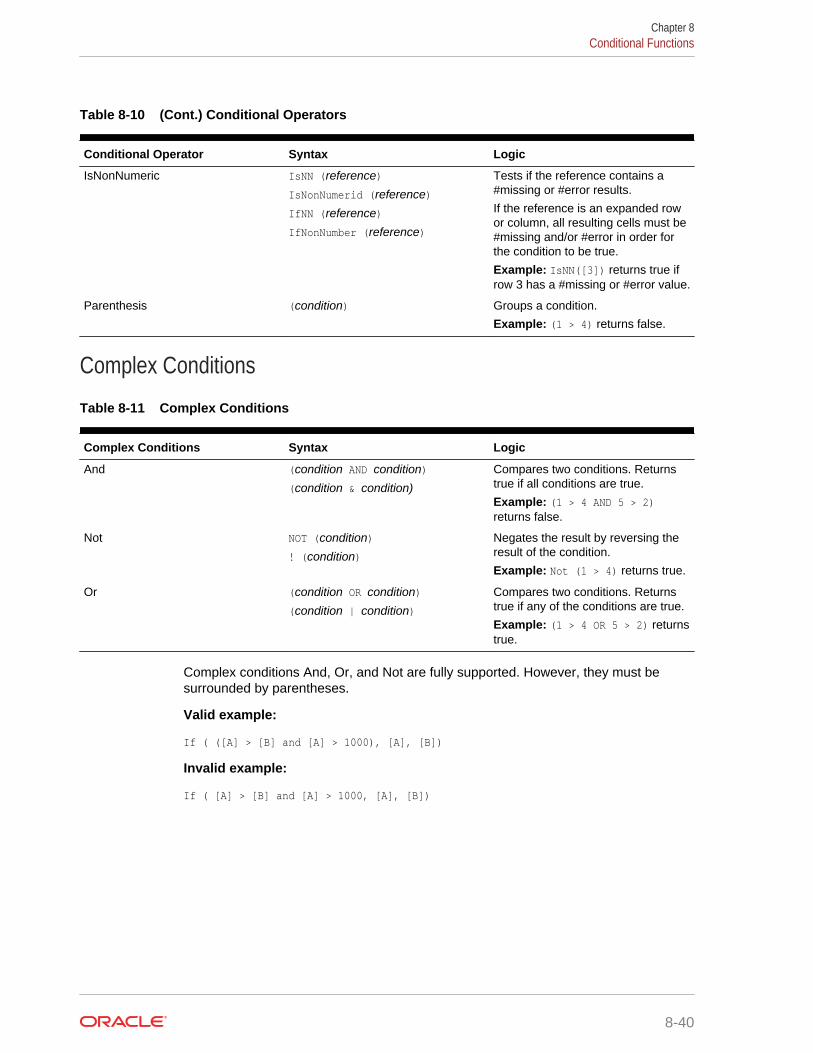
Table 8-10 (Cont.) Conditional Operators
Conditional Operator Syntax Logic
IsNonNumeric IsNN (reference)IsNonNumerid (reference)IfNN (reference)IfNonNumber (reference)
Tests if the reference contains a#missing or #error results.
If the reference is an expanded rowor column, all resulting cells must be#missing and/or #error in order forthe condition to be true.
Example: IsNN([3]) returns true ifrow 3 has a #missing or #error value.
Parenthesis (condition) Groups a condition.
Example: (1 > 4) returns false.
Complex Conditions
Table 8-11 Complex Conditions
Complex Conditions Syntax Logic
And (condition AND condition)(condition & condition)
Compares two conditions. Returnstrue if all conditions are true.
Example: (1 > 4 AND 5 > 2)returns false.
Not NOT (condition)! (condition)
Negates the result by reversing theresult of the condition.
Example: Not (1 > 4) returns true.
Or (condition OR condition)(condition | condition)
Compares two conditions. Returnstrue if any of the conditions are true.
Example: (1 > 4 OR 5 > 2) returnstrue.
Complex conditions And, Or, and Not are fully supported. However, they must besurrounded by parentheses.
Valid example:
If ( ([A] > [B] and [A] > 1000), [A], [B])
Invalid example:
If ( [A] > [B] and [A] > 1000, [A], [B])
Chapter 8Conditional Functions
8-40
ADesign Considerations
As you design your report, here are some elements to consider.
Grid Data Limit
The maximum number of cells that can be returned by a grid is 1,000,000 cells. If thislimit is reached when previewing the grid or report, you will receive this error: Errorexecuting query. The number of cells exceeds the maximum of1000000.
Chart Object's Data Set Limit
The maximum chart data set limit is 50 rows by 25 columns, or 1,250 values.
Using Expanded Versus Single Data Segments in Queries
A data segment is a row or column that retrieves data from a database. An expandeddata segment is a row or column that can expand, so that the resulting grid expands totwo or more rows or columns when viewed. Often, expanded data segments usefunctions such as Children Of or Descendants Of. A single data segment is a row orcolumn that remains a single row or column when shown in the viewer.
While it is generally valid to use expanded and single data segments in the same grid,when designing a grid with large amounts of data, consider using expanded datasegments rather than single data segments. Expanded data segments provide someperformance advantages over single data segments; however, to produce detailedformatting on different data rows or columns, use single data segments.
Suppressing Missing Blocks
Note:
The ability to suppress missing blocks is available for EPM Cloud productsonly.
You can suppress missing blocks to improve performance when rows or columnscontain sparse dimensions. When you suppress missing blocks, you can place largesparse dimensions in rows, while providing good response time if the density of thequery is low. Only blocks with data are retrieved. For example, if you place anemployee dimension consisting of thousands of members in rows, and place the entityin the page or POV, then only employees of the selected entity are retrieved.
A-1
Note:
Suppress missing blocks in Management Reporting is used in combinationwith suppress missing data. When you use suppress missing blocks alone itwill not suppress anything.
Suppressing missing blocks aids in suppressing missing data when a large number ofrows, such as 90% or more, is suppressed. However, choosing to suppress missingblocks when few or no rows contain missing blocks that would be suppressed candegrade performance. Also, certain suppressed blocks may ignore dynamiccalculation members.
Renaming Dimensions and Members
If you rename the dimensions or members in a data source, you must manually updateeach report in Management Reporting to reflect the changes.
Other Design Considerations
When designing reports:
• Use expanded data segments for optimal performance:
– Use functions on expanded data segments that are not placed on separaterows or columns.
– Use multiple member selections on expanded data segments that are notplaced in separate rows or columns.
– Use single data segments only when required for formatting or calculations.
• Write efficient formulas:
– Use row or column formulas rather than cell formulas, when possible.
– Use reference properties.
– Use a cell reference instead of cross-axis references.
– Remove unnecessary parenthesis from formulas.
• Do not limit your report to the Grid object:
– Add functions in text boxes that highlight specific areas.
– Hide a grid of data in a report to highlight just the graphics.
Appendix A
A-2

BMigrating Financial Reporting Reports toManagement Reporting
You can migrate reports created in Financial Reporting to Management Reporting byexporting them from Financial Reporting and then importing them into ManagementReporting. When the reports are imported into Management Reporting, the systemconverts the Financial Reporting elements to the Management Reporting equivalentswhere available. See Differences between Financial Reporting and ManagementReporting.
Note:
You can migrate reports that were created in Financial Reporting EPM Cloudversion 17.10 or later, and on-premises version 11.1.2.4 and later.
Exporting Reports
You can export reports from Financial Reporting one at a time, or in bulk. When youexport a single report, the report is extracted to a DES (for a report) or RPT (for asnapshot) file. When you extract multiple reports, they are extracted to aReports.ZIP file.
To export reports from Financial Reporting:
1. Perform an action:
• From an Enterprise Performance Management cloud service that supportsFinancial Reporting (for example, Oracle Enterprise Planning and BudgetingCloud), select Navigator, and then Explore Repository to view the FinancialReporting reports that are available to be migrated.
• From an on-premises Enterprise Performance Management Workspaceinstance, navigate to the Explore module to browse the Financial Reportingreports that are available to be migrated
2. From the repository, select File, then Export.
3. Select the reports that you want to migrate, and then click OK.
B-1
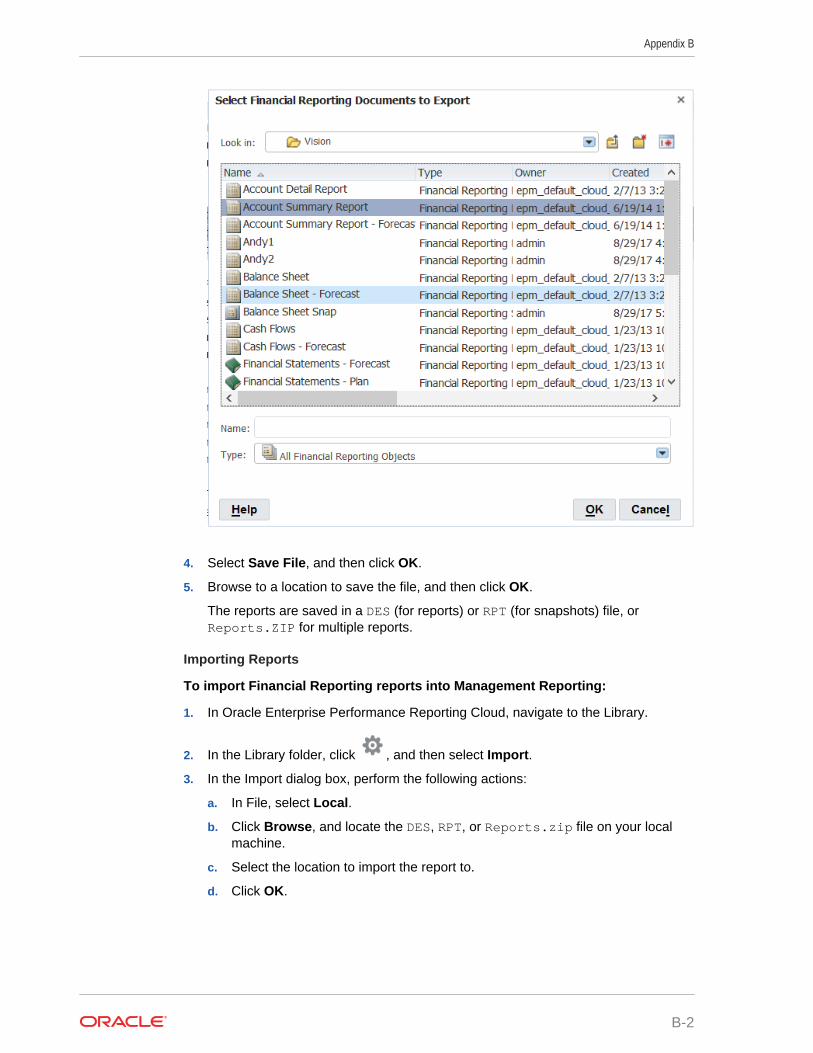
4. Select Save File, and then click OK.
5. Browse to a location to save the file, and then click OK.
The reports are saved in a DES (for reports) or RPT (for snapshots) file, orReports.ZIP for multiple reports.
Importing Reports
To import Financial Reporting reports into Management Reporting:
1. In Oracle Enterprise Performance Reporting Cloud, navigate to the Library.
2. In the Library folder, click , and then select Import.
3. In the Import dialog box, perform the following actions:
a. In File, select Local.
b. Click Browse, and locate the DES, RPT, or Reports.zip file on your localmachine.
c. Select the location to import the report to.
d. Click OK.
Appendix B
B-2
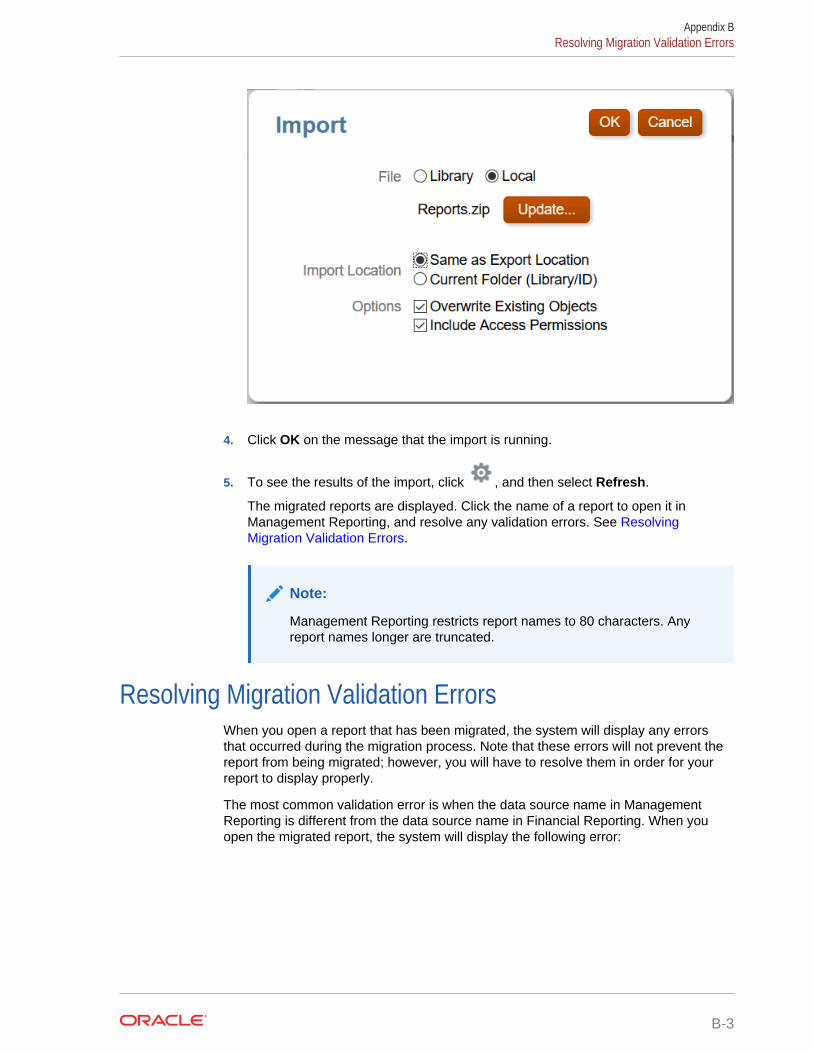
4. Click OK on the message that the import is running.
5. To see the results of the import, click , and then select Refresh.
The migrated reports are displayed. Click the name of a report to open it inManagement Reporting, and resolve any validation errors. See ResolvingMigration Validation Errors.
Note:
Management Reporting restricts report names to 80 characters. Anyreport names longer are truncated.
Resolving Migration Validation ErrorsWhen you open a report that has been migrated, the system will display any errorsthat occurred during the migration process. Note that these errors will not prevent thereport from being migrated; however, you will have to resolve them in order for yourreport to display properly.
The most common validation error is when the data source name in ManagementReporting is different from the data source name in Financial Reporting. When youopen the migrated report, the system will display the following error:
Appendix BResolving Migration Validation Errors
B-3
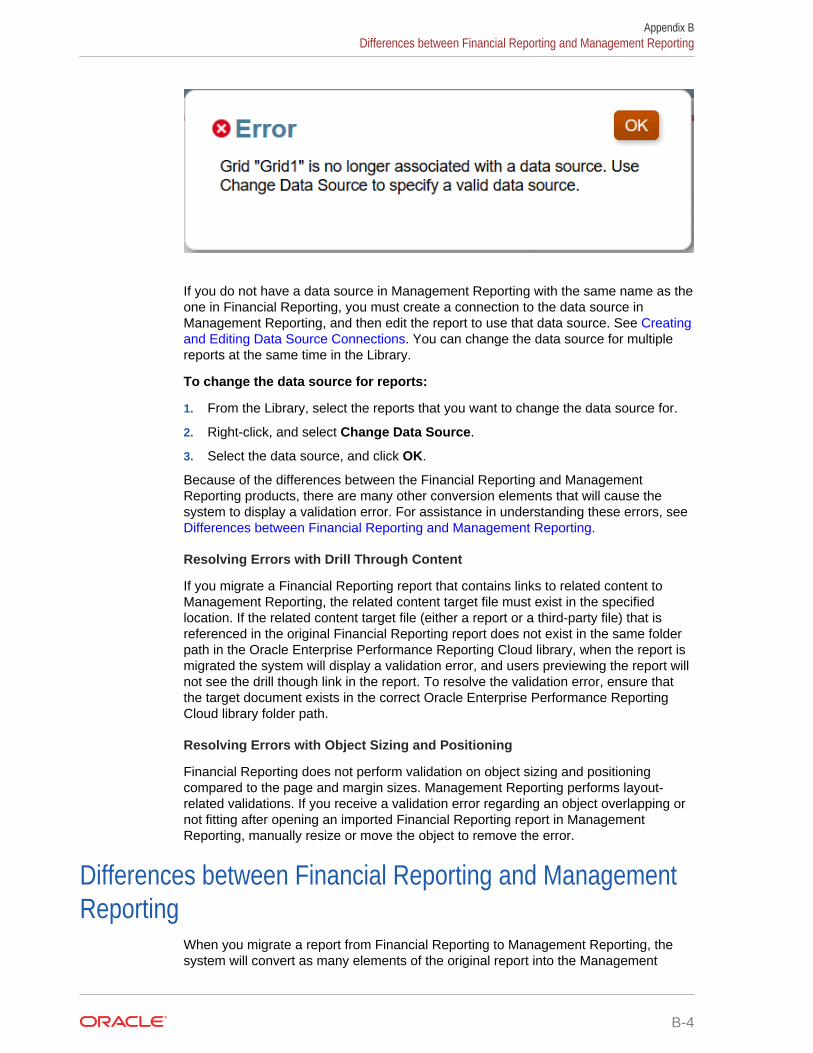
If you do not have a data source in Management Reporting with the same name as theone in Financial Reporting, you must create a connection to the data source inManagement Reporting, and then edit the report to use that data source. See Creatingand Editing Data Source Connections. You can change the data source for multiplereports at the same time in the Library.
To change the data source for reports:
1. From the Library, select the reports that you want to change the data source for.
2. Right-click, and select Change Data Source.
3. Select the data source, and click OK.
Because of the differences between the Financial Reporting and ManagementReporting products, there are many other conversion elements that will cause thesystem to display a validation error. For assistance in understanding these errors, see Differences between Financial Reporting and Management Reporting.
Resolving Errors with Drill Through Content
If you migrate a Financial Reporting report that contains links to related content toManagement Reporting, the related content target file must exist in the specifiedlocation. If the related content target file (either a report or a third-party file) that isreferenced in the original Financial Reporting report does not exist in the same folderpath in the Oracle Enterprise Performance Reporting Cloud library, when the report ismigrated the system will display a validation error, and users previewing the report willnot see the drill though link in the report. To resolve the validation error, ensure thatthe target document exists in the correct Oracle Enterprise Performance ReportingCloud library folder path.
Resolving Errors with Object Sizing and Positioning
Financial Reporting does not perform validation on object sizing and positioningcompared to the page and margin sizes. Management Reporting performs layout-related validations. If you receive a validation error regarding an object overlapping ornot fitting after opening an imported Financial Reporting report in ManagementReporting, manually resize or move the object to remove the error.
Differences between Financial Reporting and ManagementReporting
When you migrate a report from Financial Reporting to Management Reporting, thesystem will convert as many elements of the original report into the Management
Appendix BDifferences between Financial Reporting and Management Reporting
B-4

Reporting equivalent as possible. However, there are differences between the twoproducts, and not all elements exist in both products. You should consider themigrated report as a starting point for converting a Financial Reporting to ManagementReporting, but it is likely that you will have to modify certain elements after the reporthas been migrated in order to produce a report that is equivalent to the original report.This topic will help you understand the differences between Financial Reporting andManagement Reporting so that you can modify the migrated report as necessary.
Financial Reporting Functions and their Management Reporting Equivalents
The following section describes the functions that are available in Financial Reportingand their Management Reporting equivalents where available.
Note:
The syntax for text functions differs between the two products. FinancialReporting requires << and >> brackets around functions (for example,<<MemberName()>>). Management Reporting does not require the brackets.
Table B-1 Financial Reporting Functions and Management ReportingEquivalents
Financial Reporting Function Management Reporting Equivalent
Annotation
CalcStatus
CellText CellText
Datasource
Date DateTime
GetCell CellValue
GetHeading HeadingValue
GridDimension
HFMCurrency
LabeledCellText
ListOfCellDocuments
MemberName MemberName
MemberAlias MemberAlias
MemberDescription
MemberProperty MemberProperty
MemberQualifiedName MemberName
Page PageNumber
PageIndex PageNumber
PageCount PageCount
PlanningAnnotations
ProcessManagementStatus
ReportAuthor ReportAuthor
ReportCreated ReportCreateOn
ReportDesc ReportDescription
ReportFolder ReportLocation
Appendix BDifferences between Financial Reporting and Management Reporting
B-5

Table B-1 (Cont.) Financial Reporting Functions and Management ReportingEquivalents
Financial Reporting Function Management Reporting Equivalent
ReportModified ReportModifiedOn
ReportModifiedBy ReportModifiedBy
ReportName ReportName
ReportRunBy ReportRunBy
Note:
The Management Reporting text function "DateTime" has two parameters,one for date and one for time, the Financial Reporting "Date" function onlyhas one parameter format string. When migrating Financial Reporting reportsusing the "Date" function, where the time is also specified, the migratedfunction in Management Reporting needs to be modified to include an extraparameter of "none", otherwise the time result is repeated. For example, amigrated text function as follows: DateTime("dd-MMM-yy h:mm:ss a") needsto be manually modified to the following: DateTime("dd-MMM-yy h:mm:ss a",none)
In Financial Reporting, the text functions allowed for the use of cur, curr or current toindicate the current row, column, or grid. Management Reporting does not supportcurr. Instead, the functions allow for optional parameters where curr was used.
For example, in the Financial Reporting function <<MemberName("curr", "curr","Product", "curr")>>, where the "curr" elements stand for grid name, row, column, orpage, the "curr" elements are not necessary in Management Reporting. TheManagement Reporting equivalent would be MemberName("Product"). The "grid" defaultsto the grid that contains the function (or the only grid if the text function was in a textobject and there was a single grid). If there are more than one grid, and the textfunction occurs in a text object, then the gridname parameter is required.
Differences in the Point of View (POV)
There are differences between the way that Financial Reporting and ManagementReporting manage the POV:
• In Financial Reporting, by default a grid POV has a value of "User Point of View".In Management Reporting, the default value is "Default".
• In Financial Reporting, both the grid and user POV are able to have choice lists. InManagement Reporting, the list is called a "Suggested List". See Setting Up thePoint of View.
• In Financial Reporting, a report designer can select an initial member to be usedon the Grid POV. If a dimension on the Grid POV has a selection, this acts as theinitial member for that dimension on the Grid POV every time the report is run. InManagement Reporting, a report designer cannot select an initial member to beused in the Local POV when the report is run. If a Suggested List is defined, thelocal POV uses the last selected Global POV member for the dimension as aninitial member when the report is run.
Appendix BDifferences between Financial Reporting and Management Reporting
B-6
• In Financial Reporting, grids can have page axes. In Management Reporting, thepage axis functionality is supported via the 'Print All Selections' option on adimension in the POV.
• In Financial Reporting, in the grid editor a user sees the values of the user POV fordimensions on the grid POV. In Management Reporting, the user sees only'Default', or the 'Suggested List' members.
Grid Object Differences
When working with grid objects, consider the following:
• In Management Reporting grid headers are frozen by default.
• The heading type 'Entity Short Name' is not supported in Management Reporting.
• The Row/Column property for ‘Page Break Before = Position at Top’ is notsupported in Management Reporting. Row/Column page breaks will alwaysappear in the same position on the following page.
• The member selection 'Show Supporting Detail' option is valid only on the row axiswhen there is a single layer and the account dimension is on the row.
• In Financial Reporting, the 'Show Supporting Detail' unary operator is set at therow level. In Management Reporting, it is set at the grid level. If the FinancialReporting report contains different property values for 'Show Supporting Detail' fordifferent rows, the system displays a migration error.
• If the grid object has a page axis member selection set to 'Current Point of View',the system will replace the selection with the dimension-name-member. Thiscondition is not valid in Management Reporting, since the page axis memberselection is migrated to a suggested list on a grid POV dimension. In the log forthe migration, the system will display :" In grid object 'Grid1', the page axismember selection has a 'Current-Point-of-View' reference, which is not valid."
• If the Financial Reporting page axis member selection contains multiple prompts,the member selection will be migrated to a single prompt in ManagementReporting.
• A single grid cannot reference multiple data sources in Management Reporting. Ifa Financial Reporting grid references multiple data sources, the system displays amigration error.
• Since a Management Reporting grid does not have a page axis, if a FinancialReporting grid contains sorting on the page axis, the system displays a migrationerror in the migration log.
• The 'Show Row Headings before Column' property, which allows you to createbutterfly-type reports, is not supported in Management Reporting.
• For migrated Financial Reporting reports where the cell shading is set to white(FFFFFF) by default, you must set the Management Reporting report cell shading to"Transparent" in order to use the grid property for row banding. Otherwise, thesystem will recognize the cell shading as having an existing format applied androw banding will not be applied.
• In Management Reporting the Financial Reporting Conditional Format of FormatCells then Alignment then Indent Increases For Each Generation By: is notsupported. Indent by Generation can be applied as a cell property after import.
• If a user has merged heading and data cells in Financial Reporting and imports thereport to Management Reporting, the import splits the merged cells into merged
Appendix BDifferences between Financial Reporting and Management Reporting
B-7
heading cells and merged data cells. This will change how the report looks andworks and the user will need to modify the report.
Image Object Differences
Financial Reporting supports a stretch option for images. Management Reporting doesnot support stretching or cropping; instead, the image will be sized to the correctaspect ratio.
Text Object Differences
In Financial Reporting, the text object has an 'AutoSize' property. In ManagementReporting, the size options for height are:
• Fixed (equivalent to AutoSize=Off)
• Fit (equivalent to AutoSize=On)
• Minimum
Chart Object Differences
The following Financial Reporting chart properties are not supported in ManagementReporting charts:
Note:
After importing a Financial Reporting report with Combo charts, the chart linecolors in Management Reporting do not match the colors in FinancialReporting.
• Font Angles: Font angles for all font settings for text in the Format Chart dialogbox
• Format Chart:
– Appearance:
* Title Box Color
* Title Box Border Color, Type, and Width
* Grid Depth
– Legend:
* Suppress Repeating Labels
* Background Border Type and Width
– Axes:
* X-axis Background Color
* X-axis Border Color, Type, and Width
* Y-axis Background Color
* Y-axis Border Color, Type, and Width
* Y-axis Override Number Format
Appendix BDifferences between Financial Reporting and Management Reporting
B-8

* Y2-axis Title Box
* Y2-axis Override Number Format
– Pie Options:
* Pie Label Position
* Pie Slice Angle
Alignment Differences
In Financial Reporting, an object can be top/left/bottom and left/right/center aligned.However, the object is aligned with the appropriate edge of the page (taking intoaccount the margins and header/footer height). In Management Reporting, the samealignment options are supported. However, the object can be aligned a certaindistance from the appropriate edge. This is supported via the ‘Indent’ alignmentproperty.
Member Selection Differences
When working with grid objects, consider the following:
• The Financial Reporting advanced member selection operators such as AND,UNION, OR and NOT are converted to the Management Reporting memberselection functions Intersect (which combines multiple members and functions,previously the AND operator in Financial Reporting) and Except (excludes amember or function from another function, previously the NOT operator in FinancialReporting). The Financial Reporting OR and UNION operators performed the sameoperation and are the default for any member selections, therefore there is noneed to specify anything additional in Management Reporting for these twooperators. There are two migration differences for the NOT operator:
– Management Reporting member selections do not support migrating nested'Not' statements. For example, "member-selection1 and not member-selection2" is migrated, while "member-selection1 and not not member-selection2" is not.
– Management Reporting member selections do not support migrating a 'Not'statement on the first member selection. For example, "member-selection1and not member-selection2" is migrated, while "not member-selection1 andmember-selection2" is not.
• In Financial Reporting, member selection supports SuppressSharedMembers. InManagement Reporting, suppress shared members is supported as an option onan existing member selection (added via a member selection menu).
• Management Reporting does not support a user-defined 'User member list', asFinancial Reporting does.
• The following Financial Reporting member selection functions are not supported inManagement Reporting:
– MatchEX
– TopOfHierarchy
– LSiblings
– RSiblings
– Top
Appendix BDifferences between Financial Reporting and Management Reporting
B-9
– AllMembers
– Property
• In Financial Reporting, a system-member-list is either a named level or a namedgeneration. The underlying data source provides these names, which take theform of 'Lev<n>,<dimension name>' or 'Gen<n>,<dimension name>' by default.However, a data source administrator can also give a user-specified name to alevel or generation (for example, SKU or Country). If the system-member-list isone of the default names, it gets converted to the 'LevelMembers' or'GenerationMembers' member selection functions. If the system-member-list has anon-default name, the system cannot determine what the available list of names iswithout connecting to the data source. Therefore, the system displays a migrationerror and the member selection is converted to the dimension parent member.
• When migrating members, any member name in Financial Reporting that isprefixed with a "$" (meaning it is a substitution variable ) is converted to asubstitution variable and prefixed with an "&" in Management Reporting.
Features Not Supported in Management Reporting
The following Financial Reporting features are not supported in ManagementReporting:
• Export to Office
• Planning Unit Annotations
• Annotations
• auto calculation
Other Differences
Keep in mind the following considerations when migrating reports:
• MemberOverride is not supported in Management Reporting
• Drill to content cannot be used to drill to a cell file attachment sourced from anEssbase Linked Reporting Object or Oracle Enterprise Performance ReportingCloud cell file attachment.
• Linked objects are not supported in Management Reporting. If a linked object isfound in a Financial Reporting report that is being migrated, the system will displaya migration error.
• In Financial Reporting, any object can be marked as 'Hidden'. In ManagementReporting, only grid objects can be hidden. This is not a user-defined property, butrather it is set by the system when the grid is created as part of defining a chartobject.
• If you migrate an EPM Cloud report (for example, Oracle Enterprise Planning andBudgeting Cloud) with conditional formatting or suppression by Account Type (forexample, suppressing rows with an account type of Revenue), you may have toupdate the conditional expression in order for it to be applied correctly. This isbecause in Financial Reporting, the conditional expressions for Account Typecheck only if the type is Expense or NonExpense, while in Management Reporting,the expression checks if the account type is an Asset, Liability, Equity, Revenue,Expense, or NonExpense type. As a result, you should update the conditionalexpression to check for the true account type. For example, expressions thatsuppress a Revenue account type (which is considered NonExpense in Financial
Appendix BDifferences between Financial Reporting and Management Reporting
B-10

Reporting) must be updated to suppress the true account type of Revenue afterthe report is migrated.
• Management Reporting does not support a 'Custom' paper format size. Themigration will convert this size to 'Letter'.
• Management Reporting does not support a Super A3 paper format size. Themigration will convert this size to 'Letter'.
• In Financial Reporting users can add MemberOverride to the CellText function. InManagement Reporting this is not currently supported.
Appendix BDifferences between Financial Reporting and Management Reporting
B-11