destination dc - council of the district of...
TRANSCRIPT

DESTINATION DC 2013 Advertising Effectiveness & ROI Study
Research prepared for Destination DC by Destination Analysts, Inc.
Destination Analysts, Inc. i
Table of Contents
S E C T I O N 1
Introduction 3
Project Overview 3
Research Objectives 3
Methodology 4
S E C T I O N 2
Quick Facts 6
S E C T I O N 3
Executive Summary 7
S E C T I O N 4
Return on Investment Analysis 16
Advertising Effectiveness & ROI Evaluation 17
Evaluating the Campaign’s Reach 17
ROI Measurement 19
S E C T I O N 5
Detailed Survey Results 25
Magazines Read in Past 12 Months 26
Newspapers Read in Past 12 Months 27
Websites Visited in Past 12 Months 28
Online Search Engines Used in Past 12 Months 29
Radio Stations Listened to in Past 12 Months 30
Streaming of Katz 360 in Past 12 Months 31
Leisure Trips Taken in Past 12 Months 32
Top Tourism Destinations 33
Cities Visited on Leisure Trips in Past 12 Months 34
Leisure Visits to the District of Columbia in 35 Past 12 Months
Month of District of Columbia Visit 36
Primary Reason for Visiting the District of 37 Columbia
Place of Stay 38
Location of Place of Stay 39
Total Days Spent in Washington, DC Metro Area 40
Total Days Spent inside the District of Columbia 41
District of Columbia Hotel Guest Visitor 42 Spending Per Day
Non‐District of Columbia Hotel Guest Visitor 43 Spending Per Day
Number of People Respondent’s Spending 44 Covered
Maryland and/or Virginia Visitation 45
Spending in Maryland and/or Virginia 46
Number of People in Travel Party 47
Children in Travel Party 48
Important Attributes in Destination Decision 49
Familiarity with Washington, DC 50
Likelihood to Visit Washington, DC in Next 51 12 Months
Recall of Washington, DC Advertisements 52 (Unaided)
Advertising Media Recall (Aided) 53
Recall of Magazine Advertisements 54
Recall of Newspaper Advertisements 55
Recall of Digital Advertisements 56
Recall of Video Advertisement 57
Recall of New York City Advertisements 58
Recall of Radio Advertisements 59
Advertising’s Overall Effectiveness 60
Advertising’s Effectiveness in Communicating 61 Campaign’s Central Messages
Advertisements’ Affect on Likelihood to Visit 62 Washington, DC
Advertising’s Influence on Decision to Visit 63 Washington, DC

Destination Analysts, Inc. 2
Point in Travel Decision When Exposed to 64 Advertising
Recall of Travel Articles about Washington, DC 65
Recall of Television Features about 66 Washington, DC
Likelihood to Recommend Washington, DC 67
Traveler Psychographics 68
Influence of Political Climate on Interest in 69 Washington, DC
How Political Climate Affects Interest in 70 Washington, DC
S E C T I O N 6
Demographics 71
Gender 72
Age 73
Employment Status 74
Formal Education 75
Annual Household Income 76
Ethnic Background 77
GLBT 78
Marital Status 79
S E C T I O N 7
Appendix I: Comparison to Past Studies 80
S E C T I O N 8
Appendix II: Subsamples & Reliability 81
S E C T I O N 9
Appendix III: Survey Questionnaire 82

Destination Analysts, Inc. 3
Introduction
Project Overview
This report presents the findings of an advertising effectiveness and return on investment study conducted by Destination Analysts, Inc. on behalf of Destination DC, the organization charged with marketing the District of Columbia as a global convention, tourism and special events destination. Broadly speaking, this study’s goal was to develop an understanding of the reach and impact of the organization’s 2013 Spring and Summer advertising campaigns. These campaigns ran between February and August 2013 and consisted of $3.0 million in media placement in magazines, newspapers, radio, online, as well as a consumer pop‐up event in New York City. The campaign was additionally supported by an extensive public relations outreach media.
Research Objectives
As was done to evaluate previous advertising campaigns on behalf of Destination DC, Destination Analysts executed a research plan to gather data to:
1. Evaluate the 2013 campaign’s reach
Measure brand awareness (unaided/aided)
Develop advertising awareness and recall metrics (aided)
Examine the impact of the campaign on travelers’ perceptions of Washington, DC as a travel destination
Evaluate the campaign’s impact on travelers’ likelihood to visit Washington, DC
Section
1

Destination Analysts, Inc. 4
2. Calculate Return on Investment
Measure incremental visitation and spending generated as a result of the campaign (i.e., the total number of visitors that traveled to the District of Columbia, the total number of hotel room nights generated and the total additional in‐market spending generated)
Estimate the incremental tax revenues generated by the campaign
Gather information on traveler behaviors including data such as trip length, reasons for visit, place of stay, in‐market expenditures, etc.
Determine the economic leakage to southern Maryland and northern Virginia
3. Provide Destination DC with conclusions relative to the campaigns' strategy, effectiveness and options for future refinements.
Evaluate the effectiveness of media options
Compare the results to previous advertising effectiveness/ROI studies
Methodology
To maximize efficiency and reliability, as well as consistency with past studies, an online survey methodology was again chosen.
The goals of this research required that a large survey sample be collected from across the Eastern United States and parts of Canada. In addition, large subsamples from residents of each of the metropolitan areas targeted by the advertising campaigns were desired.
Survey sampling mirrored the advertising campaign, which focused on attracting visitors from four key metropolitan areas: New York City, Philadelphia, Richmond and Toronto. However, the reach of the program clearly went well beyond the boundaries of these metropolitan areas. As a result, this study measures the effects of the campaign on travelers living across the broader East Coast, including fourteen Eastern states1.
1 “Other East Coast” areas include all residents (outside the four DMAs studied) of Massachusetts, Rhode Island, Connecticut, New York, New Jersey, Pennsylvania, Delaware, Maryland, West Virginia, Ohio, Virginia, North Carolina, South Carolina and Georgia.
Destination Analysts, Inc. 5
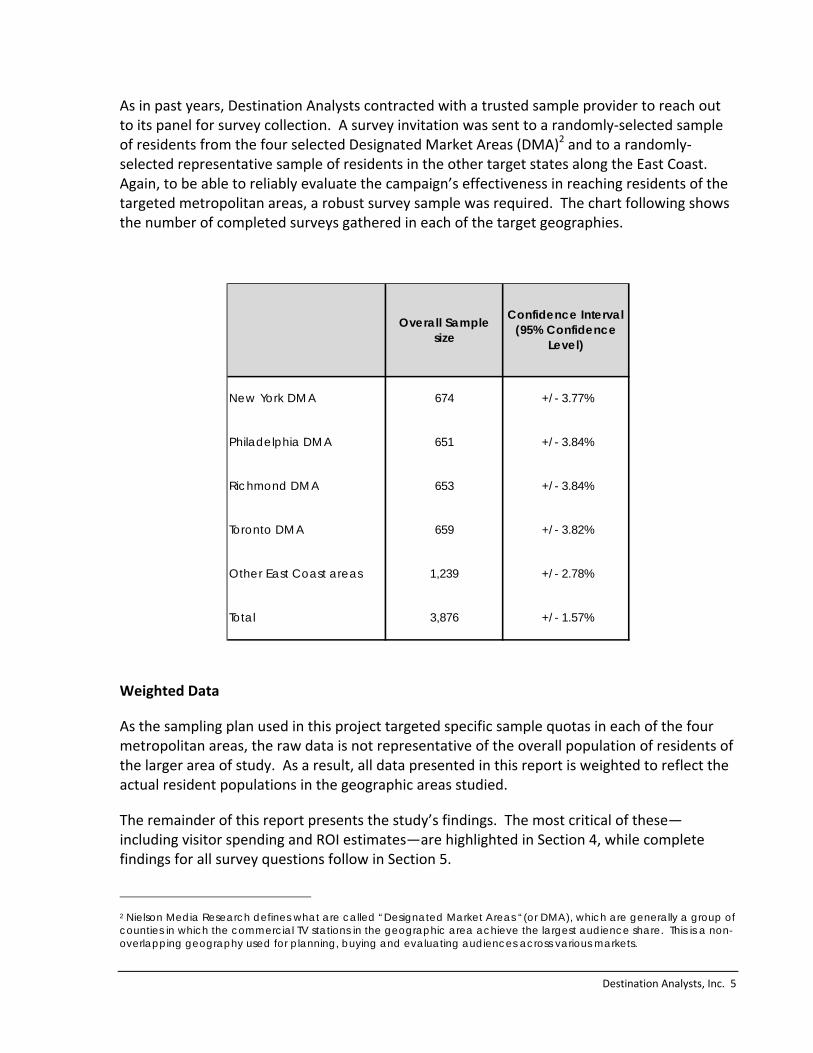
As in past years, Destination Analysts contracted with a trusted sample provider to reach out to its panel for survey collection. A survey invitation was sent to a randomly‐selected sample of residents from the four selected Designated Market Areas (DMA)2 and to a randomly‐selected representative sample of residents in the other target states along the East Coast. Again, to be able to reliably evaluate the campaign’s effectiveness in reaching residents of the targeted metropolitan areas, a robust survey sample was required. The chart following shows the number of completed surveys gathered in each of the target geographies.
Weighted Data
As the sampling plan used in this project targeted specific sample quotas in each of the four metropolitan areas, the raw data is not representative of the overall population of residents of the larger area of study. As a result, all data presented in this report is weighted to reflect the actual resident populations in the geographic areas studied.
The remainder of this report presents the study’s findings. The most critical of these—including visitor spending and ROI estimates—are highlighted in Section 4, while complete findings for all survey questions follow in Section 5.
2 Nielson Media Research defines what are called “Designated Market Areas “(or DMA), which are generally a group of counties in which the commercial TV stations in the geographic area achieve the largest audience share. This is a non-overlapping geography used for planning, buying and evaluating audiences across various markets.
New York DMA 674 +/- 3.77%
Philadelphia DMA 651 +/- 3.84%
Richmond DMA 653 +/- 3.84%
Toronto DMA 659 +/- 3.82%
Other East Coast areas 1,239 +/- 2.78%
Total 3,876 +/- 1.57%
Confidence Interval (95% Confidence
Level)
Overall Sample size

Destination Analysts, Inc. 6
Quick Facts: The profile below shows a summary of key descriptive statistics and findings emerging from this study.
Section
2
Destination Analysts, Inc. 7
Executive Summary
This study presents measurements of the reach and impact of Destination DC's 2013 Spring and Summer marketing and advertising campaigns. This $3.0 million marketing effort ran between February and August 2013. To conduct this study, an online survey was used to collect a large sample from adult residents across the Eastern United States and parts of Canada. In total, 3,876 completed surveys were collected. As the sampling plan used in this project targeted specific sample quotas in each of the campaign’s four targeted metropolitan areas, the data was weighted so the results presented here accurately reflect the overall population of the larger area of study. In the Executive Summary following, the key findings from this study are outlined in brief.
Overall Campaign Effectiveness & ROI
In total, the advertising campaign generated 91,379 incremental trips, 52.3 percent of which were taken by visitors who stayed overnight somewhere inside the District of Columbia (in hotels or as guests in private residences). Of the remaining 47.7 percent of trips, these incremental visitors stayed outside the District and took day trips into the city. In total, these two groups spent $80.0 million inside the District of Columbia during the period of study.
Visitors staying in District of Columbia hotels were responsible for 30.5 percent of total incremental visitor spending (or $24.4 million). Visitors staying in other locations (District of Columbia private homes and/or anywhere in the suburbs) spent $55.7 million in the District of Columbia, or 70 percent of the total.
The amount of taxes generated directly for the District of Columbia government from the campaigns is estimated to be $5.3 million, which represents 79.4 percent of the total tax revenues produced by this marketing effort ($6.7 million). The significant majority of the District of Columbia’s tax revenue from the campaigns (approximately $3.3 million) came from the 14.5 percent hotel tax and 10 percent restaurant tax.
Section
3

Destination Analysts, Inc. 8
Survey Findings
Both travel and lifestyle magazines appear popular amongst regional residents, with approximately 60 percent reporting having read at least one of the magazines on the campaign media schedule. Survey respondents were shown a list of the magazines the campaign advertising ran in and were asked to select those which they recall reading or looking through in the past year. Both travel and lifestyle magazines continue to be popular amongst regional residents. Six in ten (59.2%) reported having read at least one of the magazines on the campaign media schedule (down from 73.5% in 2010). About one in five reported reading Food & Wine, Travel + Leisure, Southern Living and New York Times—The Magazine. Similar percentages (about one in ten) reported having read or looked through The New Yorker, Smithsonian Magazine, New York Magazine, Ebony and Essence. (Figure 5.1, Page 26)
Half of regional residents had read at least one of the newspapers on the campaigns’ media schedule in the past year. As with the magazines, respondents were shown the newspapers used in the campaigns and asked to identify those they had read or looked through at least once in the past 12 months. Like the magazines, a significant proportion of regional residents had read at least one of the newspapers on the campaign's media schedule in the past year. Over half (53.4%) reported having read at least one of the newspapers in the campaign’s media schedule. About one in five (23.7%) had read or looked through The New York Times. At 18.2 percent, The Wall Street Journal was the second most read newspaper. The lowest overall reported readership amongst the total survey sample was Richmond Escapes (1.6%). (Figure 5.2, Page 27)
Newspaper websites were the most utilized of the online media tested. Survey respondents were also shown a list of websites that the campaign’s digital creative ran on, and asked which ones they visited at least once in the past 12 months. About one in five respondents visited USAToday.com and/or NYTimes.com. Travel websites Orbitz.com and TravelZoo.com were the third (19.9%) and fourth (11.5%) most visited websites on the campaign media schedule, respectively. (Figure 5.3, Page 28)
Google was used by about ninety percent of regional residents. As the campaign included paid search, survey respondents were then asked which search engines they had used in the past year. Reflective of its market dominance, Google was used by about ninety percent of survey respondents. Although second to Google, Yahoo!’s search engine was used by 55.4 percent of respondents. Microsoft’s search tool, Bing, was used by 46.1 percent of respondents in the past year. In total, 97.8 percent reported using at least one of these search engines. (Figure 5.4, Page 29)
Radio had a more limited potential reach. The advertising campaign included radio spots in the Atlanta market. Fewer than 2 percent of the Georgia residents surveyed reported having listened to any of the three radio stations tested. The media schedule additionally included Katz 360, streaming radio programming targeted to the New York DMA. Of the

Destination Analysts, Inc. 9
survey respondents who reside in the states of New York, New Jersey and Connecticut, only 3.0 percent reported listening to this stream in the past 12 months. (Figure 5.5 and 5.6, Page 30 and 31)
The regional residents surveyed took an average of 2.5 leisure trips in the past year. While 25.5 percent took no leisure trips, and 20.0 percent took only one trip, the majority of adults living in the area of study travels multiple times for leisure each year (54.5%). This continues to create an opportune environment to market Washington, DC as an option for one or more of these trips. (Figure 5.7, Page 32)
Although unaided awareness and consideration of Washington, DC as an urban leisure travel destination remains strong, New York City continues to present D.C. its biggest competition for those travelers seeking this type of experience. To understand Washington, DC’s competitive landscape, survey respondents were asked to assume they wanted to take a trip to a domestic urban destination that offered great hotels, dining, shopping, entertainment, outdoor activities and other unique experiences, and then list the cities that first came to mind. As in all previous years of this research, New York City retained its stronghold as a travel brand offering this type of destination experience, with 35.6 percent listing it as one of the cities that first came to mind. New York was again followed by Las Vegas (14.9%), and then Boston (14.6%). Washington, DC was the seventh ranked destination, with nearly one‐in‐ten (9.6%) respondents selecting it as one of the top four U.S. cities that they would think of for this type of experience. (Figure 5.8, Page 33)
Washington, DC continues to capture a significant share of regional visitor traffic. Those survey respondents who reported having traveled at least once for leisure in the past year were then presented a list of East Coast cities and asked which they had visited in the past year. New York was the top regional destination, with 29.9 percent of regional residents having visited the city in the past year. Washington, DC—the second most visited regional destination—continues to capture a significant share of regional visitor traffic as well, with 19.4 percent having traveled to the city in the previous 12 months. Approximately 15 percent of survey respondents traveled to Boston, Orlando, Atlanta, and Philadelphia. (Figure 5.9, Page 34)
Regional Washington, DC visitors took an average of 2.1 trips to the city. Those that reported visiting the District of Columbia for leisure in the past year were asked how many such trips to the city they made. While the majority of survey respondents said they took just one leisure trip to the District of Columbia (57.3%), over 40 percent took multiple trips to the city for leisure. (Figure 5.10, Page 35)
Visitation to Washington, DC amongst regional residents was at its lowest point in February (7.6%) and highest in April (20.5%) and May (20.1%). These findings are similar to those in previous years. (Figure 5.11 Page 36)

Destination Analysts, Inc. 10
Weekend getaways and visiting friends and relatives (VFR) are significant tourism drivers to Washington, DC. Respondents visiting Washington, DC in the past year were asked the primary purpose of their most recent leisure trip to the city. The most common responses to this question were "weekend getaways" (28.3%) and “visit friends or family” (26.0%). Approximately one in five respondents characterized their visit to Washington, DC as a “vacation.” (Figure 5.12, Page 37)
As a significant number of regional Washington, DC visitors came to the city for a weekend getaway or special event/festival on their most recent trip, the greatest proportion of visitors stayed overnight and in paid accommodations (54.1%). With 26.0 percent reporting coming to Washington, DC specifically to visit friends and family, a similar percent (28.0%) stayed overnight at the residence of a friend or family member. One fifth (21.4%) of regional District of Columbia visitors were on a day‐trip (or just passing through) and thus did not require lodging. (Figure 5.13, Page 38)
Those whose Washington, DC trip was trip was one or more nights were asked the location(s) of where they stayed overnight. Over half of regional overnight visitors stayed in accommodations within the District of Columbia (51.8%). Of those that stayed outside the District, northern Virginia continued to be a more popular lodging destination than southern Maryland (39.3% vs. 17.2%). (Figure 5.14, Page 39)
The typical regional Washington, DC visitor surveyed spent an average of 4.5 days within the metropolitan area during their most recent trip. As regional residents don’t generally have to travel extensive distances to visit Washington, DC—and the reported purpose of many of these trips was for weekend getaways, visit friends and family, or to attend an event —this may warrant shorter trips. (Figure 5.15, Page 40)
The District of Columbia captures a significant portion of regional visitors’ overall trips. Of the 4.5 days typically spent in the metropolitan area, on average, 2.8 of those days were spent inside the District of Columbia. (Figure 5.16, Page 41)
Washington, DC visitors who stayed overnight in paid accommodations (such as a hotel or motel) reported spending $752.48 per day in the city on average. The largest proportions of this spending were on “lodging” ($252.60) and “restaurants & dining” ($146.60). (Figure 5.17, Page 42)
Visitors who did not stay in paid accommodations in the District of Columbia spent an average of $369.19 per day in the District of Columbia. This spending was largely on “restaurants & dining” ($113.28), “entertainment and sightseeing” ($71.98) and “retail purchases” ($107.99). These visitors spent less overall and on each individual spending category than their counterparts who stayed in District of Columbia hotels/motels. Given this disparity in average spending, it is clear that Destination DC can maximize in‐market visitor spending by motivating visitors to stay in District of Columbia hotels. (Figure 5.18, Page 43)
Destination Analysts, Inc. 11
Reported visitor spending covered 2.2 persons on average. Washington, DC visitors were asked how many people their reported per‐day spending in the city covered. Reported visitor spending covered 2.2 persons on average, making the mean per‐person, per day spending represented by regional District of Columbia hotels guests $346.55, and $154.14 for those who did not stay in paid accommodations within the District. (Figure 5.19, Page 44)
Nearly 60 percent of regional Washington, DC visitors also spent time in northern Virginia and/or southern Maryland on their most recent Washington, DC trip. (Figure 5.20, Page 45)
The District’s surrounding areas economically benefit from Washington, DC tourism. Those visiting northern Virginia and/or southern Maryland during their Washington, DC trip were asked how much in total they spent while in this area(s). If a respondent indicated that they stayed in paid accommodations in one of these suburbs, they were asked to specifically breakout their total spending on lodging. These suburban hotel guests spent an average of $435.90 (IN TOTAL) in northern Virginia and/or southern Maryland during their trip. (Figure 5.21, Page 46)
The typical regional District of Columbia visitor had 2.7 people in his or her travel party. By far, the greatest proportion of visitors was traveling with just one other person (45.8%). 38.7 percent were in groups of three or more, while 15.6 percent visited Washington, DC solo. (Figure 5.22, Page 47)
The vast majority of regional District of Columbia visitors—about three in four—are traveling with just adults (71.3%). While Washington, DC is primarily an adult destination, the city does, however, attract an important share of the region’s family travel market. 28.7 percent of visitors had at least one child in their party. (Figure 5.23, Page 48)
For regional travelers, interest in Washington DC's famed monuments and museums appears to be the most important motivating factor in choosing the destination. Survey respondents were asked to select (from a list) the factors that were important to their decision to make their most recent visit to the city. The most commonly selected factors were "museums" (52.7%), “monuments” (50.9%), and "history/historical attributes" (48.5%). (Figure 5.24, Page 49)
Over 60 percent or regional residents feel they are at least “somewhat familiar” with the District of Columbia as a leisure travel destination. All survey respondents were asked how familiar they are with Washington, DC as a place to visit for leisure. 19.0 percent describe themselves as “very familiar,” while 42.3 percent say they are “somewhat familiar.” About one‐in‐five regional residents feel they are “not at all familiar” with D.C. (Figure 5.25, Page 50)

Destination Analysts, Inc. 12
Washington, DC continues to enjoy a high degree of potential to attract regional travelers to visit the city for leisure in the coming year. Nearly half of survey respondents (45.2%) say they have at least some likelihood to visit Washington, DC in the next twelve months, with one‐in‐ten saying they will “certainly visit.” (Figure 5.26, Page 51)
Unaided recall of Washington, DC advertising amongst regional residents remained at a similar rate to past campaigns. 16.5 percent of survey respondents said with certainty that they recalled seeing an ad for leisure travel to Washington, DC. 17.8 percent thought they “maybe” had. 65.8 percent said they did not see any such advertisements. (Figure 5.27, Page 52)
Unaided recall of Washington, DC tourism advertising is primarily recollected in print, followed by online media. Respondents who said they recalled seeing advertising for leisure travel to Washington, DC in the past year were asked to select the media in which they had seen this advertising. As in all previous years, the most significant percentage of respondents who recalled seeing Washington, DC travel advertising said they saw an ad(s) in a magazine. Over half (55.6%) reported seeing Washington, DC travel advertisements in magazines. Half (50.4%) recalled seeing such advertising on the Internet, and 32.2 percent said they saw the advertising in a newspaper. Given these results, regional residents were fairly likely to have been exposed to Washington, DC tourism messages across multiple media. (Figure 5.28, Page 53)
Nearly identical to previous year's campaigns, 14.4 percent recalled seeing Destination DC’s ads in a magazine. Respondents were shown the print ads that comprised Destination DC’s spring and summer advertising campaign and asked whether they had seen the ads in any magazines or newspapers in the past year. As in previous studies, of the campaign media tested in the survey, print had the highest recall. (Print also enjoyed the highest levels of unaided recall, with 55.6 percent saying they saw a Washington, DC leisure ad(s) in a magazine and 32.2 percent saying they saw an ad(s) in a newspaper.) One of the factors contributing to these results is likely the wide geographic area covered by the print media used in the campaign. (Figure 5.29, Page 54)
Similarly, penetration by the campaign's newspaper advertisements reached more than one in ten regional residents. When shown the ads that ran in newsprint, fully 13.0 percent of survey respondents said they recall having seen one or more of these ads in a newspaper. (Figure 5.30, Page 55)
Digital ad recall neared print. Respondents were shown the digital advertisements used in the campaign and were asked if they had seen these ads anywhere online. 12.7 percent said they had in fact seen the banner ads online (up from 9.8 percent in 2010 and 5.9 percent in 2009). Respondents were then shown the “DC—Get Lost In It” video advertisement and were asked if they had seen this ad anywhere online. Just under one in ten regional residents (8.2%) said they recalled seeing the video in the past year. (Figure 5.31 and 5.32, Page 56‐57)
Destination Analysts, Inc. 13
Over 10 percent of residents of the New York DMA reported recall of the “DC is Blooming” pop‐up event. Respondents who live in New York, New Jersey and Connecticut were shown images of the “DC is Blooming” Pop‐up Event held in New York City and asked if they had seen this promotion. 10.8 percent of respondents in the New York DMA said they had seen this promotion. (Figure 5.33, Page 58)
With a smaller potential reach, the radio advertisement had the lowest overall recall of the campaign creative. Respondents who live in the states of New York, New Jersey, Connecticut and Georgia (the markets in which the spot ran/was targeted to) were asked to listen to the campaign's radio advertisement and asked if they had heard the advertisement. 8.2 percent of respondents said they had heard the ads, while another 7.3 percent were uncertain. (Figure 5.34, Page 59)
The advertising creative regained traction—and surpassed previous campaigns tested—as being effective at positioning Washington, DC as an attractive leisure destination. After viewing the major creative components of the campaign, respondents were asked how effective the ads are in portraying Washington, DC as a place they would enjoy visiting for leisure reasons. Over two‐thirds (68.7%) percent agreed that the 2013 campaign creative is “effective” or “very effective” in portraying Washington, DC as a place they would enjoy visiting for leisure—reversing the downward trend seen in 2010, when this figure stood at 50.1 percent (which was down significantly from 59.0 percent in 2009, and 60.4 percent in 2008). In 2013, only 6.5 percent felt the advertising was “ineffective” or “very ineffective.” (Figure 5.35, Page 60)
The advertising campaign best communicates that Washington, DC is a destination that offers a lot to see and do. As the campaign has several messaging goals that it is tasked with accomplishing, survey respondents were asked to use a scale to rate how effective the advertising was overall in portraying Washington, DC in the ways that the campaign intended. Consistent with findings in previous years, there was the most agreement that the campaign advertising effectively portrayed Washington, DC as “a place with lots to see and do” (76.9%, compared to 64.3% in 2010 and 73.7% in 2009). A majority of respondents also agreed that the ads effectively presented Washington, DC as “a place that offers a unique vacation experience” (67.1%), “a place with a vibrant food and dining scene" (66.7%), and “a place with many interesting and nightlife options” (66.2%). The campaign is less effective at portraying affordability and change messages. (Figure 5.36, Page 61)
A third of respondents (33.3%) felt that the ads made them more likely to visit Washington, DC (up from 23.1 in 2010). Only 3.5 percent said the ads had a negative effect on their likelihood to visit, while 6.9 percent were unsure. The remaining half said they were “Unchanged. I am not more or less likely to visit Washington, DC for leisure in the next 12 months.” (Figure 5.37, Page 62)

Destination Analysts, Inc. 14
The advertising was motivational to a significant number of regional Washington, DC visitors. Those survey respondents who reported having made at least one trip to the District of Columbia in the past year and who recalled seeing at least one of the ads were asked if the ad or ads they saw had in any way influenced their decision to visit Washington, DC. 44.2 percent of these persons reported that the advertising did indeed influence their decision to visit the District of Columbia. This figure remained relatively unchanged from 43.6 percent in 2010 and up from 38.2 percent in 2009. (Figure 5.38, Page 63)
The media used in the campaign appears to be reaching potential visitors at a point of influence. Those survey respondents who reported having made at least one trip to the District of Columbia in the past year and who recalled seeing at least one of the ads were asked at what point in their decision process they were when they saw this advertising. 42.9 percent report having been at a point of potential influence. (Figure 5.39, Page 64)
Public relations efforts continue to have moderate success in print and television. As the campaign included public relations outreach efforts to get Washington, DC covered in the print and television press, survey respondents were asked if they had seen a newspaper or magazine article, as well as features on television, about leisure travel to Washington, DC in the past year. 13.8 percent said that they had seen an article in print and 12.1 percent reported having seen a feature on television. (Figures 5.40 and 5.41, Pages 65 and 66)
In total, 45.3 percent or regional residents said they were “likely” or “very likely” to recommend Washington, DC as a place to visit for leisure. Another 23.6 percent said they were “somewhat likely.” (Figure 5.42, Page 67)
As Destination DC targets certain psychographic visitor profiles, survey respondents were asked to read three traveler descriptions and select which one best describes them, if any. The largest proportion of respondents “like(s) to travel for cultural and educational experiences, by visiting museums, art galleries and historic sites” (28.6 %). Following close behind, 28.3 percent “like(s) to engage in activities with my family, be outdoors away from the typical hustle‐and‐bustle of the household” and 21.0 percent “like(s) to explore major cities, full of diverse people and neighborhoods to see the real urban culture like the theatre and local arts scene.” About 17 percent felt that none of these profiles described them. (Figure 5.43, Page 68)
Travel interest in Washington, DC amongst regional residents was affected by the Federal Government shutdown. The timing of the survey coincided with the recent Federal government shutdown, following shortly after this event's end. The survey asked respondents if the political climate in Washington has affected their interest in the destination. One in five regional travelers said that they felt such an effect (22.4%). (Figure 5.44, Page 69)
The overall impact is clearly negative. The 22.4 percent of regional travelers who felt their interest in Washington DC was affected by the government shutdown were queried as to the direction of this impact. More than two thirds (69.9%) of these persons felt the effect

Destination Analysts, Inc. 15
was to make them either "significantly less interested" or "less interested" in visiting the city. The remaining travelers said they were either "more interested" or "significantly more interested" in visiting. In short, for every traveler encouraged to visit, two were discouraged by the political climate. (Figure 5.45, Page 70)
Demographic Profile of Survey Respondents
Survey respondents skewed female, with 56.1 percent being women. (Figure 6.1, Page 69)
A large proportion of survey respondents are middle‐aged, with nearly 53.7 percent above the age of 45. The mean age is 46.8 years. (Figure 6.1, Page 72)
The majority of survey respondents are employed in some capacity (55.8%). 35.7 percent are employed full‐time and another 6.8 percent are self‐employed. 13.3 percent are employed part‐time. With many survey respondents over the age of 55, 41.9 percent are not currently employed or retired. (Figure 6.2, Page 73)
Nearly three quarters of survey respondents have at least some college education. 40.6 percent hold a bachelor’s degree, including 16.4 percent who have some graduate school education or more. (Figure 6.3, Page 74)
The average annual household income of survey respondents is $56,700 with 46.3 percent having an annual household income in excess of the $50,000 threshold. (Figure 6.4, Page 75)
The vast majority (78.3%) of respondents are Caucasian. One in ten is African‐American. Asians represented 5.0 percent of respondents and Latinos 3.5 percent. (Figure 6.5, Page 76)
Approximately 5 percent of survey respondents identified as GLBT. (Figure 6.6, Page 77)
53.2 percent of survey respondents reported being married or in a domestic partnership. More than a third (41.1%) of respondents are single. 14.8 percent has children under age 18. (Figure 6.7, Page 78)

Destination Analysts, Inc. 16
Return on Investment Analysis
Advertising Effectiveness and Program ROI Evaluation
This report is the fourth advertising effectiveness study conducted for Destination DC by Destination Analysts, Inc. In this report, we present estimates of the advertising campaign’s effectiveness in attracting visitors to Washington, DC in the period from February to October, 2013. The technique employed in this study to evaluate the advertising campaigns' effectiveness is identical to what was used in previous years.
This presentation of findings begins with the core of the research—estimates of the campaign’s reach and the visitor spending it generated for Washington, DC.
Evaluating the Campaign’s Reach
The survey asked respondents (in an unaided question) if in the past 12 months they recalled seeing any advertisements (in magazines, newspapers, subway stations, movie theaters and/or online) for leisure travel to Washington, DC. 16.5 percent of respondents recalled seeing such advertisements, with an additional 17.8 percent uncertain.
These general levels of unaided recall are similar to the results emerging from the survey’s questions on aided advertising recall. Survey respondents were asked to look at the campaign’s advertisements [print, online, outdoor (New York pop‐up event), and video (online) and then indicate if they had seen the advertisements. Figure 4.1 (following) shows aided recall of the advertisements by media, or the percent of survey respondents who recalls having seen each type of advertisement.
Among the advertising types tested, the print advertisements were the most widely recalled, with 14.4 percent of all respondents having seen these ads. A total of 12.7 percent of respondents recalled seeing the campaign’s ads online, up from 9.8 percent in 2010. 8.2 percent remembered seeing the online video advertisement. The mediums of lowest overall aided recall were the campaign's New York City pop‐up event and the radio advertisements, with 3.0 percent overall recall rates. Of course, this is largely driven by this advertising only appearing in limited markets.
Section
4

Destination Analysts, Inc. 17
Figure 4.1: 2013 Overall Advertising Recall (Percent of respondents who recall seeing advertisements – Aided Recall)
Note: Figures shown here for NYC Pop‐up ads and radio are based on all respondents in all areas. Numbers shown later in this report are based on the specific DMAs where these promotions occurred
The campaign’s absolute reach was widespread. Figure 4.2 (below) shows the proportion of survey respondents in each geographic area who report seeing each type of advertisement.
Figure 4.2: Advertising Recall by Geographic Area
Note: Public relations‐related recall in this chart is unaided.
Total NY DMAPhiladelphia
DMA
Richmond
DMA
Toronto
DMA
East Coast
(minus DMAs)
Magazines 14.4% 16.9% 13.5% 11.2% 11.4% 14.1%
Newspaper 13.0% 15.9% 11.5% 11.2% 12.1% 12.5%
Online (banner ads) 12.7% 14.4% 11.8% 10.3% 10.9% 12.6%
Online (video ad) 8.2% 11.4% 6.9% 6.0% 9.9% 7.4%
NYC pop‐up event 3.0% 11.7% 2.3% 0.0% 0.0% 1.3%
Radio 3.0% 9.1% 1.1% 0.0% 0.0% 2.0%
ANY ADVERTISEMENT 24.1% 29.1% 23.2% 19.9% 21.1% 23.3%
PR ‐ magazines, newspapers, online, on
the radio or at an event16.5% 18.8% 18.3% 17.5% 15.0% 15.8%

Destination Analysts, Inc. 18
Media Overlap
In total, 14.4 percent of survey respondents recalled having seen two or more of the six advertising types tested (Figure 4.3, below). One in five (24.1%) saw one or more of the ads. The majority of residents of the overall study area did not see any of the advertisements (75.9%).
Figure 4.3: Number of Advertising Media Where Ads Were Seen
Media Effectiveness
Using the percent of survey respondents who recalled having seen Washington, DC advertisements, we can calculate estimates of the number of impressions3 each type of advertising received. The chart below shows the calculation of the cost per impression using aided awareness statistics collected in the survey. Using this method, each impression is estimated to have cost about 6 cents on average. The most expensive impressions were in magazines (8 cents) and the least expensive were in radio (1 cent).
Figure 4.4: The Cost of Advertising Impressions by Media (Aided)
Note: Reported “Impressions” are calculated as the percent of an area’s population multiplied by the proportion of survey respondents reporting that they saw an advertisement.]
3 An advertisement’s “impressions” are defined here as the geographic area’s adult population multiplied by the proportion of this population reporting having seen an advertisement.
Total NY DMAPhiladelphia
DMA
Richmond
DMA
Toronto
DMA
East Coast
(minus DMAs)
NO ADVERTISEMENTS 75.9% 70.9% 76.8% 80.1% 78.9% 76.7%
ANY ADVERTISEMENT 24.1% 29.1% 23.2% 19.9% 21.1% 23.3%
One 9.7% 11.0% 10.1% 8.9% 8.5% 9.4%
Two 6.0% 5.0% 6.8% 6.1% 5.9% 6.1%
Three 3.7% 3.7% 2.3% 2.1% 2.7% 3.9%
Four 3.1% 3.3% 3.7% 2.8% 3.9% 2.9%
Five or more 1.7% 6.1% 0.3% 0.0% 0.0% 1.0%
Reported Impressions Destination DC
InvestmentCost per Impression
Magazine 12,212,831.18 $954,749 $0.08
Online 12,721,699.14 $908,920 $0.07
Newspaper 11,025,472.59 $649,610 $0.06
Pop‐up event 2,544,339.83 $100,000 $0.04
Radio 2,544,339.83 $20,517 $0.01

Destination Analysts, Inc. 19
Return on Investment (ROI) Measurement
A key objective of this research was to estimate incremental visitation and consequent visitor spending and taxes generated by the marketing program. Incremental visitation is defined as travel to the District of Columbia that is a direct result of the advertising campaigns or, alternatively, it is visitation that would not have occurred in the absence of the advertising campaigns. Spending on such incremental trips generated income for local businesses and tax revenues for the local government, which are key indicators of the success of the advertising.
The technique used in this study to estimate incremental visitation is identical to the technique used by Destination Analysts in past years, and at its core, similar to research conducted in 2006 and 2007 by another research firm4. As the survey identifies travel that would not have happened without the advertising, the technique used here compares travel incidence between the population of persons in the geographic area of interest who were exposed to the advertising and those who were not exposed to the advertising. The level of travel among those with no ad awareness is considered the baseline, and the difference between these two groups is used to extrapolate gross incremental visitation5 to Washington, DC. The model then takes an additional step to make the estimates as conservative as possible. To do this, the model extracts from the aforementioned gross incremental visitation estimates of all visitation by leisure travelers who (1) came to Washington, DC on leisure trips which were motivated by a desire to attend a personal event, (2) extended a business trip to accommodate leisure activities, (3) had made up their mind to visit the District of Columbia before being exposed to the advertising campaign and/or (4) did not report that the advertisements influenced their decision to visit6. Hence, an adjustment factor was developed to effectively subtract this travel from gross incremental visitation. The chart following illustrates this calculation.
4 Washington, DC CTC., Ad Effectiveness & ROI Research, SMARI, October 2006 & 2007
5 Gross incremental visitation is defined here as the population aware of the advertisements multiplied by an incremental visitation factor, which is the difference in visitation levels among those who saw the advertising and those who did not. The assumption is that those who did not see advertising represent the level of baseline travel, or that which would happen with or without the ad campaign. Any higher level of travel among those who saw advertising is attributable to the advertising and is considered incremental travel. For example, in the New York DMA, 29.6 percent of those who reported seeing at least one advertisement visited Washington, DC during the period of study, while only 12.6 percent of those who did not see an ad visited. The difference between these two numbers (or17.0%) is the incremental travel factor for the New York DMA. In this study, the overall incremental travel factor for the region is calculated from the bottom up using these DMA level incremental travel factors for each DMA.
6 These data were collected for the survey respondent’s most recent trip to the District of Columbia.

Destination Analysts, Inc. 20
Calculation of Incremental Visitation
Examining survey respondent travel patterns between February and September 2013, an overall factor for incremental visitation was calculated at 13.0 percent. This figure represents the difference between persons visiting Washington, DC during the period of study who recall seeing the ads and those who do not recall seeing any advertisements. While this overall figure is informative, the design of this research also seeks to estimate incremental visitation for each of the five geographic areas studied. Figure 4.6 (following) shows this study’s estimates of incremental visitor volume and spending7. In total, we estimate that the advertising campaign generated 91,397 incremental trips, 52.3 percent of which were taken by visitors who stayed overnight inside the District of Columbia. Of the remaining 47.7 percent of trips, these incremental visitors stayed outside the District and took day trips into the city. In total, these two groups spent $80.2 million inside the District of Columbia during the period of study.
7 The model uses a bottom-up technique to calculate the gross totals for the region as a whole. Estimates prepared for each geographic region are summed to develop the overall total.
Destination Analysts, Inc. 21
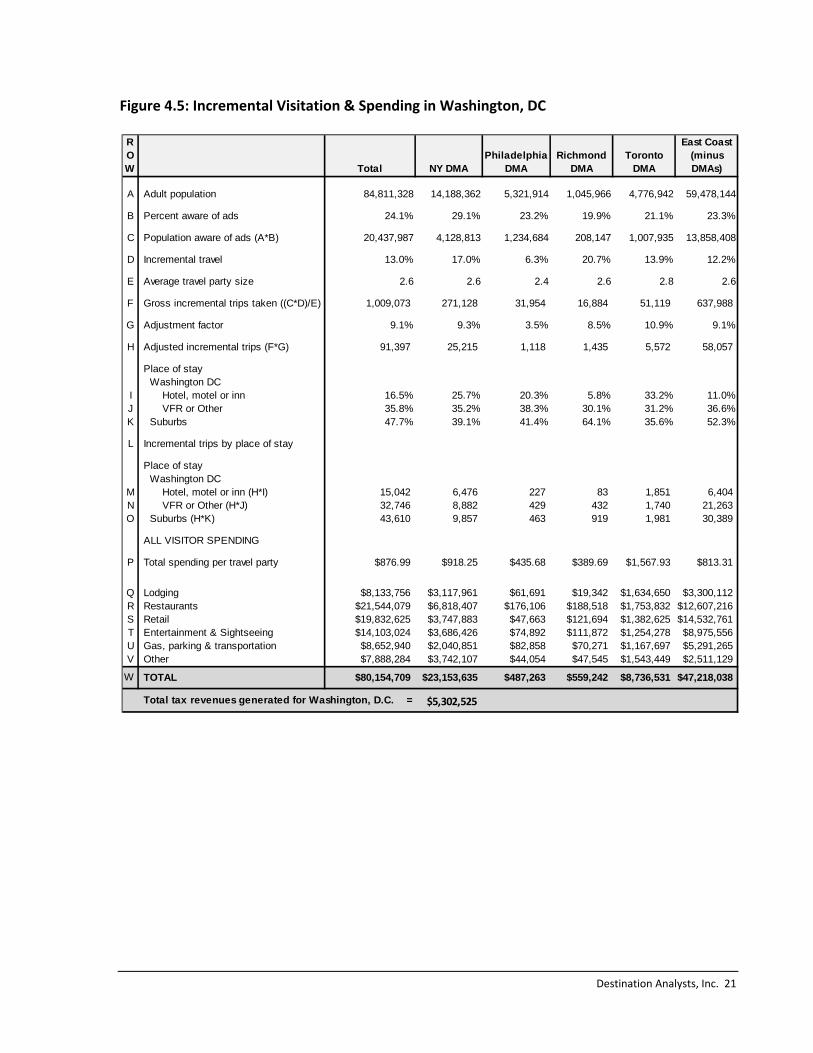
Figure 4.5: Incremental Visitation & Spending in Washington, DC
ROW Total NY DMA
Philadelphia DMA
Richmond DMA
Toronto DMA
East Coast (minus DMAs)
A Adult population 84,811,328 14,188,362 5,321,914 1,045,966 4,776,942 59,478,144
B Percent aware of ads 24.1% 29.1% 23.2% 19.9% 21.1% 23.3%
C Population aware of ads (A*B) 20,437,987 4,128,813 1,234,684 208,147 1,007,935 13,858,408
D Incremental travel 13.0% 17.0% 6.3% 20.7% 13.9% 12.2%
E Average travel party size 2.6 2.6 2.4 2.6 2.8 2.6
F Gross incremental trips taken ((C*D)/E) 1,009,073 271,128 31,954 16,884 51,119 637,988
G Adjustment factor 9.1% 9.3% 3.5% 8.5% 10.9% 9.1%
H Adjusted incremental trips (F*G) 91,397 25,215 1,118 1,435 5,572 58,057
Place of stay Washington DC
I Hotel, motel or inn 16.5% 25.7% 20.3% 5.8% 33.2% 11.0%J VFR or Other 35.8% 35.2% 38.3% 30.1% 31.2% 36.6%K Suburbs 47.7% 39.1% 41.4% 64.1% 35.6% 52.3%
L Incremental trips by place of stay
Place of stay Washington DC
M Hotel, motel or inn (H*I) 15,042 6,476 227 83 1,851 6,404 N VFR or Other (H*J) 32,746 8,882 429 432 1,740 21,263 O Suburbs (H*K) 43,610 9,857 463 919 1,981 30,389
ALL VISITOR SPENDING
P Total spending per travel party $876.99 $918.25 $435.68 $389.69 $1,567.93 $813.31
Q Lodging $8,133,756 $3,117,961 $61,691 $19,342 $1,634,650 $3,300,112R Restaurants $21,544,079 $6,818,407 $176,106 $188,518 $1,753,832 $12,607,216S Retail $19,832,625 $3,747,883 $47,663 $121,694 $1,382,625 $14,532,761T Entertainment & Sightseeing $14,103,024 $3,686,426 $74,892 $111,872 $1,254,278 $8,975,556U Gas, parking & transportation $8,652,940 $2,040,851 $82,858 $70,271 $1,167,697 $5,291,265V Other $7,888,284 $3,742,107 $44,054 $47,545 $1,543,449 $2,511,129
W TOTAL $80,154,709 $23,153,635 $487,263 $559,242 $8,736,531 $47,218,038
Total tax revenues generated for Washington, D.C. = $5,302,525

Destination Analysts, Inc. 22
Incremental Tax Revenue
Visitor spending generates taxes. The District of Columbia has several taxes which impact travelers, including a transient occupancy tax (hotel tax), retail sales taxes and taxes on dining and transportation related items. Using the detailed incremental spending estimates outlined above, we calculate the amount of taxes generated directly for the District of Columbia government from the Spring and Summer campaigns to be $5.3 million. The majority of this tax revenue came from the hotel tax ($1.2 million) and the restaurant tax ($2.2 million).
Figure 4.6: Incremental Taxes Generated for Washington, DC, 2013
Figure 4.7: Return on Investment
With a total campaign spend of $3.0 million, we calculate an overall ROI of the campaigns to the District of Columbia of $27 per dollar invested.
Total Tax Revenues Generated for
Washington DC General fund
Washington Convention
Center Authority
Lodging $1,179,395 $817,442 $361,952
Restaurants $2,154,408 $1,938,967 $215,441
Retail $1,189,958 $1,189,958 $0
Entertainment & Sightseeing $0 $0 $0
Gas, parking & transportation $778,765 $778,765 $0
Other $0 $0 $0
TOTAL $5,302,525 $4,725,132 $577,393
Tax rates used in these calculations include a 6.0% sales tax, 10% restaurant meals tax, 10% rental vehicles tax, 18% parking tax for commerical lots, and 14.5% hotel tax
2013
Incremental Visitor Spending $80,154,709
Destination DC Program Investment $3,000,007
Return on Investment (Incremental v isitor spending / DDC Investment) $27
Tax Return of Investment (Taxes generated / DDC Investment) $1.77

Destination Analysts, Inc. 23

Destination Analysts, Inc. 24
Figures 4.8 and 4.9: Return on Investment, Beyond Washington DC
As a significant number of incremental visitors stay overnight in the suburbs or take day trips to suburban areas from their trip base in Washington, DC, the advertising campaign impacted the economies of Maryland and Virginia. Given the complexities of traveler behavior while in Washington, DC’s suburbs and the diverse set of taxes in these surrounding areas, gathering the data needed to estimate visitor spending outside Washington, DC is challenging. The survey questionnaire simply asked respondents how much they spent in total and for any lodging in suburban areas. It should be noted that detailed spending estimates simply could not be gathered due to the complexities of potential visitor behavior in the suburbs. We believe therefore that the estimates presented below should be considered ballpark estimates given the limitations of the data we could collect. To allocate spending by type, the model developed to make these estimates assumes that overall traveler spending in the suburbs follows the same basic patterns as spending inside the District of Columbia. Hence, if the average traveler spent 35 percent of his non‐lodging expenditures in restaurants in Washington, DC, we assume that an average of 35 percent of total non‐lodging expenditures in the suburbs went to restaurant purchases. An identical assumption is made for each type of taxable spending. Furthermore, average tax rates for the suburbs as a whole were estimated as the simple average of six major suburban cities (Arlington, Alexandria, and Fairfax, Virginia, and Silver Spring, College Park and Bethesda, Maryland). Using these assumptions and overall spending data gathered in the survey, we estimate that the campaigns generated an additional $20.1 million in direct visitor spending for localities in the suburbs of Washington, DC. This spending in turn generated $1.4 in taxes for the cities in the metro area and their related state governments. The table following shows the complete picture of spending and taxes generated by the advertising campaign for the Washington, DC metropolitan area.
Washington
DC
Suburban Washington
DC areasTotal Program
Impact
Incremental visitor spending $80,154,709 $20,068,601 $100,223,309
Taxes generated $5,302,525 $1,373,242 $6,675,767
Percent of Total Tax Revenues Generated 79% 21%
Ratio of incremental spending to taxes generated 6.6% 6.8% 6.7%
Destination Analysts, Inc. 25
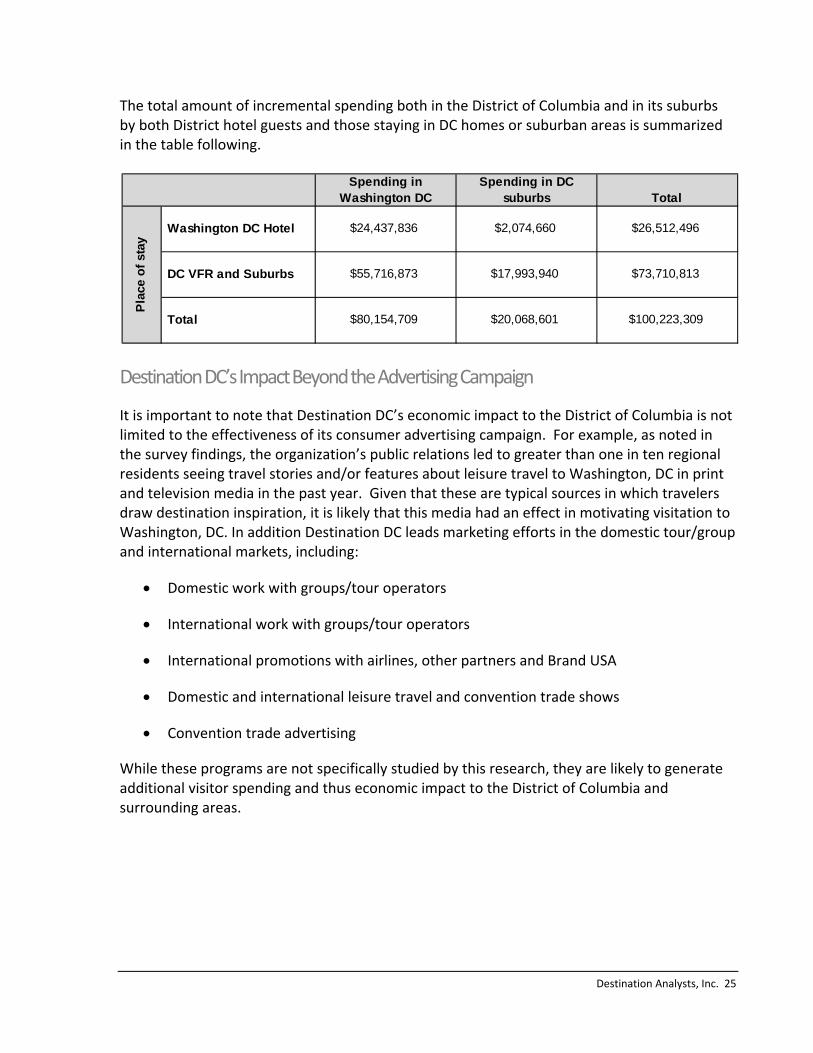
The total amount of incremental spending both in the District of Columbia and in its suburbs by both District hotel guests and those staying in DC homes or suburban areas is summarized in the table following.
Destination DC’s Impact Beyond the Advertising Campaign
It is important to note that Destination DC’s economic impact to the District of Columbia is not limited to the effectiveness of its consumer advertising campaign. For example, as noted in the survey findings, the organization’s public relations led to greater than one in ten regional residents seeing travel stories and/or features about leisure travel to Washington, DC in print and television media in the past year. Given that these are typical sources in which travelers draw destination inspiration, it is likely that this media had an effect in motivating visitation to Washington, DC. In addition Destination DC leads marketing efforts in the domestic tour/group and international markets, including:
Domestic work with groups/tour operators
International work with groups/tour operators
International promotions with airlines, other partners and Brand USA
Domestic and international leisure travel and convention trade shows
Convention trade advertising
While these programs are not specifically studied by this research, they are likely to generate additional visitor spending and thus economic impact to the District of Columbia and surrounding areas.
Spending in Washington DC
Spending in DC suburbs Total
Washington DC Hotel $24,437,836 $2,074,660 $26,512,496
DC VFR and Suburbs $55,716,873 $17,993,940 $73,710,813
Total $80,154,709 $20,068,601 $100,223,309
Pla
ce o
f st
ay

Destination Analysts, Inc. 26
Detailed Survey Results
In this section, we present the findings of the survey’s base questions in the order they were asked. These are the non‐demographic questions, or those related to respondent opinions and behaviors. A brief written analysis is included for each chart. The data presented in the following pages are the weighted results for all surveys collected, and hence are representative of the behaviors and opinions of the entire geographic areas of study.
Section
5

Destination Analysts, Inc. 27
Magazines Read in the Past Twelve Months Survey respondents were shown a list of the magazines the campaign advertising ran in and were asked to select those which they recall reading or looking through in the past year. Figure 5.1 (below) shows the percent of respondents who reported reading or looking through these magazines. Both travel and lifestyle magazines continue to be popular amongst regional residents. Nearly 60 percent reported having read at least one of the magazines on the campaign media schedule . About one in five reported reading Food & Wine and Travel + Leisure, Southern Living and New York Times‐‐The Magazine. Similar percentages (about one in ten) reported having read or looked through The New Yorker, Smithsonian Magazine, New York Magazine, Ebony and Essence.
Figure 5.1: Which of these magazines do you recall reading or looking through at least once in the past 12 months? (Select all that apply)
FIGURE 5.1 ‐ Question 4: Which of these magazines do you recall reading or looking through at least once in the past 12 months? (Select all that apply) Base: All survey respondents (weighted data). 3,876 completed surveys.

Destination Analysts, Inc. 28
Newspapers Read in the Past Twelve Months As with the magazines, respondents were then shown the newspapers used in the campaigns and asked to identify those they had read or looked through at least once in the past 12 months. Like the magazines, a significant proportion of survey respondents had read at least one of the newspapers on the campaign's media schedule in the past year. Over half (53.4%) reported having read at least one of the newspapers in the campaign’s media schedule. About one in five (23.7%) had read or looked through The New York Times. At 18.2 percent, The Wall Street Journal was the second most read newspaper. The lowest overall reported readership amongst the total survey sample was Richmond Escapes (1.6%).
Figure 5.2: Which of the printed versions of these newspapers do you recall reading or looking through at least once in the past 12 months? (Select all that apply)
FIGURE 5.2 ‐ Question 5: Which of the printed versions of these newspapers do you recall reading or looking through at least once in the past 12 months? (Select all that apply) Base: All survey respondents (weighted data). 3,876 completed surveys.

Destination Analysts, Inc. 29
Websites Visited in the Past Twelve Months Survey respondents were also shown a list of websites that the campaign’s digital advertising ran on, and asked which ones they visited at least once in the past 12 months. Newspaper websites were the most utilized of the online media tested. About one in five respondents visited USAToday.com and/or NYTimes.com. Travel websites Orbitz.com and TravelZoo.com were the third (19.9%) and fourth (11.5%) most visited websites, respectively.
Figure 5.3: Which of these websites do you recall visiting at least once in the past 12 months? (Select all that apply)
FIGURE 5.3 ‐ Question 6: Which of these websites do you recall visiting at least once in the past 12 months? (Select all that apply) Base: All survey respondents (weighted data). 3,876 completed surveys.
Destination Analysts, Inc. 30
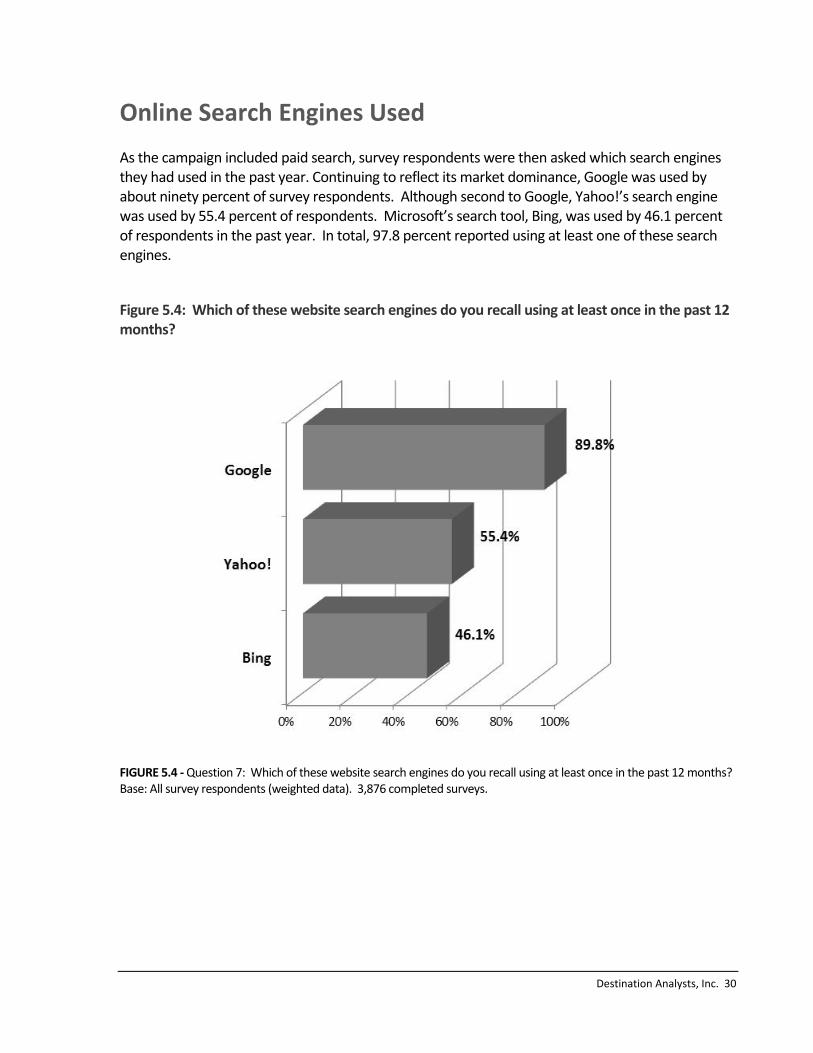
Online Search Engines Used As the campaign included paid search, survey respondents were then asked which search engines they had used in the past year. Continuing to reflect its market dominance, Google was used by about ninety percent of survey respondents. Although second to Google, Yahoo!’s search engine was used by 55.4 percent of respondents. Microsoft’s search tool, Bing, was used by 46.1 percent of respondents in the past year. In total, 97.8 percent reported using at least one of these search engines.
Figure 5.4: Which of these website search engines do you recall using at least once in the past 12 months?
FIGURE 5.4 ‐ Question 7: Which of these website search engines do you recall using at least once in the past 12 months? Base: All survey respondents (weighted data). 3,876 completed surveys.

Destination Analysts, Inc. 31
Radio Stations Listened to in Past Twelve Months Radio had a more limited potential reach. The advertising campaign included radio spots in the Atlanta market. As the chart below shows, fewer than 2 percent of the Georgia residents surveyed reported having listened to any of the three radio stations tested.
Figure 5.5: Which of these radio stations do you recall listening to at least once in the past 12 months?
FIGURE 5.5 ‐ Question 8: Which of these radio stations do you recall listening to at least once in the past 12 months? Base: All survey respondents who live in Georgia (weighted data). 3,876 completed surveys.

Destination Analysts, Inc. 32
Katz 360 Streaming The media schedule additionally included Katz 360, streaming radio programming targeted to the New York DMA. Of the survey respondents who reside in the states of New York, New Jersey and Connecticut, only 3.0 percent reported listening to this stream in the past 12 months.
Figure 5.6: In the past 12 months, have you listened to Katz 360 (streaming radio programming)?
FIGURE 5.6 ‐ Question 9: In the past 12 months, have you listened to Katz 360 (streaming radio programming)? Base: All survey respondents (weighted data). 1,017 completed surveys.

Destination Analysts, Inc. 33
Leisure Trips Taken in the Past 12 Months The East Coast/Canadian residents surveyed took an average of 2.5 leisure trips in the past year. While 25.5 percent took no leisure trips, and 20.0 percent took only one trip, a majority of adults living in the area of study travels multiple times for leisure each year (54.5%). This represents an opportune environment to market Washington, DC as an option for one or more of these trips.
Figure 5.7: In the past 12 months, how many leisure trips (vacations, weekend getaways, and trips for other personal reasons) have you taken? Please enter a numeric value below.
FIGURE 5.7 ‐ Question 10: In the past 12 months, how many leisure trips (vacations, weekend getaways, and trips for other personal reasons) have you taken? Please enter a numeric value below. Base: All survey respondents (weighted data). 3,873 completed surveys.

Destination Analysts, Inc. 34
Top Tourism Destinations To understand Washington, DC’s competitive landscape, survey respondents were asked to assume they wanted to take a trip to a domestic urban destination that offered great hotels, dining, shopping, entertainment, outdoor activities and other unique experiences, and then list the cities that first came to mind. As in all previous years, New York City continues to have a stronghold as a travel brand offering this type of destination experience, with 35.6 percent listing it as one of the cities that first came to mind. New York was again followed by Las Vegas (14.9%), and then Boston (14.6%). Washington, DC was the seventh ranked destination, with almost one‐in‐ten (9.6%) respondents selecting it as one of the top four U.S. cities that they would think of for this type of experience.
Figure 5.8: Assume that you want to take a getaway trip to an urban destination within the U.S. that offers great hotels, dining, shopping, entertainment, outdoor activities and other unique experiences. What cities first come to mind? Please list up to four (4) cities that first come to mind in the spaces below.
FIGURE 5.8 ‐ Question 11: Assume that you want to take a getaway trip to an urban destination within the U.S. that offers great hotels, dining, shopping, entertainment, outdoor activities and other unique experiences. What cities first come to mind? Base: All survey respondents (weighted data). 3,876 completed surveys.
Destination Analysts, Inc. 35
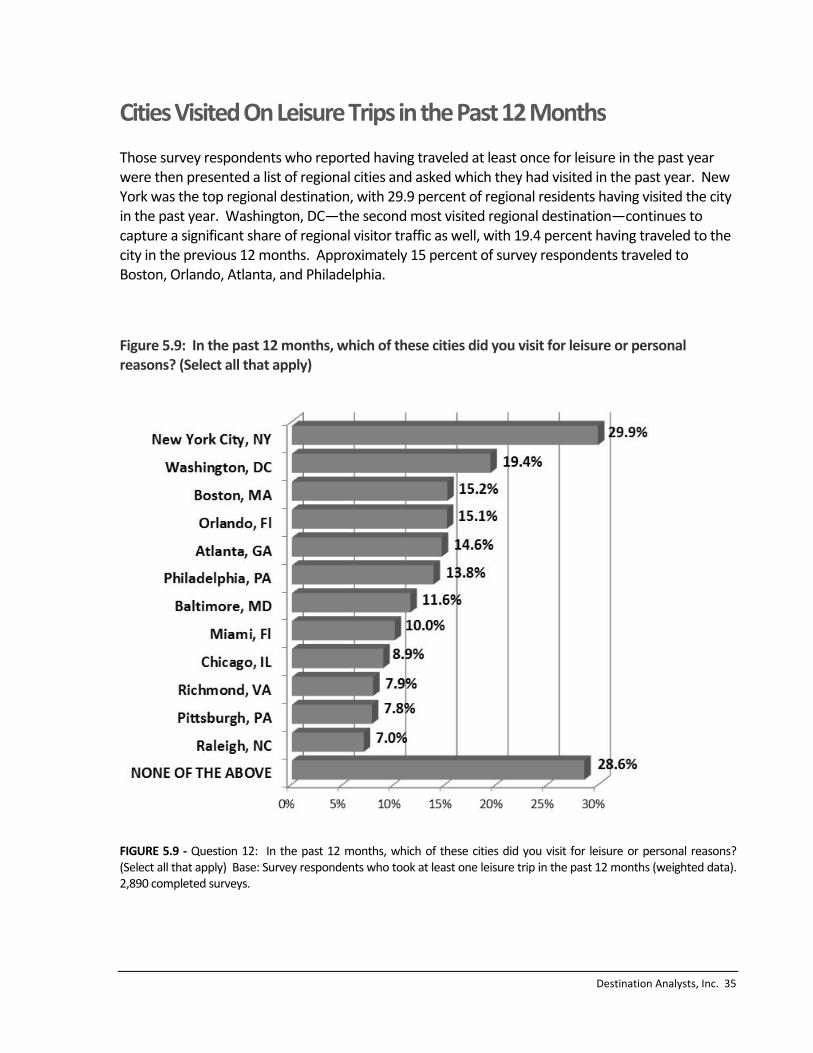
Cities Visited On Leisure Trips in the Past 12 Months Those survey respondents who reported having traveled at least once for leisure in the past year were then presented a list of regional cities and asked which they had visited in the past year. New York was the top regional destination, with 29.9 percent of regional residents having visited the city in the past year. Washington, DC—the second most visited regional destination—continues to capture a significant share of regional visitor traffic as well, with 19.4 percent having traveled to the city in the previous 12 months. Approximately 15 percent of survey respondents traveled to Boston, Orlando, Atlanta, and Philadelphia.
Figure 5.9: In the past 12 months, which of these cities did you visit for leisure or personal reasons? (Select all that apply)
FIGURE 5.9 ‐ Question 12: In the past 12 months, which of these cities did you visit for leisure or personal reasons? (Select all that apply) Base: Survey respondents who took at least one leisure trip in the past 12 months (weighted data). 2,890 completed surveys.
Destination Analysts, Inc. 36
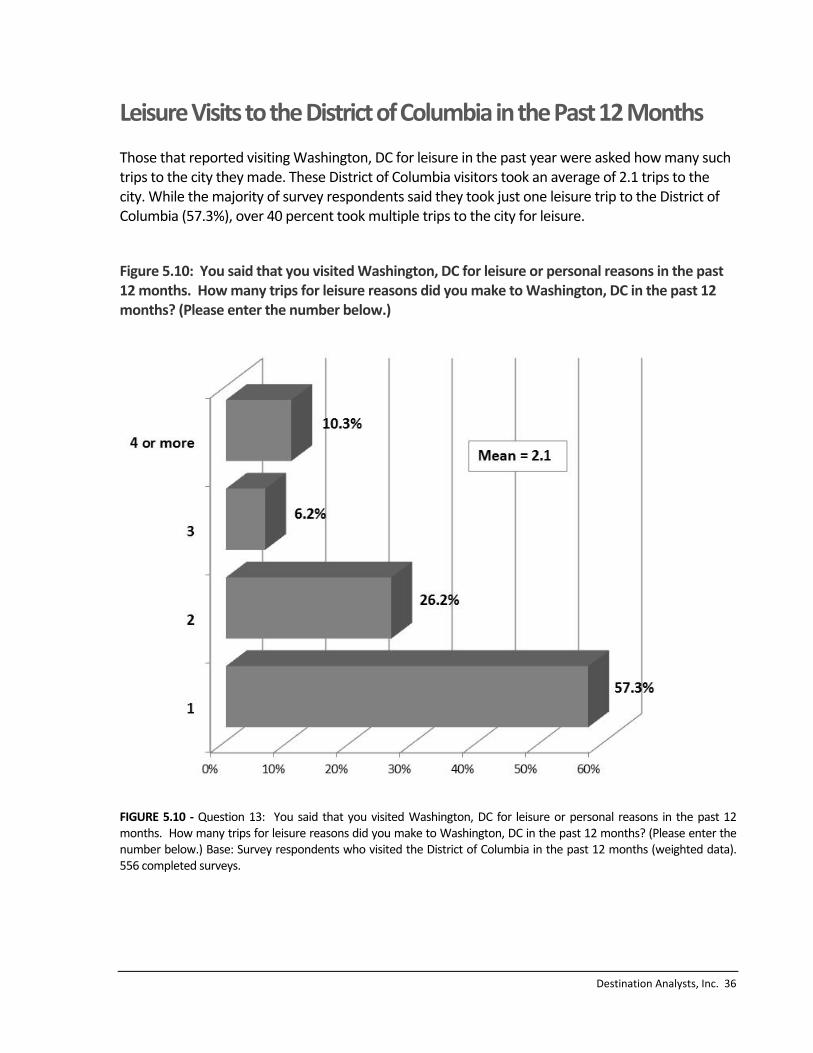
Leisure Visits to the District of Columbia in the Past 12 Months Those that reported visiting Washington, DC for leisure in the past year were asked how many such trips to the city they made. These District of Columbia visitors took an average of 2.1 trips to the city. While the majority of survey respondents said they took just one leisure trip to the District of Columbia (57.3%), over 40 percent took multiple trips to the city for leisure.
Figure 5.10: You said that you visited Washington, DC for leisure or personal reasons in the past 12 months. How many trips for leisure reasons did you make to Washington, DC in the past 12 months? (Please enter the number below.)
FIGURE 5.10 ‐ Question 13: You said that you visited Washington, DC for leisure or personal reasons in the past 12 months. How many trips for leisure reasons did you make to Washington, DC in the past 12 months? (Please enter the number below.) Base: Survey respondents who visited the District of Columbia in the past 12 months (weighted data). 556 completed surveys.

Destination Analysts, Inc. 37
Month of District of Columbia Visit Respondents who took at least one leisure trip to the District of Columbia in the past year were asked in which month(s) they visited. The current survey findings are similar to those in previous years, in which regional visitor traffic to the District was at its lowest point in February (7.6%). It reached its highest point in the spring months of April and May (20.5% and 20.1%, respectively).
Figure 5.11: In which month(s) did you visit the city of Washington, DC on a leisure trip(s)? (Select all that apply.)
FIGURE 5.11 ‐ Question 14: In which month(s) did you visit the city of Washington, DC on a leisure trip(s)? (Select all that apply.) Base: Respondents who visited the District of Columbia (weighted data). 556 completed surveys.

Destination Analysts, Inc. 38
Primary Reason for Visiting the District of Columbia Weekend getaways and visiting friends and relatives (VFR) are significant tourism drivers to Washington, DC. Respondents visiting Washington, DC in the past year were asked the primary purpose of their most recent leisure trip to the city. The most common responses to this question were "weekend getaways" (28.3%) and “visit friends or family” (26.0%). Approximately one in five respondents characterized their visit to Washington, DC as a “vacation.”
Figure 5.12: Which best describes your reason for visiting the city of Washington, DC on this most recent leisure trip?
FIGURE 5.12 ‐ Question 15: Which best describes your reason for visiting the city of Washington, DC on this most recent leisure trip? Base: Respondents who visited the District of Columbia (weighted data). 556 completed surveys.

Destination Analysts, Inc. 39
Place of Stay—All District of Columbia Visitors As a significant number of regional Washington, DC visitors came to the city for a weekend getaway or special event/festival on their most recent trip, the greatest proportion of visitors stayed overnight and in paid accommodations (54.1%). With 26.0 percent reporting coming to Washington, DC specifically to visit friends and family, a similar percent (28.0%) stayed overnight at the residence of a friend or family member. One fifth (21.4%) of regional District of Columbia visitors were on a day‐trip (or just passing through) and thus did not require lodging.
Figure 5.13: On this trip to the Washington, DC area, in what type of lodging did you stay? (Select all that apply)
FIGURE 5.13 ‐ Question 16: On this trip to the Washington, DC area, in what type of lodging did you stay? (Select all that apply) Base: Respondents who visited the District of Columbia (weighted data). 556 completed surveys.

Destination Analysts, Inc. 40
Location of Place of Stay—District of Columbia Visitors Staying Overnight (Non Day‐Trip) Those whose Washington, DC trip was trip was one or more nights were asked the location(s) of where they stayed overnight. Over half of regional overnight visitors stayed in accommodations within the District of Columbia (51.8%). Of those that stayed outside the District, northern Virginia continued to be a more popular lodging destination than southern Maryland (39.3% vs. 17.2%).
Figure 5.14: On this trip to the Washington, DC area, where did you stay overnight? (Select all that apply)
FIGURE 5.14 ‐ Question 17: On this trip to the Washington, DC area, where did you stay overnight? (Select all that apply) Base: Respondents who stayed overnight in the Washington, DC area (weighted data). 437 completed surveys.

Destination Analysts, Inc. 41
Total Days Spent In Washington, DC Metro Area—All District of Columbia Visitors The typical regional District of Columbia visitor surveyed spent an average of 4.5 days within the metropolitan area. As Regional residents don’t generally have to travel extensive distances to visit Washington, DC—and the reported purpose of many of these trips was for weekend getaways, visit friends and family, or to attend an event —this may warrant shorter trips.
Figure 5.15: How many days total did you stay in the Washington, DC metropolitan area? Please enter a numeric value below.
FIGURE 5.15 ‐ Question 18: How many days total did you stay in the Washington, DC metropolitan area? Please enter a numeric value below. Base: Respondents who visited the District of Columbia (weighted data). 539 completed surveys.

Destination Analysts, Inc. 42
Total Days Spent Inside the District of Columbia—All District of Columbia Visitors The District of Columbia captures a significant portion of regional visitors’ overall trips. Of the 3.4 days typically spent in the metropolitan area, on average, 2.8 of those days were spent inside the District of Columbia.
Figure 5.16: How many of these days were spent inside the city of Washington, DC?
FIGURE 5.16 ‐ Question 19: How many of these days were spent inside the city of Washington, DC? Base: Respondents who visited the District of Columbia (weighted data). 524 completed surveys.

Destination Analysts, Inc. 43
District of Columbia Hotel Guest Visitor Spending in the District Per Day—Visitors who Stayed in Paid Accommodations within the District of Columbia Washington, DC visitors who stayed overnight in paid accommodations (such as a hotel or motel) within the District of Columbia were asked to report their per‐day spending across several categories. Visitors spent $752.48 per day in the city on average. The largest proportions of this spending were on “lodging” ($252.60) and “restaurants & dining” ($146.60).
Figure 5.17: Approximately how much PER DAY did you spend on the following while in the city of Washington, DC? (Please do not include any spending outside the District of Columbia, e.g., any expenses incurred in Virginia or Maryland.)
FIGURE 5.17 ‐ Question 20: Approximately how much PER DAY did you spend on the following while in the city of Washington, DC? (Please do not include any spending outside the District of Columbia, e.g., any expenses incurred in Virginia or Maryland.) Base: Respondents who stayed overnight in the District of Columbia (weighted data). 226 completed surveys.

Destination Analysts, Inc. 44
Non‐District of Columbia Hotel Guest Visitor Spending in the District Per Day—Day‐Trip Visitors and Visitors who Stayed Overnight in Suburbs
Visitors who did not stay in paid accommodations in the District of Columbia were also asked to report their per day spending inside the District. These visitors spent less overall and on each individual spending category than their counterparts who stayed in District of Columbia hotels/motels. These visitors spent on average $369.19 per day in the District of Columbia, largely on “restaurants & dining” ($113.28), “entertainment and sightseeing” ($71.98) and “retail purchases” ($107.99). Given this disparity in average spending, it is clear that Destination DC can maximize in‐market visitor spending generated by motivating visitors to stay in District of Columbia hotels.
Figure 5.18: Approximately how much PER DAY did you spend on the following while in the city of Washington, DC? (Please do not include any spending outside the District of Columbia, e.g. any expenses incurred in Virginia or Maryland.)
FIGURE 5.18 ‐ Question 22: Approximately how much PER DAY did you spend on the following while in the city of Washington, DC? (Please do not include any spending outside the District of Columbia, e.g. any expenses incurred in Virginia or Maryland.) Base: Respondents who did not stay in paid accommodations in the District of Columbia (weighted data). 330 completed surveys.

Destination Analysts, Inc. 45
Number of People Respondent’s Spending Covered—All District of Columbia Visitors District of Columbia visitors were then asked how many people their per‐day spending in the city covered. Reported visitor spending covered 2.2 persons on average, making the mean per‐person, per day spending represented by regional District of Columbia hotels guests $346.55, and $154.14 for those who did not stay in paid accommodations within the District.
Figure 5.19: How many people did this spending cover (including yourself)?
FIGURE 5.19 ‐ Questions 21 and 23: How many people did this spending cover (including yourself)? Base: Respondents who visited the District of Columbia (weighted data). 554 completed surveys.

Destination Analysts, Inc. 46
Maryland and/or Virginia Visitation—All District of Columbia Visitors To gauge potential economic impact to surrounding areas by tourism to Washington, DC, regional District of Columbia visitors were then asked if they spent any time in northern Virginia or southern Maryland on their most recent Washington, DC trip. 59.9 percent of these visitors indeed traveled to an area neighboring the District of Columbia during their trip.
Figure 5.20: On this trip, did you spend any time in northern Virginia (e.g. Alexandria, Arlington, Fairfax, Tysons Corner, etc.) and/or southern Maryland (e.g. Bethesda, Silver Spring, Rockville, National Harbor, etc.)?
FIGURE 5.20 ‐ Question 24: On this trip, did you spend any time in suburban Virginia (e.g. Alexandria, Arlington, Fairfax, Tysons Corner) or Maryland (e.g. Bethesda, Silver Spring, Rockville)? Base: Respondents who visited the District of Columbia (weighted data). 556 completed surveys.

Destination Analysts, Inc. 47
Spending in Maryland and/or Virginia—District of Columbia Visitors who Traveled to Suburbs Those visiting northern Virginia and/or southern Maryland during their Washington, DC trip were then asked how much in total they spent while in this area(s). If a respondent indicated that they stayed in paid accommodations in one of these suburbs, they were asked to specifically breakout their total spending on lodging. These suburban hotel guests spent an average of $435.90 (IN TOTAL) in northern Virginia and/or southern Maryland during their trip.
Figure 5.21: On this trip, approximately how much did you spend IN TOTAL while in northern Virginia and/or southern Maryland? (Please DO NOT INCLUDE any spending inside the District of Columbia.)
FIGURE 5.21 ‐ Questions 25 and 26: On this trip, approximately how much did you spend IN TOTAL while in northern Virginia and/or southern Maryland? (Please DO NOT INCLUDE any spending inside the District of Columbia.) Base: Respondents who visited the District of Columbia who spent time in suburban Virginia and/or Maryland (weighted data). 330 completed surveys from suburban hotel guests and 226 completed surveys from District of Columbia hotel guests.
Mean = $435.90

Destination Analysts, Inc. 48
Number of People in Travel Party The typical regional District of Columbia visitor had 2.7 people in his or her travel party. By far, the greatest proportion of visitors was traveling with just one other person (45.8%). 38.7 percent were in groups of three or more while 15.6 percent visited Washington, DC solo.
Figure 5.22: How many people were in your immediate travel party (including yourself)?
FIGURE 5.22 ‐ Question 27: How many people were in your immediate travel party (including yourself?) Base: Respondents who visited the District of Columbia (weighted data). 553 completed surveys.
Destination Analysts, Inc. 49
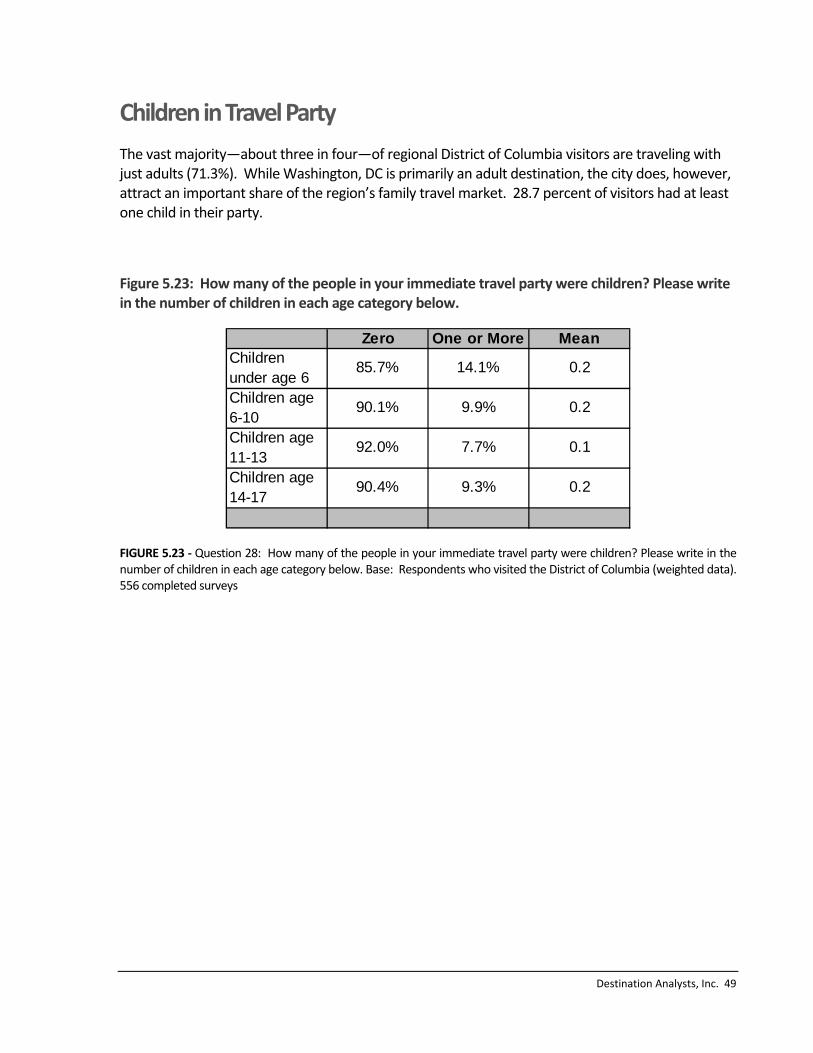
Children in Travel Party
The vast majority—about three in four—of regional District of Columbia visitors are traveling with just adults (71.3%). While Washington, DC is primarily an adult destination, the city does, however, attract an important share of the region’s family travel market. 28.7 percent of visitors had at least one child in their party.
Figure 5.23: How many of the people in your immediate travel party were children? Please write in the number of children in each age category below.
FIGURE 5.23 ‐ Question 28: How many of the people in your immediate travel party were children? Please write in the number of children in each age category below. Base: Respondents who visited the District of Columbia (weighted data). 556 completed surveys
Zero One or More MeanChildren under age 6
85.7% 14.1% 0.2
Children age 6-10
90.1% 9.9% 0.2
Children age 11-13
92.0% 7.7% 0.1
Children age 14-17
90.4% 9.3% 0.2
Destination Analysts, Inc. 50
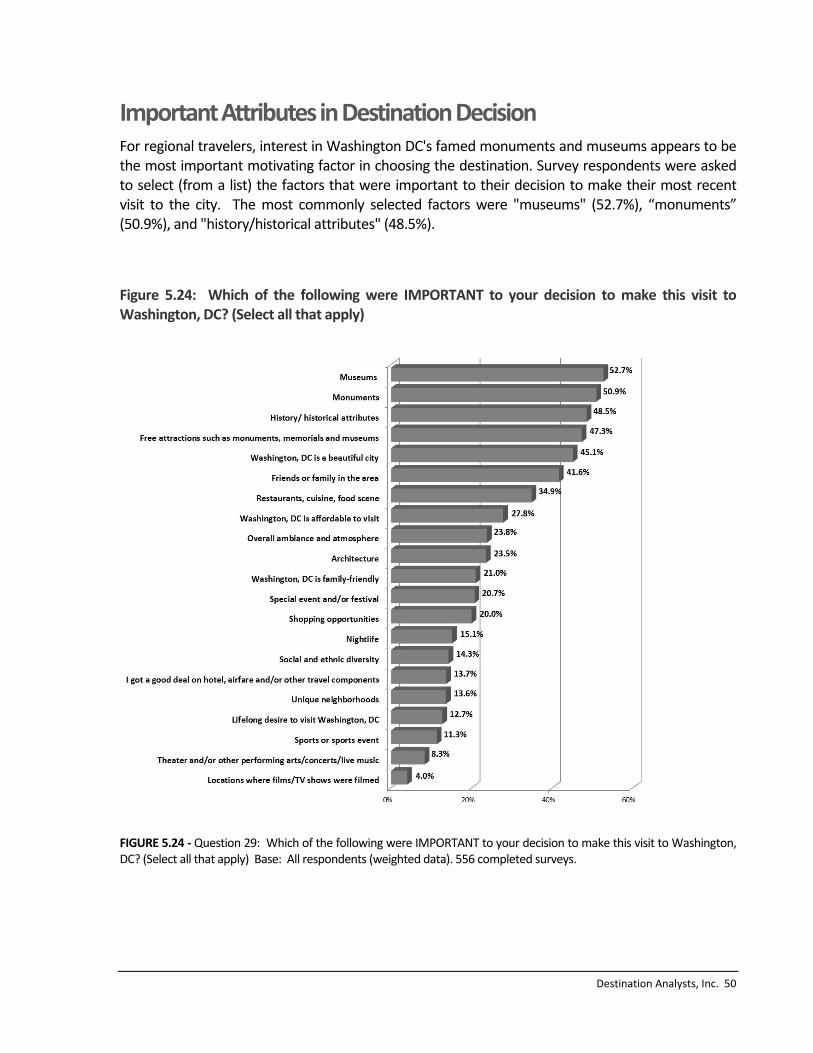
Important Attributes in Destination Decision For regional travelers, interest in Washington DC's famed monuments and museums appears to be the most important motivating factor in choosing the destination. Survey respondents were asked to select (from a list) the factors that were important to their decision to make their most recent visit to the city. The most commonly selected factors were "museums" (52.7%), “monuments” (50.9%), and "history/historical attributes" (48.5%).
Figure 5.24: Which of the following were IMPORTANT to your decision to make this visit to Washington, DC? (Select all that apply)
FIGURE 5.24 ‐ Question 29: Which of the following were IMPORTANT to your decision to make this visit to Washington, DC? (Select all that apply) Base: All respondents (weighted data). 556 completed surveys.

Destination Analysts, Inc. 51
Familiarity with Washington, DC
All survey respondents were asked how familiar they are with Washington, DC as a place to visit for leisure. Over 60 percent feels they are at least “somewhat familiar” with the District of Columbia as a leisure destination; of these, 19.0 percent describe themselves as “very familiar.” About one‐in‐five regional residents feel they are “not at all familiar” with D.C.
Figure 5.25: How familiar are you with Washington, DC as a place to visit for leisure? (Select one)
FIGURE 5.25 ‐ Question 30: How familiar are you with Washington, DC as a place to visit for leisure? (Select one) Base: All respondents (weighted data). 3,876 completed surveys.

Destination Analysts, Inc. 52
Likelihood to Visit Washington, DC in the Next 12 Months Washington, DC continues to enjoy a high degree of potential to attract regional visitors for leisure in the coming year. Nearly half of survey respondents (45.2%) say they have at least some likelihood to visit Washington, DC in the next twelve months, with one‐in‐ten saying they will “certainly visit.”
Figure 5.26: How likely are you to visit Washington, DC for leisure or personal reasons in the next 12 months? (Select one)
FIGURE 5.26 ‐ Question 31: How likely are you to visit Washington, DC for leisure or personal reasons in the next 12 months? (Select one) Base: All respondents (weighted data). 3876 completed surveys.

Destination Analysts, Inc. 53
Recall of Washington, DC Advertisements (Unaided) Unaided recall of Washington, DC advertising amongst regional residents remained at a similar rate to past campaigns. 16.5 percent of survey respondents said with certainty that they recalled seeing an ad for leisure travel to Washington, DC. 17.8 percent thought they “maybe” had. 65.8 percent said they did not see any of these advertisements.
Figure 5.27: In the past 12 months, do you recall seeing and/or hearing any advertisements (in magazines, newspapers, online, on the radio or at an event) for leisure travel to Washington, DC?
FIGURE 5.27 ‐ Question 32: In the past 12 months, do you recall seeing and/or hearing any advertisements (in magazines, newspapers, online, on the radio or at an event) for leisure travel to Washington, DC? Base: All respondents (weighted data). 3,876 completed surveys.

Destination Analysts, Inc. 54
Advertising Media Recall (Unaided) Respondents who said they recalled seeing advertising for leisure travel to Washington, DC in the past year were asked to select the media in which they had seen this advertising. As in all previous years, the most significant percentage of respondents who recalled seeing Washington, DC travel advertising said they saw an ad(s) in a magazine (55.6%). Half (50.4%) recalled seeing such advertising on the Internet, and 32.2 percent said they saw the advertising in a newspaper. Given these results, regional residents were fairly likely to have been exposed to Washington, DC tourism messages across multiple media.
Figure 5.28: Where did you see and/or hear this advertising? (Select each of the following media in which you recall having seen a Washington, DC travel advertisement in the past 12 months.)
FIGURE 5.28 ‐ Question 33: Where did you see and/or hear this advertising? (Select each of the following media in which you recall having seen a Washington, DC travel advertisement in the past 12 months.) Base: Respondents who saw leisure travel advertisements for Washington, DC (weighted data). 638 completed surveys.

Destination Analysts, Inc. 55
Recall of Magazine Advertisements Respondents were shown the print ads that comprised the campaign and asked whether they had seen the ads in any magazines in the past year. Nearly identical to previous year's campaigns, 14.4 percent recalled seeing these magazine ads. As in years past, of the campaign media tested in the survey, print had the highest recall. [Print also enjoyed the highest levels of unaided recall, with 55.6 percent saying they saw a Washington, DC leisure ad(s) in a magazine and 32.2 percent saying they saw an ad(s) in a newspaper.] One of the factors contributing to these results is likely the wide geographic area covered by the print media used in the campaign.
Figure 5.29: During the past 12 months, do you recall having seen any of these advertisements in any magazines?
FIGURE 5.29 ‐ Question 34: During the past 12 months, do you recall having seen any of these advertisements in any magazines? Base: All respondents (weighted data). 3,876 completed surveys.

Destination Analysts, Inc. 56
Recall of Newspaper Advertisements Similarly, penetration by the campaign's newspaper advertisements reached more than one in ten regional residents. Fully 13.0 percent of survey respondents said they recall having seen one or more of the ads in a newspaper.
Figure 5.30: During the past 12 months, do you recall having seen any of these advertisements in any printed newspapers?
FIGURE 5.30 ‐ Question 35: During the past 12 months, do you recall having seen any of these advertisements in any printed newspapers? Base: All respondents (weighted data). 3,876 completed surveys.

Destination Analysts, Inc. 57
Recall of Digital Advertisements Respondents were then shown the digital advertisements used in the campaign and were asked if they had seen these ads anywhere online. One in ten respondents (12.7%) said they had in fact seen these ads online, up from 9.8 percent in 2010 and 5.9 percent in 2009.
Figure 5.31: During the past 12 months, do you recall having seen this advertisement anywhere online?
FIGURE 5.31 ‐ Question 36: During the past 12 months, do you recall having seen this advertisement anywhere online? Base: All respondents (weighted data). 3,876 completed surveys.

Destination Analysts, Inc. 58
Recall of Online Video Advertisement Respondents were then shown the DC—Get Lost in it video advertisement and asked if they had seen this ad anywhere online. Just under one in ten regional residents (8.2%) said they recalled seeing the video online in the past year.
Figure 5.32: During the past 12 months, do you recall having seen this advertisement anywhere online?
FIGURE 5.32 ‐ Question 37: During the past 12 months, do you recall having seen this advertisement anywhere online? Base: All respondents (weighted data). 3,876 completed surveys.

Destination Analysts, Inc. 59
Recall of New York City Pop‐up Event Respondents who live in New York, New Jersey and Connecticut were shown images of the “DC is Blooming” Pop‐up Event held in New York City. They were then asked if they had seen this promotion. 10.8 percent of respondents in the New York DMA said they had seen this promotion.
Figure 5.33: Do you recall having seen this event in New York City at some point in the past 12 months?
FIGURE 5.33 ‐ Question 38: Do you recall having seen this event in New York City at some point in the past 12 months? Base: All respondents (weighted data). 3,876 completed surveys.

Destination Analysts, Inc. 60
Recall of Radio Advertisements Respondents who live in the states of New York, New Jersey, Connecticut and Georgia (the markets in which the spot ran/was targeted to) were asked to listen to the campaign's radio advertisement and asked if they had heard the advertisement. 8.2 percent of respondents said they had heard the ads, while another 7.3 percent were uncertain.
Figure 5.34: During the past 12 months, do you recall having heard this advertisement?
FIGURE 5.34 ‐ Question 39: During the past 12 months, do you recall having heard this advertisement? Base: All respondents in NY, NJ, CT and GA. (weighted data). 3,876 completed surveys.

Destination Analysts, Inc. 61
Advertising’s Overall Effectiveness After viewing the major creative components of the campaign, respondents were asked how effective the ads are in portraying Washington, DC as a place they would enjoy visiting for leisure reasons. The advertising creative regained traction—and surpassed previous campaigns tested—as being effective at positioning Washington, DC as an attractive leisure destination. Over two‐thirds (68.7%) percent agreed that the 2013 campaign creative is “effective” or “very effective” in portraying Washington, DC as a place they would enjoy visiting for leisure—reversing the downward trend seen in 2010, when this figure stood at 50.1 percent (which was down significantly from 59.0 percent in 2009, and 60.4 percent in 2008). In 2013, only 6.5 percent felt the advertising was “ineffective” or “very ineffective.”
Figure 5.35: After viewing this series of advertisements, overall, how effective do you think these advertisements are in portraying Washington, DC as a place you would enjoy visiting for leisure reasons? (Select one)
FIGURE 5.35 ‐ Question 41: After viewing this series of advertisements, overall, how effective do you think these advertisements are in portraying Washington, DC as a place you would enjoy visiting for leisure reasons? (Select one) Base: All respondents (weighted data). 3,876 completed surveys.

Destination Analysts, Inc. 62
Advertising’s Effectiveness in Communicating Campaign’s Central Messages The campaign has several messaging goals that it is tasked with accomplishing. Survey respondents were asked to use a scale to rate how effective the advertising was overall in portraying Washington, DC in the ways that the campaign intended. Figure 5.36 below shows the percent of respondents who said that the advertising portrayed each messaging aspect “effectively” or “very effectively.” Consistent with findings in previous years, there was the most agreement that the campaign advertising effectively portrayed Washington, DC as “a place with lots to see and do” (76.9%, compared to 64.3% in 2010 and 73.7% in 2009). A majority of respondents also agreed that the ads effectively presented Washington, DC as “a place that offers a unique vacation experience” (67.1%), “a place with a vibrant food and dining scene" (66.7%), and “a place with many interesting and nightlife options” (66.2%). The campaign is less effective at portraying affordability and change messages.
Figure 5.36: Overall, how effective do you think these advertisements are in portraying the following aspects of Washington, DC? (Please use the five point scale below where 1 represents “Very ineffectively” and 5 represents “Very effectively”) The advertisements portray this aspect of Washington, DC…
FIGURE 5.36 ‐ Question 42: Overall, how effective do you think these advertisements are in portraying the following aspects of Washington, DC? (Please use the five point scale below where 1 represents “Very ineffectively” and 5 represents “Very effectively”) The advertisements portray this aspect of Washington, DC… Base: All respondents (weighted data). 3,876 completed surveys.

Destination Analysts, Inc. 63
Advertisements’ Effect on Likelihood to Visit Washington, DC Survey respondents were asked how the ads they viewed would affect their likelihood to visit Washington, DC in the next year. A third of respondents (33.3%) felt that the ads made them more likely to visit Washington, DC (up from 23.1 in 2010). Only 3.5 percent said the ads had a negative effect on their likelihood to visit, while 6.9 percent were unsure. The remaining half said they were “Unchanged. I am not more or less likely to visit Washington, DC for leisure in the next 12 months.”
Figure 5.37: How did the advertisements you viewed today affect your likelihood to visit Washington, DC for leisure in the next 12 months? (Select one)
FIGURE 5.37 ‐ Question 43: How did the advertisements you viewed today affect your likelihood to visit Washington, DC for leisure in the next 12 months? (Select one) Base: All respondents (weighted data). 3,876 completed surveys.
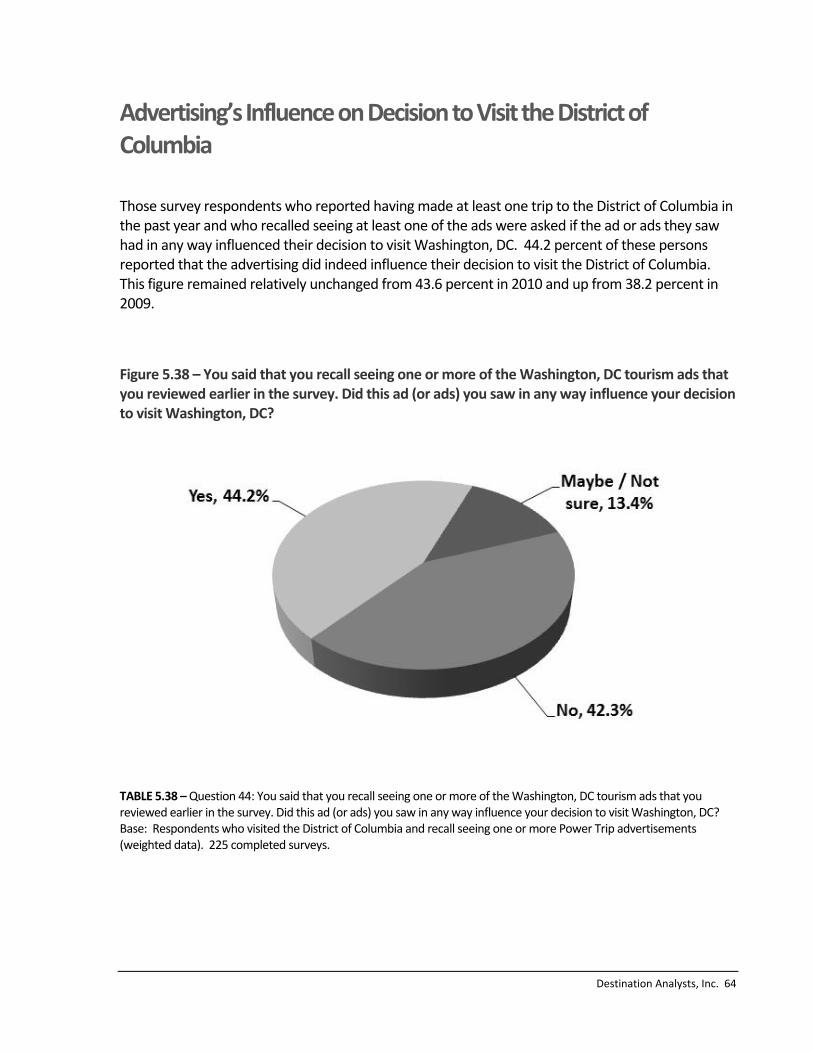
Destination Analysts, Inc. 64
Advertising’s Influence on Decision to Visit the District of Columbia
Those survey respondents who reported having made at least one trip to the District of Columbia in the past year and who recalled seeing at least one of the ads were asked if the ad or ads they saw had in any way influenced their decision to visit Washington, DC. 44.2 percent of these persons reported that the advertising did indeed influence their decision to visit the District of Columbia. This figure remained relatively unchanged from 43.6 percent in 2010 and up from 38.2 percent in 2009.
Figure 5.38 – You said that you recall seeing one or more of the Washington, DC tourism ads that you reviewed earlier in the survey. Did this ad (or ads) you saw in any way influence your decision to visit Washington, DC?
TABLE 5.38 – Question 44: You said that you recall seeing one or more of the Washington, DC tourism ads that you reviewed earlier in the survey. Did this ad (or ads) you saw in any way influence your decision to visit Washington, DC? Base: Respondents who visited the District of Columbia and recall seeing one or more Power Trip advertisements (weighted data). 225 completed surveys.

Destination Analysts, Inc. 65
Point in Travel Decision When Exposed to Advertising Those survey respondents who reported having made at least one trip to the District of Columbia in the past year and who recalled seeing at least one of the ads were asked at what point in their decision process they were when they saw this advertising. 42.9 percent report having been at a point of potential influence.
Figure 5.39 ‐ When you saw the advertisement(s) for Washington, DC, where were you in the process of deciding to travel? Please select the one option that best describes where you were in your travel decision.
FIGURE 5.39 ‐ Question 45: When you saw the advertisement(s) for Washington, DC, where were you in the process of deciding to travel? Please select the one option that best describes where you were in your travel decision. Base: Respondents who visited the District of Columbia and recall seeing one or more Power Trip advertisements (weighted data). 225 completed surveys.

Destination Analysts, Inc. 66
Recall of Travel Articles about Washington, DC The campaign included public relations outreach efforts to get Washington, DC covered in the print and television press. This continues to have moderate success in print. 13.8 percent of survey respondents reported having seen a newspaper or magazine article about leisure travel to Washington, DC in the past year. Figure 5.40 – In the past 12 months, do you recall seeing any travel articles in newspapers or magazines featuring leisure travel to Washington, DC?
FIGURE 5.40 ‐ Question 46: In the past 12 months, do you recall seeing any travel articles in newspapers or magazines featuring leisure travel to Washington, DC? Base: All respondents (weighted data). 3,876 completed surveys.

Destination Analysts, Inc. 67
Recall of Television Features about Washington, DC As PR efforts also extended to television press, respondents were asked if they recalled seeing any leisure travel features on television about Washington, DC. In total, 12.1 percent reported having seen such a story on television.
Figure 5.41 – In the past 12 months, do you recall seeing any travel stories or features on television about leisure travel to Washington, DC?
FIGURE 5.41 ‐ Question 47: In the past 12 months, do you recall seeing any travel stories or features on television about leisure travel to Washington, DC? Base: All respondents (weighted data). 3,876 completed surveys.

Destination Analysts, Inc. 68
Likelihood to Recommend Washington, DC Survey respondents were asked how likely they would be to recommend Washington, DC as a place to visit. In total, 45.3 percent said they were “likely” or “very likely” to do so; another 23.6 percent said they were “somewhat likely.”
Figure 5.42 – How likely are you to recommend Washington, DC as a place to visit to family members, friends and/or colleagues? (Select one)
FIGURE 5.42 ‐ Question 48: How likely are you to recommend Washington, DC as a place to visit to family members, friends and/or colleagues? (Select one) Base: All respondents (weighted data). 3,876 completed surveys.

Destination Analysts, Inc. 69
Traveler Psychographics As Destination DC targets certain psychographic visitor profiles, survey respondents were asked to read three traveler descriptions and select which one best describes them, if any. The largest proportion of respondents “like(s) to travel for cultural and educational experiences, by visiting museums, art galleries and historic sites” (28.6 %). Following close behind, 28.3 percent “like(s) to engage in activities with my family, be outdoors away from the typical hustle‐and‐bustle of the household” and 21.0 percent “like(s) to explore major cities, full of diverse people and neighborhoods to see the real urban culture like the theatre and local arts scene.” About 17 percent felt that none of these profiles described them.
Figure 5.43 – Which of the following traveler descriptions best describes you?
FIGURE 5.43 ‐ Question 49: Which of the following traveler descriptions best describes you? Base: All respondents (weighted data). 3,876 completed surveys.

Destination Analysts, Inc. 70
Influence of Political Climate on Interest in Washington, DC The timing of the survey coincided with the recent Federal government shutdown, following shortly after this event's end. The survey asked respondents if the political climate in Washington, DC has affected their interest in the destination. One in five regional travelers said that they felt such an effect (22.4%).
Figure 5.43 – Has the recent political climate in Washington, DC affected your interest in visiting Washington, DC for leisure?
FIGURE 5.43 ‐ Question 58: Has the recent political climate in Washington, DC affected your interest in visiting Washington, DC for leisure? Base: All respondents (weighted data). 3,876 completed surveys.
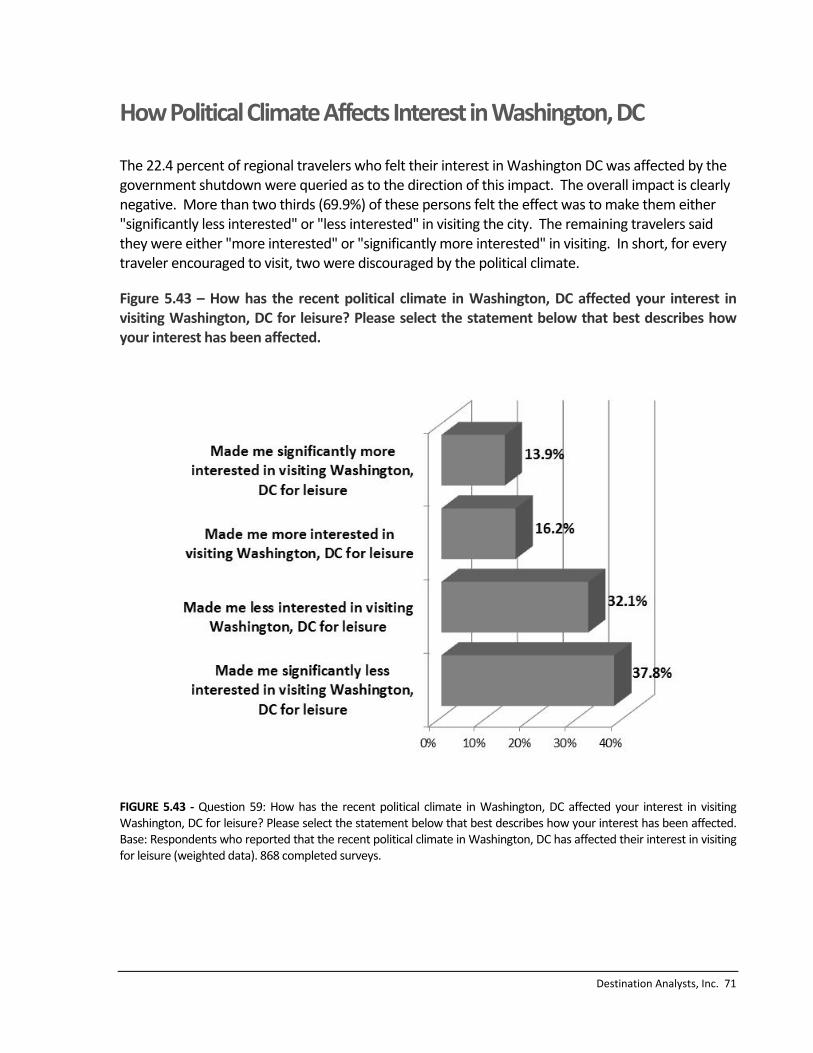
Destination Analysts, Inc. 71
How Political Climate Affects Interest in Washington, DC The 22.4 percent of regional travelers who felt their interest in Washington DC was affected by the government shutdown were queried as to the direction of this impact. The overall impact is clearly negative. More than two thirds (69.9%) of these persons felt the effect was to make them either "significantly less interested" or "less interested" in visiting the city. The remaining travelers said they were either "more interested" or "significantly more interested" in visiting. In short, for every traveler encouraged to visit, two were discouraged by the political climate.
Figure 5.43 – How has the recent political climate in Washington, DC affected your interest in visiting Washington, DC for leisure? Please select the statement below that best describes how your interest has been affected.
FIGURE 5.43 ‐ Question 59: How has the recent political climate in Washington, DC affected your interest in visiting Washington, DC for leisure? Please select the statement below that best describes how your interest has been affected. Base: Respondents who reported that the recent political climate in Washington, DC has affected their interest in visiting for leisure (weighted data). 868 completed surveys.
Destination Analysts, Inc. 72
Demographics
This section presents a demographic profile of survey respondents. The findings of the survey’s demographic questions are presented in the order they were asked.
Section
6
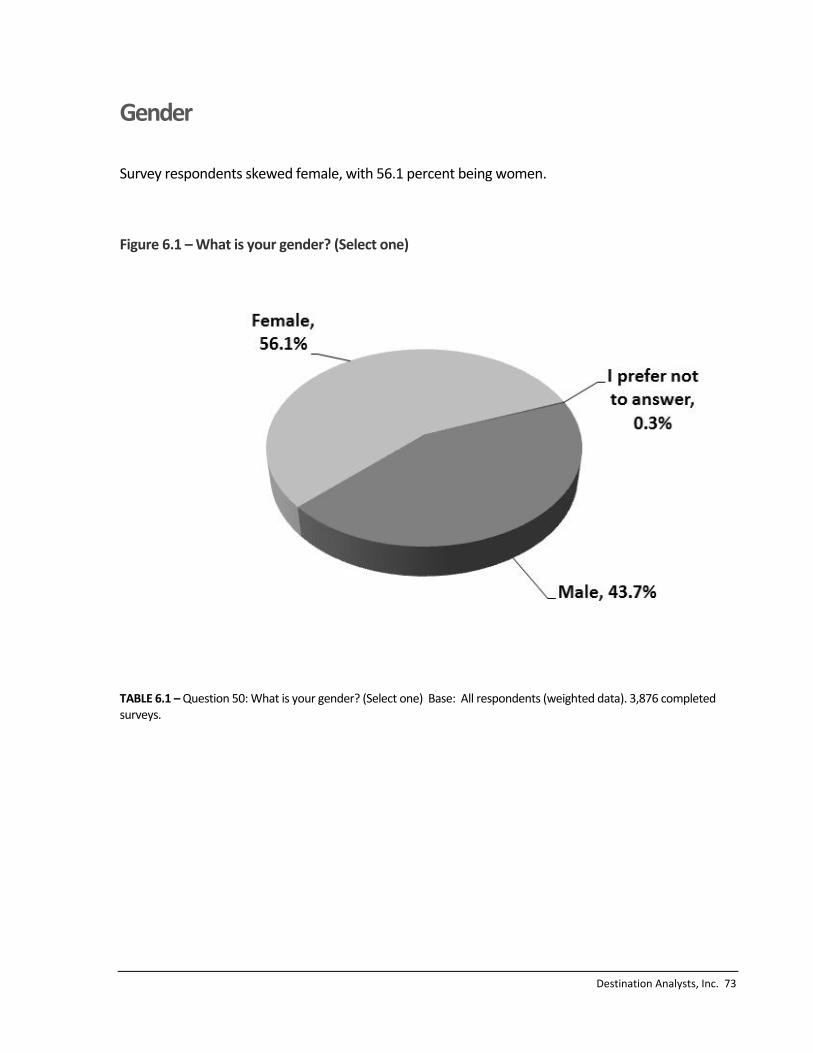
Destination Analysts, Inc. 73
Gender
Survey respondents skewed female, with 56.1 percent being women.
Figure 6.1 – What is your gender? (Select one)
TABLE 6.1 – Question 50: What is your gender? (Select one) Base: All respondents (weighted data). 3,876 completed surveys.

Destination Analysts, Inc. 74
Age A large proportion of survey respondents are middle‐aged, with nearly 53.7 percent above the age of 45. The mean age is 46.8 years.
Figure 6.2 – Which best describes your age? (Select one)
FIGURE 6.2 ‐ Question 51: Which best describes your age? (Select one.) Base: All respondents (weighted data). 3,876 completed surveys.

Destination Analysts, Inc. 75
Employment Status he majority of survey respondents are employed in some capacity (55.8%). 35.7 percent are employed full‐time and another 6.8 percent are self‐employed. 13.3 percent are employed part‐time. With many survey respondents over the age of 55, 41.9 percent are not currently employed or retired.
Figure 6.3 – Which best describes your current employment status? (Select one)
FIGURE 6.3 ‐ Question 52: Which best describes your current employment status? (Select one) Base: All respondents (weighted data). 3,876 completed surveys.
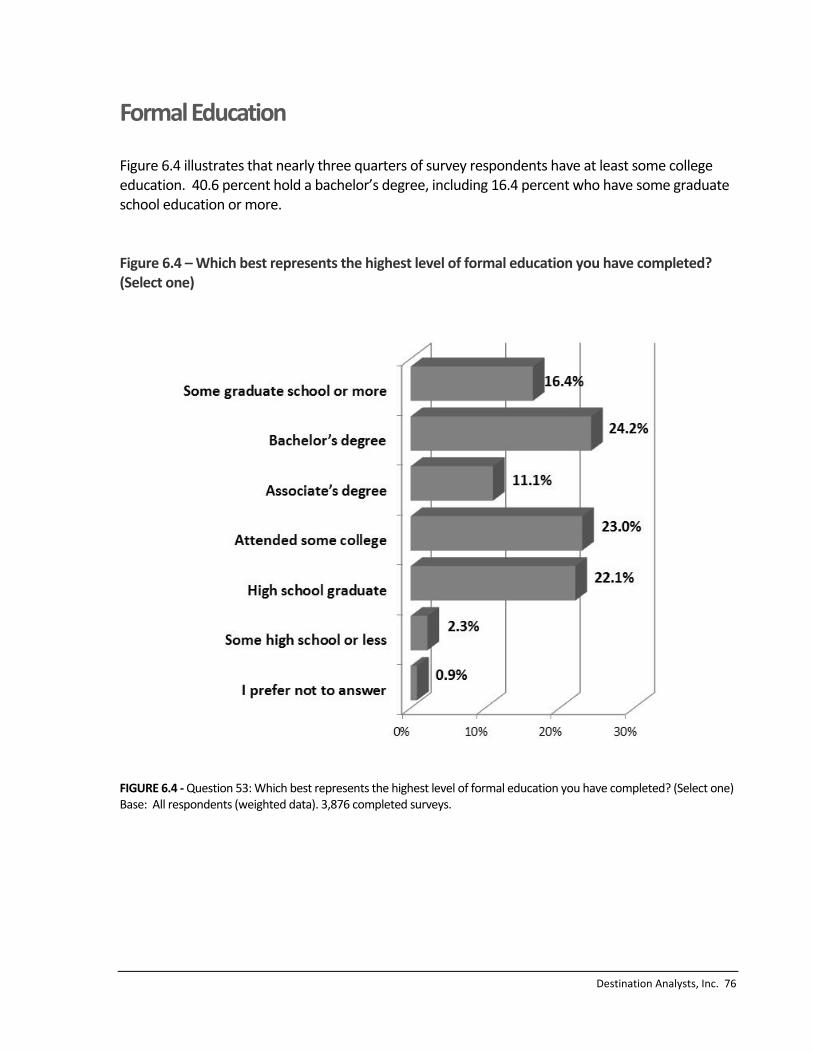
Destination Analysts, Inc. 76
Formal Education Figure 6.4 illustrates that nearly three quarters of survey respondents have at least some college education. 40.6 percent hold a bachelor’s degree, including 16.4 percent who have some graduate school education or more. Figure 6.4 – Which best represents the highest level of formal education you have completed? (Select one)
FIGURE 6.4 ‐ Question 53: Which best represents the highest level of formal education you have completed? (Select one) Base: All respondents (weighted data). 3,876 completed surveys.
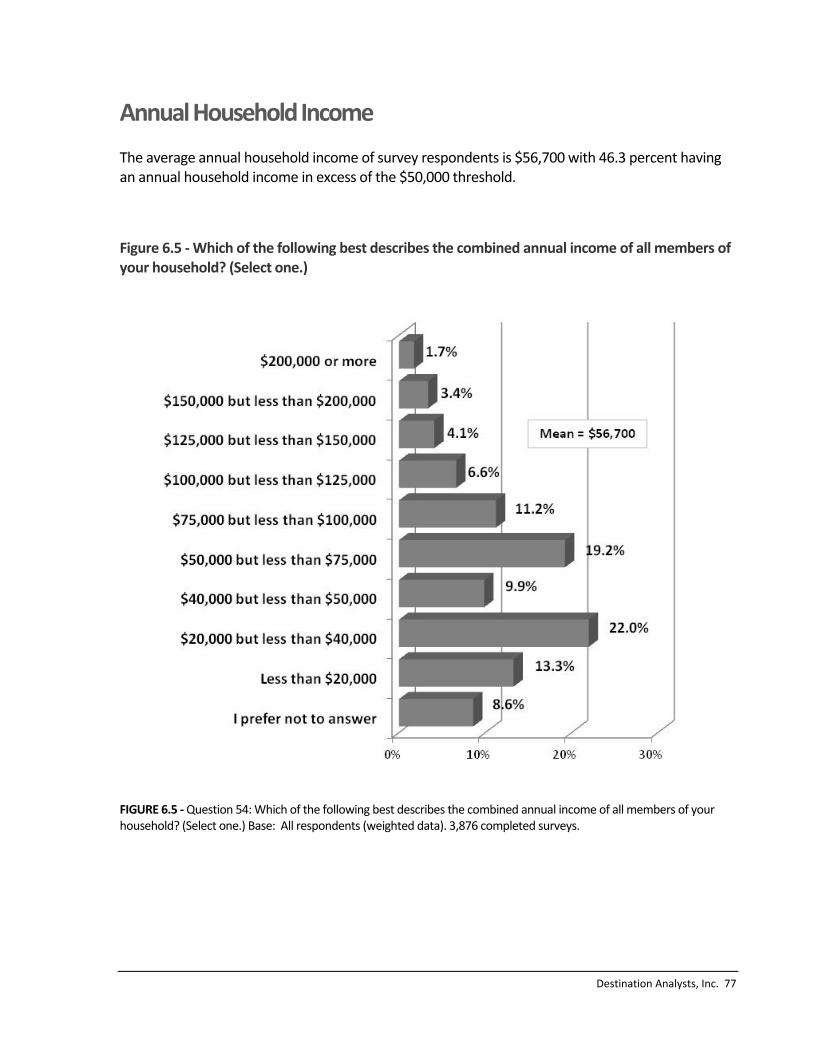
Destination Analysts, Inc. 77
Annual Household Income The average annual household income of survey respondents is $56,700 with 46.3 percent having an annual household income in excess of the $50,000 threshold.
Figure 6.5 ‐ Which of the following best describes the combined annual income of all members of your household? (Select one.)
FIGURE 6.5 ‐ Question 54: Which of the following best describes the combined annual income of all members of your household? (Select one.) Base: All respondents (weighted data). 3,876 completed surveys.
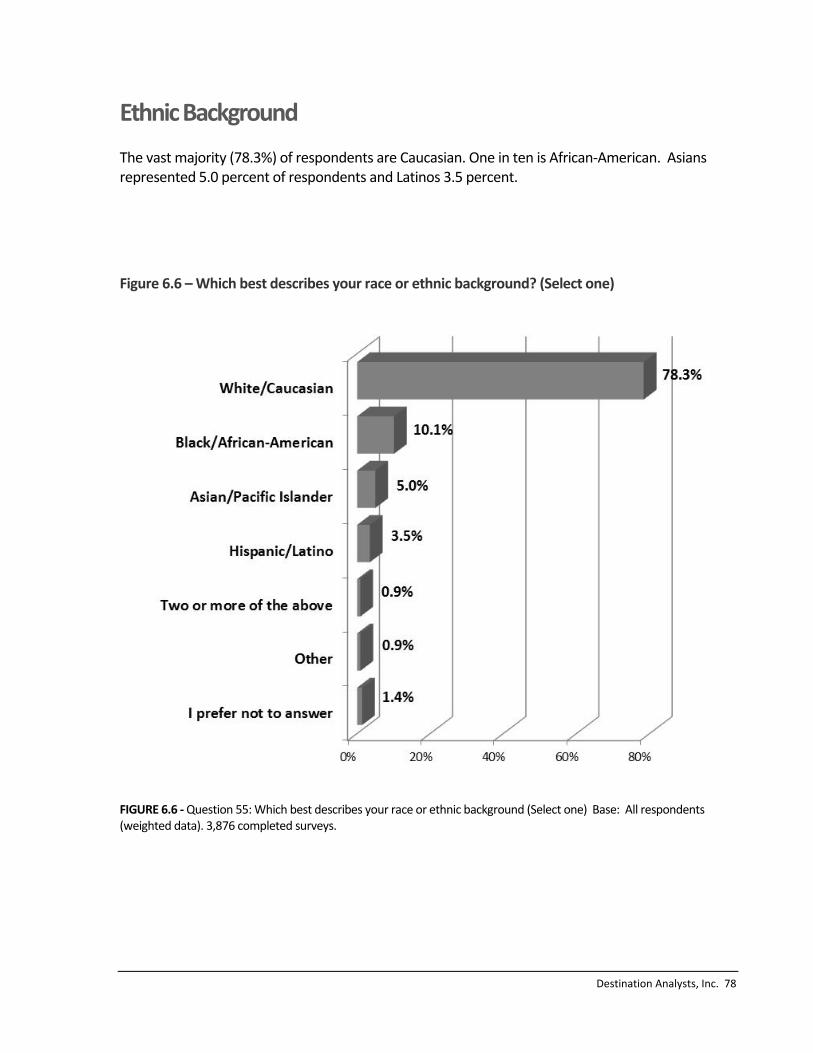
Destination Analysts, Inc. 78
Ethnic Background The vast majority (78.3%) of respondents are Caucasian. One in ten is African‐American. Asians represented 5.0 percent of respondents and Latinos 3.5 percent.
Figure 6.6 – Which best describes your race or ethnic background? (Select one)
FIGURE 6.6 ‐ Question 55: Which best describes your race or ethnic background (Select one) Base: All respondents (weighted data). 3,876 completed surveys.

Destination Analysts, Inc. 79
GLBT Approximately 5 percent of survey respondents identified as GLBT.
Figure 6.7: Which best describes you? (Select one)
FIGURE 6.7 ‐ Question 56: Which best describes you? (Select one) Base: All survey respondents (weighted data). 3,876 completed surveys.

Destination Analysts, Inc. 80
Marital Status Figure 6.8 (below) shows the proportion of survey respondents in each marital status category. 53.2 percent of survey respondents reported being married or in a domestic partnership. More than a third (41.1%) of respondents are single. 14.8 percent has children under age 18.
Figure 6.8 ‐ Which best describes your current marital status? (Select one)
FIGURE 6.8 ‐ Question 57: Which of the following best describes your current marital status? (Select one.) Base: All respondents (weighted data). 3,876 completed surveys.

Destination Analysts, Inc. 81
Appendix I: Comparison to Past Studies The table below shows key results from Destination DC’s advertising effectiveness research over the past six years. The research technique used changed in 2008. We therefore suggest that caution be used in any attempt to draw inter‐year comparison between the studies conducted prior to 2008. However, as a reference, the table below shows key information and statistics from and about the four waves of research.
2006 2007 2008 2009 2010 2013
Survey field dates October Sept./Oct. Dec. Sept./Oct. Sept./Oct. Nov.
Data collection technique Online survey Online survey Online survey Online survey Online survey Online survey
Sample size 600 597 4,556 4,123 3,931 3,876
Campaign period May-Sept May-Sept Apr-Dec May-Sept May-Sept Feb-Aug
Percent of population v isiting DC 20.7% 17.4% 19.0% 16.2% 15.0% 19.4%
Overall advertising awareness 26.0% 17.3% 19.0% 20.6% 20.2% 24.1%
Incremental travel 7.8% 7.6% 8.1% 9.0% 9.2% 13.0%
Visitor spending per trip $748 $760 $678 $635 $799 $876.99
Total v isitor spending in DC $350.8 million $217.8 million $53,368,884 $58,806,159 $52,030,202 $80,154,709
Total advertising spending $987,939 $550,000 $1,339,057 $1,338,057 $1,430,416 $3,000,007
ROI (Economic impact/Ad spending) $355.0 $396.0 $39.9 $48.4 $36.4 $26.72
Taxes generated for Washington D.C. $9,299,792 $4,989,086 $3,734,568 $4,145,633 $3,130,395 4,956,407
Section
7

Destination Analysts, Inc. 82
Appendix II: Subsamples and Reliability The estimates emerging from this study are based on weighted data from a large sample collected across the region and in targeted metropolitan areas. The table below shows the samples collected and corresponding data reliability calculated at a 95% confidence level.
New York DMA 674 +/- 3.77%
Philadelphia DMA 651 +/- 3.84%
Richmond DMA 653 +/- 3.84%
Toronto DMA 659 +/- 3.82%
Other East Coast areas 1,239 +/- 2.78%
Total 3,876 +/- 1.57%
Confidence Interval (95% Confidence
Level)
Overall Sample size
Section
8
Destination Analysts, Inc. 83
Appendix III: Survey Questionnaire
The complete survey questionnaire is presented following.
Section
9

Destination Analysts, Inc. 84
Travel Survey Thank you for your help with this survey. Please carefully read each question and review any images or other media shown to you. The survey will take about 15 minutes to complete. 1) Are you 18 years of age or older? Yes
No
2) In which state do you reside? Connecticut
Delaware
District of Columbia
Georgia
Maryland
Massachusetts
New Jersey
New York
North Carolina
Ohio
Pennsylvania
Rhode Island
South Carolina
Virginia
West Virginia
NONE OF THESE
3) What is your home zip code? ____________________________________________________________ 4) Which of these magazines do you recall reading or looking through at least once in the past 12 months? (Select all that apply) Amtrak Arrive
Boston Magazine

Destination Analysts, Inc. 85
Conde Nast Traveler
Ebony Magazine
Essence Magazine
Food & Wine
New York Magazine
New York Times--The Magazine
The New Yorker
Passport Magazine
Philadelphia Magazine
Richmond Magazine
Smithsonian Magazine
Southern Living
Travel + Leisure
Washington Flyer
Washington Parent Magazine
5) Which of these newspapers do you recall reading or looking through at least once in the past 12 months? (Select all that apply) Atlanta Journal Constitution
Bergen Record
Boston Globe
Boston Herald
Boston Metro
Connecticut Post
Discover Richmond Magazine
New Jersey Star Ledger
New York Daily News
New York Metro

Destination Analysts, Inc. 86
New York Post
New York Times
Newsday
Philadelphia Inquirer
Philadelphia Metro
Richmond Escapes
Richmond Times Dispatch
The Wall Street Journal
6) Which of these websites do you recall visiting at least once in the past 12 months? (Select all that apply) BostonGlobe.com
BostonMag.com
NewYorkDaily.com
NYTimes.com
Orbitz.com
PassportMagazine.com
Philly.com
Sherman's Travel
Smithsonian.com
TravelandLeisure.com
TravelZoo
USAToday.com
7) Which of these website search engines do you recall using at least once in the past 12 months? Bing
Yahoo!
Destination Analysts, Inc. 87
8) Which of these radio stations do you recall listening to at least once in the past 12 months? WALR-FM
WAOK
WPZE-FM
9. In the past 12 months, have you listened to Katz 360 (streaming radio programming)?
Yes
No
10) In the past 12 months, how many leisure trips (vacations, weekend getaways, and trips for other personal reasons) have you taken? Please enter a numeric value below. ____________________________________________________________Leisure Trips 11) Assume that you want to take a getaway trip to an urban destination within the U.S. that offers great hotels, dining, shopping, entertainment, outdoor activities and other unique experiences. What cities first come to mind? Please list up to four (4) cities that first come to mind in the spaces below.
City:
___________________________________
City:
___________________________________
City:
___________________________________
City:
___________________________________
12) In the past 12 months, which of these cities did you visit for leisure or personal reasons? (Select all that apply) Atlanta, GA
Baltimore, MD
Boston, MA
Chicago, IL

Destination Analysts, Inc. 88
Miami, Fl
New York City, NY
Orlando, Fl
Philadelphia, PA
Pittsburgh, PA
Raleigh, NC
Richmond, VA
Washington, DC
NONE OF THE ABOVE
13) You said that you visited Washington, DC for leisure or personal reasons in the past 12 months. How many trips for leisure reasons did you make to Washington, DC in the past 12 months? (Please enter the number below.) ____________________________________________________________Leisure Trips
14) In which month(s) did you visit Washington, DC on a leisure trip(s)? (Select all that apply) September 2012
October 2012
November 2012
December 2012
January 2013
February 2013
March 2013
April 2013
May 2013
June 2013
July 2013
August 2013
Destination Analysts, Inc. 89
September 2013
October 2013
The next questions will ask you about the most recent leisure trip you took to Washington, DC in the past 12 months. Thus, if you took more than one trip to Washington, DC in the past 12 months, please only consider your most recent trip in your responses. 15) Which best describes your reason for visiting Washington, DC on this most recent leisure trip? Vacation
Weekend getaway
Visit friends or family
Attend an event (fair/festival, sporting event, concert)
Attend a personal event or wedding
Add-on to a business trip
16) On this trip to the Washington, DC area, in what type of lodging did you stay? (Select all that apply) Paid accommodations (such as a hotel, motel or inn)
Residence of friend or family member
None of these (I was on a day trip or just passing through)
17) On this trip to the Washington, DC area, where did you stay overnight? (Select all that apply)
Inside the city of Washington, DC
Outside the city of Washington, DC--in northern Virginia (e.g. Alexandria, Arlington, Fairfax, Tysons Corner, etc.)
Outside the city of Washington, DC--in southern Maryland (e.g. Bethesda, Silver Spring, Rockville, National Harbor, etc.)
Other
18) How many totals days did you stay in the Washington, DC metropolitan area? Please enter a numeric value below.
Destination Analysts, Inc. 90
____________________________________________________________Days 19) How many of these days were spent inside the city of Washington, DC? ____________________________________________________________Days 20) Approximately how much PER DAY did you spend on the following while in the city of Washington, DC? (Please do not include any spending outside the District of Columbia, e.g. any expenses incurred in Virginia or Maryland.)
Lodging (before tax) $___________________________________per day in Washington, DC
Restaurants & dining $___________________________________per day in Washington, DC
Retail purchases $___________________________________per day in Washington, DC
Entertainment & sightseeing $___________________________________per day in Washington, DC
Gas, parking & local transportation $___________________________________per day in Washington, DC
Other $___________________________________per day in Washington, DC
21) How many people did this spending cover (including yourself)? ____________________________________________________________people 22) Approximately how much PER DAY did you spend on the following while in the city of Washington, DC? (Please do not include any spending outside the District of Columbia, e.g. any expenses incurred in Virginia or Maryland.)
Restaurants & dining $___________________________________per day in Washington, DC
Retail purchases $___________________________________per day in Washington, DC
Entertainment & sightseeing $___________________________________per day in Washington, DC
Gas, parking & local transportation
$___________________________________per day in Washington, DC
Other $___________________________________per day in Washington, DC
Destination Analysts, Inc. 91
23) How many people did this spending cover (including yourself)? ____________________________________________________________people 24) On this trip, did you spend any time in northern Virginia (e.g. Alexandria, Arlington, Fairfax, Tysons Corner) or southern Maryland (e.g. Bethesda, Silver Spring, Rockville)?
Yes
No
25) On this trip, approximately how much did you spend IN TOTAL while in northern Virginia or southern Maryland? (Please DO NOT INCLUDE any spending inside the District of Columbia)
Total spending in northern Virginia or southern Maryland:
$ ___________________________________
26) On this trip, approximately how much did you spend IN TOTAL while in northern Virginia or southern Maryland? (Please DO NOT INCLUDE any spending inside the District of Columbia)
Lodging (before tax): $ ___________________________________All other spending: $ ___________________________________
27) How many people were in your immediate travel party (including yourself)? ____________________________________________________________people 28) How many of the people in your immediate travel party were children? Please write in the number of children in each age category below. Children under age 6: ____________________
Children age 6-10: ____________________
Children age 11-13: ____________________
Children age 14-17: ____________________
Destination Analysts, Inc. 92
29) Which of the following were IMPORTANT to your decision to make this visit to Washington, DC? (Select all that apply) Architecture
Friends or family in the area
I got a good deal on hotel, airfare and/or other travel components
Lifelong desire to visit Washington, DC
Locations where films/TV shows were filmed
Washington, DC is affordable to visit
Washington, DC is family-friendly
History/ historical attributes
Museums
Monuments
Restaurants, cuisine, food scene
Shopping opportunities
Social and ethnic diversity
Special event and/or festival
Sports or sports event
Theater and/or other performing arts/concerts/live music
Unique neighborhoods
Nightlife
Overall ambiance and atmosphere
Washington, DC is a beautiful city
Free attractions such as monuments, memorials and museums
30) How familiar are you with Washington, DC as a place to visit for leisure? Very familiar
Somewhat familiar
Somewhat unfamiliar

Destination Analysts, Inc. 93
Not at all familiar
31) How likely are you to visit Washington, DC for leisure or personal reasons in the next 12 months? Will certainly visit
Very likely
Somewhat likely
Somewhat unlikely
Very unlikely
Will not visit
I don’t know
32) In the past 12 months, do you recall seeing any advertisements (in magazines, newspapers, movie theaters, subway stations and/or online) for leisure travel to Washington, DC? Yes
No
Maybe / Not sure
33) Where did you see and/or hear this advertising? (Select each of the following media in which you recall having seen a Washington, DC travel advertisement in the past 12 months.) Magazine
Newspaper
Internet
Radio
Event
None of the above
We would like to ask you a few questions about some recent Washington, DC travel advertisements. Please click the “VIEW ADVERTISEMENT” button below and carefully examine SIX print advertisements. The ads will be shown in a new window or tab. Use the arrow buttons on the right side of the page to move to the next ad. After reviewing these six ads, please answer the question below.

Destination Analysts, Inc. 94
34) During the past 12 months, do you recall having seen any of these advertisements in any magazines? Yes
No
Maybe / Not sure
Please click the “VIEW ADVERTISEMENT” button below and carefully examine NINE print advertisements. The ads will be shown in a new window or tab. Use the arrow buttons on the right side of the page to move to the next ad. After reviewing these nine ads, please answer the question below.
35) During the past 12 months, do you recall having seen any of these advertisements in any printed newspapers? Yes
No
Maybe / Not sure
Now please click the “VIEW ADVERTISEMENT” button below and carefully examine the SIX digital advertisements that will appear. The ads will be shown in a new window or tab. Scroll down the page to view all six digital ads. After reviewing these six ads, please answer the question below.
36) During the past 12 months, do you recall having seen these advertisements anywhere online?

Destination Analysts, Inc. 95
Yes
No
Maybe / Not sure
Now please click the “VIEW ADVERTISEMENT” button below and carefully watch the video advertisement that will appear. The ad will begin playing in a new window or tab. After reviewing this ad, please answer the question below.
37) During the past 12 months, do you recall having seen this advertisement anywhere online? Yes
No
Maybe / Not sure
Now please click the “VIEW ADVERTISEMENT” button below and carefully examine the four images that will appear. The images will be shown in a new window or tab. Scroll down the page to view all four images. After reviewing these four images, please answer the question below.
38) Do you recall having seen this event in New York City at some point in the past 12 months?
Yes
No
Maybe / Not sure
Now please click the “PLAY ADVERTISEMENT” button below and carefully listen to the advertisement. The ad will begin playing in a new window or tab. After listening to this ad, please answer the question below.

Destination Analysts, Inc. 96
39) During the past 12 months, do you recall having heard this advertisement? Yes
No
Maybe / Not sure
41) After viewing this series of advertisements, overall, how effective do you think these advertisements are in portraying Washington, DC as a place you would enjoy visiting for leisure reasons? (Select one)
Very effective
Effective
Neither effective nor ineffective
Ineffective
Very ineffective
No opinion—I don’t know
42) Overall, how effective do you think these advertisements are in portraying the following aspects of Washington, DC? (Please use the five point scale below where 1 represents “Very ineffectively” and 5 represents “Very effectively”) The advertisements portray this aspect of Washington, DC… Very
ineffectively (1)
Ineffectively (2)
Neither effectively nor ineffectively (3)
Effectively (4) Very effectively (5)
A good vacation value for the money
A good destination for a weekend getaway
A place with lots to see and do
A place that offers a unique vacation experience
A good place for

Destination Analysts, Inc. 97
a family vacation A good place to visit for a business meeting, conference or convention
A place to be inspired
A place that offers a variety of free or affordable attractions and activities
A place that has changed greatly over the last 5-10 years
A place with many interesting and exciting nightlife options
A place with a vibrant food and dining scene
43) How did the advertisements you viewed today affect your likelihood to visit Washington, DC for leisure in the next 12 months? I’m more likely to visit Washington, DC for leisure in the next 12 months.
Unchanged. I am not more or less likely to visit Washington, DC for leisure in the next 12 months.
I’m less likely to visit Washington, DC for leisure in the next 12 months.
I don’t know.
44) You said that you recall seeing one or more of the Washington, DC tourism ads that you reviewed earlier in the survey. Did this ad (or ads) you saw in any way influence your decision to visit Washington, DC?
Yes
No
Maybe / Not sure
45) When you saw the advertisement(s) for Washington, DC, where were you in the process of deciding to travel? Please select the one option that best describes where you were in your travel decision. I had already decided to visit Washington, DC
I was interested in visiting Washington, DC but hadn’t made travel plans yet
Destination Analysts, Inc. 98
I was just considering destinations for a trip
I had no plans to travel
46) In the past 12 months, do you recall seeing any travel articles in newspapers or magazines featuring leisure travel to Washington, DC?
Yes
No
Maybe / Not sure
47) In the past 12 months, do you recall seeing any travel stories or features on television about leisure travel to Washington, DC?
Yes
No
Maybe / Not sure
48) How likely are you to recommend Washington, DC as a place to visit to family members, friends and/or colleagues?
Very likely
Likely
Somewhat likely
Somewhat unlikely
Very unlikely
I don’t know
49) Which of the following traveler descriptions best describes you? I like to explore major cities, full of diverse people and neighborhoods to see the real urban culture like the theater and local arts scene
I like to travel for cultural and educational experiences, by visiting museums, art galleries and historic sites
I like to travel with my family, engaging in active experiences away from the typical hustle-and-bustle of the household
Destination Analysts, Inc. 99
I like to travel for new culinary and dining experiences, to explore new restaurants or unique cuisines
None of these
The following questions will only be used to develop group profiles and responses will not be associated with you individually. 50) What is your gender? (Select one)
Male
Female
I prefer not to answer
51) Which best describes your age? (Select one)
Under 21
21 to 34
35 to 44
45 to 54
55 to 64
65 or above
I prefer not to answer
52) Which best describes your current employment status? (Select one)
Employed full-time
Employed part-time
Self-employed
Not currently employed / retired
I prefer not to answer
53) Which best represents the highest level of formal education you have completed? (Select one) Some high school or less

Destination Analysts, Inc. 100
High school graduate
Attended some college
Associate’s degree
Bachelor’s degree
Some graduate school or more
I prefer not to answer
54) Which best describes the combined annual income of all members of your household? (Select one)
Less than $20,000
$20,000 but less than $40,000
$40,000 but less than $50,000
$50,000 but less than $75,000
$75,000 but less than $100,000
$100,000 but less than $125,000
$125,000 but less than $150,000
$150,000 but less than $200,000
$200,000 or more
I prefer not to answer
55) Which best describes your race or ethnic background? (Select one)
White/Caucasian
Black/African-American
Hispanic/Latino
Asian/Pacific Islander
Other
Two or more of the above
I prefer not to answer

Destination Analysts, Inc. 101
56) Which best describes you? (Select one)
Heterosexual
Gay/Lesbian/Bisexual/Transgendered
I prefer not to answer
57) Which best describes your marital status? (Select one)
Single
Single with children under age 18
Married
Married with children under age 18
Domestic Partnership
Other
I prefer not to answer
58) Has the recent political climate in Washington, DC affected your interest in visiting Washington, DC for leisure?
Yes
No
59) How has the recent political climate in Washington, DC affected your interest in visiting Washington, DC for leisure? Please select the statement below that best describes how your interest has been affected.
Made me significantly more interested in visiting Washington, DC for leisure
Made me more interested in visiting Washington, DC for leisure
Made me less interested in visiting Washington, DC for leisure
Made me significantly less interested in visiting Washington, DC for leisure
Thank you very much for your help. Please click the "Submit Survey" button below to send your responses.

Destination Analysts, Inc. 102