detail project report- umreth-1...
TRANSCRIPT

IWMP-1
Project Implementing Agency:
DISTRICT WATERSHED DEVELOPMENT UNIT
“A” Block, Jilla Panchayat Building
Opp.Amul Dairy, Anand-388110
Gujarat, INDIA
Ph: +91 2692 266823
Detail Project Report- Umreth-1 Project

Watershed Development Team (IWMP-1), Anand Page 2
CHAPTER -1 PROJECT BACKGROUND .......................................................................................................................................................................................................... 9
1.1 Project Background ...................................................................................................................................................................................................................................................... 10
Table no.1: Basic project information ...................................................................................................................................................................................................................... 10
1.2 Need of Watershed Development Programme .................................................................................................................................................................................................. 12
Table no. 2: Weightage of the project ....................................................................................................................................................................................................................... 12
Table no. 2.1 Criteria and weightage for selection of watershed .................................................................................................................................................................. 13
Table no.3: Watershed information .......................................................................................................................................................................................................................... 14
1.3 Other developmental projects/schemes running in the Umreth-1 Project............................................................................................................................................ 14
Table no.4: Developmental programmes running in the project area: ....................................................................................................................................................... 15
CHAPTER – 2 PROJECT IMPLEMENTING AGENCY ..................................................................................................................................................................................17
2.1. Project Implementing Agency ................................................................................................................................................................................................................................. 18
2.2 About District Watershed Development Unit (DWDU), Anand ................................................................................................................................................................... 18
2.2.1 The organization and its objectives: .............................................................................................................................................................................................................. 18
2.2.2 Programmes/projects of DWDU, Anand: ..................................................................................................................................................................................................... 19
2.3 SWOT Analysis of the DWDU: ................................................................................................................................................................................................................................... 19
Table no. 5: PIA: ................................................................................................................................................................................................................................................................ 21
Table no. 6: Staff at PIA level: ...................................................................................................................................................................................................................................... 21

Watershed Development Team (IWMP-1), Anand Page 3
CHAPTER – 3 BASIC INFORMATION OF THE PROJECT AREA .............................................................................................................................................................22
3.1. Geography and Geo-hydrology ............................................................................................................................................................................................................................... 23
3.1.1 Land use pattern: ................................................................................................................................................................................................................................................... 23
Table no. 7: Land use pattern: ..................................................................................................................................................................................................................................... 23
3.1.2 Soil and topography: ............................................................................................................................................................................................................................................ 23
Table no. 8: Soil type and topography: .................................................................................................................................................................................................................... 24
Table no. 9: Flood and drought condition: ............................................................................................................................................................................................................. 24
Table no. 10: Soil Salinity/Alkalinity (Salinity ingress) .................................................................................................................................................................................... 26
Table no.11: Climatic conditions ................................................................................................................................................................................................................................ 26
Table no. 12: Physiographic and relief: ................................................................................................................................................................................................................... 26
3.1.3 Land and Agriculture: .......................................................................................................................................................................................................................................... 27
Table no. 13: Land ownership details ...................................................................................................................................................................................................................... 27
Table no. 14: Agriculture ............................................................................................................................................................................................................................................... 27
Table no. 15: Irrigation .................................................................................................................................................................................................................................................. 28
Table no. 16: Crop details: ............................................................................................................................................................................................................................................ 28
3.1.4 Livestock: .................................................................................................................................................................................................................................................................. 29
Table no. 17: Livestock ................................................................................................................................................................................................................................................... 29
Table no. 18: Drinking water ....................................................................................................................................................................................................................................... 30
Table no. 19: Details of Common Property Resources ...................................................................................................................................................................................... 31

Watershed Development Team (IWMP-1), Anand Page 4
3.2. Socio-Economic Profile .............................................................................................................................................................................................................................................. 32
3.2.1 Demographic Status: ............................................................................................................................................................................................................................................ 32
Table no. 20: Demographic information ................................................................................................................................................................................................................. 32
Table no. 21: Literacy rate ............................................................................................................................................................................................................................................ 32
3.2.2 Migration Pattern: ................................................................................................................................................................................................................................................. 33
Table no. 22: Migration details ................................................................................................................................................................................................................................... 33
Table no. 23: Poverty ...................................................................................................................................................................................................................................................... 33
3.2.3 Infrastructure facilities: ...................................................................................................................................................................................................................................... 34
Table no. 24: Village infrastructures ........................................................................................................................................................................................................................ 34
Table no. 25: Facilities / HH assets ........................................................................................................................................................................................................................... 34
3.3. Livelihood pattern: ...................................................................................................................................................................................................................................................... 35
Table no. 26: Per capita Income per year ............................................................................................................................................................................................................... 35
3.3.1 Dependence on Common Property Resource ............................................................................................................................................................................................ 36
Table no. 27: Livelihood pattern (Occupational distribution) ........................................................................................................................................................................ 36
3.4. Comparative data of the crop productivity of the area: project area vs. District vs. State vs. Country vs. World: ................................................................. 37
The Umreth-1 project area ........................................................................................................................................................................................................................................... 39

Watershed Development Team (IWMP-1), Anand Page 5
CHAPTER – 4 WATERSHED ACTIVITIES ...................................................................................................................................................................................................40
4. Watershed Activities ...................................................................................................................................................................................................................................41
4.1. Scientific Planning: ...................................................................................................................................................................................................................................................... 41
i) Cluster Approach .......................................................................................................................................................................................................................................................... 41
ii) Base line Survey .......................................................................................................................................................................................................................................................... 41
iii) Participatory Rural Appraisal (PRA) ................................................................................................................................................................................................................. 42
iv)Use of GIS and Remote sensing for planning ................................................................................................................................................................................................... 42
Table no. 28: Details of Scientific Planning and Inputs in IWMP projects ................................................................................................................................................. 43
4.2. Institution building ...................................................................................................................................................................................................................................................... 44
4.2.1 Watershed Committee (WC) ............................................................................................................................................................................................................................. 44
Table no. 29: Watershed Committee details .......................................................................................................................................................................................................... 45
4.2.2 Self Help Group ............................................................................................................................................................................................................................................... 45
Table no. 30: SHG details ............................................................................................................................................................................................................................................... 51
4.2.3 User Group: .............................................................................................................................................................................................................................................................. 53
Table no. 31: UG detail ................................................................................................................................................................................................................................................... 53
4.3. Physical activities to be undertaken under IWMP-1, Umreth-1 ................................................................................................................................................................ 53
4.3.1 Entry Point activity (EPA) .................................................................................................................................................................................................................................. 53
Table no.32: Entry point activities (EPA) (All financial figures in Rs.) ....................................................................................................................................................... 54
Table no.33: Details of activities of preparatory phase .................................................................................................................................................................................... 55

Watershed Development Team (IWMP-1), Anand Page 6
4.3.2. Watershed Development Works: ................................................................................................................................................................................................................... 56
Table No. 34.1: Technical Details of Farm Bund .................................................................................................................................................................................................. 57
Table No. 34.2: Quantity Excavation for Farm bund .......................................................................................................................................................................................... 57
Table No. 35: Technical Details of Check Wall ...................................................................................................................................................................................................... 58
Table No. 36.1: Technical Details of Check Dam .................................................................................................................................................................................................. 59
Table No.36.2: Quantity Excavation for Check Dam ........................................................................................................................................................................................... 59
Table No. 37.1: Technical Details of Afforestation Activities .......................................................................................................................................................................... 60
Table No. 37.2: Cost Estimation for afforestation activity ............................................................................................................................................................................... 60
Table no. 38: Activities related to Surface water resources in the project areas (all financial figures in lakh Rs.) ................................................................... 61
Table no. 39: Activities related to livelihoods by Self Help Groups (SHGs) in the project areas....................................................................................................... 62
Table no. 40: Other Activities of Livelihood & Watershed Works Phase – Proposed target .............................................................................................................. 62
Table No. 41.1: Technical Details of Farm Pond ................................................................................................................................................................................................... 64
Table No. 41.2: Quantity Excavation for Farm Pond .......................................................................................................................................................................................... 64
Table no.42: Details of allied / other activities ..................................................................................................................................................................................................... 65
Table 43 .1 Primary Model for A Neem based Micro Enterprise (NME) .................................................................................................................................................... 68
Table no: 43.2 Cost of cultivation for Neem Tree production ......................................................................................................................................................................... 68
Table No. 43.3 Initial investment for Neem based Micro Enterprise (NME) ............................................................................................................................................ 68
Table No. 43.4 Revenue and return Details. .......................................................................................................................................................................................................... 69
Table: 44.1: Model for A Vermi-compost Unit ...................................................................................................................................................................................................... 73

Watershed Development Team (IWMP-1), Anand Page 7
Table No.44.2: Returns from vermin-composting ............................................................................................................................................................................................... 73
Table no.45: Details of activities in the CPRs in the project areas ................................................................................................................................................................ 74
4.4. Capacity Building: ........................................................................................................................................................................................................................................................ 74
Table no. 46: Capacity Building Institution: ........................................................................................................................................................................................................... 75
Table no. 47: Capacity Building plan: ....................................................................................................................................................................................................................... 76
Table no.48: Information, education and Communication Activities: ......................................................................................................................................................... 76
CHAPTER – 5 BUDGETING ..............................................................................................................................................................................................................................77
Table no. 49: Budget at a glance ................................................................................................................................................................................................................................. 78
Table no. 50: Village component wise budget available under IWMP-1 .................................................................................................................................................... 79
Table no. 51: Village -wise gap in funds requirement ........................................................................................................................................................................................ 79
Table no.52: Details of Convergence of IWMP with other Schemes ............................................................................................................................................................. 80
CHAPTER – 6 EXPECTED OUTCOMES .........................................................................................................................................................................................................81
6.1 Expected Outcomes ...................................................................................................................................................................................................................................................... 82
6.1.1 Employment ............................................................................................................................................................................................................................................................ 82
Table no. 53: Employment in Project area ............................................................................................................................................................................................................. 82
6.1.2.Migration .................................................................................................................................................................................................................................................................. 83
Table no. 54: Details of seasonal migration from Project area ....................................................................................................................................................................... 83
6.1.3 Ground water table ............................................................................................................................................................................................................................................... 83
Table no. 55: Details of average ground water table depth in the project areas (in meters) ............................................................................................................. 84

Watershed Development Team (IWMP-1), Anand Page 8
6.1.4 Drinking water ....................................................................................................................................................................................................................................................... 84
Table no. 56: Status of Drinking water .................................................................................................................................................................................................................... 84
6.1.5 Crops .......................................................................................................................................................................................................................................................................... 85
Table no. 57: Details of crop area and yield in the project area ..................................................................................................................................................................... 85
6.1.6 Horticulture ............................................................................................................................................................................................................................................................. 85
Table no. 58: Area under horticulture ..................................................................................................................................................................................................................... 85
6.1.7 Vegetative cover .................................................................................................................................................................................................................................................... 86
Table no. 59: Forest/vegetative cover .................................................................................................................................................................................................................... 86
6.1.8 Livestock ................................................................................................................................................................................................................................................................... 86
Table no. 60: Details of livestock in the project areas (for fluids please mention in litres, for solids please mention in kgs. and income in `.) ........... 87
Table no. 61: Backward-Forward linkages ............................................................................................................................................................................................................ 88
6.2 Logical Framework Analysis ..................................................................................................................................................................................................................................... 89
CHAPTER -7 QUALITY AND SUSTAINABILITY ISSUES ..........................................................................................................................................................................93
7 Quality and Sustainability Issues .............................................................................................................................................................................................................94
7.1 Plans for Monitoring and Evaluation ..................................................................................................................................................................................................................... 94
7.2 Plans for Project management: ................................................................................................................................................................................................................................ 95
7.3 Watershed Development Fund: ............................................................................................................................................................................................................................... 95
7.4 User Charges: .................................................................................................................................................................................................................................................................. 95
CHAPTER -8 MAPS.............................................................................................................................................................................................................................................96

Watershed Development Team (IWMP-1), Anand Page 9
CHAPTER -1 PROJECT BACKGROUND

Watershed Development Team (IWMP-1), Anand Page 10
1.1 Project Background
Umreth-1 (IWMP-1) project is located at Umreth Taluka of Anand District of Gujarat State. The project is cluster of five micro-watersheds with 6A1B7a2b, 6A1B7a2a, 6A1B7a1d, 6A1B7a1c, 6A1B7a1b as their respective codes. The total project area of the watershed is about 5991.4 ha. of which 5060.2 is proposed to be treated under Integrated Watershed Management Programme (IWMP). The nearest town is Umreth which is about 12 km from Sundalpura but well connected by pucca road. The project area lies in the edge of ravines of Mahisagar river. Chauhan, Patel, Parmar, Thakor, Bhoi, Rohit and Harijans are the primary inhabitant of the village. The livelihood is primarily based on agriculture, wage labour and livestock farming.
Table no.1: Basic project information
S.
No.
Name of the
project
Villages Gram
Panchayats Taluka District
Area of the
project
Area
proposed to
be treated
Total
project
cost
PIA Name Census code
1
Umreth-1
Sundalpura 1500030105350000 Sundalpura
Umreth Anand 5991.4
2030.8
607.2
(lakh)
DWDU,
Anand
2 Ahima 1500030105360000 Ahima 405.8
3 Shilli 1500030105370000 Silli 1815.8
4 Pratappura 1500030105400000 Pratappura 295.5
5 Khorvad 1500030105380000 Khorvad 412.1
6 Dholi 1500030105390000 Dholi 100.2
Total 5060.2

Watershed Development Team (IWMP-1), Anand Page 11
Figure 1, Geographic location of Umreth-1

Watershed Development Team (IWMP-1), Anand Page 12
1.2 Need of Watershed Development Programme
Watershed Development Programme is prioritised on the basis of thirteen parameters namely Poverty Index, Percentage of SC/ST, Actual
wages, Percentage of small and marginal farmers, Ground water status, Moisture Index, Area under rainfed agriculture, Drinking water situation in the
area, Percentage of the degraded land, Productivity potential of the land, Continuity of another watershed that has already developed/treated, Cluster
approach for plain or for hilly terrain. Based on these thirteen parameters a composite ranking was given to Umreth-1 Watershed project as given in
table no. 2.
The total number of families under BPL is 3028, which is more than 20 per cent of the total households of the village. Hence a score of 5 is
allotted. The percentage of schedule castes and schedule tribes in the village is about 1.95 per cent to the total population; hence a score of 3 was
allotted. More than 60 per cent of the farmers are small and marginal by nature and the actual wages earned by the labour is less than the minimum
wages hence a composite rank of 5, 3 and 5 are allotted respectively.
Since the rainfall received is uncertain, the moisture index is average and the area is classified under IWDP block. Drinking water is
problematic in the village. The soil is very permeable and production of the land can be significantly enriched with the availability of timely irrigation.
Umreth-1 watershed falls in continuity with other proposed (2010-11) watersheds namely Vansol and kunjrao. Cluster approach was followed taking
into consideration four micro-watersheds covering a total area of 5991.4 Ha. Thus a cumulative score of 81.
All the parameters taken together give a cumulative score of 81 to the watershed (reference Table 2.1 below).
Table no. 2: Weightage of the project
Project name
Project type
Weightage
IWMP 6 IWDP i ii iii iv v vi vii viii ix x xi xii Xiii 5 3 5 5 3 10 5 5 15 10 5 10 NA

Watershed Development Team (IWMP-1), Anand Page 13
Table no. 2.1 Criteria and weightage for selection of watershed
S.
No. Criteria
Maximum score
Ranges & scores
i Poverty index (% of poor to population)
10 Above 80 % (10) 80 to 50 % (7.5) 50 to 20 % (5) Below 20 % (2.5)
ii % of SC/ ST population 10 More than 40 % (10) 20 to 40 % (5) Less than 20 % (3) iii Actual wages 5 Actual wages are
significantly lower than minimum wages (5)
Actual wages are equal to or higher than minimum wages (0)
iv % of small and marginal farmers
10 More than 80 % (10) 50 to 80 % (5) Less than 50 % (3)
v Ground water status 5 Over exploited (5) Critical (3) Sub critical (2) Safe (0)
vi Moisture index/ DPAP/ DDP Block
15 -66.7 & below (15) DDP Block
-33.3 to -66.6 (10) DPAP Block
0 to -33.2 (0) Non DPAP/ DDP Block
vii Area under rain-fed agriculture
15 More than 90 % (15) 80 to 90 % (10) 70 to 80% (5) Above 70 % (Reject)
viii Drinking water 10 No source (10) Problematic village (7.5)
Partially covered (5) Fully covered (0)
ix Degraded land 15 High – above 20 % (15) Medium – 10 to 20 % (10)
Low- less than 10 % of TGA (5)
x Productivity potential of the land
15 Lands with low production & where productivity can be significantly enhanced with reasonable efforts (15)
Lands with moderate production & where productivity can be enhanced with reasonable efforts (10)
Lands with high production & where productivity can be marginally enhanced with reasonable efforts (5)
xi Contiguity to another watershed that has already been developed/ treated
10 Contiguous to previously treated watershed & contiguity within the microwatersheds in the project (10)
Contiguity within the microwatersheds in the project but non contiguous to previously treated watershed (5)
Neither contiguous to previously treated watershed nor contiguity within the microwatersheds in the project (0)

Watershed Development Team (IWMP-1), Anand Page 14
xii Cluster approach in the plains (more than one contiguous micro-watersheds in the project)
15 Above 6 micro-watersheds in cluster (15)
4 to 6 microwatersheds in cluster (10)
2 to 4 microwatersheds in cluster (5)
xiii Cluster approach in the hills (more than one contiguous micro-watersheds in the project)
15 Above 5 micro-watersheds in cluster (15)
3 to 5 microwatersheds in cluster (10)
2 to 3 microwatersheds in cluster (5)
Total 150 150 90 41 2.5
Table no.3: Watershed information
Name of the project No. of watersheds to be treated Watershed code Watershed regime/type/order
IWMP 1 –Umreth-1 5 6A1B7a2b, 6A1B7a2a,
6A1B7a1d, 6A1B7a1c, 6A1B7a1b Mini Watershed
1.3 Other developmental projects/schemes running in the Umreth-1 Project
This village being back ward, has been on top priority of a number of developmental projects. These programmes are Mahatma Gandhi National Rural
Employment Guarantee Scheme (MGNREGS), Total Sanitation Campaign (TSC), Swarnajayanti Gram Swarojgar Yojana (SGSY), Indira Awas Yojana
(IAY) and Sardar Awas Yojana (SAY).
i. MGNREGS: Construction of check dams, deepening of village pond, bori bunds and afforestation activities has been taken-up under
MGNREGA.
ii. Total Sanitation Campaign (TSC): Individual toilets are constructed under TSC programme. Moreover compost kit is also given in the
villages.

Watershed Development Team (IWMP-1), Anand Page 15
iii. Swarnjayanti Gram Swarozgar Yojana (SGSY) – Many families are linked with bank and given loan for various purposes like animal
husbandry and to start up small scale livelihood projects.
iv. Awas Yojana: (Total 381 house have been constructed in the Umreth-1 watershed under various Awas Yojana (in which under Indira Awas
Yojana= 147, sardar Awas Yojana =234)
Table no.4: Developmental programmes running in the project area:
S no
Name of the programme/scheme
Sponsoring agency Objectives of the
programme/scheme Year of
commencement Villages covered
Estimated number of beneficiaries
1 MGNREGS Rural Development
Dept. Employment 2009 6 360
2 IAY Rural Development
Dept. Housing 2005 6 147
3 SAY Rural Development
Dept. Housing 2009-11 6 234

Watershed Development Team (IWMP-1), Anand Page 16
Figure 2: A Synoptic View of Umreth-1
Loss of whole farm land due to heavy erosion in monsoon of 2010.

Watershed Development Team (IWMP-1), Anand Page 17
CHAPTER – 2 PROJECT IMPLEMENTING AGENCY

Watershed Development Team (IWMP-1), Anand Page 18
2.1. Project Implementing Agency
The Project Implementing Agencies (PIA) is selected by an appropriate mechanism by Gujarat State Watershed Management Agency (GSWMA), the
State Level Nodal Agency (SLNA) for Integrated Watershed Management Programme (IWMP) in Gujarat. The PIAs are responsible for implementation
of watershed project. These PIAs may include relevant line departments, autonomous organizations under State/ Central Governments,
Government Institutes/ Research bodies, Intermediate Panchayats, Voluntary Organizations (VOs). The PIA for Umreth-1 watershed Project is
District watershed development Unit (DWDU), Anand.
2.2 About District Watershed Development Unit (DWDU), Anand
2.2.1 The organization and its objectives:
The District Watershed Development Unit (DWDU), Anand is a district level nodal agency and was established on 7 June 2008 to oversee the smooth
implementation of watershed projects in the district. The District Development Officer (DDO) is the chairman of the DWDU. The DWDU has dedicated
and experienced staff comprising one Project Manager (deputation from Gujarat Forest Department), a Technical Expert and a Multi-Disciplinary
Team of Agriculture Expert, Civil Engineer, Community Mobilization Expert, Data Entry Operator, MIS Coordinator, System Analyst, Surveyor, and
Accountant. The objectives of the DWDU, Anand are supervising, planning, implementing, documenting and promoting watershed development
projects and related developmental activities in the district as per guidelines. The DWDU, Anand also works as a PIA for some IWMP projects.

Watershed Development Team (IWMP-1), Anand Page 19
2.2.2 Programmes/projects of DWDU, Anand:
At present 5 IWMP projects have been sanctioned by Government of India for Anand district. The entry point activities of all the five IWMP projects
have been identified by the respective PIAs in the district. Anand Forest Division is PIA for 3 projects (IWMP- 3, 4 & 5) and DWDU itself is PIA for rest
of the two projects (IWMP-1 & 2).
Apart from the 5 IWMP projects, DWDU Anand is involved in a total of 23 pre-Hariyali & 20 Hariyali projects (IWDP); All the 43 projects are still
running in the district. The DWDU, Anand is also monitoring a central government sponsored scheme on “Artificial Recharge of Groundwater through
Dugwells” in the district.
2.3 SWOT Analysis of the DWDU:
Strength:
(1) Independent District Level Nodal Agency.
(2) Strong linkages with national and state level institutions, Agricultural Universities and NGOs for capacity building and technical guidance.
(3) Scientific planning in watershed projects with the help of BISAG, Gandhinagar.
(4) District level Monitoring, Co-ordination & Co-operation Committee.
Weakness:
(1) No permanent office building.
(2) Project area is in ravines area of Mahi river so fund is not sufficient to treat ravine areas.
(3) Insufficient funds for complete watershed projects per hectare.

Watershed Development Team (IWMP-1), Anand Page 20
Opportunities:
(1) A number of different other development schemes of the government are running; so, there can be horizontal integration and convergence of
programmes.
(2) Better financial provision under IWMP.
(3) Usage of new ICT tools like GIS, GPS.
Threats:
(1) Rainfall being very unreliable in the project area, the activities planned to be taken up may yield limited impact.
(2) Irregularities in fund flow can derail the smooth functioning.
(3) Lack of political stability.
(4) Low literacy rate in the project area.
Watershed Development Team (IWMP-1), Anand Page 21
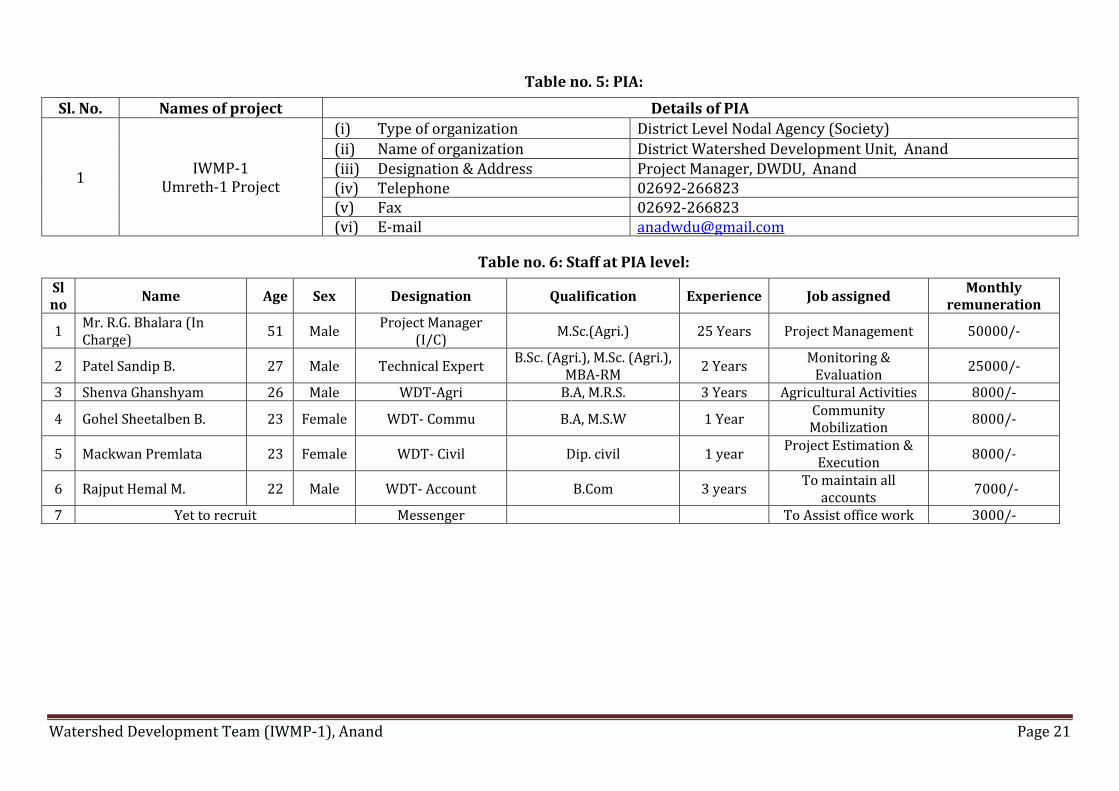
Table no. 5: PIA:
Sl. No. Names of project Details of PIA
1 IWMP-1
Umreth-1 Project
(i) Type of organization District Level Nodal Agency (Society)
(ii) Name of organization District Watershed Development Unit, Anand (iii) Designation & Address Project Manager, DWDU, Anand (iv) Telephone 02692-266823 (v) Fax 02692-266823 (vi) E-mail [email protected]
Table no. 6: Staff at PIA level:
Sl no
Name Age Sex Designation Qualification Experience Job assigned Monthly
remuneration
1 Mr. R.G. Bhalara (In Charge)
51 Male Project Manager
(I/C) M.Sc.(Agri.) 25 Years Project Management 50000/-
2 Patel Sandip B. 27 Male Technical Expert B.Sc. (Agri.), M.Sc. (Agri.),
MBA-RM 2 Years
Monitoring & Evaluation
25000/-
3 Shenva Ghanshyam 26 Male WDT-Agri B.A, M.R.S. 3 Years Agricultural Activities 8000/-
4 Gohel Sheetalben B. 23 Female WDT- Commu B.A, M.S.W 1 Year Community Mobilization
8000/-
5 Mackwan Premlata 23 Female WDT- Civil Dip. civil 1 year Project Estimation &
Execution 8000/-
6 Rajput Hemal M. 22 Male WDT- Account B.Com 3 years To maintain all
accounts 7000/-
7 Yet to recruit Messenger To Assist office work 3000/-

Watershed Development Team (IWMP-1), Anand Page 22
CHAPTER – 3 BASIC INFORMATION OF THE PROJECT AREA

Watershed Development Team (IWMP-1), Anand Page 23
3.1. Geography and Geo-hydrology
3.1.1 Land use pattern:
The net geographical area of Umreth-1 watershed is about 5991.4 ha. About 3525.8 ha of land is under rainfed-agriculture.; mainly a Kharif
crop is taken. About 26 percent of the total land is classified under wasteland of which 44 percent is cultivable and rest 56 percent is uncultivable and
ravines.
Table no. 7: Land use pattern:
S. No. Names of villages
Geographical Area of the village (ha)
Forest Area (ha)
Land under agricultural use (ha)
Rain-fed area (ha)
Permanent pastures (ha)
Wasteland Cultivable
(ha) Non-cultivable
(ha) 1 Sundalpura 2430.8 0 1737 1337 0 693.8 0
2 Ahima 525.8 0 321 201 0 0 204.8
3 Silli 1965.8 0 1471 1321 0 0 494.8
4 Pratappura 296.7 0 122 120.8 0 0 174.8
5 Khorvad 612.1 0 607 457 0 0 5.1
6 Dholi 160.2 0 149 89 0 0 11.2
Total Umreth-1 5991.4 0 4407 3525.8 0 693.8 890.7
3.1.2 Soil and topography:
Umreth-1 Watershed Project (UWP) falls under Middle Gujarat Agro Climatic Zone. The soil is mainly sandy and sandy loam. The soil is yellowish to
light brown in surface colour. The depth of soil is moderate to deep about 75 to 100 cm. The soil fertility is very poor with low nitrogen, phosphorus.
The topography of the area is moderate ranging from 20-30% slope.

Watershed Development Team (IWMP-1), Anand Page 24
Table no. 8: Soil type and topography:
S. No. Name of the Agro-climatic zone
covers project area Area in ha
Names of the villages
Major soil types Topography
a) Type b) Area in ha
1 Middle Gujarat Agro climatic
zone 5060.2
Sundalpura, Ahima, Silli, Pratappura, Khorvad, Dholi
Sandy Loam 5060.2 Flat to slope
(ravines)
Table no. 9: Flood and drought condition:
S.No Village Flood (Incidence in last 5 years) Drought (Incidence in last 5 years) 1 Sundalpura Once twice 2 Ahima Once Twice 3 Silli Once Twice 4 Pratappura Once Twice 5 Khorvad Once Twice 6 Dholi Once Twice

Watershed Development Team (IWMP-1), Anand Page 25
Figure 3: Ravine formation by Mahi River
Watershed Development Team (IWMP-1), Anand Page 26
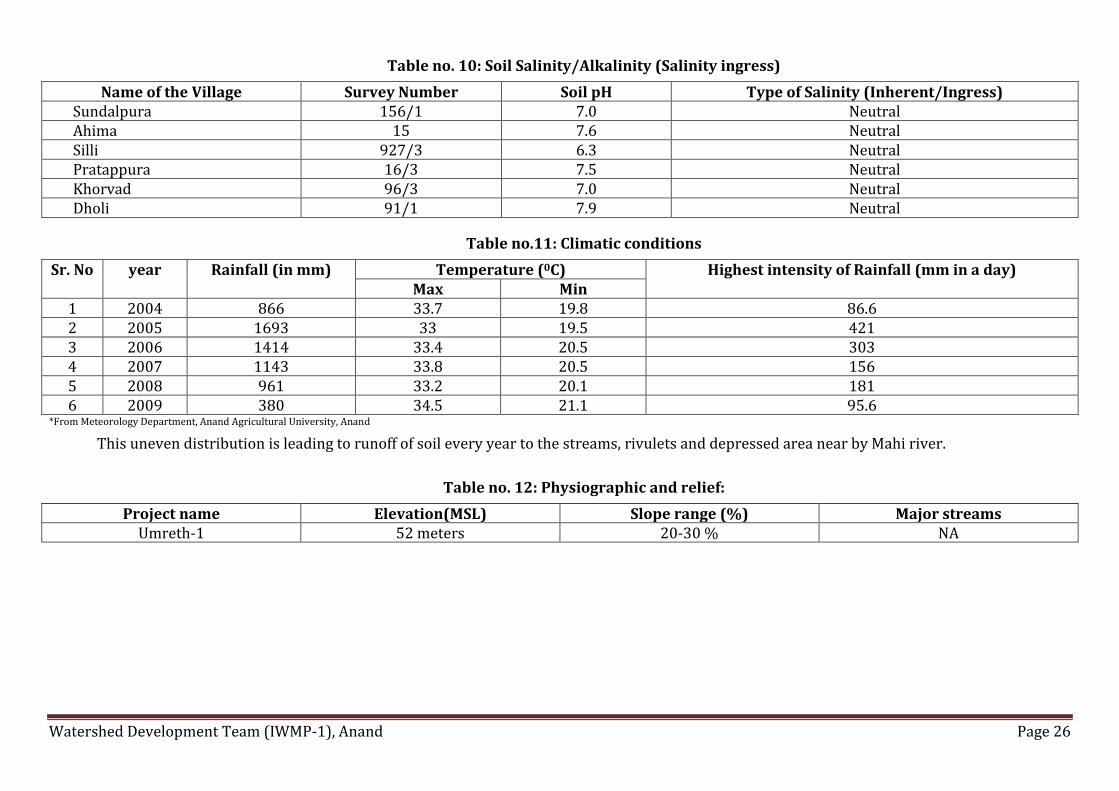
Table no. 10: Soil Salinity/Alkalinity (Salinity ingress)
Name of the Village Survey Number Soil pH Type of Salinity (Inherent/Ingress) Sundalpura 156/1 7.0 Neutral Ahima 15 7.6 Neutral Silli 927/3 6.3 Neutral Pratappura 16/3 7.5 Neutral Khorvad 96/3 7.0 Neutral Dholi 91/1 7.9 Neutral
Table no.11: Climatic conditions
Sr. No year Rainfall (in mm) Temperature (0C) Highest intensity of Rainfall (mm in a day) Max Min
1 2004 866 33.7 19.8 86.6 2 2005 1693 33 19.5 421 3 2006 1414 33.4 20.5 303 4 2007 1143 33.8 20.5 156 5 2008 961 33.2 20.1 181 6 2009 380 34.5 21.1 95.6
*From Meteorology Department, Anand Agricultural University, Anand
This uneven distribution is leading to runoff of soil every year to the streams, rivulets and depressed area near by Mahi river.
Table no. 12: Physiographic and relief:
Project name Elevation(MSL) Slope range (%) Major streams Umreth-1 52 meters 20-30 % NA

Watershed Development Team (IWMP-1), Anand Page 27
3.1.3 Land and Agriculture:
Lack of drinking water line and lack of proper channel for irrigation. The average land holding is about 0.41 ha ranging from 0.25 to 5 ha. Lack
of irrigation source and ravine formation in farm land forces the majority of the farmers to migrate to ensure their livelihood. This affects directly the
demographic profile of the village. The major crops cultivated by the farmers are Tobacco and Bajra (Pearl millet) in monsoon. The land conservation
measures such as earthen bunds and farm bunds in the area will help them to take up a rabi crop of Wheat and other vegetable crops in the residual
moisture.
Table no. 13: Land ownership details
S. No. Village Total owned land (in ha) Total
Gen OBC SC ST 1 Sundalpura 1380 325 32 0 1737 2 Ahima 333 0 3 0 336 3 Silli 1466 0 5 0 1471 4 Pratappura 135 160 1.5 0 296.5 5 Khorvad 267 345 0 0 612 6 Dholi 142 17 1 0 160
Total 3723 847 42.5 0 4612.5
Table no. 14: Agriculture
S. No. Villages Net sown area(ha)
One time Two times Three times 1 Sundalpura 437 1300 - 2 Ahima 119 80 - 3 Silli 597 1261 - 4 Pratappura 82 155 - 5 Khorvad 175 390 - 6 Dholi 20 95 -

Watershed Development Team (IWMP-1), Anand Page 28
Table no. 15: Irrigation
S No Village Source 1 : Canal Source 2 : Check dam / Pond Source 3 : Well
Availability months Net area Gross area Availability months Net area Gross area Availability months Net area Gross area
1 Sundalpura 12 300 300 6 15 15 12 115
2 Ahima 12 10 10 - - - 12 30
3 Silli 12 200 200 - - - 12 89
4 Pratappura 12 60 60 - - - 12 45 -
5 Khorvad 12 320 320 - - - 12 20 -
6 Dholi 12 120 120 - - - 12 7 -
Table no. 16: Crop details:
S.No Villages
Kharif (Monsoon) Bajara Tobacco Paddy
Area (ha)
Production (000’kg)
Productivity (kg/ha)
Area (ha)
Production (000’kg)
Productivity (kg/ha)
Area (ha) Production
(kg) Productivity
(kg/ha) 1 Sundalpura 30 46.5 1550 1390 2502 1800 50 200 4000 2 Ahima 10 13.6 1360 360 684 1900 - - - 3 Silli 55 76.2 1385 1275 2869 2250 - - - 4 Pratappura 10 14.2 1420 120 282 2350 - - - 5 Khorvad 12 172.2 1435 312 702 2250 - - - 6 Dholi 5 6.75 1350 150 315 2100 - - -
Watershed Development Team (IWMP-1), Anand Page 29
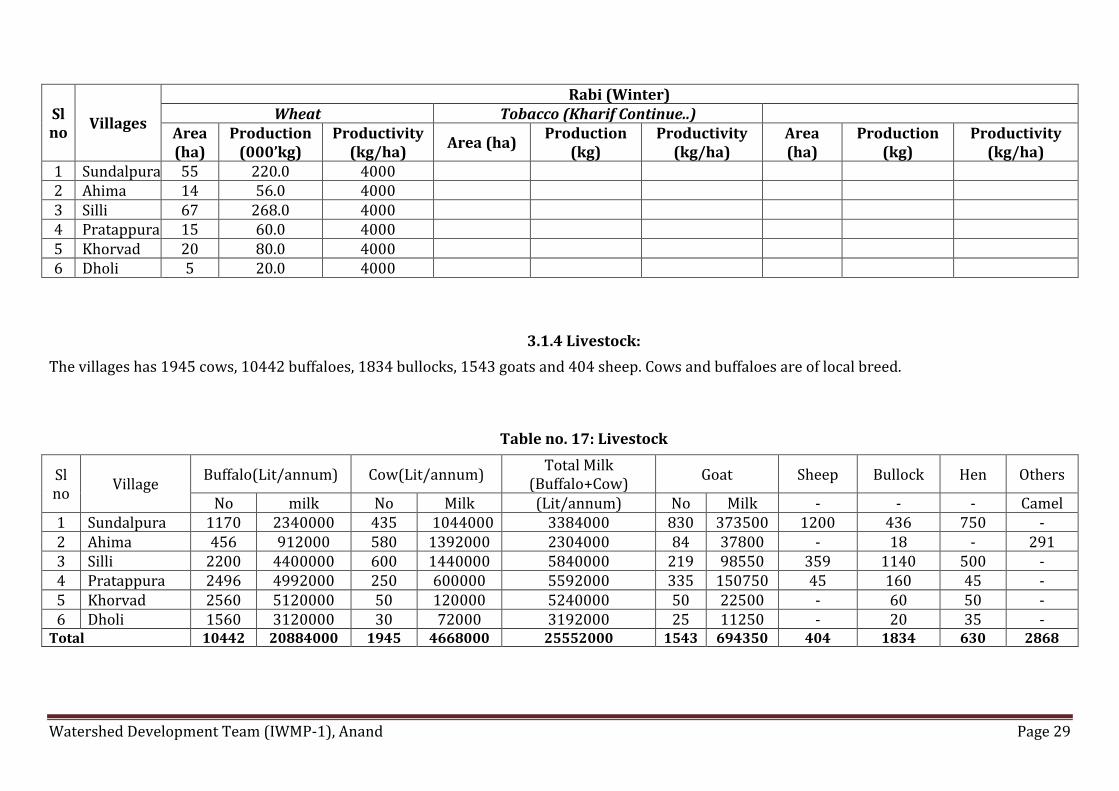
Sl no
Villages
Rabi (Winter) Wheat Tobacco (Kharif Continue..)
Area (ha)
Production (000’kg)
Productivity (kg/ha)
Area (ha) Production
(kg) Productivity
(kg/ha) Area (ha)
Production (kg)
Productivity (kg/ha)
1 Sundalpura 55 220.0 4000 2 Ahima 14 56.0 4000 3 Silli 67 268.0 4000 4 Pratappura 15 60.0 4000 5 Khorvad 20 80.0 4000 6 Dholi 5 20.0 4000
3.1.4 Livestock:
The villages has 1945 cows, 10442 buffaloes, 1834 bullocks, 1543 goats and 404 sheep. Cows and buffaloes are of local breed.
Table no. 17: Livestock
Sl no
Village Buffalo(Lit/annum) Cow(Lit/annum)
Total Milk (Buffalo+Cow)
Goat Sheep Bullock Hen Others
No milk No Milk (Lit/annum) No Milk - - - Camel 1 Sundalpura 1170 2340000 435 1044000 3384000 830 373500 1200 436 750 - 2 Ahima 456 912000 580 1392000 2304000 84 37800 - 18 - 291 3 Silli 2200 4400000 600 1440000 5840000 219 98550 359 1140 500 - 4 Pratappura 2496 4992000 250 600000 5592000 335 150750 45 160 45 - 5 Khorvad 2560 5120000 50 120000 5240000 50 22500 - 60 50 - 6 Dholi 1560 3120000 30 72000 3192000 25 11250 - 20 35 -
Total 10442 20884000 1945 4668000 25552000 1543 694350 404 1834 630 2868
Watershed Development Team (IWMP-1), Anand Page 30
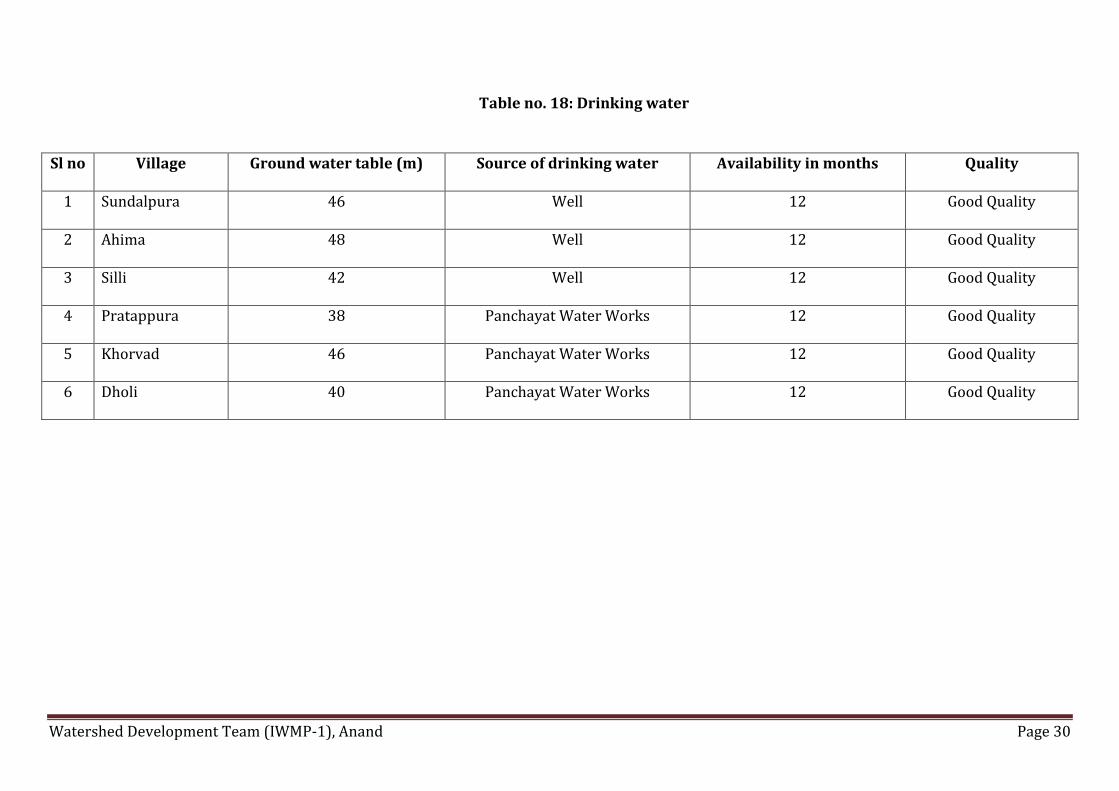
Table no. 18: Drinking water
Sl no Village Ground water table (m) Source of drinking water Availability in months Quality
1 Sundalpura 46 Well 12 Good Quality
2 Ahima 48 Well 12 Good Quality
3 Silli 42 Well 12 Good Quality
4 Pratappura 38 Panchayat Water Works 12 Good Quality
5 Khorvad 46 Panchayat Water Works 12 Good Quality
6 Dholi 40 Panchayat Water Works 12 Good Quality

Watershed Development Team (IWMP-1), Anand Page 31
Table no. 19: Details of Common Property Resources
Sr.
No.
Names of
project
CPR
Particulars
Total Area (ha) Area owned/ In possession of Area available for treatment (ha)
Pvt. persons Govt.
(Specify dept.) PRI
Any other
(Pl. Specify)
Pvt.
persons
Govt.
(Specify
dept.)
PRI Any other
(Pl. Specify)
IWMP-1
Common Land/ Wasteland/
degraded land 0 1801 500
Pastures 0
Orchards 0
Forest 0 0 0 0 0 0 0 0
Village Ponds/ Tanks 0 21 80
Community Buildings 0 5
Permanent markets 0
Temples/ Places of worship 0 27 8
Others (Pl. specify) 0

Watershed Development Team (IWMP-1), Anand Page 32
3.2. Socio-Economic Profile
3.2.1 Demographic Status:
Umreth-1 watershed project has a total of 5756 households with a population of 33046 out of which 17217 are male and 15829 female .The
sex ratio is 919 female to 1000 male. There are 1786 BPL families. The average family size is 5. The literacy rate is an average i.e. 58.80 per cent; male
literacy rate is 72.34 per cent (of total male population) and female literacy rate is low as 44.08 per cent (of total female population).
Table no. 20: Demographic information
S no Villages Population SC ST Total Male Female Total Male Female % Total Male Female % 1 Sundalpura 7604 4029 3575 29 15 14 0.38 75 43 32 0.98 2 Ahima 5154 2728 2426 107 64 43 2.07 0 0 0 0
3 Silli 11382 5858 5524 207 114 93 1.82 18 9 9 0.16 4 Pratappura 3979 2061 1918 39 23 16 0.98 0 0 0 0 5 Khorvad 3479 1805 1674 154 88 66 4.42 0 0 0 0 6 Dholi 1448 736 712 17 10 7 1.17 0 0 0 0
Total 33046 17217 15829 553 314 239 1.67 93 52 41 0.28
Table no. 21: Literacy rate
Sl no Villages Literacy
Total % Male % Female % 1 Sundalpura 4504 59.23 2856 70.88 1648 46.09 2 Ahima 3407 66.10 2145 78.62 1262 52.01 3 Silli 6407 56.29 4135 70.58 2272 41.12 4 Pratappura 2343 58.88 1521 73.79 822 42.85 5 Khorvad 1885 54.18 1228 68.03 657 39.24 6 Dholi 888 61.32 571 77.58 317 44.52
Total 19434 58.81 12456 72.34 6978 44.08

Watershed Development Team (IWMP-1), Anand Page 33
3.2.2 Migration Pattern:
People migrate for their livelihood to different parts of the state like Vadodara, Savli, Anand, Nadiad as daily wagers, industry workers and
construction workers. Lack of fodder availability and grazing land for smaller ruminant yet another reason of migration though in small numbers.
Table no. 22: Migration details
Sr. no
Village Total population
Migration Migration by months Main reason for migration
Income during migration / month Total Male Female Up to 3 months 3-6 months More than 6 months
1 Sundalpura 7604 345 177 168 122 112 111 For better employment Rs 5000/month
2 Ahima 5154 359 238 121 128 115 116 For better employment Rs 5000/month
3 Silli 11382 533 345 288 275 153 105 For better employment Rs 5000/month
4 Pratappura 3979 98 65 33 20 28 50 For better employment Rs 5000/month
5 Khorvad 3479 270 158 112 95 105 70 For better employment Rs 5000/month
6 Dholi 1448 62 45 17 30 14 18 For better employment Rs 5000/month
Table no. 23: Poverty
S. no Village Total BPL
Household BPL
% of BPL HH Total Land less HH % of land less
HH 0-16 16-20 Total 1 Sundalpura 711 458 253 711 51.89 153 11.2 2 Ahima 283 132 151 283 30.76 130 14.2 3 Silli 994 769 225 994 50.07 180 9.0 4 Pratappura 374 134 240 374 53.58 130 18.62 5 Khorvad 459 230 229 459 72.16 126 19.81 6 Dholi 207 63 44 207 72.78 25 8.8
Total 3028 1786 1142 3028 52.60 744 12.92

Watershed Development Team (IWMP-1), Anand Page 34
3.2.3 Infrastructure facilities:
Umreth-1 watershed is well connected with Umreth Taluka with pucca roads. All villages have electricity connectivity under Jyotigram Yojana of the
State Government. Nearly 85 per cent of households in the villages have their personal electric meters. Umreth-1 watershed have primary schools in
all villages with all facilities. For middle and higher secondary education, the students have to go to Khambhodaj village which is about 4 to 13
kilometres away from different villages of watershed area. Some villages do not have a Primary Health Centre for which villagers have to go to
Khambhodaj. In Ahima village one Ayurvedic Hospital is located and remain open three days in a week.
Table no. 24: Village infrastructures
S no
Village Pucca road to the villages (Y/N)
Schools Colleges (Number)
Post Office (Distance)
Banks (Number)
Distance from nearest market yard
Milk collection centre (Number)
Milk cooperative (Number)
Other cooperatives / CBIs (Number)
Any other institution
LP UP HS
1 Sundalpura Y 1 0 0 0 1 7 1 1 1 0 2 Ahima Y 1 1 0 0 0 0 14 1 1 0 0 3 Silli Y 2 1 0 0 0 1 9 1 1 0 0 4 Pratappura Y 3 1 0 0 0 0 14 1 1 0 0 5 Khorvad Y 4 0 0 0 0 20 1 1 0 0 6 Dholi Y 2 0 0 0 0 20 1 1 0 0
Table no. 25: Facilities / HH assets
Sl no
Village HHs with electricity
HHs with safety
latrines
HHs with phones HHs with vehicle HHs with
TV set
HHs with cooking
gas
HHs with Drinking
water
HHs with
fridge Land line Mobile 2-wheeler 4-wheeler
1 Sundalpura 1250 1485 98 75 350 45 455 156 750 89 2 Ahima 550 300 10 580 160 15 435 50 458 22 3 Silli 5070 750 1500 2500 60 15 1500 2000 5070 900 4 Pratappura 698 230 400 330 225 12 450 15 698 25 5 Khorvad 636 434 240 600 425 15 550 45 636 30 6 Dholi 147 107 30 250 200 4 250 25 147 10

Watershed Development Team (IWMP-1), Anand Page 35
3.3. Livelihood pattern:
The villagers earn their livelihood from animal husbandry and agriculture. Youth of this villages go to Savli GIDC in Baroda district as daily
wage labour. Land holding is very small so
Table no. 26: Per capita Income per year
Sr. No. Village Agriculture (in Rs.) Animal husbandry (Approx)
(in Rs.)
Casual labour (in Rs.)
(Approx)
Others (in Rs.) Total (in Rs.)
1 Sundalpura 115245/- 16000/- 17500/- - 148745/-
2 Ahima 83267/- 12500/- 12400/- - 108167/-
3 Silli 97320/- 11700/- 15700/- - 124720/-
4 Pratappura 45255/- 12900/- 12800/- - 70955/-
5 Khorvad 62879/- 13300/- 16300/- - 92479/-
6 Dholi 34819/- 9600/- 16700/- - 61119/- *Calculated per capita of persons those who have related resources.

Watershed Development Team (IWMP-1), Anand Page 36
3.3.1 Dependence on Common Property Resource
Umreth-1 has the largest number of buffaloes in Gujarat but as farmers prefer growing food or cash crops which provide little or no fodder produces, there is a continuous scarcity of fodder in the area. Most of the fodder fed to the animals is purchased from the local markets. Majority of the community in these four districts consists of small and marginal farmers. Ravine formation is major problem due to which farmers lost their valuable land and those who are landless, work as a agricultural labour in farm land. There is no forest land in the project area, so there is no scope of dependence on forest.
Table no. 27: Livelihood pattern (Occupational distribution)
Sl no Village Total
workforce Agriculture
Animal husbandry
(AH)
Agriculture + AH
Casual labour
Services Handicraft Salt Pan Labours
1 Sundalpura 3486 818 164 98 267 24 2 0 2 Ahima 2625 380 76 46 539 11 1 0 3 Silli 6274 1578 315 189 681 47 9 0 4 Pratappura 2183 274 55 33 127 8 0 0 5 Khorvad 1843 365 73 44 123 11 3 0 6 Dholi 329 72 14 9 49 2 1 0

Watershed Development Team (IWMP-1), Anand Page 37
3.4. Comparative data of the crop productivity of the area: project area vs. District vs. State vs. Country vs. World:
“The term productivity in general means the total output per unit of factor input. For example land productivity means output per hectare of
land. Productivity is an average and is calculated by dividing the total output of a particular crop by the total cultivated area under that crop.”
Data are made available by the Baseline survey; Handbook of Agriculture and Final district plan (DAP) of Dept. of Agriculture (for Anand). The
results indicate that project area has very low productivity compared to world, India, Gujarat and Anand. The productivity is low not only because that
the land is unproductive or the farmer’s lack the skills to manage their crop but also due lack to of source of irrigation, salty water and scarcity of rain.
The Umreth-1 watershed comes under semi-arid zone. So farmers grow crop according to the rainfall. If they get good rainfall they generally
grow high value crop like tobacco. In case of low rainfall they go for sorghum and pearl millet. So we can say that monsoon decides cropping patterns
of Umreth-1 watershed.
The world productivity of Tobacco is 1145 kg/ha. In India productivity is about 1393 kg/ha. Gujarat is leading state in India followed by A.P. in the
production of Tobacco with productivity almost near to 1750 kg/ha. Anand known for Tobacco cultivation and thereby also known as Charotar Area
with productivity almost near to 2500 kg/ha. In Anand district almost 50-60 percentage of land covered by Tobacco crop in monsoon season. But in
Umreth-1 project area has only 2200 kg/ha productivity. It is slightly low compare to district.

Watershed Development Team (IWMP-1), Anand Page 38
1145
13931750
2500
2200
0
500
1000
1500
2000
2500
World India Gujarat Anand Umreth-1Tobacco Productivity
790906 900
1250
1425
0
200
400
600
800
1000
1200
1400
1600
World India Gujarat Anand Umreth-1
Bajra Productivity
Figure 4: Compartative Productivity of Tobacco and Bajra (Pearl millet) Umreth-1
Pearl millet is the fourth most important grain crop next to rice,wheat and sorghum.The crop is cultivaed for grain as well as fodder in the semi arid
tropical regions. Pearl millet traditionally is an indispensable component of dry-land farming system. In world pearl millet productivity is 790 kg/ha
and India has 906 kg/ha of Bajara productivity. Gujarat has almost 900 kg/ha productivity. But Anand and Umreth is far better than world and India.
The productivity of pearl millet is 1250 kg/ha for Anand, whereas for Umreth-1 watershed, it is 1425 kg/ha.

Watershed Development Team (IWMP-1), Anand Page 39
The Umreth-1 project area has high productivity but less market value because of the following reasons:
i) Lack of other facilities such as storage and marketing:
5-10% of agriculture product damage after harvesting due to scarcity of proper storage and proper market for sale. So he sells to local
traders at the low prices. Farmers mainly face proper means of transportation and roads. And second problem is farmers don’t have
proper storage facilities.
ii) Lack of proper marketing channels for high value crops like Tobacco:
In the project area major crop is Tobacco and it cannot be stored long time at home of farmer due to loss in quality in monsoon season,
so farmer need to immediately sold their products to trader or market available. So traders gain major margin in trading activities.
iii) Lack of Processing facility in growing are:
Lack of processing of Tobacco and other high value crops like Banana is major problem. There is ample scope of involving SHGs to
processing of Banana and selling it through Producer’s Company.

Watershed Development Team (IWMP-1), Anand Page 40
CHAPTER – 4 WATERSHED ACTIVITIES

Watershed Development Team (IWMP-1), Anand Page 41
4. Watershed Activities
Watershed management as a strategy has been adopted by Government of India especially in the rain-fed regions of semi-arid tropics. These
regions are characterized by uncertain rainfall, high soil erosion leading to ravines formation, poor infrastructure development and average literacy.
Several studies have identified that there is need of a systematic and scientific approach to deal with watershed development. The common guidelines
generate a fresh and flexible framework for the next generation watershed development.
4.1. Scientific Planning:
i) Cluster Approach
This envisages a broader vision of Geo-hydrological unit which involves treating a cluster of micro-watershed. The Umreth-1 Project
consists of five micro- watersheds namely 6A1B7a2b, 6A1B7a2a, 6A1B7a1d, 6A1B7a1c, 6A1B7a1b as their respective codes.
ii) Base line Survey
To access the impact of any watershed development programme a detailed baseline survey has to be conducted. This acts a benchmark
for any intervention during and post implementation of any development programme. A detailed baseline survey was undertaken which
involved household census survey, Bio-physical survey and Village level data collection from Talati –cum mantri. Household census survey
includes a detailed questionnaire which was been filled by visiting each and every household in the village. This gave in the details of the
demographic profile of the village, the literacy percentage, SC/ST population, number of BPL household, cattle population, net consumption
rate in the village, average milk production of the cattle and various schemes running and their benefits
Bio-physical survey was undertaken to identify various natural resources available in the village. It included the soil typology, well in
the area, crop taken in the field, Cropping pattern, fertilizer used and various sources of irrigation in the field.

Watershed Development Team (IWMP-1), Anand Page 42
iii) Participatory Rural Appraisal (PRA)
The past experience of watershed has given tremendous input to focus on creating accountability of the stakeholders towards the
programme. This has created an emphasis to include all the stakeholder communities and their local and Indigenous Technological Knowledge
(ITK) while planning for any activity. Participatory approach provides a new path for planning, implementing, monitoring and post-
withdrawal activities with a complete accountability of the stakeholders. Various PRA techniques like resource mapping, social mapping, and
season calendars were used to understand the physical and social orientation of the village in general and watershed in specific. These tools
put the villagers in ease than the complicated questionnaires. Various tools like Matrix ranking, Venn Diagram were used to identify various
local vegetations (apt for afforestation), Fodders crops, various institution and their significance in the life of the farmers.
iv)Use of GIS and Remote sensing for planning
Use of various high science tools has been promoted at various stages of watershed development.
a) Prioritization
Geographical Information System (GIS) has been used for prioritization process. Various layer maps were created like Geo-morphological,
Soil, BPL Population, SC/ST population, Ground water Status, Drinking water situation Slope percent. These were all given proper weightage
according to the DoLR specification. This helped in prioritization of various watershed areas.
b) Planning
A action plan matrix was formulated by State Level Nodal Agency (SLNA) taking into account various features like the Slope Percent, Soil
Depth, Soil Texture, Soil erosion in the area for wasteland, forest land and agricultural land. Global positioning System (GPS) was used to
identify each and every water conservation structures available in the project area. This was used to create a map. Contour Map of vertical
interval of 1 meter at a scale of 1:15000 was used for identifying various locations for soil and water conservation structures.
c) Hydrological modelling
Hydrology modelling technique was used for locating drainage, stream length, flow direction, sink, and Flow accumulation. This model overlaid
over cadastral map to calculate the catchments area of each structures like the check dam etc. This has helped to remove the human error
which generally occurs while calculating the catchments area of a check dam.

Watershed Development Team (IWMP-1), Anand Page 43
Table no. 28: Details of Scientific Planning and Inputs in IWMP projects
S. No. Scientific criteria/ inputs used Whether scientific criteria was
used
Planning Cluster approach Yes Whether technical back-stopping for the project has been arranged? If yes, mention the name of the Institute
-----
Baseline survey Yes Hydro-geological survey Yes Contour mapping Yes Participatory Net Planning (PNP) Yes Remote sensing data-especially soil/ crop/ run-off cover ----- Ridge to Valley treatment Yes Online IT connectivity between
(1) Project and DWDU cell/ZP No
(2) DWDU and SLNA No
(3) SLNA and DoLR Yes
Availability of GIS layers
1. Cadastral map Yes 2. Village boundaries Yes 3. Drainage Yes 4. Soil (Soil nutrient status) Yes 5. Land use Yes 6. Ground water status Yes 7. Watershed boundaries Yes 8. Activity Yes
Crop simulation models# No Integrated coupled analyzer/ near infrared visible spectroscopy/ medium spectroscopy for high speed soil nutrient analysis
No
Normalized difference vegetation index (NDVI)# No Weather Station

Watershed Development Team (IWMP-1), Anand Page 44
Inputs 1. Bio-pesticides No 2. Organic manures Yes 3. Vermi-compost Yes 4. Bio-fertilizer Yes 5. Water saving devices Yes 6. Mechanized tools/ implements Yes 7. Bio-fencing Yes 8. Nutrient budgeting No 9. Automatic water level recorders & sediment samplers No
Any other (please specify)
4.2. Institution building
4.2.1 Watershed Committee (WC)
It is a committee that is constituted by Gram Sabha to implement the watershed project with technical support of WDT in the village. This
committee is registered under Society Registration Act 1860. The Gram Sabha of the village selects the chairman of the watershed committee with
the secretary who will be a paid functionary. A watershed Committee was formed accordingly in Umreth-1 watershed. Since the watershed has
only one village so no separate watershed sub-committee was formed in the village. Capacity building training to the watershed committee is
given by WDT.
The watershed committee has a pivotal role to play during and after the project implementation period.
Watershed Development Team (IWMP-1), Anand Page 45
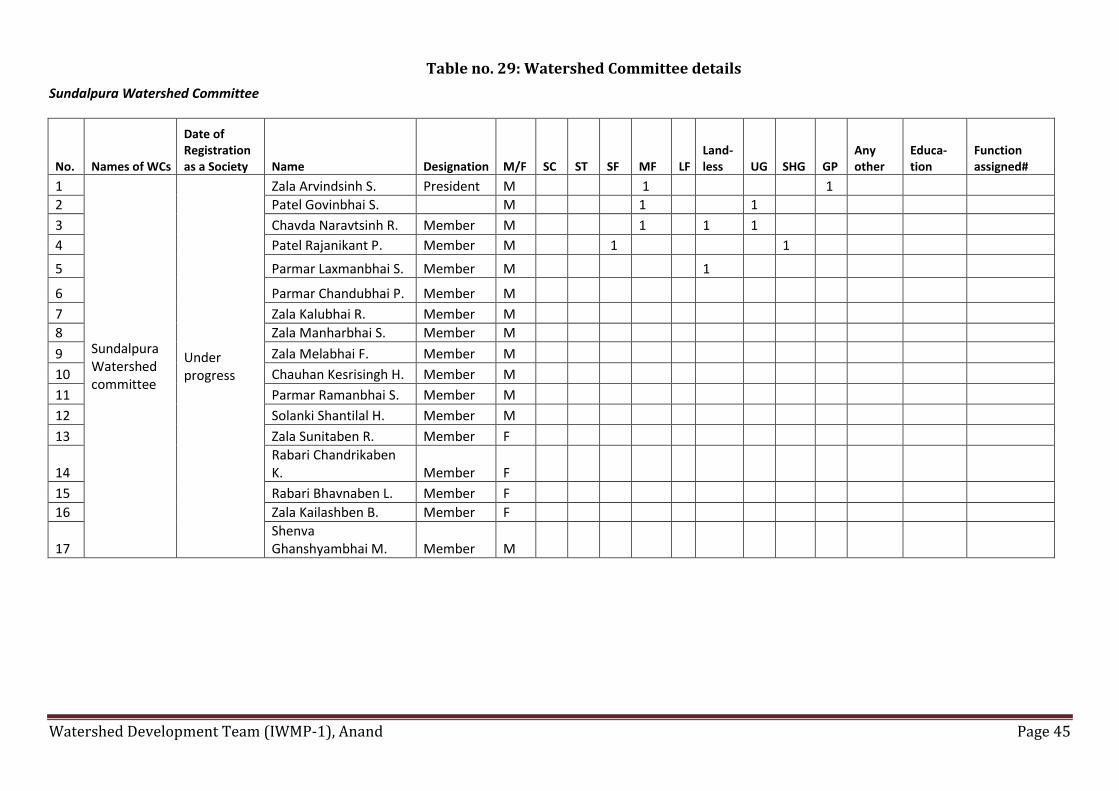
Table no. 29: Watershed Committee details
Sundalpura Watershed Committee
No. Names of WCs
Date of Registration as a Society Name Designation M/F SC ST SF MF LF
Land-less UG SHG GP
Any other
Educa-tion
Function assigned#
1
Sundalpura Watershed committee
Under progress
Zala Arvindsinh S. President M 1 1
2 Patel Govinbhai S. M 1 1
3 Chavda Naravtsinh R. Member M 1 1 1
4 Patel Rajanikant P. Member M 1 1
5 Parmar Laxmanbhai S. Member M 1
6 Parmar Chandubhai P. Member M
7 Zala Kalubhai R. Member M
8 Zala Manharbhai S. Member M
9 Zala Melabhai F. Member M
10 Chauhan Kesrisingh H. Member M
11 Parmar Ramanbhai S. Member M
12 Solanki Shantilal H. Member M
13 Zala Sunitaben R. Member F
14 Rabari Chandrikaben K. Member F
15 Rabari Bhavnaben L. Member F
16 Zala Kailashben B. Member F
17 Shenva Ghanshyambhai M. Member M

Watershed Development Team (IWMP-1), Anand Page 46
Ahima Watershed Committee
Sl. No.
Names of WCs
Date of Registration as a Society Name Designation M/F SC ST SF MF LF
Land-less UG SHG GP
Any other Education
Function/s assigned#
1
Ahima Watershed committee
Under progress
Chauhan Shantilal M. President M 1
2 Chauhan Pravinshinh K. Member M 1 1
3 Chauhan Minaben K. Member F 1 1 1
4 Chauhan Natvarsinh F. Member M 1 1
5 Parmar Ravjibhai M. Member M 1
6 Chauhan Mansinh P. Member M
7 Parmar Minaben A. Member F
8 Rohit Dhanabhai N. Member M
9 Chavda Mahendrasinh S. Member M
10 Khristi Lilaben K. Member F
11 Chauhan Parulben N. Member F
12 Chauhan Shakitvijaysinh B. Member M
13 Shenva Ghanshyambhai M. Member M

Watershed Development Team (IWMP-1), Anand Page 47
Silli Watershed Committee
Sl. No.
Names of WCs
Date of Registration as a Society Name Designation M/F SC ST SF MF LF
Land-less UG SHG GP
Any other Education
Function/s assigned#
1
Silli Watershed committee
Under progress
Rohit meenaben T.. President F 1
2 Rohit Pashabhai J. Member M 1 1
3 Patel Suraykantbhai G. Member M 1 1 1
4 Patel Sheileshkumar G. Member M 1 1
5 Patel Babubhai M. Member M 1
6 Chauhan Kailashben P. Member F 1
7 Pandya Gopalbhai N. Member M 1
8 Parmar ManubhaiB. Member M 1
9 Parmar Bhalabhai S. Member M
10 Makwana lalitaben P.
11 Gohel Sheetal B. Member M

Watershed Development Team (IWMP-1), Anand Page 48
Pratappura Watershed Committee
Sl. No.
Names of WCs
Date of Registration as a Society Name Designation M/F SC ST SF MF LF
Land-less UG SHG GP
Any other Education
Function/s assigned#
1
Pratappura Watershed committee
Under progress
Chauhan Kanubhai p. President M 1
2 Chauhan Nandaben b. Member F 1 1
3 Chauhan Pratapsinh P. Member M 1 1
4 Chauhan Raysinh B. Member M 1 1
5 Chauhan Amarsinh R. Member m 1
6 Chauhan Dahyabhai B. Member M
7 Chauhan Bhagvanbhai D. Member F
8 Chauhan Arajunsinh . Member M
9 Chauhan jashodaben G. Member F 1
10 Chauhan induben B. Member F 1
11 Gohel sheetal b. Member F

Watershed Development Team (IWMP-1), Anand Page 49
Khorvad Watershed Committee
Sl. No.
Names of WCs
Date of Registration as a Society Name Designation M/F SC ST SF MF LF
Land-less UG SHG GP
Any other Education
Function/s assigned#
1
Khorvad Watershed committee
Under progress
Chauhan natavarsinh G. President M 1
2 Chauhan vijaysinh G. Member M 1 1
3 Chauhan Bahadursinh S. Member F 1 1 1
4 Thakor janaksinh J. Member M 1 1
5 Chauhan asokbhai D. Member m 1
6 Chauhan rajendrasinh M. Member M
7 Chauhan Pravinsinh S Member F
8 Padhiyar laljibhai J. Member M
9 Chauhan manishaben I. Member M
10 Chauhan rameshbhai P. Member F
11 Chauhan Jashvantsinh S. Member F
12 Chauhan Sajjansinh N. Member F
13 Takor Samarvijaysinh K. Member
14 Pandya bhanuben D. Member
15 Macwan Premlata n.. Member M

Watershed Development Team (IWMP-1), Anand Page 50
Dholi Watershed Committee
Sl. No.
Names of WCs
Date of Registration as a Society Name Designation M/F SC ST SF MF LF
Land-less UG SHG GP
Any other Education
Function/s assigned#
1
Dholi Watershed committee
Under progress
Paramar Vanrajsinh r President M 1
2 Parmar Geetaben N. Member F 1 1
3 Thakor jayntibhai G. Member M 1 1 1
4 Parmar ashokbhai M. Member M 1 1
5 Parmar dinubhai P. Member M 1
6 Harijan dahyabhai P Member M
7 Parmar sajjanben C Member F
8 Parmar Dhuliben N. Member F
9 Parmar dalpatsinh S. Member M
10 Chauhan prabhatsinh S. Member M
11 Macwan Premlata N. Member F

Watershed Development Team (IWMP-1), Anand Page 51
4.2.2 Self Help Group
Self Help Groups are motivated, small homogenous groups organized together through credit and thrift activities. Self help group initiative
especially for women help uplift their livelihood. Generally self help groups include landless and poor women.
Before formation of the SHGs, during PRA activities, Focussed Group Discussions (FGDs) were held with the women, which came up with
the following observations:
a) Lack of proper credit facilities due to low intervention of formal financial credit institution.
b) Excessive exploitation of weaker section by money lenders
c) Lack of attitude for saving among poor people
d) Lack of knowledge on credit and thrift activity and banking.
With a detailed discussion with some of the local NGOs working in the area like SEWA, it was planned to have some capacity building training
regarding SHG activities. It was also proposed to have some livelihood activities which will promote women empowerment.
Table no. 30: SHG details
S. No.
Total no. of registered SHGs No. of members No. of SC/ST in each
category No. of BPL in each
category With only Men
With only Women
With both
Total members
Categories M F Total M F Total M F Total
1 2 5 2 112
(i) Landless (ii) SF (iii) MF (iv) LF
Total 2 5 2 112 20 54 74 10 28 38

Watershed Development Team (IWMP-1), Anand Page 52
Figure 5: Focused Group Discussion with villagers
(Briefing with villagers about IWMP) Understanding Villager’s Problems.....

Watershed Development Team (IWMP-1), Anand Page 53
4.2.3 User Group:
User Groups are normally formed to manage an activity or asset created under the programme on a long term basis. The user group collect user
charges from their members, oversee the works and manage the benefits.
It was decided that each group would formulate certain internal rules and have a feeling of ownership with community spirit.
Table no. 31: UG detail
S. No. Total no. of UGs No. of members
No. of SC/ST in each category
No. of BPL in each category
Men Women Both Total Categories M F Total M F Total M F Total
1
(i)Landless (ii) SF
(iii) MF
(iv) LF Total
4.3. Physical activities to be undertaken under IWMP-1, Umreth-1
4.3.1 Entry Point activity (EPA)
EPA activities are taken up under watershed projects to build a rapport with the village community at the beginning of the project; generally, certain
important works which are in urgent demand of the local community are taken up. A Group Discussion was conducted with watershed Development
Committee regarding the EPA activity, it was conveyed to the WC that an amount of Rs. 24.28 Lakh was allotted for EPA activity, which was 4 per cent
of total allocated budget. The villagers discussed various activities which they felt is important but after a brief discussion it was conveyed to them
that only those activities can be taken, which revive the common natural resources. It was also taken into priority that there should be an instrument
of convergence which will result in sustainability of activities.

Watershed Development Team (IWMP-1), Anand Page 54
Table no.32: Entry point activities (EPA) (All financial figures in Rs.)
S. No. Names of Villages
Amount earmarked for EPA Entry Point Activities planned Estimated cost (` in
Lakh)
1 Sundalpura 974784
R.C.C wall for protection from flood-1 5.32 R.C.C wall for protection from flood-2 4.27 U.V.Plant (From WASMO) 0.13 Books for “Granth Mandir” 0.14
2 Ahima 194784 Protection Wall 1.94 U.V.Plant (From WASMO) 0.13
3 Silli 871584
R.C.C wall for protection from flood-1 3.19 R.C.C wall for protection from flood-2 1.46 R.C.C. Hume Pipe Drain 0.22 U.V.Plant for Schools from WASMO 0.13 Books for “Granth Mandir” (6 Schools) 0.84 Fencing around Anganvadi Garden and its Development 1.0 Fencing around Anganvadi Garden and its Development 1.0 Computers for School (4 Nos.) 1.0
4 Pratappura 141840 Protection Wall 1.40
5 Khorvad 197808 Protection Wall-1 0.96 Protection Wall-2 0. 96
6 Dholi 48096 Pipe Drain 0.25 Books for “Granth Mandir” 0.22 U.V.Plant (From WASMO) 0.13
Total 2428896 24.69

Watershed Development Team (IWMP-1), Anand Page 55
Table no.33: Details of activities of preparatory phase
S. No. Name of villages Initiation of village level institution
Capacity building
IEC activities Baseline survey
Hydro-geological survey
Technical support agencies
Printing DPR and mapping
of project Area
Estimated Cost
(Rs. in lakh)
1 Sundalpura 10000 240000 15000 20000 5000 15000 25000 75000 2 Ahima 10000 48000 5000 10000 5000 15000 10000 40000 3 Silli 10000 217000 15000 20000 5000 15000 25000 75000 4 Pratappura 10000 35000 5000 10000 5000 15000 10000 40000 5 Khorvad 10000 49000 5000 10000 5000 15000 10000 40000 6 Dholi 10000 12000 5000 5000 5000 5000 5000 20000

Watershed Development Team (IWMP-1), Anand Page 56
4.3.2. Watershed Development Works:
Watershed development works are to be done during second phase of watershed project. A multi-tier ridge to valley sequence approach should be
approached towards implementation of watershed development projects. A net budget of 50 percent is allotted for this work.
(A) Ridge Area Treatment Plans:
It is very important to treat the ridge as this is where the major water resources originate. This involves mainly ravines in Umreth-1 watershed. For
the ravines area treatment of Umreth-1 watershed following structure are been Proposed after interaction between the Watershed Committee, WDTs
and PIA in consultation of MDTs of DWDU.
1. Bori Bundh 2. Grass seeding
1. Bori Bundh
A bund with bories filled with sands is to be made as low cost structure which will help to stop soil erosion and also conserve water. Series of
boribundh in ravine area will help to reduce velocity of water flow which will help to stop soil erosion and also help to stop further ravine formation.
Due to limited fund in IWMP, conversion from other schemes like MGNREGS would help to make sufficient amount of Bori-bunds in treatment area.
2. Grass Seedling
Dense grass which is very suitable for fodder also will be grown on border of sloppy farm land and also on farm bund made during programme.
(B) Slope treatment:
The second tier treatment is the slope treatment. This is generally done on agricultural land or waste land. This generally includes water
conservation or surface water storage structures. This being highly labour intensive, will involve more of manual labour; so, funds from Mahatma
Gandhi National Rural Employment Guarantee Scheme (MGNREGS) can be taken.

Watershed Development Team (IWMP-1), Anand Page 57
Following structures are been proposed in these areas
a. Farm Bund b. Check Wall c. Check Dam d. Afforestation
Farm Bund
Table No. 34.1: Technical Details of Farm Bund
Particulars Value Bund Length Per Ha. 400.00 M. Proposed Area (area of farm) 1.00 Ha. Total Bund Length For Proposed Area 400.00 M. Top Width 0.45 M. Side Slope 1:1 Height 0.60 M. Base Width 1.65 M. Cross-Section of Farm bund 0.63 SqM.
Table No. 34.2: Quantity Excavation for Farm bund
Sr. No Description Unit Quantity 1 Earth Work
Earthwork for embankment including breaking clods. Dressing with all lead and lift (Excluding watering and consolidation)
Cum 200.00
c] From borrow area within 1.0 km Cum 133.00 2 Vegetative Work Sowing of seed on the constructed ridge M 400.00
3 Supply of Stylo/Dhaman Seed @ 4gm/m in(single line) Kg 1.60
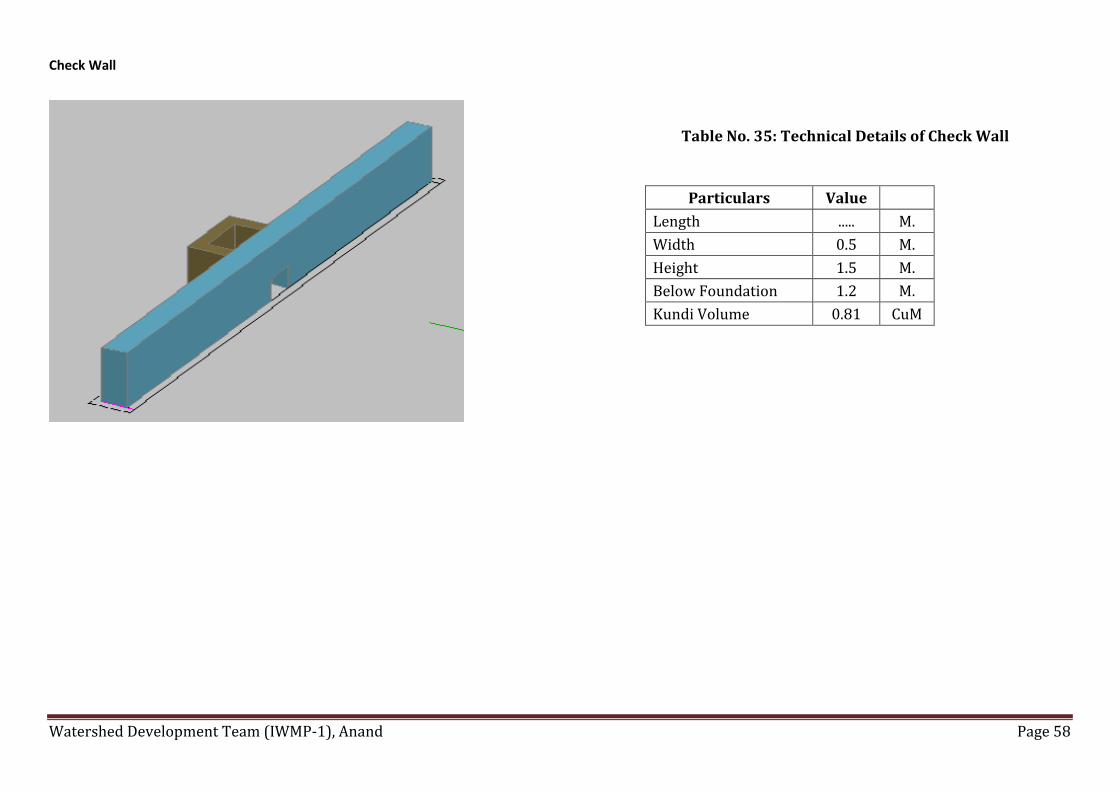
Watershed Development Team (IWMP-1), Anand Page 58
Check Wall
Table No. 35: Technical Details of Check Wall
Particulars Value
Length ..... M.
Width 0.5 M.
Height 1.5 M.
Below Foundation 1.2 M.
Kundi Volume 0.81 CuM

Watershed Development Team (IWMP-1), Anand Page 59
d. Check Dam
Table No. 36.1: Technical Details of Check Dam
Particulars Value Top width 1.00 M. Bottom width 1.20 M. Height 1.50 M. Foundation depth 1.20 M. Length 10 M. Side Slopes
a. Upstream 1:1 b. Downstream 1.5:1
Length of downstream apron 1.5 M.
Table No.36.2: Quantity Excavation for Check Dam
Sr. No
Description Unit Quantity
1. Earth Work
Excavation for foundation upto 1.5 M depth including sorting out and stacking of useful materials and disposing of the excavated stuff up to 50 meter lead.
a. Loose or soft soil Cum 29.00
2. Providing and laying cement concrete (1:4:8 ) and curing complete excluding cost of form work in Foundation and plinth
Cum 4.00
3. Providing and laying cement concrete (1:2:4) and curing complete excluding cost of form work in Foundation and plinth
Cum 19.00
4. Providing and laying controlled cement concrete M 150 and curing complete excluding the const of form work and (B) Walls from top of foundation level upto floor two level
Cum 24.5

Watershed Development Team (IWMP-1), Anand Page 60
e. Afforestation
Table No. 37.1: Technical Details of Afforestation Activities
Particulars Value Crop Name Neem / Babool Plant To Plant Spacing 8.00 M Row to Row Spacing 8.00 M Pit Length 1.00 M Pit Width 1.00 M Pit Depth 1.00 M No. of Plants 156 Nos. Plantation Area 50.00 ha. No. of Plants per ha 1,560 Nos. Gap Filling 20 %
Table No. 37.2: Cost Estimation for afforestation activity
S. No.
Description No. Length (m.)
Width (m.)
Depth (m.)
Unit Quantity Rate Amount
1 Digging of pits for plants in Soft murum 1,560 1 1 1 Cum 1,560.00 10 15600
2 Plants samplings for plantation in Govt. pasture area, sampling not less than 30 cm. height
1,560 Nos. 1,560.00 10 15600
3 Transportation of plants from nursery to camp site up to 40Km
1,560 Nos. 1,560.00 5 7800
4 Loading and unloading of plants 1,560 Nos. 1,560.00 1 1560
5 Rehandling of plants from camp site to actual planting site upto 500m.
1,560 Nos. 1,560.00 2 3120
6 Cost of fertiliser & insecticides incl. application) 1,560 Nos. 1,560.00 10 15600
7 Weeding and Hoeing two times (Twice in year) 1,560 Nos. 1,560.00 2 3120
Total / ha 54600 Totals for 200 ha 312000 10920000

Watershed Development Team (IWMP-1), Anand Page 61
Table no. 38: Activities related to Surface water resources in the project areas (all financial figures in lakh Rs.)
S.
No. Villages name
Type of
structures
Proposed target
Construction of new structures Total target
No. Area to be
irrigated (ha)
Storage
capacity(lit)
Estimated cost
(in lakh)
Area to be
irrigated (ha)
Storage
capacity
Estimated
cost (in lakh)
1 Sundalpura,
Ahima, Silli
Pratappura
Khorvad, Dholi
Pond (35x35x3 m) 3 900 1,47,00,000 7.5
2 Farm Pond 3 500 ------ 0.75
3 Check Dam 6 ------ ------ 16.5
4 Check Wall 394 ------ ------ 222.66
5 Bori-Bundh 1068 750 ------ 5.82
Total

Watershed Development Team (IWMP-1), Anand Page 62
Table no. 39: Activities related to livelihoods by Self Help Groups (SHGs) in the project areas
S. No. Names of Villages
Major activities of the SHGs
Name of activity No. of SHGs involved Average annual income from activity per SHG
(in ` Approx) 1
Sundalpura, Ahima, Silli, Pratappura, Khorvad, Dholi
Vermi composting 7 (75 member) 72000 2 Small Scale Vegetable Cultivation 11 (128 member) 20000 3 Nursery Raising 11 50000 4 Handicraft 22 40000 5 Acid making 19 20000
Table no. 40: Other Activities of Livelihood & Watershed Works Phase – Proposed target
S. No. Name of villages
Livelihood Watershed Work Phase
Total Estimated cost (Rs. In lakhs)
Nursery raising Crop
demonstrations
Land development
(Farm bund)
Afforestation/
Fodder
Development
(unit) (in lakh) (in ha) (in lakh) (no.) (in lakh) (in ha) (in lakh)
1 Sundalpura 3 1.5 18 9 107 10.8 60 32.76 54.06 2 Ahima 2 1.0 2 1 - - 20 11.00 13.00 3 Silli 3 1.5 16 8 46 5.6 30 16.38 31.48 4 Pratappura 1 0.5 1 0.5 - - 10 5.5 6.50 5 Khorvad 2 1.0 - - - - 10 5.5 6.50 6 Dholi - - - - - - 12 6.0 6.00 Total 37 18.5 43.5 12.3 117.54

Watershed Development Team (IWMP-1), Anand Page 63
Cross Section of Earthen Bund
Sr.No. Height Top Width Bottom Width Cross Section Area U/S Slope D/S slope
1 2 1 7 8 1:1 1:2
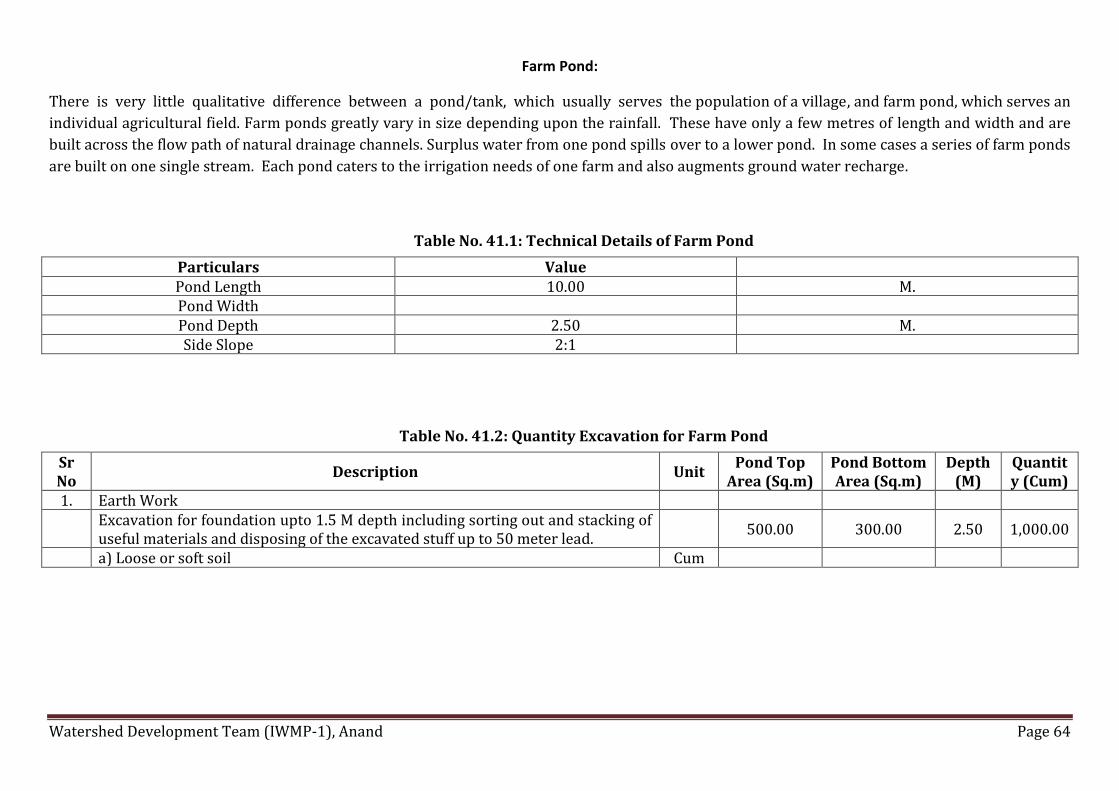
Watershed Development Team (IWMP-1), Anand Page 64
Farm Pond:
There is very little qualitative difference between a pond/tank, which usually serves the population of a village, and farm pond, which serves an
individual agricultural field. Farm ponds greatly vary in size depending upon the rainfall. These have only a few metres of length and width and are
built across the flow path of natural drainage channels. Surplus water from one pond spills over to a lower pond. In some cases a series of farm ponds
are built on one single stream. Each pond caters to the irrigation needs of one farm and also augments ground water recharge.
Table No. 41.1: Technical Details of Farm Pond
Particulars Value Pond Length 10.00 M. Pond Width Pond Depth 2.50 M. Side Slope 2:1
Table No. 41.2: Quantity Excavation for Farm Pond
Sr No
Description Unit Pond Top
Area (Sq.m) Pond Bottom Area (Sq.m)
Depth (M)
Quantity (Cum)
1. Earth Work
Excavation for foundation upto 1.5 M depth including sorting out and stacking of useful materials and disposing of the excavated stuff up to 50 meter lead.
500.00 300.00 2.50 1,000.00
a) Loose or soft soil Cum

Watershed Development Team (IWMP-1), Anand Page 65
Table no.42: Details of allied / other activities
Sr. No.
Name of activity
Type of land Executing
agency Target
(i) Private
(ii) Community
(iii) Others (pl.
specify)
(i) UG (ii)SHG
(iii) Others (pl. specify)
Estimated cost (Rs. in lakh)
Expected month & year of
completion (mm/yyyy)
1 Backyard poultry Private SHG 1.0 2 Animal Husbandry Private 15 3 Animal camp Community SHG 2.5
Total of Livelihood intervention 18.5 1 Crop demonstration Private 18.5 2 Banana Processing SHG 4 3 Computer Training Centre Community 2.5 4 Improved Seed Kit Private 7.5 5 Micro-nutrient kit Private 7.2 6 Bio-Pesticide Kit Private 6.3 7 Micro Irrigation Kit Revolving Fund SHG 6.5 8 Establishment cost for Producer Company Share Holders 10 9 For Neem based ME for 3 clusters UG 7.8
Total of the Production system intervention 70.3

Watershed Development Team (IWMP-1), Anand Page 66
Kitchen Garden Kit
Sr. No. Activity Quantity Unit Rate Quantity
1 Vegetable seeds 5 Packet 200 1000
2 Bucket drip kits 1 Nos. 2000 2000
3 Fertilizers and pesticides, Weeding -- -- 1000 1000
Total (For One Kitchen Garden Vegetable Kit) 4000
Sr. No. Activity Quantity Unit Rate Total cost
1 Vegetable kits to 125 SHG
members 125 Nos. 4000 5,00,000

Watershed Development Team (IWMP-1), Anand Page 67
Production System-1: Neem Based Micro Enterprise:
Introduction:
“In ravine lands Village Watershed Committee will be doing huge Neem Plantation to check Soil Erosion and User Group (Landless) formed to
maintain this plantation will collect Neem Kernels and Sell it to NDDB’s Neem Processing Unit, Anand. NDDB is ready to give primary training to this
User Group and will buy Neem Kernels at Market Rate at prevalent time.
Objective of a Neem Based Micro Enterprise:
1. Build a local institution to cope up with problems of landless farmers/labours.
2. Establish and maintain village level plantation that enhance vegetation and also stop soil erosion in ravines.
3. Control regulates and charge in the community grazing and plantation lands.
4. Undertake the distribution of revenue generated from NME in the village.
Feasibility of Neem based Micro Enterprise (NME):
A detailed survey and Focused Group Discussion was conducted in Umreth-1 watershed area. Data on type of trees naturally grown is collected during
Field to Field visit. In focused group discussion several factors like the type of crops can be grown in ravine land to check erosion is discussed and as
part of it group decided to do huge Neem plantation with the help of BPL Job card holders in the scheme of MGNREGS and group of Landless people
will form User Group to maintain this Neem Plantation and income earned by selling Neem Kernels will be equally devided into User Group which is
maintaining this Neem Plantations.

Watershed Development Team (IWMP-1), Anand Page 68
Table 43 .1 Primary Model for A Neem based Micro Enterprise (NME)
A.
Total Beneficieries (Member of MNE-UG) 30
No. of Neem Trees to be planted No. of Existing Neem tree Neem Trees to be planted
1000 5000 Total 6000
Neem Kernels yielded every year 1,00,000 Kg Cost of cultivation for Neem Tree (See table no. 34.2) 72,500 Rs
B. Area development for neem plantation required Approx. 3000 m2 (preferably land will be allotted by Gram Panchayat @ Rs.1000 per month)
Rs 12000
C. Total Cost for (1year) (A+B)
Rs. 84,500/-
Table no: 43.2 Cost of cultivation for Neem Tree production
Cost Detail Unit cost 1. Cost for Digging pit (1 x 1 x 1 Foot) 27000 Rs 2. Cost for seed 18000 Rs 3. Cost for fertilizer 10,000 Rs 4. Cost for irrigation 10,000 Rs 5. Depreciation cost of C1. (5%) 7500 Rs
Total cost for 5000 Neem Tree plantation Rs. 72,500
Table No. 43.3 Initial investment for Neem based Micro Enterprise (NME)
A. Total Cost for Neem based Micro Enterprise (1year) (A+B+D)
Rs. 84,500/-
B. C1.Fencing + Weighing machine + Small shed + Other tools. Rs.1,50,000
C. Required labour for kernel management (drying and packing) (2 person @2000 per month for each)
Rs.48,000
D. Total initial cost Rs.2,82,500

Watershed Development Team (IWMP-1), Anand Page 69
Table No. 43.4 Revenue and return Details.
S. No Return Details Cost (in Rs.)
1 Cost of Kernels Per Kg = 2,82,500/100000
2.82 Rs/kg 2. Selling Price of Kernels Rs 4 /Kg 3. Net selling Price Rs. 4,00,000 4. Net Profit Rs 1,18,000
Technical Support/Assistance:
To ensure proper technical support for Neem based Micro Enterprise, we will take help and proper guidance from NDDB’s Neem Processing Unit
located Nearby Anand City.

Watershed Development Team (IWMP-1), Anand Page 70
Production System - 2: Vermi-compost unit for Umreth-1 watershed
One of the important occupations of the villagers is animal husbandry. At present, the animal waste is not used by the villagers as agricultural input. If
the farmers start realising the benefits of compost and vermicompost in particular, the productivity of their land can increase manifold. As part of
direct livelihood support, the villagers (mainly land less) are going to receive cows, buffaloes and small ruminants. These animals in turn are going to
produce more waste, which can be used to prepare vermicompost.
It is planned that a vermicompost unit by another SHG would be supported by the project. The SHG members, with the help of hired manpower, can
collect animal-dung. They would process this dung to prepare vermicompost and sell it to the farmers in the village or outside, as per demand.
The process of composting crop residues using earthworms comprise spreading the agricultural wastes and cow dung in layers of 1.5 m wide and 0.9
m high beds of required length. Earthworms are introduced in between the layers @ 350 worms per m3 of bed volume. The beds are maintained at
about 40 - 50% moisture content and a temperature of 20 - 30o C by sprinkling water over the beds. The earthworms being voracious eaters consume
the biodegradable matter and give out a part of the matter as excreta or vermi-castings. The vermi-casting containing nutrients are rich manure for
the plants.
About The Worms
Eisenia fetida, Eudrilus eugeniae, and Perionyx excavatius are some of the species for rearing to convert organic wastes into manure. The worms feed
on any biodegradable matter ranging from coir waste to kitchen garbage and Vermicomposting units are ideally suited to locations / units with
generation of considerable quantities of organic wastes. One earthworm reaching reproductive age of about six weeks lays one egg capsule
(containing 7 embryos) every 7 - 10 days. Three to seven worms emerge out of each capsule. Thus, the multiplication of worms under optimum
growth conditions is very fast. The worms live for about 2 years. Fully grown worms could be separated and dried in an oven to make 'worm meal'
which is a rich source of protein (70%) for use in animal feed.

Watershed Development Team (IWMP-1), Anand Page 71
Use
Vermi compost has more nutrient compare to other manures and fertilizer; so, by the use of vermin-compost we can reduce use of chemical fertilizer.
Vermi-compost not only supply nutrient but also improve quantity of hormones for plant growth, improves the soil structure leading to increase in
water and nutrient holding capacities of soil.
Components of a commercial unit
Sheds
Umreth-1 watershed has high temperature in summer; so, a shed structure is needed for the vermin-compost unit. It can be made by the use of
concrete pillars. While designing the sheds adequate room has to be left around the beds for easy movement of the labourers attending to the filling
and harvesting the beds.
Vermi-beds
Scientific bed side is 75 cm - 90 cm thick depending on the provision of filter for drainage of excess water. The whole bed area should be above the
ground. The bed should have a uniform height over the entire width to the extent possible to avoid low production owing to low bed volumes. The
proper bed width should not be more that 1.5 m to allow easy access to the centre of the bed.
Land
About 125 square meter of land will be required to set up a vermin compost production unit in Umreth-1 watershed. It should have at least 2-3 sheds
each of about 180-200 sq.ft. It should have a good watering arrangement and other equipments as required because moisture is very essential for
vermin-compost production.
Watershed Development Team (IWMP-1), Anand Page 72
Seed Stock
This is very important thing because worms multiply at the rate of 350 worms per m3 of bed space over a period of 6 month to a year.
Fencing
The entire area has to be fenced to prevent the animals and other unwanted elements. These could be estimated based on the length of the periphery
of the farm.
Water Supply System
50% moisture content has to be maintained all the time. Water for the purpose would come from a well nearby.
Machinery
Farm machinery and implements are required for cutting the raw material in small pieces, conveying shredded raw material to the vermi-sheds,
loading, unloading, collection of compost, loosening of beds for aeration, shifting of the compost. Costs of providing necessary implements and the
machinery have to be included in the project cost.
Estimate for a vermin-compost unit:
Requirement of nitrogen for 1 hectare sorghum fodder production=90 kg.
1.6% N available in vermin compost.
90 kg N fulfill by the use of 90/1.6*100= 5625 kg vermicompost (5.5 ton).
Need of vermicompost to fulfill the requirement of nitrogen for 15 hectare 5.5*15 =82.5 (80 ton).
45 kg phosphorus required for 1 hectare sorghum fodder production.
Requirement of phosphorus for 15 hectare fodder production 15*45=675 kg.
Supply of phosphorus through vermin compost 0.7/100*80000=560 kg.
Remaining requirement of phosphorus 675-560=115 kg.
Remaining dose of phosphorus will be supplied by rock phosphate.

Watershed Development Team (IWMP-1), Anand Page 73
One compost cycle need 45 days so we need 8 cycle for 80 ton vermin compost production.
Table: 44.1: Model for A Vermi-compost Unit
S. No Particulars Quantity Rate (Rs.) Amount (Rs.)
1 Wooden ballies (3 m long) 20 50 1000 2 Wooden (4 m long) 25 60 1500
3 Shade mats for covering the roof 125 25 3125 4 Binding wire for tying wooden ballies & mats 20 Kg 50 1000
5 Labour charges for erection of sheds 20 100 2000
6 Shovels, spades, crowbars, iron baskets, 2500
7 Weighing scale (100 kg capacity) 1 2000 2000
8 Cow dung 10 ton 800 8000 9 Worms @ 3 kg per ton 30 kg 80 2400
10 Formation of vermin bed with agro-waste, cow dung and worms
20 bed 250 5000
11 Miscellaneous
Total cost 28,525 Rs.
Table No.44.2: Returns from vermin-composting
Benefits
1. Sale of vermin compost of 80 tones @ Rs.3500/- per ton 80*3500=2,80,000 Rs
2. Sale of worms @ 5 kg per ton of compost and Rs. 50 per kg 400*50=20,000 Rs
Total 3,00,000 Rs/-
Net benefit 3,00,000-28,200=2,71,800 Rs/-

Watershed Development Team (IWMP-1), Anand Page 74
Table no.45: Details of activities in the CPRs in the project areas
S. No. Name(s) of the villages CPR particulars Activity proposed
Target
Target area under the activity (ha)
Estimated expenditure (Rs.)
Expected no. of beneficiaries
1 Sundalpura, Ahima,
Silli, Pratappura, Khorvad, Dholi
Waste land Afforestation/
Fodder & Forest Development
140 77.15 (Lac) 400 household
4.4. Capacity Building:
Capacity Building is the process of assisting the group or individuals to identify and address issues and gain the insights, knowledge and
experience needed to solve problems and implement change.
There is a realization in the development sector that there is a need to appraise the success of development interventions by going beyond the
conventional development targets and measures of success (e.g. in the form of commodities, goods and services) to take into account improvements
to human potential. Capacity building of stakeholders is also increasingly viewed as an important factor in developmental projects that involve
participation of stakeholders at all levels for effective implementation of projects.

Watershed Development Team (IWMP-1), Anand Page 75
Scope of capacity building at Umreth-1 watershed
Alternative Land Use Plan
Scientific technique of Soil and Moisture conservation
Improved and Scientific Agriculture Practices
Fodder development and Management
Afforestation
Meteorological Information
Dairy Development and Management
Income Generation Activities
Table no. 46: Capacity Building Institution:
S. No. Name of the
Training Institute
Full Address with contact no.,
website & e-mail
Type of Institute#
Area(s) of speciali-zation
Accreditation details
Trainings Reference
Year No. of trainings
assigned No. of trainees to be trained
1 Krishi Vigyan Kendra
Research Institutes
Agriculture/ Horticulture/
Animal Husbandry GoI 2012-2014 3 80
2 Anand Agril. University
Anand University Agriculture/
Horticulture/ Animal Husbandry
GoI 2012-2014 3 30
3 FES Anand NGO Capacity Building/
Net Planning Society Reg.
Act 2011-2012 2 50
4 BISAG Gandhinagar Space
application Remote Sensing GoG 2010-2015 3 3

Watershed Development Team (IWMP-1), Anand Page 76
Table no. 47: Capacity Building plan:
S. No. Villages Project Stakeholders Total no. of
persons No. of persons to be trained
No. of training programmes Estimated cost (in lakh)
1 Sundalpura, Ahima,
Silli, Pratappura, Khorvad, Dholi
PIA 5 5 4 12.00
WDTs 4 3 4 5.00
UGs 50 30 3 4.00
SHGs 50 50 5 5.00
WCs 72 50 5 8.00
Table no.48: Information, Education and Communication Activities:
S. No. Activity Executing agency Estimated expenditure (Rs.) Outcome
(may quantify, wherever possible) 1 Street plays Local Drama Groups 15000
Awareness for the importance of watershed project
2 Video shows DWDU Anand 25000 3 Pamphlets and posters DWDU Anand 50000 4 Banners, Hoardings DWDU Anand 50000

Watershed Development Team (IWMP-1), Anand Page 77
CHAPTER – 5 BUDGETING

Watershed Development Team (IWMP-1), Anand Page 78
Budgeting
The first step in budgeting is dividing the cost of the project into various component s as detailed in the common guidelines and done accordingly in
table no. 47. It helps us in further identifying activities under different components and allocate appropriate funds.
Table no. 49: Budget at a glance
Budget Component Cost requirement
Net Project Cost 607.22
-Administrative Costs 60.72 -Monitoring 6.07 -Evaluation 6.07 Preparatory phase: -Entry point activities 24.28 -Institution and capacity building 30.36 -Detailed Project Report (DPR) 6.07 Watershed Works Phase: -Watershed Development works, 303.61 -Livelihood activities for the asset less persons, 60.72 -Production system and micro enterprises 78.93 Consolidation Phase 30.36 Total 607.22

Watershed Development Team (IWMP-1), Anand Page 79
Table no. 50: Village component wise budget available under IWMP-1
Sl no
Villages Activity EPA Institution
and CB DPR Watershed
development Work
Livelihood for asset less
Production system and Microenterprises
Consolidation Total
1 Sundalpura 974784 1218480 243696 12184800 2436960 3168048 1218480 24369600 2 Ahima 194784 243480 48696 2434800 486960 633048 243480 4869600 3 Silli 871584 1089480 217896 10894800 2178960 2832648 1089480 21789600 4 Pratappura 141840 177300 35460 1773000 354600 460980 177300 3546000 5 Khorvad 197808 247260 49452 2472600 494520 642876 247260 4945200 6 Dholi 48096 60120 12024 601200 120240 156312 60120 1202400
Total 2428896 3036120 607224 30361200 6072240 7893912 3036120 60722400
Table no. 51: Village -wise gap in funds requirement
S. No. Villages Total cost requirement (`) Total funds available under IWMP (`) Gap in funds requirement (`)
1 Sundalpura 123.31 121.84 1.47
2 Ahima 40.87 24.34 16.53
3 Silli 109.79 108.94 0.85
4 Pratappura 23.3 17.73 5.57
5 Khorvad 30.60 24.72 5.88
1 Dholi 6.01 6.01 0.00
Total 333.88 303.58 30.3

Watershed Development Team (IWMP-1), Anand Page 80
Table no.52: Details of Convergence of IWMP with other Schemes
S. No. Villages Activity to be carried
out
Fund made available to IWMP
due to convergence (Rs. in lakh)
Scheme with which
convergence took place
Reference no. of activity/ task/
structure in DPR
Level at which decision for
convergence was taken
1 Sundalpura, Ahima,
Silli, Pratappura, Khorvad, Dholi
Bori-bundh 50.00 MGNREGS District level
2 Farm Pond 2.50 MGNREGS District level
3 Farm Bund 13.50 MGNREGS District level
Total
66.00

Watershed Development Team (IWMP-1), Anand Page 81
CHAPTER – 6 EXPECTED OUTCOMES

Watershed Development Team (IWMP-1), Anand Page 82
6.1 Expected Outcomes
6.1.1 Employment
Employment has always been a problem in the village. The principal occupations of the people are dry land agriculture, animal husbandry and casual
labour work. However, rain fall being very limited and erratic, agriculture suffers, i.e. at best they can take only a single crop, which keeps them
partially engaged for about 4 months. Lack of fodder makes animal husbandry very difficult too. So, animal husbandry does not keep them engaged
full time. Thus the people mainly depend upon casual labour, either in the village itself or outside it.
The project plans for creation of both wage employment and self employment opportunities. Wage employment would be created by engaging people
in watershed physical works like construction of earthen bunds, farm bunds, village pond, plantation, etc. Self employment would be created by
providing the people with cash support in the form of direct livelihood activities like agriculture, animal husbandry and enterprise development.
Table no. 53: Employment in Project area
S. NO.
Names of Villages
Wage employment Self employment No. of mandays No. of beneficiaries No. of beneficiaries
SC ST Others Women Total SC ST Others Women Total SC ST Others Women Total 1 Sundalpura 305 788 21647 37538 60276 29 75 2062 3575 5741 15 38 1031 1788 2870 2 Ahima 1124 0 6082 25473 32678 107 0 579 2426 3112 54 0 290 1213 1556 3 Silli 2174 189 14612 58002 74976 207 18 1392 5524 7141 104 9 696 2762 3570 4 Pratappura 410 0 16712 20139 37260 39 0 1592 1918 3549 20 0 796 959 1774 5 Khorvad 1617 0 47804 17577 66998 154 0 4553 1674 6381 77 0 2276 837 3190 6 Dholi 179 0 31937 7476 39591 17 0 3042 712 3771 9 0 1521 356 0

Watershed Development Team (IWMP-1), Anand Page 83
6.1.2.Migration
Small land holding and uncertain rainfall results in very little fodder availability in the locality. The relatively well off farmers bring fodder from
adjoining district Panchmahal (approximately 80kms away) collectively; but the resource poor cannot afford it. On account of agriculture and animal
husbandry providing only part time employment for some part of the year, the people migrate for a better half of the year for wage labour. Moreover
majority of migration is due to availability of secured labour job in nearest GIDC in Savli.
Table no. 54: Details of seasonal migration from Project area
Sl. No. Names of villages No. of persons migrating No. of days per year of migration Pre-project Expected post project Pre-project Expected post project
1 Sundalpura 532 425
90-120
106 2 Ahima 361 288 72 3 Silli 797 637 159 4 Pratappura 279 223 56 5 Khorvad 244 195 49 6 Dholi 101 80 20
6.1.3 Ground water table
Rainfall has been scanty but demand for ground water has been increasing all the time. The ground water table thus has depleted over the years.
Presently it stands at 48 m.
Proper water harvesting structures and percolation tanks would go a long way in increasing water table depth from 28 m in the pre-project level to 35
m in the post project period.

Watershed Development Team (IWMP-1), Anand Page 84
Table no. 55: Details of average ground water table depth in the project areas (in meters)
S. No. Names of Villages Sources Pre-Project level Expected Increase/decrease
(Post- Project)
1 Umreth-1 Open wells 48 42
Bore wells 56 49 Others (specify) - -
6.1.4 Drinking water
All villages have wells on which they depend for their drinking water. During summer water level in most of the villages goes down. WASMO is
working for drinking water with peoples contribution but peoples of some villages reluctant to give contribution.
As a result of the watershed activities, it is expected that the quantity and quality of drinking water would improve.
Table no. 56: Status of Drinking water
S. No.
Names of Villages
Availability of drinking water (no. of months in a year)
Quality of drinking water Comments
Pre-project Expected Post project Pre-project Expected Post-project 1 Sundalpura 11 12 Potable Potable 2 Ahima 10 12 Potable Potable 3 Silli 11 12 Potable Potable 4 Pratappura 11 12 Potable Potable 5 Khorvad 11 12 Potable Potable 6 Dholi 10 12 Potable Potable

Watershed Development Team (IWMP-1), Anand Page 85
6.1.5 Crops
Agriculture primarily depends upon water; but this is what is lacking in Umreth-1 watershed. The surface water is scanty due to uneven rainfall.
All this can change with the integrated land and water management during the watershed project. The planned earthen bunds would prevent the soil
erosion and also help percolate sweet water underground, and preserve some moisture in the soil. This will help in additional area coming under
cultivation and increasing productivity too. The farmers can take more than one season of crops. Different varieties of crops can be taken.
Table no. 57: Details of crop area and yield in the project area
Name of village Name of crops Pre-project Expected Post-project
Area (ha) Average Yield (Qtl) per ha. Area (ha) Average Yield per ha (qtl)
Umreth-1
Kharif
Tobacco 3390 1600 3500 1650
Rabi
Summer Bajra
Project total
6.1.6 Horticulture
Table no. 58: Area under horticulture
S. No. Name of Village Existing area under horticulture (ha) Area under horticulture proposed to be
covered through IWMP 1 Sundalpura 0 25 2 Ahima 3 15 3 Silli 2 10 4 Pratappura 0 5 5 Khorvad 0 5 6 Dholi 0 5

Watershed Development Team (IWMP-1), Anand Page 86
6.1.7 Vegetative cover
There is negligible area under tree cover. and there is much more plantation necessary to stop soil erosion in the ravine area. In the project area
vegetative trees covers around 379ha.
It is planned that 810 ha land to be covered under new plantation.
Table no. 59: Forest/vegetative cover
S. No. Name of Village Existing area under tree cover (ha) Area under tree cover proposed 1 Sundalpura 70 250 2 Ahima 12 30 3 Silli 225 300 4 Pratappura 17 100 5 Khorvad 50 100 6 Dholi 5 30
6.1.8 Livestock
The village has quite a good of livestock population. These include cows, bullocks, buffaloes, goats, sheep and camels. The interventions like provision
of good quality cows and buffaloes, the establishment of a fodder bank and other such related activities would spur up the dairy development in the
village. It is expected that the post project period would see a substantial increase in livestock population and yield from them.

Watershed Development Team (IWMP-1), Anand Page 87
Table no. 60: Details of livestock in the project areas (for fluids please mention in litres, for solids please mention in kgs. and income
in `.)
S. No. Project Type of Animal Pre-Project Expected Post-project
Remarks No. Yield Income `. No. Yield Income `.
1 Umreth-1 Cow (per animal/day) 28 2 16 35 5 22
Buffalo(per animal/day) 34 3 20 45 5 25
Linkages: The direct livelihood activities need good forward and backward support. Without such support system the activities may fail to deliver the
desired results. These linkages would involve credit, machinery, input supply, marketing, etc.

Watershed Development Team (IWMP-1), Anand Page 88
Table no. 61: Backward-Forward linkages
S. No. Project Type of Marketing Facility Pre-project (no.) During the project (no.) Post-project (no.)
1 Umreth-1
Backward linkages Seed supply system 1 2 Fertilizer supply system Pesticide supply system Credit institutions - Bank-1 Bank-2 Water supply Extension services Nurseries Any other (please specify) Forward linkages Storage (including cold storage) Road network Transport facilities
Markets / Mandis Collective marketing
system Collective marketing
system Agro and other Industries Milk and other collection centres Milk collection centre-1 1 Labour Any other (please specify) Fodder bank-1 1

Watershed Development Team (IWMP-1), Anand Page 89
6.2 Logical Framework Analysis
Components Activities Outputs Effect Impact
Village Institution Formation
§ Formation of Watershed Committee, User Group
§ One Watershed Committee each village § Project can be implemented and managed in a democratic and participatory way ensuring equity.
§ Unity and prosperity in the village management.
§ Number of User group depending on the coverage of particular intervention
Strengthening Village Institutions
§ Organise training and awareness programme for Village institutions
§ Awareness camps to be organised. § Quality of management of common resources improved.
§ People's Participation and positive perception towards the programme
§ Capacity building workshops and exposure visits User Group and Watershed Committee
§ trainings and exposure visits UGs and WCs to be held
§ Quality of distribution of benefits between people improved.
§ Facilitating and monitoring the functioning of UGs and WCs
§ Capacity building workshops to be organised
§ Increased awareness amongst women about village resources.
§ Strengthen linkages between UGs and WCs and Panchayat Institutions.
§ 1 Federations of UGs and WC to be formed.
§ Women participation enhanced in decision-making of GVCs.
§ Gender sensitisation of UGs and WCs to increase inclusiveness of samuh decision-making.
§ Involvement of youth and children in village development increased.
§ Sensitise village communities to involve children and youth in development.

Watershed Development Team (IWMP-1), Anand Page 90
Fund Management
§ Improve management and utilisation of UGs and WCs.
§ UGs and WCs operating bank account and managing resources on their own
§ Purpose, frequency and volume of use of the fund enhanced.
§ Prepare communities to explore other sources of income for UGs and WCs.
§ Volume of funds generated for UGs and WCs from other sources of income increased.
Ecological Restoration
§ Protection, treatment and regeneration of common and private lands
§ Common and private lands to be brought under new plantations and agro-horti-forestry like Neem, Adusa, prosopis, Banyan and Peepul
§ Fodder availability from common and private lands increased.
§ Better Ecological order in the area
§ Protection, treatment and regeneration of ravine lands
§ Ravine lands to be brought under new plantations and protection
§ Accessibility to common and ravine lands increased with removal of encroachments and resolution of conflicts.
§ Increase in the proportion of households having more security of fodder
§ Plantation of fruits and forest species
§ Trainings, exposure visits and meetings to be organised for communities, village volunteers and staff
§ Reduction in drudgery of fodder and fuel collection, especially women
§ Impart trainings, conduct meetings and organise exposure visits for communities, village volunteers and staff to effectively plan, execute and monitor activities
§ Income generation intervention promoted
§ Identification and promotion of non-timber forest produce based income generation activities

Watershed Development Team (IWMP-1), Anand Page 91
Rainfed Area Development
§ Treatment of land through improved soil and moisture conservation practices on watershed basis
§ Land to be brought under improved soil moisture conservation practices
§ Improved productivity of treated land
§ Increase in proportion of households having more security of food
§ Promotion of good agricultural practices- horticulture, improved crop and vegetable
§ Good agricultural practices to be promoted
§ Increased availability of water in wells
§ Organic farming to be promoted § Increase in annual agriculture production
§ Increase in contribution of agricultural income to the household income
§ Fodder banksto be established § Farmers adopt organic farming practices
§ Promotion of organic farming practices
§ Agriculture based livelihood income generation activities to be promoted
§ Fodder security of farmers enhanced.
§ Formation of Fodder banks to increase fodder security and promote dairy development among communities
§ Water harvesting structures to be constructed
§ Increase availability of water for 9 to 12 months
§ Identification and promotion of agri-produce based income generation activities like grading, processing and packaging.
§ Drip Irrigation facilities to be distributed among farmers
§ Increased availability of water for livestock
§ Promotion of better Irrigation practices like drip irrigation
§ Approx 15000 person days of employment to be generated
§ Availability of irrigation water established
§ Impart trainings, conduct meetings and organise exposure visits of communities, village volunteers and staff to effectively plan, execute and monitor activities
§ Trainings, exposure visits and meetings to be organized for communities, village volunteers and staff
§ Farmers take two crops in a year

Watershed Development Team (IWMP-1), Anand Page 92
§ Increase in agricultural productivity of land
§ Availability of drinking water enhanced
Women’s Socio-political and economic empowerment
§ Formation & Strengthening of women’s SHG groups
§ Women’s SHG groups to be formed § Enhanced capacities of leaders of women's group in taking initiatives to solve problems at different levels.
§ Position of women in household, community, society (politically, socially and economically) as perceived by women and community at large
§ Capacity building of womenfolk § Federation of Women’s SHGs to be formed
§ Performance enhancement of SHGs in terms of participation, decision-making, leadership and fund management.
§ Capacity building of SHG leaders and accountants
§ Trainings to be conducted for preparation of woollen products from sheep and goats
§ Improved access to credit for livelihood purposes.
§ Equality & Equity in gender relations at home (decision making, expenditure, children’s education, health)
§ Linking SHGs with external financial institutions
§ Increased household income.

Watershed Development Team (IWMP-1), Anand Page 93
CHAPTER -7 QUALITY AND SUSTAINABILITY ISSUES

Watershed Development Team (IWMP-1), Anand Page 94
7 Quality and Sustainability Issues
7.1 Plans for Monitoring and Evaluation
A Web-based GIS System is being developed for monitoring and evaluating the project in its planning & implementation phases. The system
would be available on a public domain and can be accessed by all the stakeholders of the project. The system shows the entire state of Gujarat and all
of those areas selected over the next 18 years. Filtering allows the user to zoom onto one particular project. Details related to soil type, Land-use
classification, inhabitation etc., can be obtained village-wise. Furthermore, survey-number wise details related to ownership, irrigation source, yield
etc., can also be accessed by the users of the system. This system is being used for pooling up the details obtained from the DPR. In other words, the
DPR is made available online in the form of a database which will help the stakeholders know areas of importance viz., already treated
areas/historical works in the area, proposed areas for treatment etc., for further treatment and planning. The system would also show the satellite
imageries of various years from the project inception stage to the project closing stages. This allows the user to evaluate the effectiveness of the
treatment and thereby plan corrective measures for the project area. The system would serve as an aiding tool to the planners and evaluators for
judging the efficacy of the project.
Yet another component of the Web-based GIS system is the Mobile based Monitoring & Evaluation System, which will help the ground staff
alias WDTs (Watershed Development Team) to transmit information from the ground level to the central server. Also, any higher-up official in charge
of the project can obtain information regarding the project area on their mobile phone by means of an SMS. The system works in the following
manner. The WDT equipped with a GPS instrument marks the latitude-longitude information of various treatment areas during the DPR. The probable
sites are then transferred onto the central server. During the works phase, any progress in the treatment areas is reported to the server by means of
an SMS by the WDT. Similarly, any nodal officer or higher-up official can view the progress in a project by means of summarized reports generated
over frequent periods of time.

Watershed Development Team (IWMP-1), Anand Page 95
7.2 Plans for Project management:
The Project management of any watershed programme is very important. It mainly depends upon the community organisation and the village
level institutes. In Umreth-1, watershed committee and various user groups have been formulated for post project operation and maintenance of
assets created during project period. Major emphasis will be on equity and sustainable benefit of the project even after implementation stage. A
proper link-up will be built during project period with various institutes and capacity building organisation. They will act as a major kingpin during
post implementation for scaling up the successful experience during project.
7.3 Watershed Development Fund:
The major source of financial assistance after post implementation period is watershed Development Fund. The contribution of it will comes mainly fund the following:
7.4 User Charges:
Various user groups will be formed in village. These user groups will collect user charges according to the designated rules formed during the
formation of user group. These funds will be transferred to the WDF funds as per these formulated rules. The secretary of watershed committee (WC)
shall maintain the records of the following.

Watershed Development Team (IWMP-1), Anand Page 96
CHAPTER -8 MAPS
Baseline Map Geomorphology Map Groundwater Map Land Use /Land Cover Map River Body Map Slope Map Soil Map Action Plan Map: Sundalpura Action Plan Map: Ahima Action Plan Map: Silli Action Plan Map: Khorvad Action Plan Map: Pratappura Action Plan Map: Dholi

Watershed Development Team (IWMP-1), Anand Page 97

Watershed Development Team (IWMP-1), Anand Page 98

Watershed Development Team (IWMP-1), Anand Page 99

Watershed Development Team (IWMP-1), Anand Page 100

Watershed Development Team (IWMP-1), Anand Page 101

Watershed Development Team (IWMP-1), Anand Page 102

Watershed Development Team (IWMP-1), Anand Page 103

Watershed Development Team (IWMP-1), Anand Page 104

Watershed Development Team (IWMP-1), Anand Page 105

Watershed Development Team (IWMP-1), Anand Page 106

Watershed Development Team (IWMP-1), Anand Page 107

Watershed Development Team (IWMP-1), Anand Page 108

Watershed Development Team (IWMP-1), Anand Page 109