detailed fault structure highlighted by finely relocated...
TRANSCRIPT
GEOPHYSICAL RESEARCH LETTERS, VOL. ???, XXXX, DOI:10.1029/,
Detailed fault structure highlighted by finely relocatedaftershocks, Arthur’s Pass, New Zealand
S.BannisterInstitute of Geological and Nuclear Sciences, PO Box 30368, Lower Hutt 6315, New Zealand
C.ThurberDepartment of Geology and Geophysics, University of Wisconsin-Madison, Wisconsin, USA
J.LouieUniversity of Nevada, Reno, USA
More than 6000 aftershocks were recorded following the1994 June 18 Arthur’s Pass Mw6.7 earthquake in South Is-land, New Zealand. Here we relocate over 3500 of the after-shocks using double-difference tomography to map detailedfault structures, and obtain a 3-D model of P-wave velocityand V p/V s ratio in the volume around the aftershock re-gion. Waveform cross-correlation methods are used to cal-culate high quality differential times for event pairs. Twoparallel clusters in particular are very well defined after thedouble-difference relocation, with an apparent dip of ∼70-80◦ and ∼N60E ±10◦ strike. A third NW-dipping clusteraligns very closely with one of the preferred fault planes forthe mainshock, corroborating previous interpretations of themainshock mechanism.
Results from the double-difference tomography indicateP-wave velocities of 5.5-6.1 km/s in the aftershock region,together with a V p/V s of ∼1.7, consistent with values ex-pected for Torlesse graywacke at 3-10 km depth. However,V p and V p/V s change markedly immediately above the up-per bound of the seismicity, with a V p of 4.5 to 5.5 km/sand elevated V p/V s found in the top 2 km. This suggeststhat the upper depth limit of seismogenesis is bounded byan apparently weak surface layer. The brittle-ductile transi-tion defined by the lower limit of seismicity is also very welldefined, at 10 ±0.5 km.
1. Introduction
The boundary between the Pacific and Australian platespasses through South Island, New Zealand, changing in na-ture from oblique subduction in the north, the Hikurangisubduction zone, to oblique continent-continent collision, incentral South Island. The nature of the transition betweenthe subduction zone and the continent-continent collisionis still enigmatic. In central South Island the Alpine Fault(Fig. 1) appears to accommodate both strike slip and con-vergent motion [Sibson et al., 1979; Norris et al., 1990].Deep seismic reflection data indicate a dip of 40-50◦ to thesoutheast for the fault, while geological data suggest thatthe fault changes in nature at a depth of ∼25-30 km to a
Copyright 2006 by the American Geophysical Union.0094-8276/06/$5.00
sub-horizontal detachment within the Pacific plate [Well-man, 1979].
In comparison, in northern South Island, geodetic dataindicate that the relative motion between the Pacific andAustralian plates is predominantly taken up by four prin-cipal NE-SW-trending strike-slip faults; the Alpine-Wairau,Awatere, Clarence, and Hope Faults (Fig.1). Geodetic sliprates reach up to 20-25 mm/yr on the Hope fault [Holt andHaines, 1995; Bourne et al., 1998], while the current sliprates appear to be lower on the northern faults.
The transition between these two regions, near the junc-tion between the Alpine Fault and the Hope fault, is markedby a high level of diffuse seismicity [Leitner et al., 2001] aswell as by a high level of maximum shear strain rate [Beavanand Haines, 2001].
The 1994 June 18 Arthur’s Pass Mw6.7 earthquake oc-curred just south of this junction (Fig 1), about 25 km south-east of the Alpine Fault, and south of the Hope fault. Bodywave modelling by Abercrombie et al. [2000] found the bestfitting source mechanism involved primarily reverse fault-ing, with a NE-SW strike, and a centroid depth of ∼5 km.Such reverse faulting may help to account for the margin-perpendicular component of plate convergence in this region[Robinson and McGinty , 2000; Walcott , 1998].
Following the Arthur’s Pass earthquake more than 6000aftershocks were recorded by 16 portable (1 Hz) seismome-ters as well as by permanent New Zealand network (NZNSN)stations. Local magnitudes of the aftershocks ranged fromML1 to ML6.1. The aftershock distribution extended up to30 km SSE of the mainshock location (Fig. 1). Most after-shocks were subsequently located by Robinson and McGinty[2000] using a 3-D velocity model. They determined thatthe majority of aftershocks had strike-slip mechanisms, con-sistent with the regional stress field, and that most of thelarger aftershocks (e.g. ML6.1, ML5.7) occurred more than20 km to the south, also with strike slip focal mechanisms[Robinson and McGinty , 2000].
Here we relocate the Arthur’s Pass aftershocks, to de-rive new information on the secondary faulting which tookplace following the mainshock. We apply the recently devel-oped double-difference (DD) tomography method of Zhangand Thurber [2003] to relocate the aftershocks, making useof absolute and waveform-based differential time measure-ments. The high relative precision of the relocated after-shocks reveals details of the secondary fault structure. Asa by-product we also obtain information about variation ofthe P-wave velocity (V p) and V p/V s ratio in the vicinity ofthe mainshock, aftershocks, and the Alpine Fault.
1
X - 2 BANNISTER ET AL.: FAULT STRUCTURE, ARTHUR’S PASS
2. Event relocation
We use the DD tomography algorithm (tomoDD) ofZhang and Thurber [2003] for event relocation. The tech-nique minimizes residuals between observed and calculatedarrival-time differences for pairs of closely located earth-quakes, while also minimizing the residuals of absolute ar-rival times. This approach builds on the DD location proce-dure of Waldhauser and Ellsworth [2000], which utilises thedifferential times of catalog P and S phase times, as well asdifferential times derived from waveform cross-correlation.In addition to solving for the hypocentral parameters, thetomoDD algorithm solves for the 3-D velocity structure inthe model region, requiring an additional smoothing param-eter and damping parameter, as described by Zhang andThurber [2003].
Initial hypocenter locations for the inversion were thosedetermined by Robinson and McGinty [2000], although thetotal number of events was reduced to 3572 events for thisstudy. Many of the excluded events occurred in the firstfew days following the mainshock; these earliest aftershockswere not well constrained due to the delay in deploying allof the portable seismometers.
Differential times were calculated for event pairs separatedby less than 4 km, for all stations less than 140 km from theparticular cluster centroid. Use of such a maximum distancecriteria reduces the total number of required correlation cal-culations, but is justifiable, as the correlation between wave-forms from different events typically decreases rapidly withincreasing inter-event separation.
Cross-correlation and bispectrum (BS) [Du et al., 2004]methods were used to calculate the waveform-based differ-ential times (WBDT) for all event-station pairs, after pre-filtering, following the technique of Du et al. [2004]. Thesederived differential times were weighted based on the qualityof the arrival time measurements. Catalog-based differentialtimes (CTDT) were also calculated between closely spacedevents from manually picked P- and S- phase times.
Absolute arrival times and the two types of differentialtimes (CTDT and WBDT) were then combined and simulta-neously inverted using tomoDD [Zhang and Thurber , 2003]in an iterative least-squares procedure which utilises theLSQR method [Paige and Saunders, 1982]. The full datasetwas comprised of 30828 absolute P-times, 19413 absolute Sphases, and 664427 differential times.
The P-wave velocities derived by Eberhart-Phillips andBannister [2002] from earthquake and active-source datawere used to form the initial velocity model for the travel-time calculations. We interpolated their velocities onto afiner grid (shown in Supplementary Figure 1) to encompassour aftershock zone. Our finer inversion grid has a mini-mum grid spacing of 7 km along the x- and y-axes, in thesection of the inversion volume with the highest ray pathcoverage, and grid layers at 0,2,4,6,10, 16 and 30 km depth,fully encompassing the aftershock volume.
Following 30 iterations of the inversion procedure, the rootmean square residual (rms) of the WBDT measurements de-creased 92%, from 102 ms down to 8 ms, while CTDT resid-uals decreased by 61%, from 95 ms before relocation downto 37 ms. The mean change in epicenter and focal depthwas ∼400m and ∼900 m respectively.
Relocated events are plotted in Fig.1 in map view, whileFig. 2 shows the relocated events projected onto a depthcross-section with a strike of N150E◦. A subset of 465 ’best-quality’ events were selected out of the full relocated after-shock data set on the basis of minimum station-epicenterdistance (<5 km) and the maximum azimuthal gap between
recording stations (< 120◦). The distribution of this sub-set of ’best-quality’ events highlights several event clusters,(a)-(d), which are clearly visible in Fig. 2.
The maximum depths of the seismic activity in the after-shock distribution are very well defined. More than 98% ofthe relocated events occur above 10 km depth, sharply defin-ing the depth to the brittle-ductile transition in this region.This depth limit is just a few kilometers shallower than es-timates by Leitner et al. [2001] for the South Island as awhole, which they determined from earthquakes relocatedusing a 1-D inversion.
2.1. Velocity structure; V p and V p/V s
The local V p and V p/V s velocity structure was also de-rived as part of the tomographic inversion. Fig. 3 showscross-sections of derived V p and V p/V s; slices through the3-D V p and V p/V s volumes taken at a strike of N150E◦
(Fig 1). The velocity structure is very well resolved in theregion of the aftershocks, although not in the footwall ofthe Alpine Fault (Fig. 3) due to the lack of recording seis-mometer stations on the north-west side of the Alpine Fault.We use the derivative weight sum (DWS) [Thurber , 1993] ateach grid node as a measure of the raypath coverage, and inFig. 3 do not plot velocity values where the DWS at a nodeis less than 20.
We find an average V p of 5.5-6.1 km/s in the vicinity ofthe aftershocks, which is fairly typical in the central SouthIsland for this depth range [e.g. Van Avendonk et al., 2004;Eberhart-Phillips and Bannister , 2002]. Jurassic Torlessegraywacke is exposed on the surface above the aftershocks;petrophysical studies of South Island Torlesse graywackeshow an average V p of just over 6.0 km/s [Okaya et al.,1995]. V p/V s is ∼1.7 at the same depth range in the after-shock vicinity, which is as measured for laboratory samplesof South Island Torlesse graywacke [Christensen, 1999].
Immediately above the aftershocks however V p is lowerthan expected, between 4.5 and 5.5 km/s, while V p/V s iselevated, between 1.8 and 1.9. Torlesse graywacke is ex-posed at the surface so a change in lithology with depth isnot advocated. Such changes in V p and V p/V s could alter-natively indicate higher than normal fluid pressure and/orincreased crack density [Eberhart-Phillips and Bannister ,2002]. We note that the upper bound of the seismicity at ∼2km depth appears to be directly correlated with the changein V p/V s and V p at that depth, suggesting a direct connec-tion between the velocity difference and the seismic-aseismictransition.
The average V p decreases by ∼5% in the hanging wall(southeast) of the Alpine Fault (indicated by ’AF’ in Fig. 3),down to ∼5.7 km/s, which extends down to ∼15 km depth.We note that the dip of the Alpine Fault in the Arthur’s Passregion is unconstrained at 5-15 km depth, although a dip of∼40◦ has been inferred in active-seismic work ∼100 km tothe south. Similar low V p velocities have been found inthe Alpine Fault hanging wall 60-120 km to the south using3-D seismic tomography [Eberhart-Phillips and Bannister ,2002], where a broad 4% decrease in V p was found extendingdown to at least 14 km depth. In the same region Stern et al.[2001] inferred a velocity reduction of 6-10% in the vicinityof the fault on the basis of travel time delays from wide anglereflections and teleseismic P waves. Eberhart-Phillips andBannister [2002] suggested that the velocity reduction nearthe fault may result from a combination of increased crackdensity, high pore-pressure, increased temperature and ac-tive strain. However in our current study Fig. 3 shows that
BANNISTER ET AL.: FAULT STRUCTURE, ARTHUR’S PASS X - 3
the V p/V s ratio is low (∼1.6) in the hanging wall of theAlpine Fault, contrary to what might be expected if highfluid pressures were present [Eberhart-Phillips et al., 1989].This is consistent with the hypothesis that the high-gradeschist near the fault has been depleted of fluid, as Wanna-maker et al., 2002 inferred from magnetotelluric data ∼100km to the south.
3. Discussion
The complex nature of the Arthur’s Pass aftershocks hasbeen discussed by Robinson and McGinty [2000] and Aber-crombie et al. [2000, 2001]. Of note is the distributed na-ture of the aftershocks, with aftershocks occurring up to30 km southeast of the mainshock epicenter. Robinson andMcGinty [2000] examined the regional stress field in the re-gion around the mainshock and aftershocks, and found astress field favouring strike-slip faulting, not thrusting. Theyobserved a fair correspondence between the aftershock dis-tribution and regions of high induced Coulomb Failure Stressdue to the mainshock, on optimally oriented fault planes.
The spatial distribution of the relocated aftershocks(Fig. 1) shows several apparent lineations, which were alsonoted by Robinson and McGinty [2000] and Abercrombieet al. [2000]. Following our relocation analysis however thelineations now are more sharply defined. The cross-sectionshowing the projections of our relocated aftershocks (Fig. 2)indicates that the majority of events are located between ∼2and 10 km depth, and that there are distinct clusters in the’best-quality’ events, marked as (a),(b),(c) and (d) in Fig. 2.
Cluster (a), at the northwest end of the aftershock se-quence, lies very close to the projection of the centroid ofthe mainshock, as determined from combined body waveand empirical Green’s function data [Abercrombie et al.,2000] (Fig. 2). Their preferred solution for the mainshockinvolved reverse-faulting along a NW-dipping fault plane,with a centroid depth, strike, dip and rake of 5 km, 221◦,47◦ and 112◦ respectively. The apparent position and NWdip of cluster (a) agrees closely with the preferred fault planefor the mainshock. We infer that the aftershocks in eventcluster (a) are likely on the mainshock fault plane, and thatthe mainshock rupture extended from ∼2 km to ∼10 kmdepth.
Event clusters (b) and (c), 10-15 km SSE of cluster (a), arefinely resolved (Figs. 2 and 3), and have an apparent dip tothe northwest of ∼70-80◦. The N150E◦ strike used for thecross-section appears to be the optimum strike for projectionof these two aftershock clusters; the width of these projectedclusters broaden when the strike of the cross-section is var-ied by ±10◦. We infer that the events in the aftershockclusters (b) and (c) in Fig. 2 represent oblique-slip faultingon two secondary faults, dipping 70-80◦ to the NW, with astrike of ∼N60E◦. One of the larger aftershocks (ML4.1) inlineation (b) was examined using two-dimensional slip inver-sion by Abercrombie et al. [2001]; they found the preferredfault plane had a NE-SW strike, parallel to the lineation.Cluster (d), further to the southeast, appears to have a strikeof ∼N70-80E◦ and has an apparent dip of ∼70-80◦ to thesouth-east rather than north-west. The largest aftershock,ML5.1, occurred in the vicinity of cluster (d), with a dextralstrike-slip mechanism involving a strike and dip of 253◦ and87◦ respectively [Abercrombie et al., 2001].
Plate convergence in this region is quite oblique, at ∼19◦
[Cande and Stock , 2004]. Geological data suggest that per-haps up to 25% ±15% of the strike-parallel plate motionis accommodated on structures other than the Alpine Fault
[Norris and Cooper , 2000]. This varies along the strike of theAlpine Fault, depending on changes in the crustal composi-tion on either side of the fault, on the strike of pre-existingfaults, and on the spatially changing rate of crustal exhuma-tion and erosion [Norris and Cooper , 2000]. Southwest ofthe Arthur’s Pass region for example it is thought that theAlpine Fault accommodates a high proportion of the inter-plate slip; the overall displacement of the Alpine Fault isclearly transpressional, with components of both strike-slipand dip-slip [Norris and Cooper , 2000]. By comparison, inthe Arthur’s Pass region, although the dextral slip parallelto the margin is thought to primarily occur on the AlpineFault and the dextral strike-slip Hope Fault (Fig. 1), thesecondary faults highlighted here (e.g. clusters (b) and (c)of Fig. 2) and by previous work [Robinson and McGinty ,2000] likely reflect additional, secondary, structures accom-modating some of the strike-parallel slip.
4. Conclusions
We have highlighted the dip and strike of several sec-ondary faults in the Arthur’s Pass region by relocating af-tershocks of the 1994 Arthur’s Pass Mw6.7 earthquake. Twoclusters (b and c) in particular are very well defined afterdouble-difference relocation, with an apparent dip of ∼70-80◦ and ∼N60E ±10◦ strike. These secondary faults mayhelp accommodate some part of the dextral slip parallel tothe Alpine Fault, while the mainshock accounts for someof the perpendicular component of slip, as suggested by[Robinson and McGinty , 2000].
Results from the double-difference tomography indicateP-wave velocities of 5.5-6.1 km/s in the aftershock region,together with a V p/V s of ∼1.7, consistent with values ex-pected for graywacke at 3-10 km depth. However, V pand V p/V s change markedly immediately above the upperbound of the seismicity, with V p of 4.5-5.5 km/s and ele-vated V p/V s found in the top 2 km. This suggests a causalrelationship between the upper depth limit of seismogenesisand the near-surface zone of low V p and high V p/V s, whilethe brittle-ductile transition defined by the lower limit ofseismicity is also well defined, at 10 ±0.5 km.
Close to the Alpine Fault the average P-wave velocity de-creases by ∼5% in the hanging wall of the Alpine Fault,down to ∼15 km depth. We also find low V p/V s valuesclose to the fault, which implies that material near the faultmay already be de-watered, as also inferred from magne-totelluric data 100 km down strike along the Alpine Fault.
Acknowledgments. We thank Russell Robinson and JohnBeavan for their assistance and helpful discussions. Illustrationswere assisted by use of the GMT software of Wessel & Smith(1991). Funding was provided by Foundation for Research, Sci-ence and Technology contract C05X0203. This work was possibleonly because of the field work effort of M.Reyners, M.Kopeykin,R.Maunder and A.Cresswell.
References
Abercrombie, R., T. Webb, R. Robinson, P. McGinty, J. Mori,and R. Beavan (2000), The enigma of the Arthur’s Pass, NewZealand, earthquake - 1 reconciling a variety of data for anunusual earthquake, J.Geophys.Res., 105(B7), 16,119–16,137.
Abercrombie, R. E., S. Bannister, A. Pancha, T. H. Webb, andJ. J. Mori (2001), Determination of fault planes in a complexaftershock sequence using two-dimensional slip inversion, Geo-physical Journal International, 146 (1), 134–142.
X - 4 BANNISTER ET AL.: FAULT STRUCTURE, ARTHUR’S PASS
Beavan, J., and J. Haines (2001), Contemporary horizontal veloc-ity and strain rate field of the Pacific-Australian plate bound-ary zone through New Zealand, J.Geophys.Res., 106, 741–770.
Bourne, S., T.Arnadottir, J.Beavan, D.J.Darby, P.C.England,B.Parsons, R.I.Walcott, and P.R.*Wod* (1998), Crustal defor-mation of the Marlborough fault zone in the South Island ofNew Zealand:geodetic constraints over the interval 1982-1994,J.Geophys.Res., 103, 30,147–30,165.
Cande, S., and J. Stock (2004), Pacific-Antarctic-Australia mo-tion and the formation of the Macquarie Plate, Geophys.J.Int.
Christensen, N. (1999), Physical and chemical properties of southisland, new zealand rocks, Tech. rep., Univ. of Wisconsin,Madison.
Du, W. X., C. H. Thurber, M. Reyners, D. Eberhart-Phillips,and H. J. Zhang (2004), New constraints on seismicityin the Wellington region of New Zealand from relocatedearthquake hypocentres, Geophysical Journal International,158 (3), 1088–1102.
Eberhart-Phillips, D., and S. Bannister (2002), Three dimen-sional crustal structure in the Southern Alps region of NewZealand from inversion of local earthquake and active sourcedata, J.Geophys.Res., 107(B10), doi:10.1029/2001JB000,567.
Eberhart-Phillips, D., D. Han, and M. D. Zoback (1989), Em-pirical relationships among seismic velocity, effective pressure,porosity, and clay content in sandstone, Geophysics.
Holt, W. E., and A. J. Haines (1995), The kinematics of northernSouth Island, New Zealand, determined from geologic strainrates, J.Geophys.Res., pp. 17,991–18,010.
Leitner, B., D. Eberhart-Phillips, H. Anderson, and J. Nabelek(2001), A focused look at the Alpine Fault, New Zealand: seismicity, focal mechanisms, and stress observations,J.Geophys.Res., 106(B2), 2193–2220.
Norris, R., and A. Cooper (2000), Late quaternary slip rates andslip partitioning on the Alpine Fault, New Zealand, Journal ofstructural geology, 23(2/3), 507–520.
Norris, R. J., P. O. Koons, A. F. Cooper, and J. P. Platt (1990),The obliquely-convergent plate boundary in the South Islandof New Zealand; implications for ancient collision zones, Aus-tralasian tectonics, 12 (5-6), 715–725.
Okaya, D., N. Christensen, D. Stanley, and T. Stern (1995),Crustal anistropy in the vicinity of the alpine fault zone., NewZealand Journal of Geology and Geophysics, 38, 579–583.
Paige, C., and M. Saunders (1982), LSQR: An algorithm for sparelinear equations and least squares problems, Trans. Math.Software, 8, 43–71.
Robinson, R., and P. McGinty (2000), The enigma of the Arthur’sPass, New Zealand, earthquake - 2. the aftershock distribu-tion and its relation to regional and induced stress fields,J.Geophys.Res., 105(B7), 16,139–16,150.
Sibson, R., S.H.White, and B.K.Atkinson (1979), Fault rock dis-tribution and structure within the Alpine Fault zone: A pre-liminary account, in The origin of Southern Alps, pp. 55–65.
Stern, T., S. Kleffmann, D. Okaya, M. Scherwath, and S. Bannis-ter (2001), Low seismic-wave speeds and enhanced fluid pres-sure beneath the southern alps of new zealand, Geology, 29 (8),679–682.
Thurber, C. (1993), Local earthquake tomography: velocities andVp/Vs - theory, in Seismic tomography: Theory and Practice,edited by H.M.Iyer and K.Hirahara, pp. 563–580, Chapmanand Hall.
Van Avendonk, H., W.S.Holbrook, D.Okaya, J.K.Austin,F.Davey, and T.Stern (2004), Continental crust under com-pression: A seismic refraction study of South Island Geophys-ical Transect 1, South Island, New Zealand, J.Geophys.Res.,109 (B06302), doi:10.1029/2003JB002790.
Walcott, R. I. (1998), Modes of oblique compression; late Ceno-zoic tectonics of the South Island of New Zealand, Reviews ofGeophysics, 36 (1), 1–26.
Waldhauser, F., and W. L. Ellsworth (2000), A double-differenceearthquake location algorithm: Method and application to thenorthern Hayward fault, California, Bulletin of the Seismolog-ical Society of America, 90 (6), 1353–1368.
Wannamaker, P., G. Jiracek, J. Stodt, T. Caldwell, V. Gon-zalez, J. McKnight, and A. Porter (2002), Fluid generationand pathways beneath an active compressional orogen, tehnew zealand southern alps, inferred from magnetotelluric data,J.Geophys.Res.
Wellman, H. (1979), An uplift map for the South Island of NewZealand, and a model for the uplift of the Southern Alps, Bull.R. Soc. N.Z.
Zhang, H. J., and C. H. Thurber (2003), Double-difference tomog-raphy: The method and its application to the Hayward Fault,California, Bulletin of the Seismological Society of America,93 (5), 1875–1889.
BANNISTER ET AL.: FAULT STRUCTURE, ARTHUR’S PASS X - 5
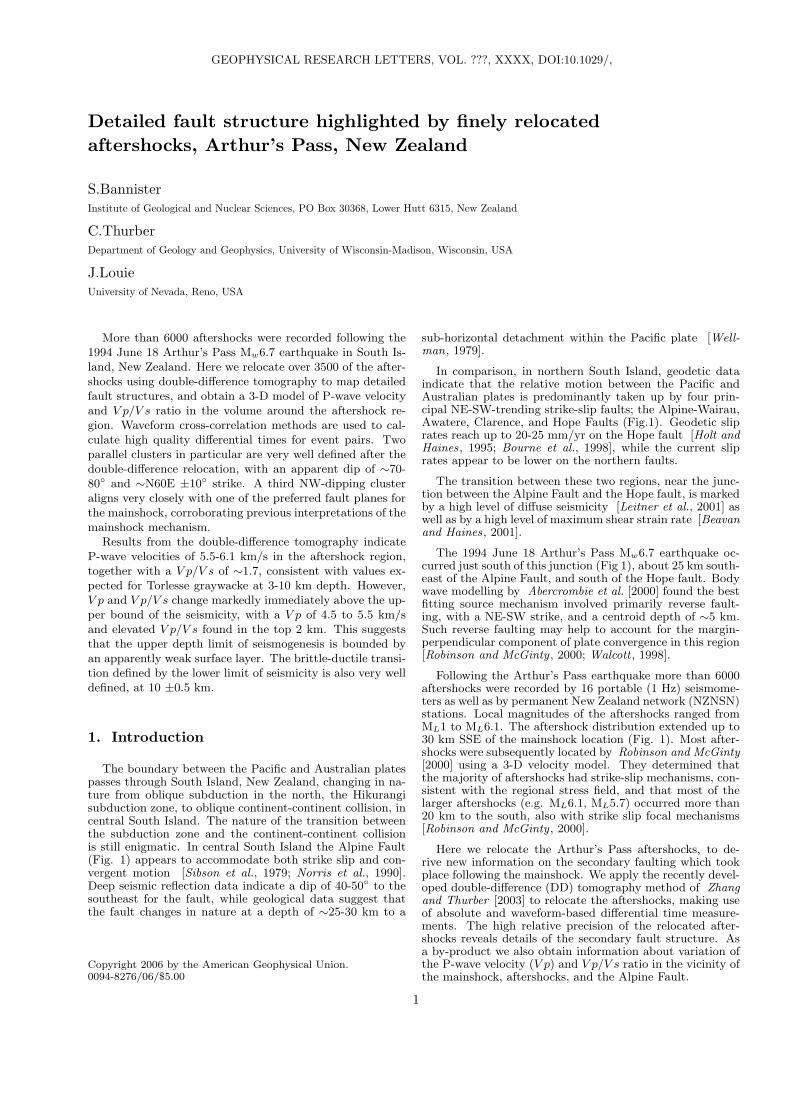
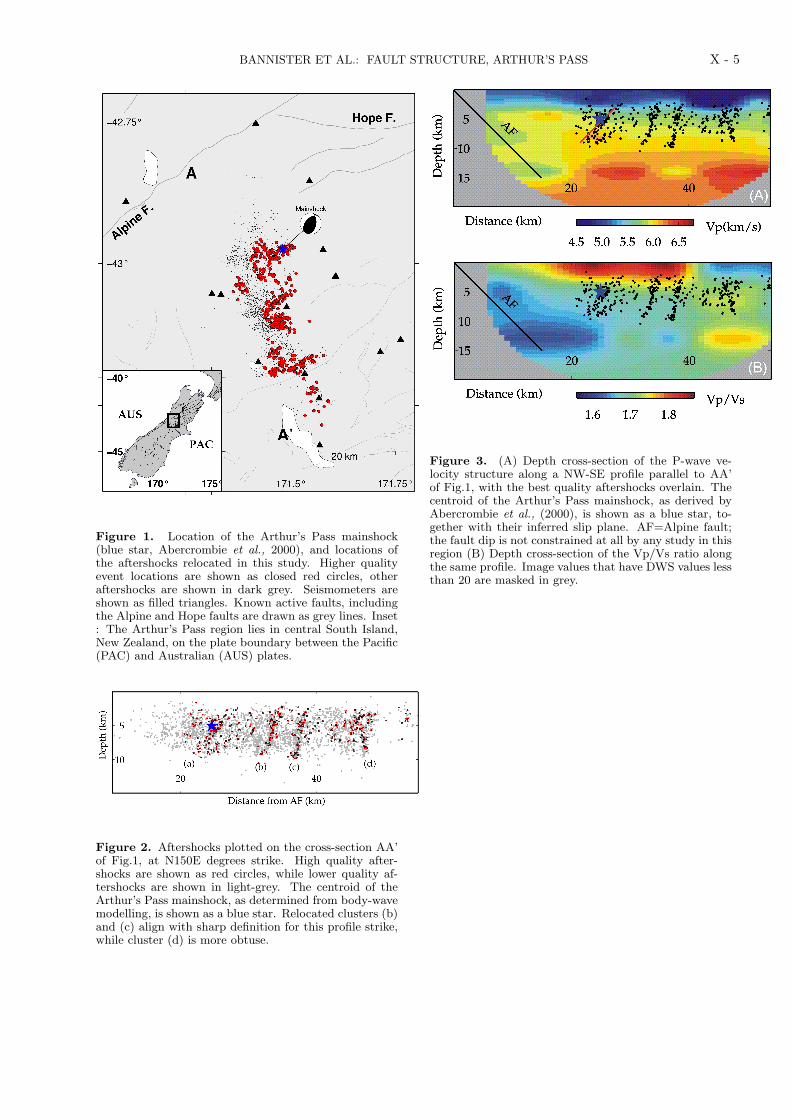
Figure 1. Location of the Arthur’s Pass mainshock(blue star, Abercrombie et al., 2000), and locations ofthe aftershocks relocated in this study. Higher qualityevent locations are shown as closed red circles, otheraftershocks are shown in dark grey. Seismometers areshown as filled triangles. Known active faults, includingthe Alpine and Hope faults are drawn as grey lines. Inset: The Arthur’s Pass region lies in central South Island,New Zealand, on the plate boundary between the Pacific(PAC) and Australian (AUS) plates.
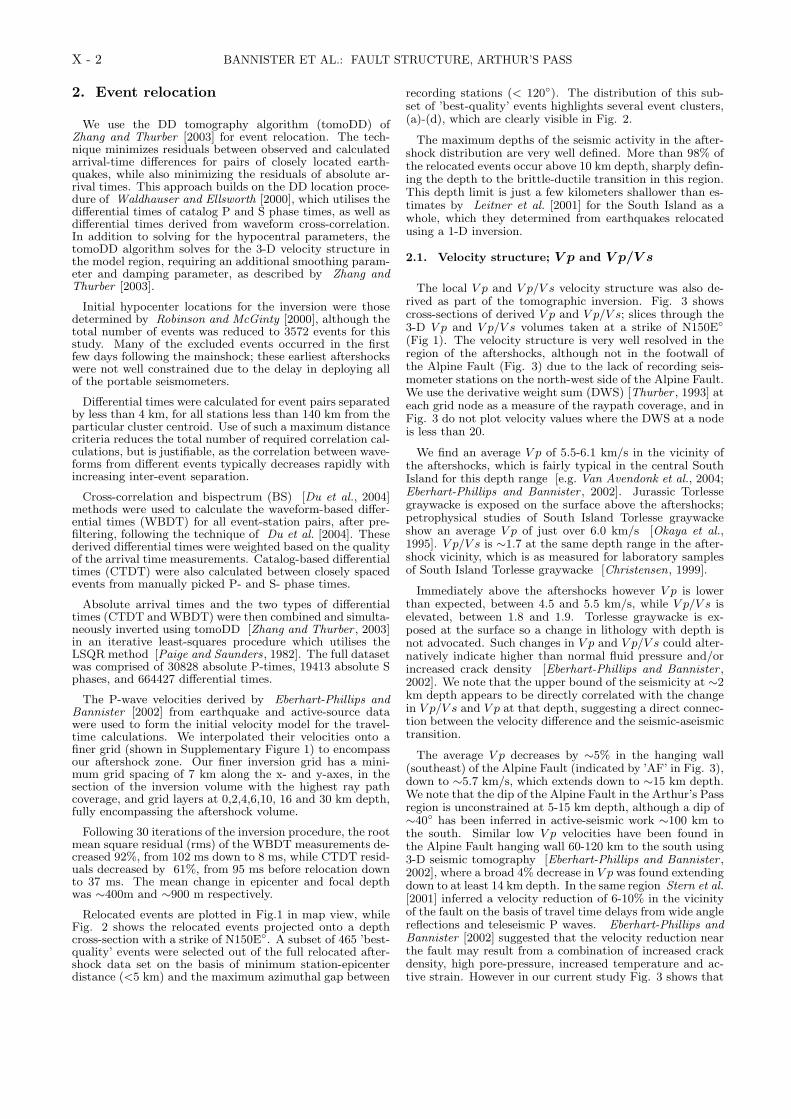
Figure 2. Aftershocks plotted on the cross-section AA’of Fig.1, at N150E degrees strike. High quality after-shocks are shown as red circles, while lower quality af-tershocks are shown in light-grey. The centroid of theArthur’s Pass mainshock, as determined from body-wavemodelling, is shown as a blue star. Relocated clusters (b)and (c) align with sharp definition for this profile strike,while cluster (d) is more obtuse.
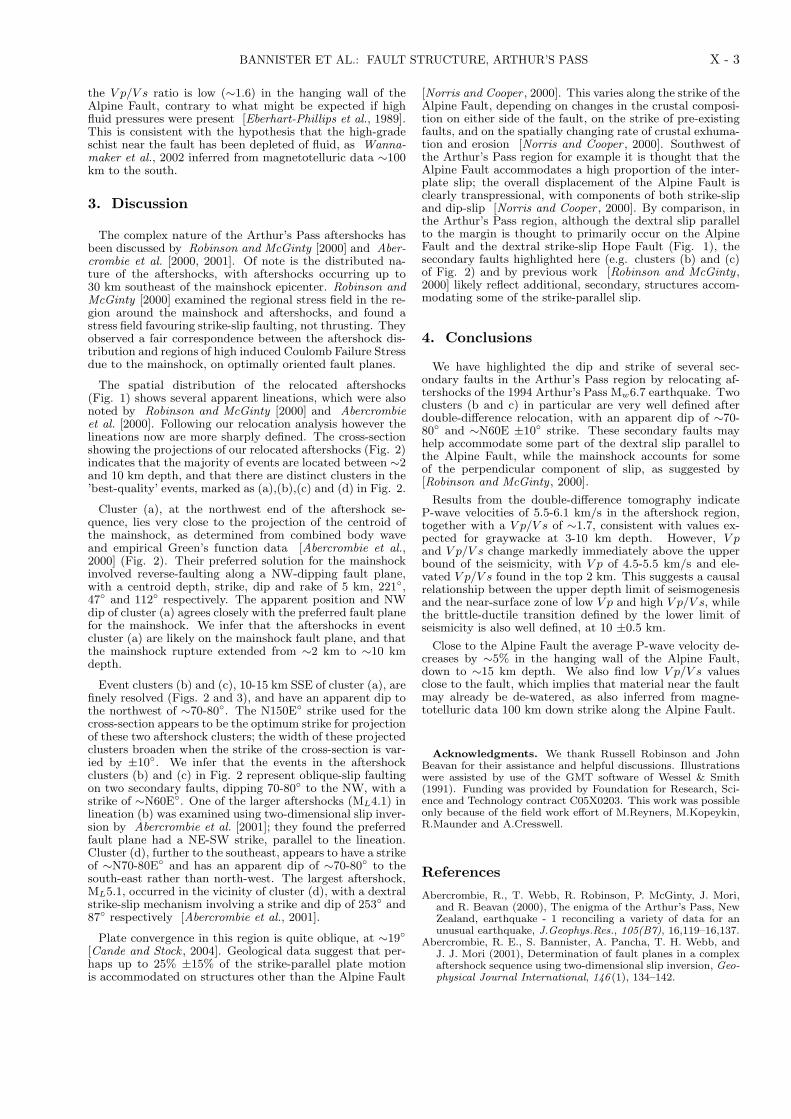
Figure 3. (A) Depth cross-section of the P-wave ve-locity structure along a NW-SE profile parallel to AA’of Fig.1, with the best quality aftershocks overlain. Thecentroid of the Arthur’s Pass mainshock, as derived byAbercrombie et al., (2000), is shown as a blue star, to-gether with their inferred slip plane. AF=Alpine fault;the fault dip is not constrained at all by any study in thisregion (B) Depth cross-section of the Vp/Vs ratio alongthe same profile. Image values that have DWS values lessthan 20 are masked in grey.
X - 6 BANNISTER ET AL.: FAULT STRUCTURE, ARTHUR’S PASS
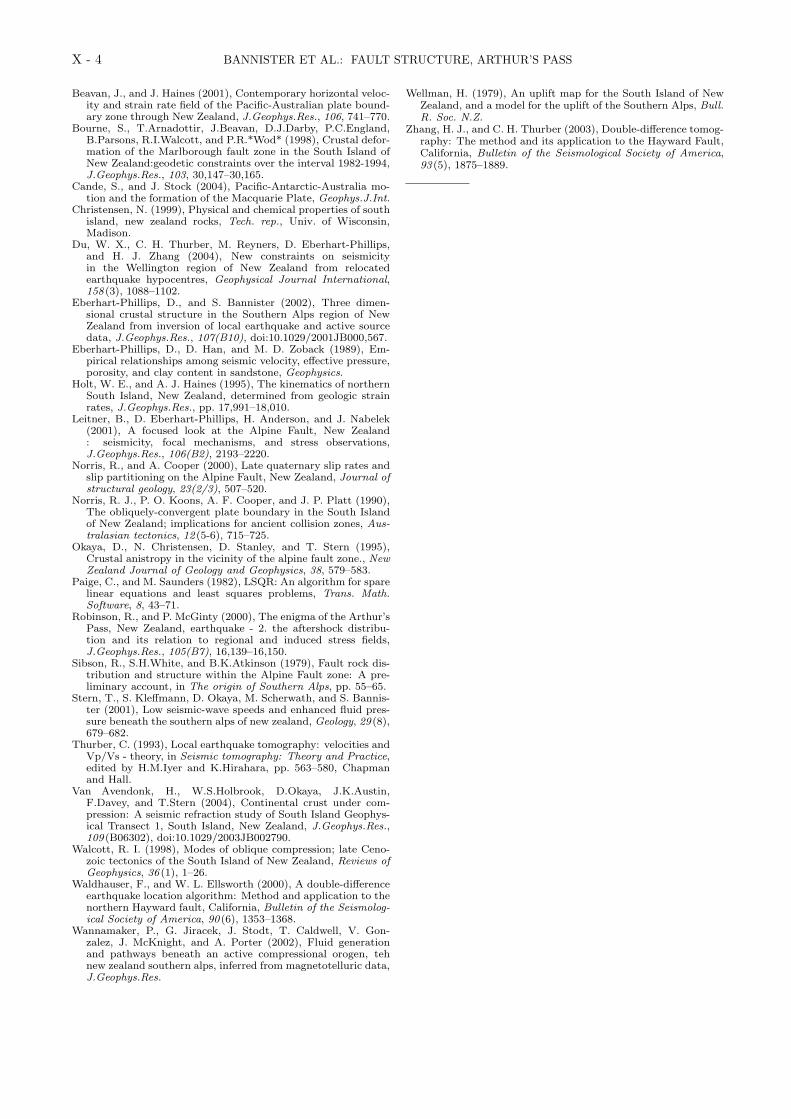
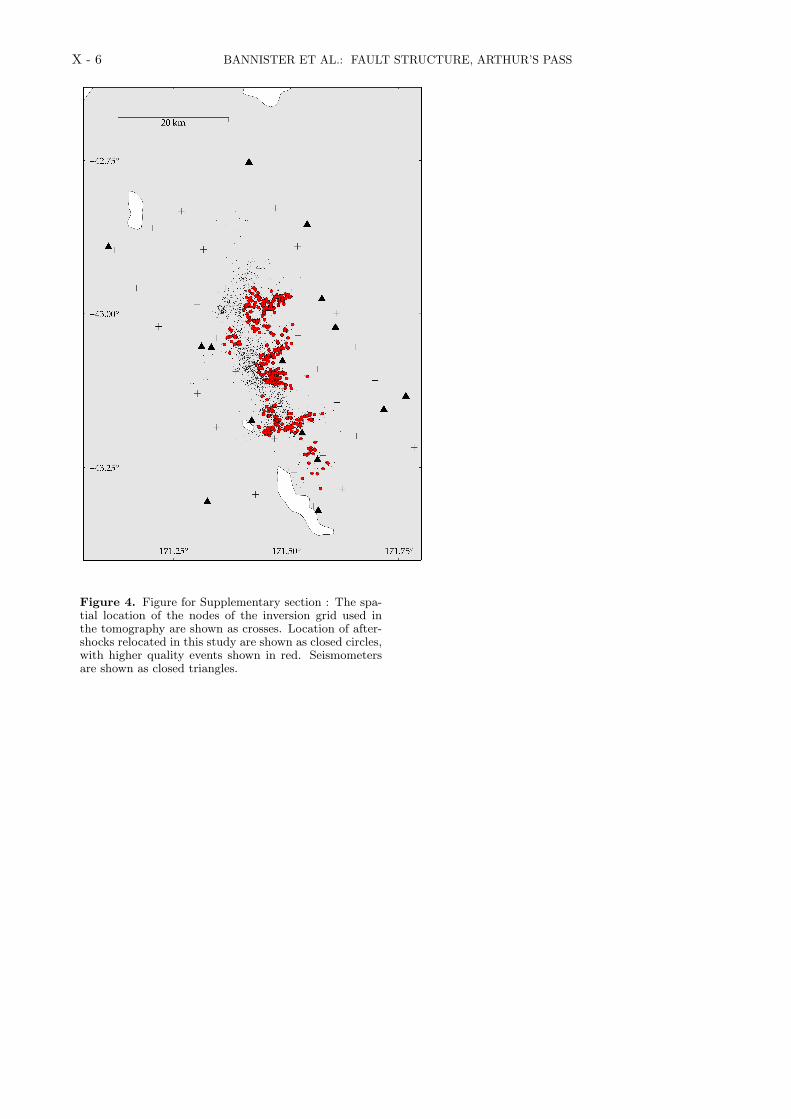
Figure 4. Figure for Supplementary section : The spa-tial location of the nodes of the inversion grid used inthe tomography are shown as crosses. Location of after-shocks relocated in this study are shown as closed circles,with higher quality events shown in red. Seismometersare shown as closed triangles.