detailed pestel and porter analysis of the chest system · detailed pestel and porter analysis of...
TRANSCRIPT

Detailed PESTEL and PORTER analysis
of the CHEST system PROJECT CHESTER
PROJECT NO. 764042 DELIVERABLE NO. 6.1
DOCUMENT VERSION V3.0
DOCUMENT PREPARATION DATE 14/01/2019 RESPONSIBILE PARTNER PlanEnergi
DISSEMINATION LEVEL Public
Type of Deliverable
R Document, Report X
DEM Demonstrator, pilot, prototype
DEC Websites, patent fillings, videos, etc.
OTHER
ETHICS Ethics requirements
ORDP Open Research Data Pilot
This project has received funding from the European Union’s Horizon 2020 research and innovation
programme under grant agreement No. 764042.
This deliverable reflects only the author’s views and neither Agency nor the Commission are responsible for any use
that may be made of the information contained therein.

CHESTER PROJECT NO. 764042
D6.1: Detailed PESTEL and PORTER analysis of the CHEST system 2
EC Grant Agreement No.764042
Project Acronym CHESTER
Project Title Compressed Heat Energy Storage for Energy
from Renewable sources
Programme HORIZON 2020
Start Date of Project 01-04-2018
Duration 48 Months
Financial/Administrative Coordinator
Project Coordinator Organization Name TECNALIA
Address Parque Tecnológico de Bizkaia
C/Astondo, Edificio 700 (Spain)
Phone Numbers +34 946 430 850
E-mail Address [email protected]
Project web-site www.chester-project.eu
Version Management
Filename CHESTER D6.1 - Detailed PESTEL and PORTER analysis of the CHEST
system
Author(s) Federico Bava (PlanEnergi), Santi Ochoa de Eribe (Goiener), Angel Carrera
(Aiguasol), Marc Schouten (PNO)
Reviewed by Silvia Alonso
Approved by Eduardo Zabala
Revision No. Date Author Modification description
V1.0 18-06-2018 F. Bava PESTEL analysis of Denmark
V1.1 16-08-2018 F. Bava PESTEL analysis of Germany, Porter analysis
V1.2 16-11-2018 S. Ochoa de Eribe, A.
Carrera, M. Schouten
PESTEL analysis of Spain, Belgium and the
Netherlands and related Porter analysis
subsections
V2.0 07-12-2018 M. Johnson,
S. Ochoa de Eribe,
F. Bava, M. Schouten
Review and minor changes
V2.1 09-01-2019 M. Johnson, A. Carrera Review and minor changes
V2.2 11-01-2019 S. Alonso Final review and minor changes
V3.0 14-01-2019 S. Alonso Final version

CHESTER PROJECT NO. 764042
D6.1: Detailed PESTEL and PORTER analysis of the CHEST system 3
Contents 1. Introduction ............................................................................................................................................... 8
1.1. Purpose and Scope ............................................................................................................................ 8
1.2. Structure of the document ................................................................................................................ 8
2. PESTEL Analysis .......................................................................................................................................... 9
2.1. Spain .................................................................................................................................................. 9
2.1.1. Political factors .......................................................................................................................... 9
2.1.2. Economic factors ....................................................................................................................... 9
2.1.3. Social factors ............................................................................................................................ 19
2.1.4. Technological factors ............................................................................................................... 20
2.1.5. Environmental factors ............................................................................................................. 24
2.1.6. Legal factors ............................................................................................................................. 25
2.1.7. Heating sector – District Heating ............................................................................................. 26
2.2. Denmark .......................................................................................................................................... 28
2.2.1. Political factors ........................................................................................................................ 28
2.2.2. Economic factors ..................................................................................................................... 29
2.2.3. Social factors ............................................................................................................................ 34
2.2.4. Technological factors ............................................................................................................... 34
2.2.5. Environmental factors ............................................................................................................. 37
2.2.6. Legal factors ............................................................................................................................. 38
2.2.7. Heating sector – District Heating ............................................................................................. 40
2.3. Germany .......................................................................................................................................... 42
2.3.1. Political factors ........................................................................................................................ 42
2.3.2. Economic factors ..................................................................................................................... 43
2.3.3. Social factors ............................................................................................................................ 46
2.3.4. Technological factors ............................................................................................................... 47
2.3.5. Environmental factors ............................................................................................................. 50
2.3.6. Legal factors ............................................................................................................................. 50
2.3.7. Heating sector – District Heating ............................................................................................. 52
2.4. Belgium ............................................................................................................................................ 53
2.4.1. Political factors ........................................................................................................................ 53
2.4.2. Economic factors ..................................................................................................................... 54
2.4.3. Social factors ............................................................................................................................ 58
2.4.4. Technological factors ............................................................................................................... 58
2.4.5. Environmental factors ............................................................................................................. 60
2.4.6. Legal factors ............................................................................................................................. 61

CHESTER PROJECT NO. 764042
D6.1: Detailed PESTEL and PORTER analysis of the CHEST system 4
2.4.7. Heating sector.......................................................................................................................... 62
2.5. The Netherlands .............................................................................................................................. 63
2.5.1. Political factors ........................................................................................................................ 63
2.5.2. Economic factors ..................................................................................................................... 64
2.5.3. Social factors ............................................................................................................................ 69
2.5.4. Technological factors ............................................................................................................... 70
2.5.5. Environmental factors ............................................................................................................. 73
2.5.6. Legal factors ............................................................................................................................. 74
2.5.7. Heating sector – District Heating ............................................................................................. 75
3. Porter’s Five Forces Analysis ................................................................................................................... 77
3.1. Introduction ..................................................................................................................................... 77
3.1.1. Threat of new competitors ...................................................................................................... 77
3.1.2. Power of suppliers ................................................................................................................... 78
3.1.3. Power of customers ................................................................................................................. 78
3.1.4. Threat of substitutes ............................................................................................................... 78
3.1.5. Industry rivalry ......................................................................................................................... 78
3.2. Porter’s Analysis of the CHEST system ............................................................................................ 79
3.2.1. Threat of new competitors ...................................................................................................... 79
3.2.2. Power of suppliers ................................................................................................................... 81
3.2.3. Power of customers ................................................................................................................. 84
3.2.4. Threat of substitutes ............................................................................................................... 85
3.2.5. Industry rivalry ......................................................................................................................... 92
3.3. Country-specific conditions ............................................................................................................. 93
3.3.1. Spain ........................................................................................................................................ 93
3.3.2. Denmark .................................................................................................................................. 94
3.3.3. Germany .................................................................................................................................. 95
3.3.4. Belgium .................................................................................................................................... 96
3.3.5. The Netherlands ...................................................................................................................... 96
3.4. Discussion ........................................................................................................................................ 98
References ..................................................................................................................................................... 100

CHESTER PROJECT NO. 764042
D6.1: Detailed PESTEL and PORTER analysis of the CHEST system 5
List of Figures Figure 1: Electricity mix distribution (%) in Spain (REE, 2017). ....................................................................... 10
Figure 2: Structure of electricity market in Spain [Source: www.odg.cat] ...................................................... 11
Figure 3: Contribution of the renewable energy sector to the GDP (APPA 2017). ......................................... 12
Figure 4: Level of energy investments and top priorities in Spain [Source: http://www.odg.cat]. ................ 12
Figure 5: Investment roadmap in Spain [Source: Preparación WP2018-2020 ENERGIA H2020]. ................... 13
Figure 6: Energy taxation in Spain(OECD, 2018a). ........................................................................................... 14
Figure 7: Share of taxes and levies paid by household consumers for the electricity in the 2nd half of 2017
(Eurostat, 2017a). ............................................................................................................................................ 14
Figure 8: Electricity prices for household consumers in the 2nd half of 2017 (Eurostat, 2017a). .................... 15
Figure 9: Weight of different costs that are contained in an energy bill in a Spanish household. ................. 16
Figure 10: Contribution of RES to the electricity generation in IEA countries (IEA, 2016b)............................ 16
Figure 11: Renewable energy as percentage of total primary energy supply in Spain, 1973-2014 (IEA, 2016b).
......................................................................................................................................................................... 16
Figure 12: International electricity exchanges in 2017 (GWh) (REE, 2017). .................................................... 18
Figure 13: International electricity exchanges comparison (GWh) (REE, 2017).............................................. 18
Figure 14: Evolution of peninsular electricity demand at power station busbars in peninsular Spain (in TWh)
(REE, 2017). ...................................................................................................................................................... 20
Figure 15: Breakdown of the electricity maximum hourly electricity demand in January 18th (MWh) (REE,
2017). ............................................................................................................................................................... 21
Figure 16: Spanish Primary Energy Mix, total = 123.446 ktep (REE, 2017). .................................................... 21
Figure 17: Spanish Electrical Energy Balance, total = 262,645 GWh (REE, 2017). .......................................... 22
Figure 18: Evolution of renewable electricity generation share (GWh) (REE, 2017). ..................................... 22
Figure 19: Evolution of the electricity transmission network in peninsular Spain (in km) (REE, 2017). ......... 23
Figure 20: Yearly total GHG emissions by sector (Ecológica, 2017). ............................................................... 24
Figure 21: Yearly GHG emissions by gas (Ecológica, 2017). ............................................................................ 25
Figure 22: Historical evolution in the number of installed DH networks (ADHAC, 2017). .............................. 26
Figure 23: Installed power per sector and energy source in the DH (ADHAC, 2017). ...................................... 26
Figure 24: Present and future transmission lines between Denmark and neighbouring countries (IEA, 2017a).
......................................................................................................................................................................... 29
Figure 25: Onshore and offshore wind turbines in Denmark (EA Energy Analysis et al., 2017). .................... 32
Figure 26: Gross electricity generation by source, 1973-2016 (IEA, 2017a). Asterisk * in the legend denotes
negligible contribution. ................................................................................................................................... 35
Figure 27: Gross electricity generation by source, 1990-2015 (IEA, 2018). .................................................... 47
Figure 28: Existing transmission grid and future expansions projects. ........................................................... 49
Figure 29: Historical GHGs emission development by sector and future targets. .......................................... 50
Figure 30: Electricity price evolution in Belgium (Federal Public Service Economy, 2017)............................. 55
Figure 31: Summary of green certificate systems operating in Belgium (IEA, 2016a). ................................... 56
Figure 32: Electricity market price in Belgium in 2018. ................................................................................... 57
Figure 33: Generation and imports in the Elia electrical grid 2007-2016 (CREG, 2017). ................................ 57
Figure 34:Gross electricity generation by source, 1990-2015 (IEA, 2018). ..................................................... 59
Figure 35: CO2 emissions by sector. ................................................................................................................ 61
Figure 36: Natural gas in the Netherlands. ...................................................................................................... 63
Figure 37: Evolution of percentage share of renewables in the Netherlands. ............................................... 63
Figure 38: contribution of energy related activities to the Dutch economy for various indicators in 2016.. . 65
Figure 39: Contribution of various energy related activities to the Dutch GDP. ............................................. 66
Figure 40: investments in energy related areas. ............................................................................................. 66
Figure 41: Energy related R&D subsidies by theme.. ...................................................................................... 68

CHESTER PROJECT NO. 764042
D6.1: Detailed PESTEL and PORTER analysis of the CHEST system 6
Figure 42: Current (“huidig”) and projected international interconnection capacity in MW. ........................ 68
Figure 43: Electricity import vs export in the Netherlands in recent years (source: CBS). ............................. 69
Figure 44: Dutch electricity markets as a function of the time between trade and use. ................................ 69
Figure 45: Sankey diagram of the Dutch energy system with translation table for Dutch terms. Size of energy
streams is indicated by the numbers (PJ) as well as the width of the bands. ................................................. 71
Figure 46: Dutch high voltage infrastructure including international interconnections................................. 72
Figure 47: Greenhouse gas emissions per sector. ........................................................................................... 73
Figure 48: Porter's Five Forces. ....................................................................................................................... 77
Figure 49: Forecast of EES deployment worldwide until 2030 by country (Bloomberg, 2017). ..................... 79
Figure 50: Commercially available industrial HT-HPs C (Arpagaus, Bless, Schiffmann, & Bertsch, 2017). ..... 82
Figure 51: Industrial HT-HPs with temperatures above 90 °C (Arpagaus et al., 2017). .................................. 82
Figure 52: Percentage market share of the ORC market (Tartière & Astolfi, 2017). ...................................... 83
Figure 53: Share in installed capacity of difference ORC manufacturers (Tartière & Astolfi, 2017). .............. 83
Figure 54: Comparison of the LCOS of different EES technologies (Smallbone, Jülch, Wardle, & Roskilly, 2017).
......................................................................................................................................................................... 90
Figure 55: Different operation modes of the CHEST system with respect to heat source and heat sink. ...... 92
Figure 56: Porter’s Five Forces for CHEST system in the EES market. ............................................................. 93
List of Tables Table 1: Taxation for different energy applications in 2018. .......................................................................... 31
Table 2: Taxation on energy in the Netherlands. ............................................................................................ 67
Table 3: RES measures considered for the future development of the Dutch energy system. ...................... 73
Table 4: Connections and heat consumption for large and small heat nets and block heating. .................... 75
Table 5: Nature and size of energy sources for small and large heat networks. ............................................ 76
Table 6: ORC specifications supplied by the manufacturers. .......................................................................... 84
Table 7: Main characteristics of different EES technologies. .......................................................................... 89

CHESTER PROJECT NO. 764042
D6.1: Detailed PESTEL and PORTER analysis of the CHEST system 7
Glossary, Abbreviations and Acronyms
aCAES Adiabatic Compressed air energy storage
CAES Compressed air energy storage
COP Coefficient of performance
CO2 Carbon dioxide
CO2-eq Carbon dioxide equivalent
CHEST Compressed Heat Energy Storage
CHP Combined Heat and Power
CWE Central Western Europe
DC Direct current
DERA Danish Energy Regulatory Authority
DH District Heating
DSO Distribution System Operator
EE Energy Efficiency
EEG Renewable Energy Source Act (from German Erneuerbare-Energien-Gesetz)
EES Electrical energy storage
ETS Emission Trading System
FIT Feed-in tariff
GDP Gross domestic product
GHG Greenhouse gas
HP Heat Pump
HT High Temperature
LCOS Levelized Cost of Storage
NOx Nitrogen oxides
NIMBY Not in My Backyard
MIBEL Mercado Ibérico de Electricidad (Iberian Electricity Market)
PCM Phase Change Material
PHS Pumped Hydro Storage
PPP Purchasing Power Parity
PSO Public Service Obligations
PV Photovoltaic
ORC Organic Rankine Cycle
RE Renewable Energy
RES Renewable Energy Sources
RP Reference price
SO2 Sulphur dioxide
TSO Transmission System Operator
TES Thermal Energy Storage
VRF Vanadium Redox Flow

CHESTER PROJECT NO. 764042
D6.1: Detailed PESTEL and PORTER analysis of the CHEST system 8
1. Introduction
1.1. Purpose and Scope
The PESTEL analysis describes the political, economic, social, technological, environmental and
legal boundary conditions of the electricity market, in particular with respect to the integration of
the CHEST technology. In fact, the advent of new technical solutions needs better support from
the policy perspective, in order to fully harness the potential. Besides, the new solutions have to
fit within the existing regulation framework. A particular focus is given to the current and expected
level of penetration of non-dispatchable renewable energy sources in the electricity generation
mix, technical and legislative issues regarding electricity storage technologies, interconnection
with neighboring countries, electricity prices, etc. The PESTEL analysis is relevant for identifying
how the current (and expected) boundary conditions in a country can favor or limit the
development of the CHEST concept in this country, currently and in the near future.
In addition, the Porter analysis is relevant for summarizing the strengths and potential benefits of
the CHEST system, and for identifying the market forces that can help the CHEST system enter in
the different markets and applications. Because the CHEST technology was regarded here as a
means of storing electricity, its potential was compared to other electricity storage technologies.
1.2. Structure of the document
This document is divided in two main sections.
Section 2 is divided into five subsections, one for each of the European countries represented in
the Consortium of the CHESTER project, i.e. Spain, Denmark, Germany, Belgium and The
Netherlands. Each of these subsections presents a detailed PESTEL analysis of the electricity
market in one of these countries.
A short subsection describing the current status of the district heating technology in each of the
above-mentioned countries is also present at the end of each PESTEL analysis. This was added
as district heating is a key element for the integration of the CHEST system.
Section 3 presents the Porter’s Five Forces analysis of the CHEST technology. Subsection 3.1
shortly describes the theoretical principles on which the Porter's analysis is based, briefly
presenting the five forces that explain the competitiveness within a sector, i.e. threat of new
competitors, power of suppliers, power of customers, threat of substitutes and industry rivalry.
Subsection 3.2 applies the Porter’s Five Forces analysis on the CHEST technology, as a means of
storing electricity. The analysis presented in Subsection 3.2 is purely technological, so it does
not consider the different boundary conditions, which could affect the CHEST competitiveness
in different countries. This aspect is, on the other hand, treated in Subsection 3.3, where the
information collected in the PESTEL analyses are used to evaluate the potential of the CHEST
system in the considered countries.

CHESTER PROJECT NO. 764042
D6.1: Detailed PESTEL and PORTER analysis of the CHEST system 9
2. PESTEL Analysis
2.1. Spain
2.1.1. Political factors
The Spanish energy policy has quite stagnated in the 2016 and 2017 period because of the
institutional impasse following parliamentary and presidential elections in 2015. Therefore, the
regulatory framework of the electricity sector is mainly based on the Royal Decree 2013/24.
Some few developments have been made since then, e.g. the Royal Decree 2016/56, which
partially transposes the Energy Efficiency EU Directive 2012/27/EU as well as the Ministerial
Order IET/359/2017 which fixes the energy savings targets of energy efficiency national funds,
and some other Ministerial Orders.
However, concerning long-term energy plans, the Spanish Government has not publicly stated
their intentions and objectives. There is no ongoing Energy Strategy Plan for the next years,
which should guide the energy sector and stakeholders towards clearly identified objectives.
There are only occasional actions, such as the program to promote self-consumption of
electricity, including storage systems, that are launched occasionally, but the country lacks a
long-term planning strategy.
On the other side, the Catalan Government has published a National Pact for Energy Transition
(ICAEN, 2017) in order to increase the country’s resilience to adapt and respond to the
environmental and economic changes. This Energy Transition Pact is in line with all strategic axes
published at the ‘Clean Energy for all Europeans’ legislative package, and aims to achieve:
• 100 % of the energy generation from renewable energy sources (RES) by 2050;
• To fulfil the objectives present in the "Clean Energy for All Europeans" Package (European Commission, 2016):
o 27 % of the gross final energy consumption generated by RES by 2030;
o 30 % increase in energy efficiency by 2030;
o 40 % reduction of GHG emissions in the energy sector compared to 1990 by 2030.
It should be noted that the Spanish electricity market is partially merged with the Portuguese
electricity market. A cooperation process between the Portuguese and the Spanish
Governments, started in 1998, led in 2007 to the launch of the Iberian Electricity Market (MIBEL),
with the aim of promoting the integration of both countries’ electricity systems. The MIBEL has
brought to a successful conclusion the harmonisation of requirements between the two Iberian
electricity systems, with the expectation that this operation would bring benefits to the
consumers of both countries within a framework for providing access to all interested parties.
2.1.2. Economic factors
General economic situation
After having contracted in 2012 and 2013, Spanish GDP grew by 1.4 % in 2014 and more than
3 % in 2015, 2016 and 2017 (Eurostat data). The inflation rate remained in negative values in
2014, 2015 and 2016, but has increased to reach an average of 2% in 2017, partly due to the
energy component of prices.

CHESTER PROJECT NO. 764042
D6.1: Detailed PESTEL and PORTER analysis of the CHEST system 10
Despite the economic growth in the last years, some important factors are putting pressure on
the Spanish economy, such as an unbalanced national budget, with a high fiscal deficit (2.5 % of
GDP in 2018) and public debt (99% in 2017), and pensions growing at a very low rate, which
decreases retail sales and the consumer confidence index. There is a lack of investment in
science and R&D, which hinders Spain’s international competitiveness. The Spanish
unemployment rate has fallen, but it was still high at 17 % in 2017 (Eurostat data).
Electricity market
The electricity market in Spain has undergone a deep transformation in the last 20 years,
because of two main elements: the decarbonization of the electricity system and the
liberalization of the electricity market, which have not necessarily led to higher competitiveness
in the sector.
The first element has been extremely important. The development of R&D policies, combined
with a policy to increase RES in the electricity sector, created a structure of higher costs, though
substantially improving the energy mix for Spain (Figure 1). This increase, together with an
energy reduction trend caused by the economic crisis of 2010, imposed a strong weight on the
electric system (IEA, 2009).
Figure 1: Electricity mix distribution (%) in Spain (REE, 2017).
As a second point, it is important to state the historical consequences of a change in the market
from 1998 (Law 54/1997), moving from a fully state-controlled energy system to a liberalized
system. Until 1997, the electricity supply was a regulated business. The government established
the price the consumers had to pay, and thus the income of the electricity companies (Regal,
2012). This framework was called “Marco Legal Estable” or Legal Stable Framework (REE, 2008).
However, the liberalization of the electricity market has not led to a reduction in costs as initially
expected. Users experienced higher costs, with increases by more than 80 %. In Europe, only in
Germany, Ireland and Denmark do household consumers pay higher prices for electricity.
Considering only the electricity cost without taxes, Spain has the 4th highest electricity cost in
Europe, for both residential and non-residential consumers (Eurostat, 2017a)
The cost increase probably arose due to the poor regulations embodied in the legislation, and
the structure of the electricity market in Spain, which is an oligopoly. As observed in Figure 2,
67 % of the total generation capacity and 87% of the total electricity commercialisation are
controlled by five companies (they created an association called UNESA, which is currently
renamed to AELEC). The expected price reduction and cost optimisation was not achieved.

CHESTER PROJECT NO. 764042
D6.1: Detailed PESTEL and PORTER analysis of the CHEST system 11
Figure 2: Structure of electricity market in Spain [Source: www.odg.cat]
The four main mechanisms facilitating the transition from a regulated market to a liberalized
market increased prices and did not help consumers according to the intention.
• The first was the cost of transition to the liberalized market (in which the companies had to fund to change their processes from the regulated market). The companies claimed that the process to get into the liberalized market could imply a great loss. So, in order to avoid those extra costs, the government designed the Competency Transition Cost. This cost was passed to the final user and they were cancelled a few years ago.
• The second was the tariff cap, through which the government established a regulated price. The DSOs, given their costs, required extra payment (converted into debt) from the administration. There were two main problems with this debt: it was unsecured and only covered part of the costs.
• The third was the increase in the renewable energy production to accomplish the Kyoto objectives (United Nations, 2018), which implied a cost increase of the electricity production.
• The fourth was the price setting mechanism, which made no difference between technologies. Large power plants that had had government investments, and with already amortised investments (hydro and nuclear mainly) competed under the same conditions as non-amortised installations. This market structure makes it quite difficult for new actors and new energy companies to enter the market, and it does not favour the decrease in electricity prices (ODG, 2016).
Energy-related industry
The energy market evolution has been characterized by the appearance of new players (ESCO,
Aggregators, Brokers, etc.) encouraging customers to change their behaviour and to require new
services (energy diagnosis, monitoring, load shifting, multi tariff, etc.).
Moreover, new business models in the retail market have been developed thanks to new ICTs
and the sector liberalisation. Some relevant practices concern tailored multi-tariffs, the
possibility to buy and sell energy in a virtual micro-grid and peer-to-peer energy exchange
(Stoneman, 2016).
The renewable energy sector industry in Spain is slowly recovering from the sharp decay induced
by the notable changes in the subsidies scheme introduced in the years of the financial crisis and
has seen a sustainable growth in the period 2014-2017. Figure 3 shows the evolution of the
contribution of the renewable energy sector to the GDP for the period 2010-2017, where it can

CHESTER PROJECT NO. 764042
D6.1: Detailed PESTEL and PORTER analysis of the CHEST system 12
be seen that the contribution for 2017 was 0.80 % (9.3 G€), far from the maximum of 1.02 %
reached in 2012 (APPA, 2017).
Figure 3: Contribution of the renewable energy sector to the GDP (APPA 2017).
The net contribution to the national current account has a positive balance of 3.1 G€, and the
employment associated to the sector is 78,667 employments, which is approximately 50 % of
the renewable energy sector employment in 2008 (APPA, 2017)
Energy R&D in Spain has received funds in the last few years, which placed the country in the
middle of the Organization for Economic Co-operation and Development (OECD) country
ranking. Despite the step change in renewable energy investments (fostered by the feed-in tariff
structure) and the development of renewable energy companies, the impact of energy R&D in
Spain during 2000-2010 has been relatively low (Figure 4).
Figure 4: Level of energy investments and top priorities in Spain [Source: http://www.odg.cat].

CHESTER PROJECT NO. 764042
D6.1: Detailed PESTEL and PORTER analysis of the CHEST system 13
Nevertheless, the rise in regional technological centres dedicated to energy in recent years
(CTAER, in Andalucía; Circe, in Aragón; the Instituto de Energías Renovables, in Castilla-La
Mancha; el Instituto Tecnológico y de Energías Renovables, in Canarias; Ceder, in Castilla y León;
ITE, in Valencia; Cener, in Navarra; el Centro Tecnológico del Medio Ambiente y la Energía, in
Murcia, Tecnalia in the Basque Country, IREC in Catalonia, CARTIF in Castilla León and the Ciemat
l IDEA in Madrid, amongst others) has pushed Spain to a very high rate of participation in the
international programs of R&D in the European Commission. Figure 5 summarizes investment
roadmap in Spain.
Figure 5: Investment roadmap in Spain [Source: Preparación WP2018-2020 ENERGIA H2020].
Energy taxation
Energy and carbon taxes in Spain are levied within the framework of the 2003 EU Energy Tax Directive, which sets minimum rates for the taxation of energy products in member states (OECD, 2018a). Within this framework, the main taxes on energy use in Spain are the following:
• Taxes applied to oil products, natural gas and coal and coke consumption, at different rates depending on the users and fuel
• An excise Tax on Electricity (Impuesto Especial sobre la Electricidad) applies to electricity output (per MWh).
Besides, Spain participates in the European Union emissions trading system (ETS). The rates at which these taxes apply differ for fuels and users, with the transport sector being the one with a highest rate of taxation. Figure 6 summarizes national taxes.

CHESTER PROJECT NO. 764042
D6.1: Detailed PESTEL and PORTER analysis of the CHEST system 14
Figure 6: Energy taxation in Spain(OECD, 2018a).
For electricity, the production is taxed for electricity delivered to the grid (neither self-
consumption nor any inner grid system electricity is taxed). Fuels used for electricity production
are untaxed, except for diesel and heavy fuel oil, which are taxed but at a smaller rate than for
other uses.
The last Eurostat report on electricity prices places Spain as one of the European countries with
the lower share of taxes (Figure 7) applying to the electricity consumption, around 21 % of the
final consumer costs.
Figure 7: Share of taxes and levies paid by household consumers for the electricity in the 2nd half of 2017 (Eurostat, 2017a).
However, the same report shows that Spain is one of the European countries with higher
electricity prices for household consumers (Figure 8).

CHESTER PROJECT NO. 764042
D6.1: Detailed PESTEL and PORTER analysis of the CHEST system 15
Figure 8: Electricity prices for household consumers in the 2nd half of 2017 (Eurostat, 2017a).
This is caused by the fact that the electricity bill contains also costs which are not related to the
supply of electricity to final users. For example, in August 2013, the fixed part of the electricity
bill (standing charge), related to the contracted power supply, increased by 100 % according to
a Ministerial Order, which did not give private citizens and small/medium enterprises an
incentive to reduce electricity usage, as the cost increase was irrespective of the actual
consumption.
Figure 9 summarizes the different concepts that a household consumer pays. The figure
represents the different weight of each concept in the final electricity bill. The four main
components that a consumer pays are:
• Regulated Cost. All the concepts that the government includes in order to secure the economic and technical future of the electrical system. It includes, mainly:
o Feed-in-Tariffs for RE producers.
o DSO’s service payment.
o A solidarity mechanism to provide affordable electricity in the Canary Islands.
o Subsidies to coal producers
o Electrical system deficit payment
• Market Cost. Mainly the SPOT market, despite that the OTC markets or the PPA markets have very similar costs. In the Spanish market, 8-10 % (capacity mechanisms, for example) of this market cost is related to governmental decisions.
• Taxes. They are proportional to the previous two concepts. They suppose an additional 28 % to the previous aggregated costs. There are 3 taxes:
o A municipal tax (not always applied by all municipalities) represents the 1.5 % of the gross revenue earned by the utility.
o A Tax on Electricity of 5 % of the combined regulated and market costs. This money goes to the local regions directly.
o A VAT of 21 % is applied to all elements included in the electricity bill.
• The gross profit for the utility, which represent about 5 % of the bill.

CHESTER PROJECT NO. 764042
D6.1: Detailed PESTEL and PORTER analysis of the CHEST system 16
Figure 9: Weight of different costs that are contained in an energy bill in a Spanish household.
This situation reflects the lack of effective control and regulation by the public authorities of a
liberalised electrical market dominated by the electrical Spanish oligopoly.
Subsidies for RES
In 2014, Spain had the tenth highest share of RES in electricity generation among the IEA
countries (Figure 10).
Figure 10: Contribution of RES to the electricity generation in IEA countries (IEA, 2016b).
Thanks to a very favourable policy from the Spanish Government between 2005 and 2012, based
on a system of feed-in tariffs and premiums, the installed capacity of renewable electricity
increased by 70 %. Currently, wind energy represents Spain’s third largest power generation
source and contributes with a gross production of around 48 TWh (both in 2016 and 2017),
covering around 20 % of the country’s electricity demand. For 2020, Spain has the target of
producing more than 40 % (Figure 11) of its electricity through RES, mainly wind energy (REE,
2017)
Figure 11: Renewable energy as percentage of total primary energy supply in Spain, 1973-2014 (IEA, 2016b).

CHESTER PROJECT NO. 764042
D6.1: Detailed PESTEL and PORTER analysis of the CHEST system 17
However, after a period of exponential growth of RES installations, in 2010 the government
introduced several energy policy changes, eliminating the support to RES, with the paralysation
of new RES installations in 2012 (Real Decreto ley 1/2012). Furthermore, the government
defined a new retribution scheme for RES in 2013 (Real Decreto 413/2014), which included
retroactive cuts in economic support for existing plants, by restricting the maximum number of
productive hours per year. These policy changes have basically interrupted new RES investments
and deployments in the country. Additionally, they have caused almost 30 lawsuits from foreign
investors against the Spanish government.
More recently, a new decree (Real Decreto de Autoconsumo Energético 900/2015) introduced
strong barriers for connecting decentralised electricity production, such as PV and other small-
scale RES technologies, to the grid. In fact, the decree introduced new taxes (in Spanish cargo
por autoconsumo) on the electricity produced by these sources and self-consumed by the user.
Legal battles are ongoing, some of which are resulting in changes to the legislation. For example,
the Spanish Supreme Court declared one of the points of the decree illegal: forbidding group
self-consumption from the same generator. At the time of writing (October 2018), the Spanish
Government has approved the Royal Decree-Law 15/2018. Among other decisions in this Royal
Decree, they have approved the grouped self-consumption model, and rejected the tax charged
to the self-consumed share of energy).
In 2017, a new public bidding has fostered more than 5 GW of new RES installations, but the
only reason for the public call for tenders was to fulfil the European Directives and reach the
2020 objectives. The bidders required the guarantee to be connected to the grid as soon as their
installations are being finished.
At the time of writing (October 2018), there are no direct public subsidies for RES electricity.
However, the whole renewable generation is bought at the electricity market pool at a
“regulated reasonable price”, which could be understood in some cases as an indirect public
subsidy for the cheapest technologies. This guarantees a minimum price, just in case the market
drops down.
Finally, another important trend in the Spanish market in 2018, considering the regulatory
insecurity and the market volatility, was the increase of Power Purchase Agreements among
retailers and producers or big consumers and energy producers. The CO2 cap & trade increasing
the market’s price is fostering these private contracts.
Imports and exports of electricity
In 2017, around 96.4 % of the electricity demand was covered by national generation. Cross-
border exchanges are constant, with a total balance (Figure 12) which differs depending on the
country: Spain imports electricity from France and Portugal, and exports to Andorra and
Morocco.

CHESTER PROJECT NO. 764042
D6.1: Detailed PESTEL and PORTER analysis of the CHEST system 18
Figure 12: International electricity exchanges in 2017 (GWh) (REE, 2017).
After some years of continuous exports, Spain is currently a net importer of electricity (Figure
13), and it seems unclear whether this situation will change in the coming years.
Figure 13: International electricity exchanges comparison (GWh) (REE, 2017).
The total interconnection capacity represents 6 % of the installed generation capacity (6 GW of
around 100 GW). The EU recommends increasing this amount to 10 % between the countries.
There are some projects like the Spain-France submarine interconnection, but these projects do
not attract public acceptance.
Wholesale market
The Spanish wholesale market comprises an organized market: the spot market managed by
OMIE (Operador del Mercado Ibérico Español), the electricity market operator, and a non-
organized market for bilateral trade.
The regulated market is composed of a series of markets, where market agents buy and sell electricity. This market includes a day-ahead market followed by six intraday auctions. Although

CHESTER PROJECT NO. 764042
D6.1: Detailed PESTEL and PORTER analysis of the CHEST system 19
the continuous hourly market has been adopted recently, the participation nowadays is marginal. Most of the operations happen around the OMIE, where short-term operations take place. The geographical scope of the market is the entire Iberian Peninsula, i.e. Spain and Portugal have an integrated market. As explained before, it is all integrated in the MIBEL market. The day-ahead spot market is currently coupled with Portugal and the North-West Europe region.
Concerning the non-regulated market, physical bilateral contracts or PPA are possible between consumers and producers qualified as such on the spot market. In order to participate in this non-regulated market, it is mandatory to be a ‘market subject’ in the Spanish Electrical Law. What changes is the way the two sides design and agree a ‘market-price’ but they must fulfil all the requirements (legal, economic and technical) related to the electricity market.
Concerning the wholesale power market in the Spanish zone, around 253 TWh were sold in the
day-ahead spot market (192 TWh excluding bilateral agreements), while 31 TWh were sold in
the intraday market. The weighted average spot market price was around 60.6 €/MWh in 2017
(25.1 % higher than in 2016), and the daily market price has represented 88 % of the final price
of the electricity market, while the remaining 12 % corresponds to the intraday market price and
some system services, like reserve capacity services (Figure 9). The share of bilateral agreements
is around 24 %, with no significant evolution from last years (REE, 2017).
From the demand point of view, Spain has a poorly flexible system regarding load management.
The only program that allows demand management is the interruptible service provided by the
Spanish TSO (Red Eléctrica de España – R.E.E.). The new regulation for this service introduces a
competitive allocation mechanism managed by the TSO. An auction system with face-to-face
bidding is used to allocate the service. Two interruptible capacity products are auctioned: a first
one consisting of reductions in consumption of 5 MW and another of 90 MW. Besides the
interruptible demand service from the demand side, the TSO allows other ancillary services to
power producers, such as power reserve, load control (there are 3 different mechanisms to
participate, depending on the temporal horizon of the response) and voltage quality service.
According to the TSO, all the ancillary services have an impact on electricity generation costs of
2.4 €/MWh(REE, 2017) .
2.1.3. Social factors
Given the current market structure, customer engagement has been difficult. The dominant
position of the former monopolies in the market and the growing concern of the Spanish citizens
towards these companies means that cooperation between customers and companies is not
usually welcome.
However, some interesting initiatives have started, driven by the market liberalisation, in which
final users become active and conscious customers, more involved and engaged in the electricity
market in different ways.
These initiatives were developed as energy cooperatives. The first cases date back to the
beginning of the 20th century, when the first DSOs were created by municipalities. Some of these
cases have prevailed, mainly in the Valencia region. In Europe, these types of cooperatives
flourished after the energy crisis in the 1970s, but not in Spain. After market liberalisation, the
third wave has started in Spain regarding energy cooperatives. In 2010, the first of these new
initiatives was SOM ENERGIA in Catalonia. Afterwards GOIENER was created in the Basque
Country and Navarra. Currently almost all the cooperatives have joined the Union Renovables

CHESTER PROJECT NO. 764042
D6.1: Detailed PESTEL and PORTER analysis of the CHEST system 20
association, and they gather more than 100,000 consumers, sensible to RES (Ateneo de Energia,
2018).
These cooperatives are joining the RESCOOP.EU model and trying to spread a new energy model
based on renewable electricity consumption and production, including some shared
reinvestment of economic profits (RESCOOP.EU, n.d.).
Even if these new initiatives are changing public opinion on electricity and energy markets,
market liberalisation is characterised by lack of transparency for the final users. This tendency is
also witnessed by a general lack of confidence from users towards retailers and operators,
concerning billing accuracy and fear for extra costs (Stoneman, 2016).
In recent years, following social empowerment and cost reduction of RES technologies, an
increasing number of citizens installed RES production units in their homes, even though they
cannot satisfy their energy needs mainly because of intermittence of generation and the
unfavourable regulation (self-consumption coupled with export of excess electricity from local
generation is forbidden).
2.1.4. Technological factors
Current situation
After some years of continuous decrease, the electricity demand in Spain has increased in the
last three years (Figure 14).
Figure 14: Evolution of peninsular electricity demand at power station busbars in peninsular Spain (in TWh)
(REE, 2017).
The maximum energy demand is in winter and has two main peaks, one at around 12 a.m. and
the other at around 9 p.m., as shown in Figure 15.

CHESTER PROJECT NO. 764042
D6.1: Detailed PESTEL and PORTER analysis of the CHEST system 21
Figure 15: Breakdown of the electricity maximum hourly electricity demand in January 18th (MWh) (REE, 2017).
The primary energy supply in Spain (Figure 16Figure 16) is characterised by a low share of
renewable energy production.
Figure 16: Spanish Primary Energy Mix, total = 123.446 ktep (REE, 2017).
Concerning the electricity generation mix, RESs (Figure 17) have a more significant share, even
if their contribution has been reduced from 2016.
Coal10%
Fuel44%
Natural gas20%
Nuclear12%
Renewable energies
14%
Others1%

CHESTER PROJECT NO. 764042
D6.1: Detailed PESTEL and PORTER analysis of the CHEST system 22
Figure 17: Spanish Electrical Energy Balance, total = 262,645 GWh (REE, 2017).
The contribution to RES electricity in the generation mix is strongly affected by weather
conditions, which influence the performance of hydro-power plants and wind farms (Figure 18).
Figure 18: Evolution of renewable electricity generation share (GWh) (REE, 2017).
Wind electricity production represents around 20 % of the national electricity consumption and
in 2017 it was the second largest electricity source. However, the ability of dispatching the whole
wind potential is still an issue to be solved. The Spanish TSO (Red Eléctrica de España – R.E.E.)
pointed out that depending on the energy demands, the Spanish system could not use the entire
renewable electricity production and that 2 % of this electricity could be wasted. Already since
2008, wind farms have been disconnected in several occasions at night-time due to low demand.
The Spanish TSO has also expressed the need to optimise the existing pumped storage as a way
to accommodate wind electricity production.
Electrical grid
The transmission grid includes around 20,000 km of high voltage 400 kV lines and around
20,000 km of <220 kV, as seen in Figure 19.
Coal17%
Fuel11%
Natural gas14%
Nuclear22%
Renewable energies
34%
Others2%

CHESTER PROJECT NO. 764042
D6.1: Detailed PESTEL and PORTER analysis of the CHEST system 23
The Spanish TSO Red Eléctrica de España (R.E.E.) is certified as an ownership-unbundled TSO. It
is a publicly listed company, and to guarantee its independence, ownership in it is limited by
law. The state has around 20 % of the shares, while the other 80 % is diversified with multiple
small owners (the largest one has around 3 % of shares) (IEA, 2016b).
Figure 19: Evolution of the electricity transmission network in peninsular Spain (in km) (REE, 2017).
R.E.E developed an operation unit (called CECRE) integrated in the main control centre to
manage RES generators with a minimum nominal power of 5 MW. CECRE is equipped with
sufficient control and command capacity to act as aggregators of information with nearly real-
time communication (12 seconds) with facilities. This is a powerful instrument to maximise
renewables dispatch, but further steps are needed for a full implementation.
The DSOs are responsible for operating, maintaining and developing the distribution network,
which is used by retailers (supply companies representing end-users) for delivering electricity to
end-users.
Some improvements on the energy grid have been undertaken related to electricity metering.
The most important one is a full rollout of smart meters, which should replace conventional
meters. The substitution should have been done in three phases, the first one with 35 % of the
meters to be changed between 2011 and 2014, 35 % more between 2015 and 2016 and the last
30 % between 2017 and 2018. However, the last data from the “Informe de Seguimiento y
Aplicación de los Datos Procedentes de Equipos de Medida Tipo 5 correspondiente al año 2017”
(CNMC, 2018) showed that at that moment, there were 25.8 million smart meters (91 %) in
place, which is very plausibly the whole deployment to be done by the end of 2018.
This smart meter system denoted as AMI (Automated Meter Infrastructure) has not been
considered as a remote reading only, but also as a bidirectional communication channel
between DSO/Supplier and Customer. However, the three main DSOs today in Spain are
adopting their own protocols and standards for metering: PLC Prime, Meters and More, Cosem,
limiting the possibilities to deploy new services by third parties.
Future scenarios
The recent political change in the Spanish Government (July 2018), after seven years of
conservative management, opens the door to significant regulation changes. However, there is
not enough information on what the main milestones of the new government will be concerning
the energy transition. The lack of any clear energy strategy for the short and long-term also
introduces important uncertainties on the future evolution of the electricity sector. Only a draft

CHESTER PROJECT NO. 764042
D6.1: Detailed PESTEL and PORTER analysis of the CHEST system 24
of a “Climate Change and Energy Transition Law” has been presented mid-2018 at the Spanish
Parliament, but the change on the government team should introduce significant delays on its
final approval. Some of the drafts that are circulating among the sector professionals include
initiatives like these:
• 2030 objectives: Final energy consumption (35 %); electricity from RES (70 %); GHG reduction referred to 1990 (20 %); energy efficiency improvement (35 % at least);
• Electrical system 100 % renewable by 2050;
• Considering energy efficiency:
o Between 2021 and 2030, 100,000 household/year refurbishment,
o Long term refurbishment strategy in order to reduce the energy consumption,
o Fostering RE use in buildings.
There is also uncertainty related to the key concept of reasonable return; the reform of the
electricity system undertaken in 2013 removed the FIT scheme to promote the RES, and the new
scheme introduced the concept of “reasonable return”. This regulated “reasonable return” is
used to set the minimum price that the RES technologies will receive on the electricity market
pool. Currently fixed to the national bond rate of +3 %, it could be modified unilaterally by the
government by 31/12/2019.
The new government wants to tackle the shutdown of nuclear plants that are already at the end
of their technical lifetime but considering a longer life (more than 40 years). It is not clear how
they will tax fossil fuel consumption (coal plants have a significant share on electricity
generation).
Distribution Control Centres are implementing updated solutions for a better monitoring and
control power sources and ADMS (Advanced Distribution Management Systems) are becoming
tangible assets today.
2.1.5. Environmental factors
In 2015 (Figure 20), the total GHGs emissions in Spain were 335.6 Mton of CO2-eq, with the
energy sector (77 %) being the main contributor, followed by agriculture (10 %), industry (9 %)
and waste (4 %). That means an increase of around 4 % compared to 2014. Compared to 2007,
the total emissions have decreased by more than 20 %.
Figure 20: Yearly total GHG emissions by sector (Ecológica, 2017).

CHESTER PROJECT NO. 764042
D6.1: Detailed PESTEL and PORTER analysis of the CHEST system 25
The main GHGs emission activities are transport (26 %) and electricity generation (21 %). Carbon
dioxide is the main GHG (Figure 21) and represents 81 % of the total CO2-eq emissions.
Figure 21: Yearly GHG emissions by gas (Ecológica, 2017).
2.1.6. Legal factors
In Spain, several legal factors are affecting the performance and flexibility of the electricity
market and the development of cost-efficient solutions. Electrical energy storage (EES) does not
have a clear legal framework, with almost no behind-the-meter electricity storage initiatives.
Only indirect storage by hydro pumping is currently being developed.
The current legislative framework, established by Act 24/2013 of the Power Sector, represents
the consolidation of the single TSO model in the Spanish Electrical System. This model is
protected by some equity limits, which fix the share of capital ownership of the TSO. The same
legislative framework sets the unbundling requirements for DSOs in line with the EU Directive
2009/72.
Following this framework, there is only one TSO (Red Eléctrica Española) and 3 main DSOs
(Endesa, Iberdrola and Gas Natural Fenosa).
Aggregation is not legal in the Spanish electricity system and the demand-side resources are not
allowed (they cannot provide upward/downregulation by deviating from their committed
consumption schedule) to participate in the electricity market. There is just one scheme allowing
the explicit demand response: the interruptible load scheme, which has not been called for
several years. The scheme, which is reserved only for large consumers connected to the high
voltage network, is managed by the TSO. The programme acts as an emergency action, in case
the system lacks generation and there are insufficient balancing resources.
The rest of the balancing and ancillary services can only be accessed by generation, affecting the
flexibility of the current Spanish electricity market.
The TSO and relevant stakeholders have started conversations for the future opening of these
services to flexible demand. Spain is the first country in the world where there is an electricity
tariff for households (i.e. Precio Voluntario al Pequeño Consumidor, PVPC) based on hourly spot
prices, which opens the possibility for users to modify the demand considering market prices,
thus overcome the demand aggregation issue. This price can be chosen by consumers with less
than 10 kW of contracted power, and it is a way to protect the consumers from the free market
companies that take advantage of technical unawareness of consumers.

CHESTER PROJECT NO. 764042
D6.1: Detailed PESTEL and PORTER analysis of the CHEST system 26
73%
12%
13%2%
Biomass Natural gas Other non RES Other RES
The Spanish regulation for distributed generation power curtailment requires the DSOs to
request the TSO to reject a distributed RES generation schedule as part of the network
constraints solution process conducted by the TSO to the day-ahead market solution. In any
case, the final decision to reject that distributed RES generation schedule belongs to the TSO.
Only in the case of an emergency, the DSO can remotely trigger a relay (compulsory for
installations larger than 5 MW), isolating the generation unit from the grid.
In the same way, the Spanish regulation for reactive power injection defines a general calendar
and timetable aimed to adjust distributed generation reactive power through incentives. Both
calendar and timetable are defined at the power system level irrespectively of the effect on the
distribution network.
2.1.7. Heating sector – District Heating
Currently in Spain, there are 352 DH networks, with a vast majority of small urban closed networks
(as Ispaster), with a total length of 600 km (ENERGIAS RENOVABLES, 2018) and a capacity of
around 1,280 MW which supply around 4,400 buildings. The development of DH since 2013 has
been quite important, with a total increase from 2013 to 2017 of more than 150 %, as shown in
Figure 22.
Figure 22: Historical evolution in the number of installed DH networks (ADHAC, 2017).
Most of them deliver energy to the tertiary sector, as represented in Figure 23. About 75 % of
the heat for DH is generated by RES, mainly biomass (73 % of the heat supply).
Figure 23: Installed power per sector and energy source in the DH (ADHAC, 2017).
139
202
247
306
352
0
50
100
150
200
250
300
350
400
2013 2014 2015 2016 2017
31%
25%
44%
residential industrial tertiary

CHESTER PROJECT NO. 764042
D6.1: Detailed PESTEL and PORTER analysis of the CHEST system 27
Only 20 % of the DH networks are entirely owned by the public entities; 40 % is completely
privately owned and the remaining 40 % present a mixed ownership (public and private). DH
networks with mixed ownership are conceived following two main business models: public
concession (with a private company responsible of the construction, operation and maintenance
of the system) or public-private partnership (at least 5-year agreements, where the private
company is responsible for operation and maintenance, while construction cost is shared
between public and private partners).

CHESTER PROJECT NO. 764042
D6.1: Detailed PESTEL and PORTER analysis of the CHEST system 28
2.2. Denmark
2.2.1. Political factors
From a political perspective, the Danish electricity market is affected by the long-term goals and objectives that the national government has set for the entire energy sector, which also includes heat generation and transport sector.
In 2012, the Danish government drew up an energy agreement with the large majority of the Parliament with the aim to completely get rid of fossil fuels by 2050 (Danish Ministry of Energy Utilities and Climate, 2012). A new Energy Agreement was signed on 29 June 2018, according to which the 2050-target was abandoned (Danish Government, 2018), although it was agreed that Denmark will aim at a net-zero-emission target by 2050. An intermediate milestone is set for 2030, when coal should be phased out and RES should represent about 55 % of the total demand, 100 % of the electricity consumption and at least 90 % of district heating generation. Financing of the green transition will partly come from the continued exploitation of the oil and gas resources in the North Sea.
To phase out fossil fuels in the near future, Denmark will act on several fronts. A key role will be
played by a lower and more efficient energy consumption, with a focus on the residential sector.
Secondly, electrification will be strongly encouraged: district heating, individual heating and
many industrial processes could be electrified with heat pumps, and in the long term, most of
the private transport could switch to electric and hybrid cars. To this purpose, the taxation on
electricity will be reduced (Danish Government, 2018). The interconnection across different
sectors (not only the electricity system, but also heat, gas and transport) will be promoted
through investments for the development of smart grids. Moreover, new interconnectors to the
neighbouring countries are under construction or under investigation, such as a connection from
Denmark to the Netherlands, one to Germany through the offshore wind farm of Kriegers Flak
and the DC Viking Link between West Denmark and the UK (Figure 24). Thirdly, RES (biomass,
biogas, wind and solar) will be promoted and supported for both electricity and heat production,
but subsidies will be phased out as the technologies become competitive on market terms. An
important role is recognized for offshore wind energy, which should develop further in the
coming years with new and larger wind farms with an installed capacity of about 800 MW each
(Danish Government, 2018). Finally, investments in research, development and innovation are
expected to improve existing technologies and to overcome challenges such as efficient
electrical energy storage (EES), smart regulation of the electrical grid and green means of
transportation (Danish Government, 2011; IEA, 2017a).
Besides its own targets, Denmark has commitments under the United Nations Framework Convention on Climate Change and EU regulations. These include (IEA, 2017a):
• reduction of GHG emissions from non-ETS (ETS=Emission Trading Scheme of the EU) sectors by 20 % by 2020 compared to 2005. The target is projected to be reached;
• increase in the share of RES in gross final energy consumption to 30 % by 2020 (it was 16 % in 2005). The target is expected to be overachieved based on current trends;
• share of RES in land-based transport of at least 10 % by 2020. It is projected that existing measures will lead to 9 % by 2020.

CHESTER PROJECT NO. 764042
D6.1: Detailed PESTEL and PORTER analysis of the CHEST system 29
Figure 24: Present and future transmission lines between Denmark and neighbouring countries (IEA, 2017a).
2.2.2. Economic factors
General economic situation
Denmark’s economy grew by 2.2 % in 2017, while a growth of around 1.8 % is expected for both
2018 and 2019. Private consumption grew by 1.5 % in 2017, and it is expected to increase by
2.0-2.2 % in 2018 and in 2019. The unemployment rate was 5.7 % in 2017 and should further
decrease to 5.2 % in 2019. Difficulties in finding skilled workers are encountered in several
sectors (European Commission, 2018).

CHESTER PROJECT NO. 764042
D6.1: Detailed PESTEL and PORTER analysis of the CHEST system 30
Investments have expanded at a solid pace and recorded a 3.7 % growth in 2017, driven by the
housing and machinery sector. Investments in machinery and equipment are expected to grow
by around 4.4 % over the coming years, due to growth in Denmark’s main export markets.
Moreover, public investments fell by 8.4 % in 2017, as these had previously reached historical
high levels (European Commission, 2018).
Inflation increased by 1.1 % in 2017, but is forecast to dampen to 0.8 % in 2018, also due to the
lowering of various taxes. Consumer prices are forecast to rise by 1.4 % in 2019, on the back of
solid wage growth. Public gross debt should decline from 36.4 % of GDP in 2017 to 32.3 % in
2019, due to a reduction in the general government’s cash reserves, low interest rates and
economic growth (European Commission, 2018).
Energy-related industry
Enterprises operating in the green energy sector have been positively affected by the ongoing
energy transition toward a low-carbon society. Danish enterprises operating in the energy sector
have been successful on the global markets and in 2016 exported technology and equipment
(wind turbines, DH pipes, pumps, etc.) for about 10 G€, corresponding to 12 % of Denmark's
total exports (Danish Energy Agency, 2017). Among the exported technologies, those related to
wind energy have a major role. In 2014, the turnover from the Danish wind industry was about
11 G€, of which about 7 G€ came from export. In the same year 29,000 people were employed
in the industry (Ministry of Foreign Affairs of Denmark, 2015). As production of renewable
energy is generally more labour intensive than conventional energy production, employment in
the energy sector is expected to keep on growing.
Energy taxation
Energy taxes are an important source of revenue in Denmark, but also an instrument to
influence the behaviour of consumers and suppliers. Energy taxes were introduced in the 1970s
at the time of the energy crisis, to reduce the demand for fossil fuels and promote energy
efficiency. When oil and gas prices dropped at the end of the ‘80s, the tax level was increased
for these fuels, so that consumers continued to be motivated to use energy in a responsible way
and prefer environmentally friendly energy sources (Danish Energy Agency, 2016c).
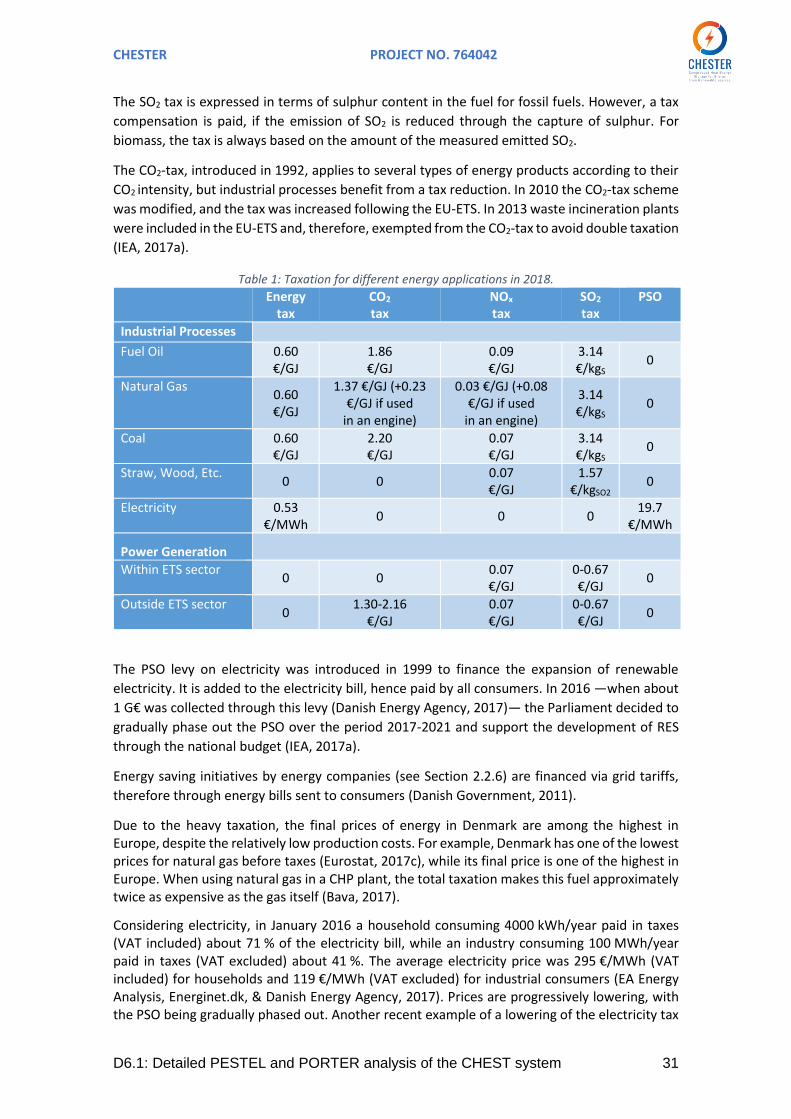
In 2018 the following energy taxes were present in different applications: energy tax, CO2 tax,
NOx tax, SO2 tax and PSO levy. An overview of such taxes is presented in Table 1 for the industrial
and power generation sector. All values reported for industrial purposes refer to 2018 and can
be looked up online (Danish Energy Agency, 2018c; Danish Ministry of Taxation, 2018). Values
of taxation on power generation were retrieved from (Danish Ministry of Taxation, 2016).
Fossil fuels for electricity and/or heat generation are subject to an energy tax. Biomass fuels are not taxed, which gives Danish electricity producers and DH companies an incentive to use biomass rather than fossil fuels. Industrial excess heat that is used for heating is also taxed. Industrial excess heat is also taxed. The industrial excess heat tax is effectively payed by the company that generates the heat. However, a company selling industrial excess heat to a DH network would likely require a reimbursement for this tax from the DH company. Additionally, fossil fuels and biomass are subject to taxes related to the emissions arising from their combustion.
Regarding the NOx tax, companies which do not measure the NOx emissions pay taxes based on
fuel consumption. Otherwise a tax of 0.68 €/kgNOx is paid on the amount of the emitted NOx.
CHESTER PROJECT NO. 764042
D6.1: Detailed PESTEL and PORTER analysis of the CHEST system 31
The SO2 tax is expressed in terms of sulphur content in the fuel for fossil fuels. However, a tax
compensation is paid, if the emission of SO2 is reduced through the capture of sulphur. For
biomass, the tax is always based on the amount of the measured emitted SO2.
The CO2-tax, introduced in 1992, applies to several types of energy products according to their
CO2 intensity, but industrial processes benefit from a tax reduction. In 2010 the CO2-tax scheme
was modified, and the tax was increased following the EU-ETS. In 2013 waste incineration plants
were included in the EU-ETS and, therefore, exempted from the CO2-tax to avoid double taxation
(IEA, 2017a).
Table 1: Taxation for different energy applications in 2018. Energy
tax CO2 tax
NOx tax
SO2 tax
PSO
Industrial Processes
Fuel Oil 0.60 €/GJ
1.86 €/GJ
0.09 €/GJ
3.14 €/kgS
0
Natural Gas 0.60 €/GJ
1.37 €/GJ (+0.23 €/GJ if used
in an engine)
0.03 €/GJ (+0.08 €/GJ if used
in an engine)
3.14 €/kgS
0
Coal 0.60 €/GJ
2.20 €/GJ
0.07 €/GJ
3.14 €/kgS
0
Straw, Wood, Etc. 0 0
0.07 €/GJ
1.57 €/kgSO2
0
Electricity 0.53 €/MWh
0 0 0 19.7
€/MWh
Power Generation
Within ETS sector 0 0
0.07 €/GJ
0-0.67 €/GJ
0
Outside ETS sector 0
1.30-2.16 €/GJ
0.07 €/GJ
0-0.67 €/GJ
0
The PSO levy on electricity was introduced in 1999 to finance the expansion of renewable
electricity. It is added to the electricity bill, hence paid by all consumers. In 2016 —when about
1 G€ was collected through this levy (Danish Energy Agency, 2017)— the Parliament decided to
gradually phase out the PSO over the period 2017-2021 and support the development of RES
through the national budget (IEA, 2017a).
Energy saving initiatives by energy companies (see Section 2.2.6) are financed via grid tariffs,
therefore through energy bills sent to consumers (Danish Government, 2011).
Due to the heavy taxation, the final prices of energy in Denmark are among the highest in Europe, despite the relatively low production costs. For example, Denmark has one of the lowest prices for natural gas before taxes (Eurostat, 2017c), while its final price is one of the highest in Europe. When using natural gas in a CHP plant, the total taxation makes this fuel approximately twice as expensive as the gas itself (Bava, 2017).
Considering electricity, in January 2016 a household consuming 4000 kWh/year paid in taxes (VAT included) about 71 % of the electricity bill, while an industry consuming 100 MWh/year paid in taxes (VAT excluded) about 41 %. The average electricity price was 295 €/MWh (VAT included) for households and 119 €/MWh (VAT excluded) for industrial consumers (EA Energy Analysis, Energinet.dk, & Danish Energy Agency, 2017). Prices are progressively lowering, with the PSO being gradually phased out. Another recent example of a lowering of the electricity tax

CHESTER PROJECT NO. 764042
D6.1: Detailed PESTEL and PORTER analysis of the CHEST system 32
is that the tax level for electricity used for heating is being lowered, giving increased incentives for using large-scale heat pumps for heat generation in DH.
Subsidies for renewable energy sources
The wind power sector has always received support from the State, although the subsidy
schemes have changed over time. The current scheme for onshore wind turbines took effect on
January 1st, 2014. A ceiling on the sum of the market price and the feed-in-premium was
introduced. Hence, onshore wind turbines connected to the grid from 2014 receive a feed-in
premium of 3.35 c€/kWh with a ceiling of 7.78 c€/kWh. The feed-in-premium is paid for the first
6600 full-load hours plus an amount of electricity, which is a function of the rotor swept area.
The dependence on the rotor size was introduced to promote the most beneficial relation
between nominal capacity and production (EA Energy Analysis et al., 2017).
Figure 25: Onshore and offshore wind turbines in Denmark (EA Energy Analysis et al., 2017).
Regarding offshore wind power, two different schemes are possible. In the open-door scheme,
a project developer submits an unsolicited application for a license to carry out a preliminary
investigation for an offshore wind farm in a specific area. Offshore wind turbines under the
open-door scheme receive the same support as onshore wind power. The developer pays for
the transmission line to land.
Special large offshore wind farms are developed and supported differently. These are
commissioned through a call for tenders, announced by the Danish Energy Agency for a specific
area and a certain installed capacity. The applicants submit a quotation for the price at which
they are willing to produce electricity in the form of a fixed feed-in tariff (FIT). The cheapest price
wins and the winner receives his bid as a guaranteed fixed FIT for the first 50,000 full-load hours,
after which he receives the market price only (EA Energy Analysis et al., 2017).

CHESTER PROJECT NO. 764042
D6.1: Detailed PESTEL and PORTER analysis of the CHEST system 33
However, the subsidy system for wind power may change again in the near future, because the
sector has reached a level of development that it may be soon able to stand on its own without
public support (Danish Government, 2018).
A map of the onshore and offshore wind turbines installed in 2017 and potential areas for future
development is shown in Figure 25.
Biomass is exempt from most taxes (see Table 1), and additionally electricity produced from
biomass receives a premium of 0.02 €/kWh on top of the market price. Biogas is also supported,
but through complex and different schemes. Support does not depend on the biogas production,
but on its use (e.g., upgrading to natural gas grid, production of electricity, industrial processes,
transport purposes, heating, etc.) and on the natural gas price (IEA, 2017a). For example,
electricity producers using biogas can receive support in the form of a fixed FIT or a surcharge
on the electricity market price. More information on the support schemes for biogas can be
found online (Danish Energy Agency, 2018e). These support policies have been fairly effective,
and many biogas plants have been built in the recent years (Figure 24).
Import and export of electricity
As mentioned in Section 2.2.1, there is strong interchange of electricity between Denmark and
the neighbouring countries (Norway, Sweden and Germany). The amount and direction of the
exchanged electricity is determined by the different electricity prices in the different countries
and by the capacity of the interconnectors. In 2015, Denmark was a net importer of electricity
for 5.9 TWh, which represented 17 % of total supply (highest net import since 1990). Denmark
was a net importer from Sweden (3.6 TWh) and Norway (5.0 TWh), and a net exporter to
Germany (2.7 TWh). This was also due to the high electricity generation from hydroelectric
plants in Sweden and Norway.
Denmark typically has a generation surplus in winter, when the wind blows more and there is
electricity production from CHP plants, which operate to cover the heat demand of the DH
networks. On the contrary, there is a generation deficit in the summer months.
Wholesale market
Most of Danish electricity is bought and sold on the Nordic electricity market Nord Pool, which
also includes Norway, Sweden, Finland, Estonia, Latvia and Lithuania. Overall, more than 75 %
of the electricity consumption in the Nordic countries is traded on the Nord Pool market (Danish
Energy Regulation Authority, 2018). Nord Pool has two markets: Elspot, the day-ahead market;
and Elbas, the intraday balancing market. Most of the trading takes place in the Elspot market:
in 2016, Elspot purchases in Denmark were 31.2 TWh, while Elbas purchases were 0.9 TWh.
Nord Pool is part of the Multi-Regional Coupling, so it is coupled to the rest of Europe. This
means, among other things, that wholesale prices in Nord Pool and the rest of Europe should
reflect the expected direction of power flows.
Wholesale prices in Denmark tend to be higher than in the rest of the Nordic region, but lower
than in the rest of Europe. For example, in 2015 the average price in Denmark was 23.7 €/MWh,
compared to a Nord Pool average of 21.0 €/MWh and an EPEX SPOT average of 31.7 €/MWh.
This is mainly because Denmark lies between Norway (with its relatively inexpensive hydro) and
the rest of Europe (with more expensive thermal generation).

CHESTER PROJECT NO. 764042
D6.1: Detailed PESTEL and PORTER analysis of the CHEST system 34
Electric grid services
In addition to selling electricity to the wholesale, electricity producers are also offered the
possibility of selling auxiliary services to the electrical grid. These services are purchased by the
Danish TSO Energinet.dk. These services are balancing power and frequency regulation.
Producers that have power plants that can respond on a short notice (from the order of seconds
and up to 15 minutes) can place bids on the balancing power market. Producers that are able to
regulate their electricity production within milliseconds to seconds can place bids on the
frequency regulation market. In case the electricity production of the CHEST system is able to
respond on such short time scales, there could be possibilities of additional revenue to the
CHEST system operator by selling grid services to the TSO.
2.2.3. Social factors
The Kingdom of Denmark consists of Denmark and the two autonomous constituent countries
of Greenland and the Faroe Islands. In 2018, Denmark had a population of 5.75 million, not
including Greenland (56,300) or the Faroe Islands (49,700). The current population growth rate
is about 0.4 % per year.
Danish society has traditionally been keen on sustainable and renewable energy technologies.
At the start of the wind industry in Denmark in the late ‘70s, the initiatives to erect wind turbines
came mainly from local citizens. The early ‘80s saw the creation of many cooperatives of small
communities, who jointly invested in a shared wind turbine and received support through a tax
incentive, if they generated electricity to the local community. The local support for wind power
has been difficult to maintain, as the wind sector has evolved towards large wind turbines owned
by utilities. Despite the general favour of the population towards RES projects, many cases of
the so called NYMBY (Not In My Backyard) syndrome have occurred, with the strong opposition
of local communities against the installation of wind farms close to their homes (Tortzen, 2012).
Because the support of the local community is essential to ensure development of wind power,
initiatives to secure local involvement have been taken in more recent years, e.g. the option for
private people to purchase shares of new wind power projects built near their homes (in Danish
“Køberetsordningen” (Danish Energy Agency, 2018b)), and —until February 2018— the
possibility for a municipality hosting wind power installations to apply for funds to promote
initiatives aiming at increasing the acceptance from the local community (in Danish “Grøn
ordning” (Danish Energy Agency, 2018a)).
The 2018 Energy Agreement pays much attention to the social acceptance of wind turbine
projects: the distance from the coastline within which a municipality can make opposition
against the installation of an offshore wind farm was extended from 8 km to 15 km. Additionally,
according to the Agreement the number of onshore wind turbines should be halved by 2030
(Danish Government, 2018). The installed capacity will, however, not be halved, because old,
smaller turbines will be decommissioned, to give space to fewer but larger new turbines.
2.2.4. Technological factors
Current situation
The Danish electricity system is characterized by a high share of RES. In 2016 the gross electricity
generation was 30 TWh, with a generation mix composed mainly of wind energy (42.5 %), coal
(28.8 %), biofuels and waste (17.9 %), natural gas (7.3 %), solar (2.5 %). In 2015 the electricity
consumption was 31.7 TWh and the peak load 5.6 GW, against an installed capacity of 14 GW

CHESTER PROJECT NO. 764042
D6.1: Detailed PESTEL and PORTER analysis of the CHEST system 35
(Figure 26). Of the installed capacity 57 % is represented by combustible fuels plants and 36 %
by wind turbines (IEA, 2017a).
Figure 26: Gross electricity generation by source, 1973-2016 (IEA, 2017a). Asterisk * in the legend denotes negligible contribution.
In 2017, wind energy production set a record, representing 43.4 % of the national electricity
consumption (Danish Ministry of Energy Utilities and Climate, 2017). Despite the high share of
this fluctuating energy source, the electrical grid has proven to be extremely reliable. In fact,
Denmark, The Netherlands and Germany are the European countries with the shortest periods
of electricity interruption per consumer. Among other things, this is also due to the high fraction
of the electrical grid which is buried in the ground. In 2017 the average Danish consumer
experienced 25 minutes interruption per year (Energinet.dk, 2018).
Natural gas has traditionally been one of the main energy sources in Denmark, but its
importance has diminished over the past decade due to the growth of RES. Denmark is a net
exporter of natural gas, selling to Germany, Sweden, the Netherlands and buying it from
Norway. Power and heat generation remains the largest gas-consuming sector, absorbing 29 %
of the total gas consumption, although from 2000 to 2015 natural gas consumption in this sector
decreased by 62 %. The second consumer is the industrial sector with 23 % of the total
consumption (IEA, 2017a).
Power and heat generation is also the sector where most of the coal (95 %) is used. In 2016 coal
contributed to 29 % of the power generation and 12 % of the total primary energy supply. On
the other hand, oil has a minor role in the power and heat generation sector (only 1.7 % of the
total oil consumption) (IEA, 2017a).
Electrical grid
The 400-kV transmission grid is managed and owned by the TSO Energinet.dk, an independent
public enterprise owned by the Danish State, represented by the Minister of Energy, Utilities
and Climate. Energinet.dk is responsible for maintaining security of supply and ensuring the
smooth operation of the electrical grid. Additionally, the company owns the natural gas
transmission network (and through a subsidiary Danish Gas Distribution large parts of the
distribution network) and co-owns the interconnectors to Norway, Sweden and Germany
together with the relevant neighbouring TSO.
The Danish electricity transmission network is divided into two grids. The grid DK1 (West
Denmark) covers Jutland and Fyn and it is synchronized with the rest of continental Europe. The

CHESTER PROJECT NO. 764042
D6.1: Detailed PESTEL and PORTER analysis of the CHEST system 36
grid DK2 (East Denmark) covers the islands of Zealand and Bornholm and it is synchronized with
the rest of the Nordic region. The two grids are connected through the Great Belt Power Link, a
400-kV DC line of 600 MW. Compared to the demand, the generation capacity in DK2 is smaller
than in DK1. Therefore, DK2 is often importing power from DK1 (in 2016 DK2 imported from DK1
96 % of the time). The transmission capacity of the Great Belt Power Link is often constrained.
In 2016, the thermal limit of the interconnector was reached 32 % of the time, and 52 % of the
time the exchanged power was within 5 % of the limit. As a consequence wholesale prices of
electricity are generally slightly higher in DK2 than in DK1 (IEA, 2017a).
Of the current six cross-border interconnectors three are with Sweden (one from DK1, two from
DK2: Zealand and Bornholm), two with Germany (one from DK1, one from DK2); one between
DK1 and Norway (Figure 24). New interconnectors are under construction or investigation (see
Section 2.2.1).
Finally, the low voltage (<120 kV) distribution network is operated by 49 relatively small DSOs,
serving around 3.3 million customers (see Section 2.2.6).
Future scenarios
In the coming years, wind energy is expected to increase even more, as new wind farms are
built, such as Horns Rev 3 next to Esbjerg, Kriegers Flak in the Baltic Sea, North Sea South by
Ringkøbing and North Sea North by Harboøre (Danish Ministry of Energy Utilities and Climate,
2017). Additionally, according to the 2018 Energy Agreement, there is a plan for an offshore
wind farm of 800 MW to be built by 2027. Calls for tenders for other two offshore wind farms
of at least 800 MW each will be held in 2021 and 2023.
Until now, the Danish electricity system has been characterized by a large installed capacity. But
with the increasing share of wind and solar electricity, the production from power plants will
diminish, also because many of them are reaching their technical lifetime. In recent years, more
than 2 GW of older power plants have been decommissioned. This development is expected to
continue, so the period of large overcapacity is about to end (Danish Energy Agency, 2014). With
high shares of intermittent electricity production and fewer power plants ensuring system
stability, the electrical grid will face technological and economic challenges.
First, as electricity cannot be directly stored, there is a need for mechanisms that can increase
the flexibility and regulation capability of the grid. These mechanisms must be able to absorb
the excess electricity, when there is plenty of wind energy production, and vice versa ensure
efficient and secure power supply in case of little wind. Interconnectors already connect
Denmark to Sweden, Norway and Germany and new ones are planned (see Section 2.2.1).
Therefore, when the wind electricity production is higher than the demand, the excess electricity
can be sold to the neighbouring countries, to be instantaneously used or converted in potential
energy and stored in the Norwegian water reservoirs. The reservoirs can be emptied later, when
required. Through the same interconnectors, electricity can be imported, for example from
German solar and wind fields, and Swedish nuclear power plants. This ensures a production price
that is one of the lowest in Europe (Eurostat, 2017b). However, the possibility of creating water
reservoirs is limited by environmental legislation and/or landscape configuration: for example,
Denmark has none, due to its flat landscape. Hence, alternative solutions are likely to attract
much attention in the future, e.g. batteries or conversion to gas (e.g. hydrogen or methane)
and/or liquid bio-fuels for later use in the electricity sector or in other sectors of the energy
system. In this context, an EES technology such as the CHEST concept seems extremely
interesting. Currently, however, the Danish TSO do not seem to regard large-scale EES as a

CHESTER PROJECT NO. 764042
D6.1: Detailed PESTEL and PORTER analysis of the CHEST system 37
priority for the management of the grid, as demand side management (central electric boilers,
central and individual heat pumps) and energy storage in electric vehicles batteries are seen as
the main tools to match supply and demand (Sorknæs, Mæng, Weiss, & Andersen, 2014).
Secondly, the increase in intermittent renewable electricity production requires a larger
transmission capacity to carry electricity away from areas when there is strong wind and low
consumption, to areas where there is high consumption and quiet weather. This is a slow but
constant development and modernization of the electrical grid, which has already been going
on in Denmark for several years. As the grid is restructured, this will be able to handle
increasingly larger amounts of wind electricity (Danish Energy Agency, 2014).
Thirdly, the need for power generation from thermal power plants and CHP plants is decreasing
(see Section 2.2.6). So, the profit of CHP plants coming from the electricity market is reduced
and this increases the cost of the heat for DH. Due to their fast capacity regulation, CHP plants
are expected to become more a backup and balancing mechanism than the suppliers of the base
load of the electrical grid. CHP plants would run only when the balance of the electrical grid and
the electricity prices make their operation profitable. Nevertheless, heating supply is required
by the DH network throughout the year. The need to cover the heat demand may force a CHP
plant to operate even at low electricity prices. For this reason, in the last years many Danish DH
companies have invested in biomass boilers, large solar thermal plants and heat pumps, so to
decouple electricity and heat generation.
In the operation of the electrical system, the immediate balance between consumption and
production is ensured by the so called “system services”, which include voltage control, reactive
power control and frequency control. These services are primarily provided by central power
plants, but with fewer power plants available, system services should be provided in a different
way. The Danish TSO Energinet.dk estimates that in normal situations the electrical system in
Eastern Denmark in 2020 could be operated without power plants (Danish Energy Agency,
2014). This does not mean that power plants will be completely unused, but that the
dependence on their operation will be significantly reduced. In fact, in some situations there will
still be a need for power plants, among other things to regulate the reactive power that cannot
be supplied by synchronous compensators. Flexibility will be required from other power plants
as reserve capacity and for regulation, if unit failure occurs or when there is neither wind nor
sun. In addition, there must be emergency start-up options, to restart the network after a
blackout. Currently, international rules require that an area has domestic reserves, but these
rules may change in the future. The future electrical systems might therefore develop so that
there will no longer be a need for domestic power plants, if it is more convenient to use flexible
plants located in other countries (Danish Energy Agency, 2014).
There is an ongoing internationalization of the markets for system services, especially purchases
of reserve capacity, so that the most economical plants can be activated across national borders.
A more interlinked operation with neighbouring countries is expected, with each country
contributing a proportionate share of the overall need for reserve capacity with quick ramp-up
(Danish Energy Agency, 2014).
2.2.5. Environmental factors
In 2015, the total GHGs emissions in Denmark were 51.9 Mton of CO2-eq, with CO2 being the
main contributor (75 % to the total). Emissions of CO2 were distributed across the sectors as
follows: transport, 36 %; power and heat generation, 33 %; industry, 17 %; commercial and

CHESTER PROJECT NO. 764042
D6.1: Detailed PESTEL and PORTER analysis of the CHEST system 38
residential, 14 %. Over the past decade, total GHG emissions have been reduced by 27 % (IEA,
2017a).
The government has adopted various measures to reduce emissions, such as supporting RES and
promoting energy savings and energy efficiency (see Section 2.2.6). Denmark’s participation in
the EU-ETS and implementation of EU-driven standards and requirements also contribute to the
national efforts.
Considering the power and heat production sector alone, CO2 emissions halved between 2005
and 2015. In power generation, this was due to the large increase in wind electricity, which
replaced coal and gas generation. In 2015 CO2 intensity in electricity generation was 163 g/kWh
(45 % lower than in 2005), which is less than half of the IEA average (about 390 g/kWh) (IEA,
2017a). Additionally, the total electricity production decreased by 20 %, because of decreased
demand and increased imports. In heat production, CO2 emissions reduction was mainly
achieved through increased use of biomass, which increased by 58 % and now represents more
than half of the total DH generation (IEA, 2017a).
Economic growth has been decoupled from carbon emissions for years now. From 2005 to 2015,
the GDP (PPP) increased by 7 %, but energy-related CO2 emissions declined by 34 %. In 2015
carbon intensity (the ratio between energy-related CO2 emissions and GDP) was 38 % lower than
in 2005 and the fifth-lowest among the IEA countries, after Switzerland, Sweden, France and
Norway (the first three countries have a high share of nuclear power, and Norway and Sweden
a high share of hydropower).
2.2.6. Legal factors
The Danish Energy Agency is responsible for implementing the European legislation in the
Danish legislation. As in the rest of EU, also in Denmark the electricity market has been
liberalized and is now increasingly interconnected to the other European electricity markets.
However, the electric network (and its operation) is a natural monopoly that is not subject to
competition. The Danish Energy Agency develops the framework for the prices that the TSO and
DSOs can charge consumers for the transport of electricity, as well as the requirements to be
fulfilled by TSO and DSOs. This framework is meant to ensure low-price electricity for the
consumers, in addition to robust network infrastructure. Besides, the Danish Energy Regulatory
Authority is responsible for the financial regulation of the TSO and DSOs (Danish Energy Agency,
2018d).
Regarding power producers, electricity production from plants with a capacity of more than
25 MW can only be carried out by companies that have obtained authorization from the Danish
Ministry of Energy, Utilities and Climate, which is given for at least 20 years. Owners of power
plants and CHP plants must pay all the costs for connecting the plant to the nearest transmission
network over 100 kV. However, in case of decentralized power plant and CHP plants that use
municipal waste or produce renewable electricity, the owner of the plant must only pay the
expense associated with connecting the plant to the 10-20 kV grid. Other costs are borne by the
DSO, if the costs relate to the distribution network, or by the TSO, if the costs relate to the
transmission grid (Danish Energy Agency, 2016b).
Energy Savings Obligation Scheme
Since 2006, the grid and distribution companies operating in the sectors of electricity, natural
gas, DH and oil are subject to the Energy Savings Obligation Scheme, which aims at progressively

CHESTER PROJECT NO. 764042
D6.1: Detailed PESTEL and PORTER analysis of the CHEST system 39
reducing the use of energy of the signatory parties. In the latest agreement in 2016, the
reduction target was 10.1 PJ/year from 2016 to 2020 (Danish Energy Agency, 2016a). The total
target is spread among the parties according to their volume of distributed energy. Trading of
savings credits among parties is allowed: a credit is given to the purchasing party and subtracted
from the performance reports of the selling party.
Signatory parties can use a variety of measures to reach their reduction target, but to favour
measures giving long-term benefits, weighting factors which vary based on the lifetime of the
measure are applied. The costs of the energy saving obligation (around 2.68 €/MWh) can be
included in the grid tariff and charged on the end-user. For this reason, some stakeholders have
argued that distributors do not necessarily aim at cost-efficient solutions, as the costs are
recovered anyway (IEA, 2017a). Maybe also for this reason, the 2018 Energy Agreement does
not renew this scheme when it expires in 2021 (Danish Government, 2018).
Change in legislation for decentralized CHP
During the 1980s and ‘90s, many DH plants were converted to gas-fired CHP plants, and a lot of
new CHP plants were built (Figure 24). An electricity subsidy for small-scale CHP gave financial
incentive to invest in this type of plant. Besides being an efficient way to simultaneously produce
heat and electricity, the decentralized CHP plants provided flexibility in the power system,
allowing a large amount of wind power to be integrated with negligible curtailment.
Until now, decentralized CHP plants have received two subsidies (called Grundbeløb in Danish)
for their electricity production/capacity availability. The reason for this is that natural gas
generation has declined dramatically since 2004 (9.8 TWh, historical peak), due to the increasing
amount of wind electricity, so nowadays the natural gas fleet operates about 12 % of the time
(IEA, 2017a) and it is, hence, uneconomic. The subsidy has maintained this capacity as a reserve
and prevented the DH heat price to soar.
The two subsidies (Grundbeløb 1 and Grundbeløb 2) are production-independent support
schemes for decentralized CHP plants, introduced to replace previous production-dependent
subsidies. To receive the subsidies, a plant must be ready for use and available for most of the
year. Therefore, these subsidies are a sort of capacity payments (Energinet.dk, 2014).
The amount of Grundbeløb 1 varies from month to month, depending on the average price of
electricity, so that a lower spot price gives a higher support and vice versa. In 2013 the average
subsidy was 74,000 €/MW in East Denmark. This is just an indicative value, as there are
differences in subsidies from plant to plant, and from East to West Denmark (due to the different
electricity prices in the two areas) (Grøn Energi, 2017).
Grundbeløb 2 was introduced in 2013 and applies to decentralized CHP plants of less than
25 MW, running on natural gas and/or biogas. The amount of Grundbeløb 2 is individually fixed
for each plant. As a rough approximation, the average support per MW from Grundbeløb 2 is
about 2-3 times smaller than that from Grundbeløb 1 (Energinet.dk, 2014).
Grundbeløb 1 and Grundbeløb 2 expire at the end of 2018 and 2019 respectively (Energinet.dk,
2014). Then, many of the natural gas plant capacity will likely be decommissioned. According to
the 2018 Energy Agreement, some measures are planned for the period 2019-2023, to mitigate
the negative effects of the abolition of the Grundbeløb on DH companies and customers. These
initiatives include pools for stranded costs, advice to companies and customers, financial
support for individual heating solutions and to customers who will experience increased heating
prices (Danish Government, 2018).

CHESTER PROJECT NO. 764042
D6.1: Detailed PESTEL and PORTER analysis of the CHEST system 40
Electricity distribution grid
The DSOs in Denmark are regulated by the Danish Energy Regulatory Authority (DERA) under a
revenue cap model, whereby revenues are fixed every year based on the “regulatory price” of
electricity distribution. The cap is adjusted to allow for necessary new investments. In addition,
DERA caps the allowed rate of return on grid assets (IEA, 2017a).
Starting in 2018, DERA should move to a new regulatory model developed by the Danish Energy
Agency with input from the DSOs, DERA and consumers. While based on the revenue cap model,
the new regulatory model should include an explicit incentive for efficiency improvements, a
cap on returns from historical investments, future investments returns set according to a
market-based weighted average cost of capital, and a reduction in the cap, if the “quality of
supply” was to decline (e.g. a higher number of outages) (IEA, 2017a).
In addition, the possibility to apply time-of-use tariffs for all customers has been introduced.
Initially this would only be based on expected demand, as real-time consumption data are not
available. However, this may change, as smart meters become more common. Introduction of
smart meters and flexible billing must be completed by 2020, according to EU regulation (IEA,
2017a).
The new model also includes an additional “availability” tariff for consumers who install
distributed generation, e.g. PV. The purpose is that consumers pay for their share of the costs
of the grid, even if they do not use it 100 % of the time. For large producers this tariff would be
calculated on a case-by-case basis, but for households the tariff would be fixed and identical for
everyone (IEA, 2017a).
2.2.7. Heating sector – District Heating
After the first installations the 1920s and ‘30s, DH in Denmark expanded considerably in the
following decades and by the ‘70s, approximately 30 % of the Danish houses were connected to
DH networks. The oil crises in the ‘70s and the discovery of natural gas in the North Sea gave a
further push to the development of DH and of gas-fired CHP plants, whose surplus heat could
be used to supply DH networks. The cogeneration agreement in 1986 made small CHP plants a
major energy policy priority. Simultaneously, electric heating with electric panels was banned.
A revised law on heating supply in 1990 promoted the conversion of existing coal and gas-fired
DH plants to CHP plants, as well as the use of biomass. Additionally, new CHP plants were built
to supply new DH networks installed in a number of larger towns (Danish Energy Agency, 2016c).
According to regulation, DH companies must be non-profit. In this way, the DH customers are
protected from an otherwise possible abuse that might derive from the natural monopoly of a
DH company.
Currently, DH supplies 63 % of all private buildings (Danish Energy Agency, 2016c). There are six
large DH networks (in its largest cities) as well as approximately 400 small and medium-sized
networks. In 2016, 67 % of the DH heat was produced in CHP plants, many of which are gas- and
biomass-fired. Other DH networks use gas or biomass boilers, heat pumps and solar collectors.
The current trend (and current policy incentives) is to replace fossil fuels with biomass, heat
pumps and solar heating.
Forward and return temperatures are usually about 70-80 °C and 40-50 °C respectively, hence
much lower than in many other countries. This makes the integration of solar heating in the DH

CHESTER PROJECT NO. 764042
D6.1: Detailed PESTEL and PORTER analysis of the CHEST system 41
systems feasible and efficient. It is, hence, no surprise that Denmark is the leader in the sector
of large solar collector fields supplying DH systems.
The low temperatures also allow injecting excess heat from industry into the DH networks,
either directly at the forward temperature (in case the excess heat is warm enough) or via a
booster heat pump, which increases the temperature of the excess heat. The possibility for
lowering the DH temperatures even further is being explored. This could include solutions such
as ultra-low-temperature DH networks with operating temperatures between approx. 20 and
40 °C. Such grids would further increase the potential of using industrial excess heat.
Four DH plants equipped with a solar collector field also have a seasonal TES (water pit TES). The
presence of the seasonal TES increases the solar fraction of the system above the 15 %-20 %
value typical of systems without long-term storage. Additionally, in periods of high wind
electricity production, hence, low electricity prices, TES can technically be used to balance the
grid via heat pumps. Electricity can be converted into heat and stored in the TES, or used to run
a heat pump to discharge the storage (Novo, Bayon, Castro-Fresno, & Rodriguez-Hernandez,
2010).
In systems where a large-scale TES is already present, the integration of the CHEST system could
be easier and less costly, because the existing storage could be used as low-temperature TES for
the CHEST system.

CHESTER PROJECT NO. 764042
D6.1: Detailed PESTEL and PORTER analysis of the CHEST system 42
2.3. Germany
2.3.1. Political factors
In September 2010, the German government adopted the Energy Transition (Energiewende in
German) as an elaboration of the national energy policy until 2050. The document is a
comprehensive package containing policies for the electricity, heating and transport sectors,
setting out measures and targets for the development of RES, transmission and distribution grids
and energy efficiency. The Energy Transition is based on future scenarios elaborated by
independent institutions and studies on how the energy and climate policy targets can be most
efficiently achieved. Several policy goals are aimed at, such as securing energy supply, limiting
climate change, promoting growth and competitiveness of the national industry, making
Germany a leader in the fields of energy efficiency and environmental protection, maintaining
competitive energy prices and a high level of prosperity (IEA, 2013).
The Energy Transition and the Climate Action Plan 2050 (passed in 2016) set targets for GHG
emissions, RES and energy efficiency much more ambitious than those requested by the EU
(Weiß et al., 2017). These self-imposed targets include:
• reduction of GHG emissions by 55 % by 2030, 70 % by 2040 and 80-95 % by 2050 compared to 1990 (the target of -40 % by 2020 will not be achieved, based on the current trend (AGEB, 2018));
• increase in the share of RES in the final energy consumption to 30 % by 2030, 45 % by 2040 and 60 % by 2050;
• reduction of primary energy consumption by 50 % by 2050 compared to 2008 (the target of -20 % by 2020 will not be achieved, based on the current trend (AGEB, 2018)).
To reach these goals, specific targets and measures have been set for every sector:
• Energy sector: expansion of RES and reduction in the use of fossil fuels. GHG emissions in the sector should decrease by about 62 % by 2030 compared to 1990.
• Heating sector: expansion of RES so that 14 % of the German heating demand (DH and individual heating) is supplied by RES in 2020 (this value was 12.9 % in 2017).
• Building sector: strict standards for new buildings, long-term refurbishment strategies and reduction of heating systems based on fossil fuels.
• Transport: promotion of alternative drives (especially based on electricity), public transportation, railways, cycling and interconnection of means of transport.
• Industry and commerce: energy efficiency measures, use of waste heat and a research and development program to reduce inevitable industrial process emissions.
To achieve the targeted GHG emission reduction, coal will have to be phased out. Although coal
has decreased its share in the electricity mix over the last years (Figure 27), it still accounts for
about 40 % of the gross power generation. The persistent use of coal and the yet undefined
deadline for its phase-out are also motivated by the long tradition in mining of hard coal in the
Ruhr region and of lignite in the Rhine region, in Central and Eastern Germany1. The phase-out
of coal should be carried out without social and economic negative effects in the affected
1 There are three large lignite mining areas in Germany: Ruhr area (Rheinisches Revier, Koeln, Aachen), central (Mitteldeutsches Revier, Leipzig, Halle) and east (Lausitzer Revier, Cottbus).

CHESTER PROJECT NO. 764042
D6.1: Detailed PESTEL and PORTER analysis of the CHEST system 43
regions, while developing new industrial policy perspectives in a dialogue with stakeholders,
regions and trade unions (Weiß et al., 2017).
Although nuclear power was assigned an important transition role in the 2010 Energy Transition,
its role was reassessed after the Fukushima nuclear accident in 2011, and its phase-out was
accelerated with latest deadline set for 2022, much earlier than originally decided. Of the 17
reactors in operation, 8 were shut down already in 2011 (IEA, 2013), decreasing the nuclear
share in the electricity production from 25 % in 2010 to 17 % in 2012 (Fraunhofer ISE, 2018). The
accelerated phase-out of nuclear power was offset by conventional power plants (mainly coal-
fired) and required a fundamental reorganization of Germany’s energy supply. A comprehensive
package of legislation was approved, with measures regarding the increase of RES, upgrade of
the electrical grid, energy efficiency, funding of the reforms and greater investment in R&D (IEA,
2013).
Gas-fired power plants and CHP plants are expected to play a key-role in the energy transition.
In fact, modern, high-efficiency and quickly controllable gas plants can contribute to stabilizing
the electricity market in the medium term. They can be used flexibly and produce much lower
emissions than coal plants (Weiß et al., 2017). According to the regulation, the grid operator
must connect CHP plants to the network and purchase any electricity they produce. Electricity
from CHP receives either an agreed feed-in tariff plus a premium, or the premium only in the
case of direct marketing, which is compulsory for new CHP plants (Hermeier & Spiekermann,
2017).
In the future, also EES systems may play a relevant role in the control of the electrical grid,
especially in form of batteries, power-to-gas and hydrogen technologies (Brautigam, Rothacher,
Staubitz, & Trost, 2017). Although the market is still rather small, it is increasing rapidly, as the
installed capacity almost doubled from 2016 to 2017 (TenneT, 2018). The new government
seems favourable to EES solutions and declared its intention to improve the regulatory
framework for battery storage. Also, the German Environment Agency has given
recommendations in this direction. Therefore, it is expected that the present taxation on EES
will be reduced (currently EES is considered a consumer, thus, pays taxes accordingly).
2.3.2. Economic factors
General economic situation
Germany is a leading exporter of machinery, vehicles, chemicals and household equipment. Its
economy grew by 2.2 % in 2017, mainly driven by exports, while domestic demand temporarily
stagnated. The GDP is expected to grow by more than 2 % in both 2018 and 2019. The
unemployment rate should further decline, after reaching a new low level of 3.5 % in February
2018. Scarcity in the labour market is expected to lead to an increase in wages, which, thanks to
the moderate inflation (1.6-1.8 %), should entail a higher purchasing power. Equipment and
housing investments are expected to grow in the coming years (European Commission, 2018).
Both imports and exports are expected to increase, but the higher importance of the latter
should guarantee that the current account surplus remains high in 2018 and slightly decline in
2019. However, export’s potential may be limited by geopolitical tensions and escalating
protectionist agendas from commercial partners outside the EU (European Commission, 2018).

CHESTER PROJECT NO. 764042
D6.1: Detailed PESTEL and PORTER analysis of the CHEST system 44
Energy-related industry
Investments in RES are of considerable importance for the German economy, since a large part
of the added value is generated in the country itself. Since 2000, investment in RES installations
has increased steadily, peaking at 28 G€ in 2010, then declining to 15 G€ in 2016. This decline
was mainly due to the fall in PV prices in 2011-12 —while the installation rate remained the
same— and the reduction in newly installed PV capacity since 2013. Thus, since 2013, wind
energy (especially onshore) has collected the higher share of the investments (10 G€ in 2016,
66 % of the total). After installation, the operation and maintenance of the plants is a further
economic factor. Personnel, electricity, replacement parts, fuel and other operating expenses
incurred by the operator represent revenue for suppliers. The economic stimulus from the
operation of RES installations has risen steadily, from 2 G€ in 2000 to 15.6 G€ in 2016 (German
Ministry for Economic Affairs and Energy, 2017c).
The RES sector is also important in terms of creation of new jobs. In 2015 there were about
330,000 people employed in this sector (143,000 in the wind energy industry), against 117,000
people in the conventional power supply sector (Weiß et al., 2017).
Energy taxation
The main taxes on energy use in Germany are (OECD, 2018b):
• an energy tax which applies to oil products, natural gas, coal and coke products, at different rates depending on the use (transport, heat generation, industrial process, etc.). Fuels are untaxed when used for power generation in plants larger than 2 MW or when certain requirements for cogeneration of heat and power are fulfilled;
• a tax on electricity consumption of 20.5 €/MWh (but reduced rates and exemptions exist for specific types of consumption).
According to the EU directives, there is also a taxation on CO2 emissions. Due to the currently
low CO2 tax, the German government lobbied at a European level for increased prices in the EU-
ETS scheme (Weiß et al., 2017).
At the end of 2010, a tax of 145 € per gram of nuclear fuel was introduced, yielding about 6.3 G€
between 2011 and 2016. However, in 2017 the Constitutional Court declared the tax illegitimate
and retroactively null (World Nuclear Association, 2018).
Electricity prices in Germany are among the highest (if not the highest) in Europe (Eurostat,
2017b). Although the wholesale electricity price is not particularly high, surcharges, taxes and
fees increase the bill significantly. In 2018, politically-determined taxes represented 54 % of the
electricity price for a household consumer (nearly 300 €/MWh, VAT included). Grid fees,
metering and associated services accounted for 25 %, while the market electricity price just
21 %. The electricity price for industrial consumers is also amongst the highest in Europe
(150 €/MWh in 2017, VAT excluded (Eurostat, 2017b)).
Subsidies for renewable energy sources
Support of renewable electricity was introduced by the Renewable Energy Sources Act (in
German Erneuerbare-Energien-Gesetz, abbreviated EEG), adopted in 2000 and revised several
times since. The EEG aimed at supporting new RES technologies by guaranteeing a fixed FIT and
priority of feed-in. The 2012 edition of the EEG encouraged RES operators to sell their electricity
on the market, receiving a market premium on top of the electricity market price, instead of the

CHESTER PROJECT NO. 764042
D6.1: Detailed PESTEL and PORTER analysis of the CHEST system 45
fixed FIT. The premium is calculated as the difference between the FIT and the monthly
technology-weighted spot price (IEA, 2013).
Based on a 2014 amendment of EEG, the remuneration of large RES installations should be
determined through competitive auctions, while FIT kept being granted only for small systems.
Under the new auction scheme, the RES capacity which is to be built is announced, and investors
offer a price at which they are willing to sell electricity from their planned projects. The lowest
bids win the auction and have a guaranteed price for 20 years in form of a market premium, as
explained before. Auctions for ground-mounted PV systems have been held since 2015, and
were extended to roof-mounted PV, onshore and offshore wind, and certain biomass plants
from 2017. The auction scheme has led to competition and lower costs (German Ministry for
Economic Affairs and Energy, 2017c).
The financial resources to support RES electricity come from the EEG surcharge, which is applied
to the consumers’ bills. In the last years, the expansion of RES installation and the decrease of
the electricity market price have caused an increase of the total financing needed for RES
electricity. Hence, the EEG surcharge has constantly increased, reaching 6.88 c€/kWh in 2017 (it
was 2.05 c€/kWh in 2010) and representing about 23 % of the electricity bill of a typical
household consumer (German Ministry for Economic Affairs and Energy, 2017c).
Import and exports of electricity
Although Germany has been a net exporter of electricity since 2003, it was not until 2013 that
the volume of exported electricity has become significant. In the period 2015-2017 net exports
were about 50 TWh/year. The main importers of German electricity are Netherlands, Austria,
Switzerland and Poland, while France is the net exporter to Germany (Fraunhofer ISE, 2018).
Wholesale market
Germany has an energy-only market of electricity. Electricity is traded either on the European
Energy Exchange (EEX) or the European Power Exchange (EPEX). Besides allowing trading of
several energy commodities and energy-related products, the EEX provides a spot market, a
derivatives market and an over-the-counter (bilateral contract) market for electricity. The EPEX
is the spot market (day-ahead and intraday) for Germany, Austria, France, the United Kingdom,
Belgium, Luxemburg, the Netherlands and Switzerland (IEA, 2013).
The German/Austrian intraday market consists of two parts. Firstly, there is a daily intraday
auction at 15.00 on the previous day which functions like the day-ahead market with the only
difference being that 15-minute products are traded instead of hourly products. Secondly, there
are two continuous intraday markets, one operated by EPEX and one operated by Nord Pool,
both offering 15-minute, 30-minute and hourly products. The 15-minute products in the
intraday market allow for a better approximation of the real demand and generation profiles,
which is very important, as imbalance settlement are calculated on a 15-minute basis (TenneT,
2018).
Since 2015 the increasing renewable electricity production has caused a decrease of the
electricity volume traded on the day-ahead market and an increase on the intraday market. As
a result of forecasts of RES generation one day ahead are not so accurate, RES electricity is better
traded close to delivery, when estimates on production are more accurate (TenneT, 2018).
Wholesale electricity price in Germany/Austria (single price zone) are among the lowest in
Central Europe, followed closely by those in the Netherlands. Prices in Belgium and France are

CHESTER PROJECT NO. 764042
D6.1: Detailed PESTEL and PORTER analysis of the CHEST system 46
typically higher during winter (due to the use of electric heating), while they converge over
summer (TenneT, 2018). However, the split between Germany and Austria price zone in October
2018 is expected to slightly lower the prices in Germany while increase them in Austria.
As the German electricity market is an energy-only market, there is no capacity market with
explicit payment for capacity. Still, capacity reserve always guarantees the electricity supply, but
this capacity is only used if —despite free price formation on the market and contrary to
expectations—, the supply does not cover the demand at a particular time. This leads to price
peaks, which cover not only the marginal cost of the reserve capacity, but also part of their fixed
operating costs and capital costs. Hence, it is the customers who, through their demand and
willingness to pay, determine the capacity level and pay for it through implicit payments for
capacity on the electricity market. Additionally, reserve capacity can make profit through long-
term contracts, which large users use to hedge against the risk of price volatility on the electricity
market (German Ministry for Economic Affairs and Energy, 2015).
2.3.3. Social factors
Germany is a federal democracy divided into 16 regions (Länder), with an estimated population
of 82.3 million and population growth rate of 0.22 % per year for 2016.
Aware of the importance of public commitment and of the limits to authoritative enforcement
in the field of energy policy, the German government makes a continuous effort to inform and
involve citizens in the Energy Transition policy, addressing them as consumers and
entrepreneurs, conscious that the success of the transition depends also on individual
investments and consumption changes. This is part of a consensus strategy, which consists also
of extensive advertising of the Energy Transition as a national challenge and ethical
responsibility; funding of research programs in the field to achieve economic growth, creation
of jobs and a cost-efficient energy transition. Private citizens take also part in several of the
advisory committees that the government turns to in the field of energy policy (Krick, 2018).
Nevertheless, most of citizen participation on more practical issues, such as grid extension and
nuclear power, takes place at local level. For example, when the government resumed a nuclear-
oriented policy at the end of 2010, large demonstrations took place in various parts of the
country. Anti-nuclear opposition exploded after the nuclear accident in Fukushima in 2011, and
under its pressure, the government announced the phase-out of nuclear power. More recently,
local communities and environmental organizations, often backed up by local politicians, have
opposed the extension of the transmission grid. To win public acceptance and accelerate the
installation, the government decided that the planned north-south transmission lines would be
mostly subterranean, despite the higher cost (Appunn, 2018).
Regarding RES projects, a 2017 survey showed a wide public acceptance with 95 % of the
population supporting further expansion of RES. Lower acceptance rates were recorded, if the
RES technology was to be installed near one’s home (the so-called “not in my back yard”
(NYMBY) phenomenon), with 72 % acceptance for solar parks and 57 % for wind farms. The rate
rose to 94 % and 69 % respectively, when interviewed people had a RES plant already installed
in their area (German Renewable Energies Agency, 2017). Another interesting survey on the
public acceptance of different energy technologies and on the NIMBY phenomenon in Germany
is presented in (Bertsch, Hall, Weinhardt, & Fichtner, 2016).
Besides the concerns about the environment, future generations and energy security (German
Renewable Energies Agency, 2017), the public support also derives from the direct involvement

CHESTER PROJECT NO. 764042
D6.1: Detailed PESTEL and PORTER analysis of the CHEST system 47
of citizens in RES installations. In 2016, private citizens and farmers owned 42 % of the installed
RES capacity (although 4 %-points less than in 2012), above energy companies (16 %),
developers (14 %) or funds/banks (13 %). Private citizens and farmers owned 41 % of the
onshore wind power capacity an 49 % of the PV capacity (German Renewable Energies Agency,
2018).
2.3.4. Technological factors
Current situation
The electricity production in Germany has traditionally been dominated by coal and nuclear, but
these energy sources have declined since 2000, replaced by RES and natural gas. In 2016 the
gross electricity production was 651 TWh (net 614 TWh), with a generation mix composed
mainly of coal (40 %), RES (29 %), nuclear (13 %) and natural gas (12.5 %) (AGEB, 2018). Wind
energy represented 42 % of the renewable electricity production, followed by biomass and
waste (26 %), PV (20 %) and hydropower (11 %) (German Ministry for Economic Affairs and
Energy, 2017c). In the same year the gross electricity consumption was 597 TWh (AGEB, 2018).
The net generation capacity installed was 197 GW, against a peak demand of 87 GW. Of the
installed capacity, wind turbines and coal plants account for 25 % each, followed by PV (21 %)
and natural gas plants (15 %) (Fraunhofer ISE, 2018).
Figure 27: Gross electricity generation by source, 1990-2015 (IEA, 2018).
Coal is still the main energy source for electricity generation, but its relative importance is
decreasing (from 53 % of the electricity production in 2000 to 40 % in 2016). Germany is self-
sufficient with respect to brown coal (lignite), while it imports hard coal (54 Mton in 2016, mainly
from Russia (IEA, 2017b)). Nuclear power (13 % of power generation in 2016) has also been
declining (it was 31 % in 1997), especially after 2011, when eight plants were shut down.
In 2017, 15 % more electricity was generated by RES compared to 2016, mainly due to extremely
favourable wind conditions and newly installed capacity of wind turbines. In fact, onshore wind
turbine capacity increased by almost 5 GW, reaching a total of 50 GW. Offshore capacity
increased by 1.3 GW, giving a total of 5.4 GW. PV systems supplied 5 % more electricity than in
2016. About 2 GWp of new PV systems were installed in 2017, with a cumulated installed

CHESTER PROJECT NO. 764042
D6.1: Detailed PESTEL and PORTER analysis of the CHEST system 48
capacity of 43 GWp. Electricity production from biomass was nearly unchanged compared to
2016 (AGEB, 2018).
Despite the high share of fluctuating RES, the German power grid has been very reliable so far
(Danish Energy Agency, 2014). However, its upgrade and expansion now have a high priority, to
cope with the increase in RES electricity and the future phase-out of nuclear and coal power.
Electrical grid
The 36,000 km of the super high-voltage (220-380 kV) transmission grid are owned and
managed by four TSOs: 50Hertz, Amprion, TenneT and TransnetBW, overseen by the Federal
Network Agency (Bayer, Matschoss, Thomas, & Marian, 2018). In Figure 28, the competence
areas of the different TSOs are shown. The four TSOs are now legally unbundled entities,
originally spun off from the four main conventional generators RWE, E.ON, EnBW and Vattenfall.
Until a decade ago, electricity in Germany was produced mainly at the highest concentration of
consumption. This explains the multiple coal power plants built in the Ruhr region, and nuclear
power plants in southern Germany. Although the electrical grid has been very reliable so far, the
expansion of RES (especially wind power in North) and the phase-out of nuclear power plants
require its upgrade. In 2015 and 2016 respectively, 4.95 % and 4.36 % of the wind electricity was
curtailed due to network congestion, and the overall costs for congestion management has
soared in the last decade peaking at over 1.1 G€ in 2015 (then 850 M€ in 2016) (Joos & Staffell,
2018). The deployment of PV (mainly in the south) and interconnections with pumped hydro
storage in Austria have partly mitigated the situation, but the potential to increase this form of
storage is now very limited (IEA, 2013).
Unscheduled transfer flows and power loop flows have become more frequent. Power loop
flows occur when, due to insufficient internal transmission capacity, power produced in
Germany is diverted through neighbouring countries' grids and then back into Germany. This
has created significant difficulties in Central Europe, especially in Poland and Czech Republic,
which have consequently seen their transmission capacity reduced (IEA, 2013). In 2017, the
European Commission pushed for splitting Germany into two price zones (North and South
Germany), but the government objected, because this would have increased electricity prices in
the south. A compromise was reached with a split in price zones along the German-Austrian
border from October 2018 (K. Porter, 2017).
The distribution grid —divided in low (400 V), medium (20 kV) and high (110 kV) voltage— is
operated by 883 DSOs (Bayer et al., 2018). As 98 % of the RES capacity is connected to the
distribution grid, this also requires an upgrade to cope with the increasingly bi-directional flows
from prosumers, e.g. households with PV that both feed in and draw electricity from the grid.
The upgrade includes smart meters, local distribution substations, accurate weather forecasting
equipment and a range of new software to make the grid controllable from afar (Appunn &
Russell, 2018).
Future scenarios
By 2022, Germany’s nuclear power plants will be shut down and other fossil fuel power plants
will also be decommissioned. At the same time the share of renewable electricity will increase.
These changes affect the electrical grid: it is expected that more than 7,500 km of transmission
lines will need to be upgraded or built in the next years. A major role will be played by high-
voltage DC transmission lines, such as SuedLink and SuedOstLink, connecting the north and the
south of the country. The upgrading of the interconnectors to the neighbouring countries is also

CHESTER PROJECT NO. 764042
D6.1: Detailed PESTEL and PORTER analysis of the CHEST system 49
considered important, as it would allow e.g. to connect the hydroelectric reservoir in
Scandinavia and in the Alpine countries to the wind farms and PV fields in Germany (German
Ministry for Economic Affairs and Energy, 2017a). An overview of the existing transmission grid,
the ongoing and planned expansion projects is given in Figure 28. The map was retrieved from
(German Ministry for Economic Affairs and Energy, 2017b) and updated to the status at 15
August 2018, according to the interactive and continuously updated map available on the
website of the Federal Network Agency (German Federal Network Agency, 2018).
Figure 28: Existing transmission grid and future expansions projects.
Driven by the relatively low installed capacity of primary reserves and the new political agenda,
EES projects —in particular in form of batteries— have recently attracted increasing interest.
Some examples are a 48 MW/50 MWh lithium-ion battery installed in Jardelund (the largest
battery in Europe) (Colthorpe, 2018b), a 7.5 MW/2.5 MWh lithium-ion battery combined with a
4.4 MW/20 MWh sodium-sulfur battery in Varel (Buchmann, 2018) and a 22 MW lithium-ion
battery in Cremzow (Colthorpe, 2018a).

CHESTER PROJECT NO. 764042
D6.1: Detailed PESTEL and PORTER analysis of the CHEST system 50
2.3.5. Environmental factors
In 2016, the total GHGs emissions in Germany were 906 Mton of CO2-eq, with the main
contributors being energy sector (38 %), industry (20 %) and transport (18 %) (Figure 29).
Compared to 2006, the total emissions have decreased by 8 %. Carbon dioxide is the main GHG
and represents 88 % of the total CO2-eq emissions (Weiß et al., 2017).
Figure 29: Historical GHGs emission development by sector and future targets.
In the energy sector, almost 80 % of the emissions come from the combustion of coal. Expansion
of RES and promotion of energy efficiency have already caused an estimated 26 % reduction
compared to 1990 (Weiß et al., 2017). Modernisation of the energy and industry sector in former
East Germany gave a key contribution. However, the German power and heat production is still
characterized by a very high CO2 intensity, about 430 g/kWh in 2017 (AGEB, 2018).
Germany’s GDP has increased over time, while the required primary energy consumption and
CO2 emissions have decreased. Consequently, the ratio between CO2 emissions and GDP (PPP)
decreased by 19 % in the period 2005-2015, from 0.35 to 0.28 kgCO2/(2010-€) (IEA, 2018).
2.3.6. Legal factors
As a member of EU, Germany has implemented the relevant directives in the electricity sector.
Accordingly, the legal framework provides for a regulated third-party access system for
transmission and distribution networks. The liberalized electricity market allows industrial and
private consumers to freely choose their electricity provider.
Institutions
The Ministry for Economic Affairs and Energy is responsible for the formulation and
implementation of the energy policy, while market adoption and research in the field of RES are
overseen by the Ministry for the Environment, Nature Conservation and Nuclear Safety. This
Ministry also manages the EEG and is responsible for the environmental regulation that applies
to the energy sector (e.g. regulations on pollution abatement, climate change mitigation,
nuclear safety and radiation protection).
The Federal Network Agency acts as network regulator and aims at facilitating the development
of the market, by liberalization and deregulation (IEA, 2013).

CHESTER PROJECT NO. 764042
D6.1: Detailed PESTEL and PORTER analysis of the CHEST system 51
Revenue cap model for DSOs and TSOs
The Federal Network Agency determines revenue caps for each TSO and DSO, i.e. the maximum
that a network operator can earn from grid fees. The revenue cap is based on a review of each
operator’s costs in a reference year and an efficiency benchmark of all operators, which
determine the efficiency of each operator compared to the most efficient one(s). All operators
must gradually increase their efficiency level during the five-year regulatory period for which
the revenue caps are set. Hence, the network operators are encouraged to outperform their set
targets, so to keep the additional difference between costs and fixed revenues (Scholz & Ante,
2018). To increase the generation of electricity from RES and CHP plants, network operators are
obliged to offer a connection to the grid, unless it is technically impossible or economically
unreasonable. In case of RES installations, the lower voltage level entails that mostly DSOs are
concerned.
Future development of RES capacity
To pace the development of RES installations and give time to the electrical grid to be upgraded
accordingly, the 2017 revision of the EEG limited the RES auction volumes as follows:
• 2,800 MW/year of onshore wind for 2017-2019 and 2,900 MW/year from 2020;
• 600 MW/year of PV systems;
• 150 MW/year of biomass for 2017-2019 and 200 MW/year for 2020-2022;
• auction volumes for offshore wind shall be compatible to reach 6.5 GW by 2020 and 15 GW by 2030;
• 400 MW/year of technology-neutral auctions for onshore wind and solar power together for 2018-2020.
Legislation on power generators and EES
Regarding power generators, there is no energy law-based authorisation required to operate a
plant. The German Energy Act only refers to technical safety regulations set by industry
associations, and the construction of the plant must follow the general construction and
environmental standards.
Regarding the EES, the required type of permit depends on the type of EES. A battery EES
requires a building permit, so it must comply with the relevant planning and building law. Power
to gas/liquid EES usually require a permit under the Emission Control Act. To participate in the
reserve control market, the EES must pass a prequalification procedure carried out by the TSO.
Currently, this is not easy, because of minimum size requirements (1 MW for primary reserve,
5 MW for both secondary and manual reserves (German Ministry for Economic Affairs and
Energy, 2015)) as well as other criteria for the primary frequency response market, which are
also challenging for larger battery storage. According to the EEG 2017, electricity stored in an
EES receive a feed-in premium, when it is fed into the grid. However, EES are treated as
consumers, so the stored electricity is subject to several levies and taxes which are imposed on
the consumption of electricity. Because the final consumer of the electricity fed by an EES pays
the levies and taxes again, the stored electricity is taxed twice (Norton Rose Fulbright, 2017).
However, EES are exempted from paying grid tariffs and EEG surcharge, when the electricity
withdrawn from the network is only re-fed with a delay into the same network, provided that
metering requirements are complied with and subject to limitations if only part of the electricity
is fed back into the public grid (Janzen & Wippich, 2016; Norton Rose Fulbright, 2017). There is

CHESTER PROJECT NO. 764042
D6.1: Detailed PESTEL and PORTER analysis of the CHEST system 52
an ongoing discussion at a political level on how to favour the integration of EES into the
electrical system.
2.3.7. Heating sector – District Heating2
Currently in Germany DH supplies about 5.7 million households, which correspond to about 14 %
of the total number of households. Every year, the number of households supplied by a DH
network increases by about 75,000.
About 83 % of the heat for DH comes from CHP plants. Thermal plants provide about 15 % of
the heat fed into DH networks, while the remaining 2 % comes from industrial waste heat. The
use of RES in DH systems is still rather small. In 2015, the main energy sources for DH systems
were natural gas (36 %), hard coal (34 %), lignite (13 %), biomass (5 %), waste and others (12 %).
The development of DH has been fairly slow in the last two decades. Since 2000, the total length
of DH networks increased by 17 %, from 18,326 km to 21,521 km in 2016, while the installed
heat capacity remained almost constant at around 50,000 MW. In order to achieve the target of
14 % of RES in the heating sector by 2020, incentive payments have been introduced for DH
systems, especially when RESs are used. First, the German Act for the support of RES in the heat
sector includes financial support for solar thermal, biomass, geothermal, TES and DH networks.
Secondly, the German Act for the conservation, modernisation and expansion of combined heat
and power (KWKG) ensures payments for the electricity generated by CHP plants, but it also
supports new and expanded DH networks and TES. The market incentive program (MAP) is
another measure to support RES, but also DH networks and TES. There are different funding
conditions for private applicants, companies and municipalities. Financial support can be in the
form of direct payment of a share of the investment costs or in the form of a loan with reduced
interest rate. Finally, there are also possibilities for support through programs at regional or
municipal level.
2 This section is an extract from deliverable 2.1 of the CHESTER project (Section 2.5.5 – District Heating).

CHESTER PROJECT NO. 764042
D6.1: Detailed PESTEL and PORTER analysis of the CHEST system 53
2.4. Belgium
2.4.1. Political factors
The political framework in Belgium for the energy sector is strongly influenced by the European
Union energy policy objectives. They define many aspects of the political factors, from the
structure of electricity and gas market to long-term renewable energy resources deployment or
the GHG emissions reduction.
As a federal state, composed of three regions (Flanders, Wallonia and Brussels-Capital), the
implementation of these objectives is shared between the federal administration and the
regional administration. Each administration has its own entity responsible for the electricity
market affairs as well as its own electricity market regulator. Besides this, several coordination
entities among regions and federal government exist, which yields a somewhat complex
partition of competences among the different administrative institutions in the country.
The hampering of the energy policy in Belgium by this administrative complexity is shown by the
lack of a common long-term vision for the energy sector in the country. This long-term vision is
in debate since 2003, when the government established the phase-out of nuclear power, which
should be implemented by what is known as the Energy Pact. This pact has been negotiated and
concluded by the four ministers of energy but is not yet enforced.
Although the Energy Pact is not enforced, it incorporates the political agreement to phase out
nuclear power by 2025. This point has been the main driver of the political debate for the
electricity sector, since nuclear power is a fundamental element of the energy system,
accounting for 53 % of the electricity production in 2016. The Energy Pact establishes four lines
to reach its objectives in 2050 from this scenario (Partners, 2018):
• electricity consumption reduction by means of energy efficiency;
• definition of a new energy mix focused on renewable energy;
• flexibilization of the energy vectors and encouraging storage;
• increased transmission flexibility by deployment of further transnational connections.
Besides the political commitment to avoid nuclear power in the electricity mix, the stress that
such measures pose on the security of supply has so far avoided the application of the schedule
to turn off the nuclear reactors as they reach their expected 40 years of technological life. This
schedule appeared in the 2003 law, but it has been reviewed in 2013, when the plan for secure
energy supply (known as the Wathelet plan) was introduced. This plan, besides the commitment
of adding new gas-fired base-load plants, extended the operational lifetime of the Tihange 1
nuclear reactor. The following revision of the schedule in 2015 provided the ten-year extension
of the operating license for the country’s two oldest reactors, Doel 1 and Doel 2 until 2025
(Nucleaire, 2017) (according to a 2013 law, they should have been turned off by 2015).
Given the relevance of the nuclear energy in the national energy mix, these decisions have had
a huge impact on the base-load energy mix. Together with relatively low prices for energy, and
the difficulties in establishing a long-term energy vision by the political sector, generates an
uncertainty that has hampered the investments in new base-load capacity by the stakeholders
during the Eurozone crisis period. This resulted in recent years in the system’s inability to supply
the required capacity under winter peak demands, which forced the government to establish a

CHESTER PROJECT NO. 764042
D6.1: Detailed PESTEL and PORTER analysis of the CHEST system 54
mechanism of reserve capacity to ensure the electricity supply. This reserve relies technically on
two mechanisms; on one side it maintains in operation some out-of-date thermal power plants
(the state finances maintaining them in reserve), and on the other side, a peak demand
management system, by the aggregation of voluntary flexible consumers, who can offer a
limitation of their demands as a network service, in exchange of economic revenues. The TSO
Elia is responsible for operating the reserve capacity. In November 2018, an electric energy
storage system of 18 MW based on electrical batteries has been added to the Reserve Capacity
pool. Elia also operates this system.
2.4.2. Economic factors
General economic situation
After having contracted in 2013, the Belgian GDP grew by 1.3 %-1.4 % in the period 2014-2016
(EU data). However, the growth remains modest, partly as a result of the remaining structural
challenges, high labour costs, a low labour force participation rate and high-income tax. The
public deficit reached 3 % of GDP in 2016, while the debt ratio is expected to stand at 107 % of
GDP in 2017. Belgium has notably established a wage freeze and a reduction of employers’ social
contributions. The Government has also adopted a labour market reform in the attempt to
moderate the high cost of the labour force (Market Research Reports, 2017).
Energy-related industry
The liberalisation of the Belgian electricity market was completed in 2007. The only TSO operator
is a nationally held company, Elia. The electricity sector is strongly concentrated, with Electrabel,
the historical national supplier of Belgium, holding 66 % of the country’s installed capacity,
including most of the nuclear capacity. However, its dominant position is slowly declining, as in
2007 it controlled 85 % of the country’s capacity. Electrabel is a subsidiary of Engie (former GDF).
Luminus, a subsidiary of EDF, holds 12 % of the total capacity and E.On is the third biggest actor
with 7 % of the total capacity. Overall, these three transnational companies control 85 % of the
country’s capacity, as well as 91 % of the energy production in 2014 (Technopolis Group, 2016).
The renewable energy sector has benefited in recent years from the favourable scenario
motivated by the long-term objectives of Belgium within the European policy. The recent years
have seen a huge increase in investments in renewable energy capacity, with a total increase of
229 % of the electricity capacity installed from 2005 to 2014 (IEA, 2016a). The current context
of the electricity system and the legal factors ensures that the growth is going to extend in the
coming years: according to the European project Repap2020, it is estimated that to meet the
efficiency and renewable energy objectives of Belgium, the investment associated with new
renewable electricity capacity should reach 3.3 G€ in 2020, and an additional 956 M€ are
necessary for thermal renewable capacity (Edora, 2010).
Energy taxation
Energy and carbon taxes in Belgium are levied within the framework of the 2003 EU Energy Tax Directive, which sets minimum rates for the taxation of energy products in member states (OECD, 2018a). Within this framework, the main taxes on energy use in Belgium are the following:
• An energy tax applies to oil products, natural gas, coal and coke consumption, including fuel oil and coal and coke used for electricity generation;
• Electricity output is taxed (per MWh).

CHESTER PROJECT NO. 764042
D6.1: Detailed PESTEL and PORTER analysis of the CHEST system 55
Besides, Belgium participates in the European Union emissions trading system (ETS). The rates at which these taxes apply differ for fuels and users, with the transport sector being the one with a highest rate of taxation. For the electricity sector, the taxation has seen a notable increase in the share of the electricity
costs for final users in all consumption bands. This is due to an increase in the electricity VAT
from 6 % to 21 % in 2015, but also to the supporting mechanisms for PV systems. In 2016, the
share of taxes on the electricity prices for domestic users was 33.9 % of the average cost; that
was 27.44 c€/kWh (Figure 30).
Figure 30: Electricity price evolution in Belgium (Federal Public Service Economy, 2017).
Subsidies for renewable energy sources
In Belgium, renewable electricity is promoted by means of a quota system together with a green
certificate system; the electricity suppliers have to reach a certain quota of renewable energy in
their production mix, and if not able to do so, they must buy green certificates in the market to
cover their mandatory quota. The green certificate itself is a transferable asset that demonstrate
a certain energy saving by the owner, who always has the right to sell it to the DSO at a minimum
guaranteed price (KPMG, 2015).
The green certificate values granted to renewable electricity production are updated annually
to incorporate the constantly reducing costs and are set specifically considering specific internal
rate of return (IRR) objectives for the investor. Since the promotion of renewable energy is in
the competency of the regional authorities, three different systems are in place (one for each
region). Each region establishes the quotas applicable in their territory and runs its own
certificate market.
The targeted return on investment differs by region and technology, as shown in Figure 31. In the Flemish region, the system aims at a guaranteed return on investment of 5 % for solar, 8 % for wind and 12 % for biomass and biogas. In the Walloon region, the targeted rates are 7 % for solar, wind and hydro, 8 % for less than 1.5 MW biomass and 9 % for 1.5 MW or more biogas and biomass. In the Brussels-Capital region, a payback time of seven years (roughly equalling a return of 10 % per year) is targeted. In Flanders, the system of green certificates has been

CHESTER PROJECT NO. 764042
D6.1: Detailed PESTEL and PORTER analysis of the CHEST system 56
discontinued for installations of less than 10 kWp and certified after June 2015. Net metering, otherwise, has been guaranteed for the next 25 years for the newer installations. For offshore wind power, which is in the competency of the federal authorities, the certificates
generated are not tradable, but the TSO has an obligation to purchase green certificates from
the producers at a minimum price set by the legislation, which is renewed every three years.
This operates in practice as a feed-in-tariff mechanism.
Figure 31: Summary of green certificate systems operating in Belgium (IEA, 2016a).
Import and export of electricity
Belgium is part of the Central Western European region, and is well interconnected with France,
the Netherlands and Luxembourg. The flow of electricity between countries is set by specific
cross-border market mechanisms, but it is limited by the available interconnections. This cross-
border market mechanism establishes the rules to allocate the available interconnection power
capacity to electricity producers in order to allow them to participate in a neighbour market
(either day-ahead or intraday). They are specific for each interconnection; for instance, the
France-Belgium interconnection has an explicit allocation procedure, where capacity is allocated
on an hourly basis in a “first come, first served” model, while the Netherlands-Belgium
connection is factored within a common day-ahead market for both countries. Current
interconnection capacity is 3500 MW, of which 2100 MW are connections with France (IEA,
2016a).
The cross-border capacity has increased in the last years, due to its central position within the
European Energy Policy. Belgium, which has seen supply problems with their generation capacity
(nuclear power) in the last years, has a special interest in promoting the deployment of new
interconnections. Currently, there are five new connections under development with France,
UK, Germany, the Netherlands and Luxembourg, with a total capacity of 4700 MW. All should
be commissioned between 2018 and 2023 (IEA, 2016a).
This cross-border capacity has been fundamental for ensuring the supply of the Belgian electrical grid. This was especially true in 2015, when unplanned incidents in two nuclear power plants drastically reduced the available capacity in the country. This scenario repeated itself in 2018, because of unplanned maintenance requirements to two nuclear reactors. Only one out of seven existing reactors was in operation in November 2018, and the market price evolved with abnormally high prices during autumn 2018 (Figure 31).

CHESTER PROJECT NO. 764042
D6.1: Detailed PESTEL and PORTER analysis of the CHEST system 57
Figure 32: Electricity market price in Belgium in 2018.
Import capacity is restricted because a part of the German electricity transported from north to south Germany is rerouted via the Netherlands and Belgium, thus occupying a large part of the available interconnection capacity.
Figure 33 shows the evolution of generation, load and imports for the electrical grid in the period
2007-2016; as can be seen, imports of electricity represented 26 % of the total load in 2015,
when the availability of the nuclear capacity in the country was scarce. The high weight of
specific reactors over the total national capacity implies that when they —due to technical
reasons— are temporarily unavailable, the security of supply is compromised. This situation
could worsen as the nuclear plants age. The electricity imports have been reliable, avoiding
problems from the reduced available capacity, and are now seen as a fundamental component
in the energy mix while the nuclear phase-out takes place.
Figure 33: Generation and imports in the Elia electrical grid 2007-2016 (CREG, 2017).

CHESTER PROJECT NO. 764042
D6.1: Detailed PESTEL and PORTER analysis of the CHEST system 58
Wholesale market
The Belgian electricity spot market is part of EPEX, which includes France, the Netherlands,
Luxembourg and Germany. It is composed of a day-ahead market and an intraday market. This
market, Belpex NV, is coupled with most of Europe by the multi-regional market developed at
the European level.
Although the Central Western Europe (CWE) market is in concept a price-coupled area, the
prices show significant differences among the countries involved due to a limited
interconnection capacity. Belgium is consistently in the upper end of the CWE region: in 2014,
the average day-ahead market price in Belgium was 40.79 €/MWh, while other countries of the
CWE region such as France or Germany had 34.67 €/MWh and 32.78 €/MWh respectively (IEA,
2016a).
2.4.3. Social factors
Climate and energy are two topics very present in the public debate. Two interrelated topics, in
particular, have been the object of public debate: the phase-out of the nuclear power and the
security of supply. The current nuclear phase-out schedule, which has been repeatedly updated
to capacity shortages, is a frequent debate in the media, as well as the potential electricity black-
out consequence of the capacity shortage. Although the energy sources are not a main concern
of the citizens, in comparison to the energy price and the security of supply, there is a message
carried by cooperatives, civil society associations and other alternative actors in favour of a new
way to control the economy. This message has an influence on the public opinion and pushes in
favour of renewable energies. This is reflected in the public consultation organised in 2017 as a
support tool recovering the ambitions of the citizens in regard to the National Energy Pact.
Among the topics to be addressed by the pact, according to the citizen voting, three are the
most repeated: nuclear phase-out, price and affordability of energy and renewable energy.
Regarding the technologies to be considered in the energy mix, more than 85 % of the votes
were in favour of renewable energy sources, and the second most voted source was storage and
flexibility, with 40 % of participants including it in the mix. Nuclear power was a valid option only
for 25 % of the voters, and fossil fuels stood even worse, with 23 % of the votes (Concere, 2017).
As an indication of the public’s willingness to invest in renewable energy, it is worth noting that
by the end of 2017, there were 453,000 small PV systems online, out of a total 4,828,000
households in Belgium. In other words, nearly one out of 10 homes in Belgium owns a PV system
(Maisch, 2018).
2.4.4. Technological factors
Current situation
The backbone of the country’s installed capacity relies on 7 units in two nuclear plants (Doel and
Tihange), that together have almost 6,000 MW, roughly 30 % of the national capacity. Fossil-fuel
plants with different technologies, mostly burning natural gas, account for another 35 %, and
the rest is shared mainly by solar PV and wind energy.
Belgium’s electricity generation was 71.5 TWh in 2014, 13 % less than in 2013. The peak
generation in 2010 reached 93.8 TWh and has been falling since. From 2010 to 2014, electricity
generation fell by 24 %, primarily because of long and extensive outages at the country’s nuclear
power plants; the cross-border electricity imports have covered the missing national generation.

CHESTER PROJECT NO. 764042
D6.1: Detailed PESTEL and PORTER analysis of the CHEST system 59
In 2014, nuclear power as the primary source (Figure 34) of electricity in Belgium accounted for
47 % of total generation (its share was stable during the 2000s at around 55 %). Since 2011, the
share has fallen from 54 % to 47 %, as the total nuclear power generation declined by 30 % over
the same period because of the long outages. Natural gas accounted for 27 % of the total
generation in 2014 (19.3 TWh). Electricity produced using natural gas grew for decades to peak
at 31.4 TWh in 2010 (33.5 % of the total) (IEA, 2016a). Since then, gas use in electricity
generation has fallen by 39 %, as imports from cheaper sources and wind and solar power have
gained ground. RESs represent 19 % of the electricity production, made up of biofuels and waste
(7.9 %), wind (6.5 %), solar (4 %) and hydropower (0.4 %). The share of RES in generation was
2.9 % in 2004. On average, biofuels and waste grew by 11 % per annum over ten years. Driven
by subsidies and starting from a low absolute level, solar grew by 122 % per year and wind by
42 % (IEA, 2016a).
Figure 34:Gross electricity generation by source, 1990-2015 (IEA, 2018).
By October 2018, according to TSO Elia up-to-date numbers, nuclear installed capacity reduced
to 40 %, while wind energy capacity reached a new 8.7 % level of total generating capacity.
Electrical grid
The Belgian high-voltage electricity network is owned and operated by the TSO Elia. In 2015, the
transmission system had a total length of 3,655 km, of which 891 km operate at 380 kV, 302 km
at 220 kV and 2,462 km at 150 kV. Elia is 45 % owned by Publi T, a company representing Belgian
municipalities and inter-municipal companies, 2.5 % is owned by Publipart, while the rest is free
floating on the Brussels stock exchange (IEA, 2016a).
The investments planned by Elia for voltages over 70 kV are set in the Federal Development Plan
2015-2025. Investments for 70 kV or less voltage are set in regional investment plans. Elia
estimates that its investment needs will total more than 2 G€ for the next decade (IEA, 2016a).
Investments focus on interconnections with neighbouring countries and on grid upgrades,
necessary to connect decentralised and renewable generation. Finally, substantial replacement
investments must also be made in order to address grid ageing. Transmission tariffs are collected
from grid users to finance these investments. The tariffs are set by CREG (Commission for
Regulation of Electricity and Gas, the national energy regulator) and they also include costs of
public service obligations, such as reduced rates for low-income consumers (IEA, 2016a).
Future scenarios
The long-term goal for 2050 is a 100 % renewable energy supply, but there is a shorter-term goal
for 2025 in which all the nuclear energy in the country should be phased out. In the short term,
a key role will be played by the development of interconnectors, to ensure supply, but this will

CHESTER PROJECT NO. 764042
D6.1: Detailed PESTEL and PORTER analysis of the CHEST system 60
not be enough and new investments in natural gas plants must be activated to compensate the
phase-out of nuclear power. It is likely to be difficult for the country to keep the path of emission
reductions while substituting nuclear power by natural gas power plants.
Due to the favourable legal conditions, renewable energy deployment shall proceed at a good
rate, as has been the case in the last years, reaching a 40 % share of the electricity mix by 2040
and 100 % in 2050. Other measures, such as demand side management and storage, should
achieve installed capacities of 1.5 GW and 3.5 GW respectively by 2030.
An important element to consider are the mobility policies, in particular the plan to extensively
deploy electric vehicles to reduce transport related emissions. According to CREG, (CREG, 2017),
a massive deployment of electric vehicles (1 million as mentioned in the report) will not decrease
the security of supply on the condition that electric cars are charged in due time (off-peak hours).
In addition, a 100,000-electric vehicle deployment should add more than 50 % of the actual
storage capacity. Considering that nowadays there are 5.6 million vehicles in Belgium and only
4,368 are electric, this is not a short-term problem.
2.4.5. Environmental factors
Belgium’s GHG targets are derived from the European Union’s 2020 targets. Because of the
effort-sharing of the Union’s target for reducing GHG emissions by 20 % from 2005 to 2020, the
country will have to reduce emissions from the sectors outside the Emissions Trading Scheme
(ETS) by 15 % (by 2020 compared with 2005). For this, it can use international flexibility
mechanisms, also known as Kyoto Mechanisms, which include Clean Development Mechanisms,
Joint Implementation and Emissions Trading (UNFCCC, n.d.), to cover an amount equalling 1 %
of its total GHG emissions in 2005. The sectors covered by the ETS in the European Union as a
whole will have to cut emissions by 21 % below 2005 levels by 2020 (IEA, 2016a).
Energy-related CO2 emissions (Figure 35) from fuel combustion were 89.1 Mton in 2013, which
was 16 % lower than the 106.2 Mton in 1990 and 24 % lower than the 117 Mton in 1996.
Compared to 2003, CO2 emissions declined by 21 %. The sector emitting the highest volumes of
CO2 in Belgium is transportation, representing 27 % of the total. Power generation accounts for
20 % and households for 20 %, while manufacturing industries and construction together emit
15.5 %. The commercial and public services sectors (including agriculture, forestry and fishing)
emit 10.5 % of the total and other energy industries (including refining) account for the
remaining 6.3 % (IEA, 2016a). The decline in overall carbon emissions since 1990 is mainly due
to a reduction of emissions in the power sector (25.9 Mton to 18.1 Mton, a decrease of 30 %)
and in the manufacturing and construction sector (28.1 Mton to 13.8 Mton, a decrease of
50.8 %). Both sectors have experienced some volatility in emissions over the 1990-2013 period
because of variations in output. The share of power generation in total emissions has fallen by
24.4 % compared to 1990, while that of the industry sector has fallen by 26.5 % (IEA, 2016a).

CHESTER PROJECT NO. 764042
D6.1: Detailed PESTEL and PORTER analysis of the CHEST system 61
Figure 35: CO2 emissions by sector.
2.4.6. Legal factors
European dimension
The EU regulatory framework influence has shaped the national legal framework decisively.
Some of the most relevant examples are:
• The Directive on Energy Markets established the liberalisation of the energy markets, and functional independence among generation, distribution and supply activities. The first directive was transposed in the Energy Act of 1999 and has been amended often to incorporate new requisites set at European level. This defined the structure of the current Belgian electricity market.
• The development of an Internal Electricity Market for Europe has a political priority. This has established the mechanisms to operate interconnected network systems and, in particular, a common wholesale electricity market. Also, it opened the possibility to incorporate the national system cross-border power capacity, strongly affecting energy mix and prices.
• The EU objectives related to carbon emissions abatement state that the contribution of renewable energy to the energy mix in Belgium must reach 13 % of the total primary energy consumption. Since 2010, the National Renewable Energy Plan 2011-2020 defines the policies and measures to meet this objective.
National dimension
The federal regulator of the energy sector, the CREG (Commission for Regulation of Electricity
and Gas) was responsible of establishing tariffs at the national level until 2014. Afterwards it
transferred this responsibility to the federal regulators (Brugel in the Brussels region, CWaPE in
Wallonia, and VREG in Flanders). The federal regulators are also responsible for maintaining
transparency and competitiveness in their respective retail markets, while the national regulator
monitors the wholesale market at national level.
The TSO Elia is responsible for operating and maintaining the high voltage network (over 70 kV),
under supervision of the CREG, who establishes transmission taxes and exemptions. DSOs
operate and maintain the network under 70 kV, with supervision of the competent regional
regulators. Each regulator is responsible for establishing the distribution tariffs within its
territory and these are used to cover any system expenses, such as the financing of regional
renewable energy policies, tax exemption for protected customers, distribution charges, etc.
Elia as the TSO is allowed by the Electricity Act to operate electrical storage devices, as long as

CHESTER PROJECT NO. 764042
D6.1: Detailed PESTEL and PORTER analysis of the CHEST system 62
it does not prevent the competitive operation of the market. In 2018, a battery storage system
with 18 MW was deployed in Terhills, and it will be operated by Elia as part of the Reserve
Capacity system.
2.4.7. Heating sector
Natural gas as a primary source dominates the heating sector in Belgium. There is a trend for
expanding the gas distribution network and the progressive replacement of oil boilers. An
important issue is the reliance on the low-calorific gas (L-gas) from the depleting Groningen field
in the Netherlands. Consequently, there is a need to shift to high-calorific gas because the L-gas
network will be phased out by 2029. This problem could become an opportunity for RES at a
local level.
In the Brussels region, the share of natural gas in space heating of buildings rose from 65 % in
2001 to 72 % in 2012. Similarly, for the Wallonia region there was an increase of 25 % in the
number of residential gas customers from 2011 to 2015 (IEA, 2016a).
The district heating sector is poorly developed in Belgium, which is surprising since both the
climatic conditions and the high population density (among the highest in Europe) seem to
favour the deployment of the technology.
However, many support policies for renewable heat promotion —which considers also district
heating— exist at the regional level, as local authorities hold the competencies for renewable
heat policies. For instance, in the Flemish region, there have been direct subsidies for investment
in renewable heat projects since 2013, with special interest in projects promoting integration of
renewable or waste heat into district heating networks. Additionally, in this same region, since
2014, there has been an obligation for new buildings to incorporate a share of renewable energy
capacity. Each year the share of renewable energy for new buildings is increased in order to
reach, by the end of 2020, the NZEB obligation. Among the eligible technologies for new
buildings to fulfil the share of renewable energy mentioned before there appears, among others,
a district heating connection (IEA, 2016a).

CHESTER PROJECT NO. 764042
D6.1: Detailed PESTEL and PORTER analysis of the CHEST system 63
2.5. The Netherlands
2.5.1. Political factors
The Netherlands has had a varied history with respect to energy policy. At times, it has been a
frontrunner in sustainable development, while at other times it has seen this leading position
disappear. An important factor has been the very large natural gas resources which, starting in
the 1960s, have had a great impact on both the Dutch energy infrastructure and the Dutch
economy. Figure 36 shows that gas revenues have constituted a very significant part of
government revenues since the 1960s.
Figure 36: Natural gas in the Netherlands.
The abundance of natural gas has had a dampening effect on large scale investments in
renewable energy and energy efficiency. This is evidenced by Figure 37, which shows that the
Netherlands have been lagging behind most of the EU’s countries in terms of renewable energy
consumption.
More focus was given to these topics starting from around 2000 with various subsidy
programmes. However, the policies did not always match the market development and
sometimes were prematurely withdrawn.
Figure 37: Evolution of percentage share of renewables in the Netherlands.
0
2
4
6
8
10
12
0
20
40
60
80
100
120
19
60
19
62
19
64
19
66
19
68
19
70
19
72
19
74
19
76
19
78
19
80
19
82
19
84
19
86
19
88
19
90
19
92
19
94
19
96
19
98
20
00
20
02
20
04
20
06
20
08
20
10
20
12
20
14
Natural gas production (Gm3) % share of government revenue

CHESTER PROJECT NO. 764042
D6.1: Detailed PESTEL and PORTER analysis of the CHEST system 64
From the 2010s onward, a more consistent policy was put in place with respect to climate and
energy. In 2011, a climate agenda for municipalities and provinces was published. In 2013, the
publication of the Energy Accord for Sustainable Growth set a 16 % target for renewables by
2023 as well as the Climate Agenda with a 40 % CO2-emission reduction target by 2030. The
Netherlands were part of the Paris accord in 2015 and updated their CO2-targets with an 80-
95 % reduction target by 2050. In 2017, the energy intensive industry agreed on a 9 PJ reduction
by 2020. In 2018, a ban on coal-powered electricity production by 2030 was put in place, with
the aim for the two oldest plants to close by 2025.
During the run-up to national elections in 2017, sustainability was a topic of low importance.
However, the winning Green Party expressed a great focus on sustainability unlike the other
parties, such as the Liberal party. The government currently consists of the Liberal party (VVD),
the Christian-democrat party (CDA), the Centre-democrat party (D66) and the Christian-social
party (ChristenUnie).
Following the elections in 2018, both a climate law and a climate accord were drafted. The
former concretises mid- to long-term climate policy, while the latter attaches concrete
measures, targets and obligations (Van 't Lam en Vos 2018). At the time of writing, both
documents have not yet been finalised, however, certain pertinent aspects can already be
ascertained:
• CO2 reduction: 49 % CO2 emissions reduction target by 2030;
• Renewable electricity: five-fold increase by 2030: from 17 to 84 TWh, with 49 TWh covered by offshore wind and the remainder by onshore renewables like wind and solar;
• Cost and pricing: the goal is to eliminate subsidies after 2025 and to implement robust CO2 pricing. Expected major shift in energy taxation: 75 % increase for natural gas, 50 % reduction for electricity, to stimulate electrification;
• Industry: focus on electrification, hydrogen and carbon capture, utilisation and storage;
• Flexibility and integration: focus on demand control, storage, international interconnection, power-to-heat and power-to-X and hydrogen;
• Participation and public support: tailored regional strategies and focus on efficient use of space.
2.5.2. Economic factors
General economic situation
Gross Domestic Product (GDP) in the Netherlands grew by 3.2 % in 2017 and is expected to grow
by 3.0 % and 2.6 % in 2018 and 2019, mainly driven by domestic demand. The current economic
boom is attributed to the favourable international economic situation, low interest rates,
expansive government policy and a strong housing market. Consumer spending is up by 2.2 %;
the unemployment rate was 4.9 % in 2017 and is expected to go down to 3.5 % in 2019 (it was
7.4 % in 2014). Wages went up by 1.9 % in 2017 and are expected to increase by 2.7% and 3.3%
in 2018 and 2019. Export growth was 6.1 % in 2017, resulting in a trade surplus of more than
10 % of GDP.
Companies have seen record profits. The sector that has seen greatest growth is professional
services with 5.7 %. The construction and trade sectors also performed well, both with 5.6 %
growth. Industry has grown by 4.4 %, mainly driven by the production of machinery, equipment

CHESTER PROJECT NO. 764042
D6.1: Detailed PESTEL and PORTER analysis of the CHEST system 65
and transportation and by the chemical industry. Mining has decreased significantly, mainly due
to tightened production limits on natural gas. Bankruptcies were at the lowest point since 2001.
The Government budget had a surplus of 1.1 % of GDP in 2017. It has met the European norm
of at most a 3 % deficit since 2013. In 2017, Government’s debt has dropped below the European
60 % norm for the first time since 2010 due to a record decrease of 18 G€.
Energy related industry
The conventional energy sector in the Netherlands employs around 170,000 FTE (Full-Time
Employee). Of these, the renewable energy sector employs 52,000 FTE, or 0.7 % of the total
employment in the Netherlands. The benefit to the economy of this sector is 0.8 %, which shows
that the sector is relatively labour extensive. The large majority (94 %) of these jobs are due to
investments, 57 % of which are in energy efficiency activities. The remaining 6 % are due to
energy exploitation activities. The solar and wind sectors represent 13,000 FTE (both
exploitation and jobs from investments)(CBS, n.d.).
The contribution of various aspects of the energy sector to the Dutch economy is presented in
Figure 38. As can be seen, the Netherlands is a net importer of energy. Production is very
significant, which is mostly due to natural gas production. The contribution of energy related
activities to the Dutch economy, shown Figure 39, is going down strongly in recent years,
primarily due to the reduced natural gas production and a stronger focus on RE/EE. This is also
reflected in Figure 40, which shows that investments in conventional energy are declining
significantly, whereas investments in RE, EE and infrastructure are increasing.
Figure 38: contribution of energy related activities to the Dutch economy for various indicators in 2016. “Invoer” = import; “uitvoer” = export; “investeringen” = investments; “productie” = production; “toegevoegde waarde” = added value; “werkgelegenheid (vte)” = employment (FTE).

CHESTER PROJECT NO. 764042
D6.1: Detailed PESTEL and PORTER analysis of the CHEST system 66
Figure 39: Contribution of various energy related activities to the Dutch GDP (“Energiebesparing” = energy savings/efficiency; “hernieuwbare energie” = renewable energy; “netwerken” = networks; “conventionele energie” = conventional energy).
Figure 40: investments in energy related areas (“Energiebesparing” = energy savings/efficiency; “hernieuwbare energie” = renewable energy; “netwerken” = networks; “conventionele energie” = conventional energy).
Energy taxation
Dutch energy taxes fall under the umbrella of environmental taxes, which cover also areas like
tap water and waste (Table 2). Taxes vary by energy carrier (e.g. electricity or natural gas) and
are tiered based on consumption. There are two main components to energy taxes:
• Regular tax
• Opslag Duurzame Energy (ODE - surcharge renewable energy)
The latter is used to stimulate renewable energy investments. The SDE+ program (see below) is
funded from the revenues of this tax. 21 % VAT is charged over the total amount the end user
pays, i.e. the sum of energy price and taxes. The rates for 2018 are given below. Several refunds
or lower tariffs exist for e.g. energy intensive industry and horticulture. In addition, several
exemptions exist, e.g. to industrial parties whose electricity is completely produced from
renewable sources (PwC, 2017).
A CO2 tax is topic of discussion, but currently only the ETS as a direct CO2 instrument is applied.

CHESTER PROJECT NO. 764042
D6.1: Detailed PESTEL and PORTER analysis of the CHEST system 67
Table 2: Taxation on energy in the Netherlands.
Natural gas
Consumption [m3]
0-5,000 5,001-170,000
170,001-1,000,000
1,000,001-10,000,000
10,000,000+ (private)
10,000,000+ (commercial)
Regular tax per m3
€ 0,26001 € 0,26001 € 0,06464 € 0,02355 € 0,01265 € 0,01265
ODE per m3 € 0,0285 € 0,0285 € 0,0106 € 0,0039 € 0,0021 € 0,0021
Electricity
Consumption kWh
0-10,000 10,001-50,000
50,001-10,000,000
10,000,000+ (private)
10,000,000+ (commercial)
Regular tax per kWh
€ 0,10458 € 0,05274 € 0,01404 € 0,00116 € 0,00057
ODE per kWh € 0,013200 € 0,018000 € 0,004800 € 0,000194 € 0,000194
Subsidies for renewable energy sources
The main instrument the government uses to stimulate renewable energy investments is the
Stimuleringsregeling Duurzame Energieproductie, or SDE+. This subsidy program provides a
semi-annual budget for investment projects. The subsidy is awarded to parties with the smallest
claim on a long-term feed-in tariff. This way, scale and innovation are awarded because these
are expected to drive down the kWh-price.
Different renewable technologies compete for the same budget. Some technologies are more
“expensive” for the subsidy provider, i.e. in terms of the claim that is expected to compensate
for the unprofitable portion of an investment. To still allow the more expensive technologies
like photovoltaics or geothermal to also have a chance of receiving a subsidy, the claim per kWh
is capped for the “cheaper” technologies through a tiered application system. In some years this
has resulted in significant subsidies for e.g. photovoltaic projects, whereas in other years the
budget was fully claimed by the cheaper technologies like biomass and wind.
The actual subsidy per year is corrected for changes in market energy prices. The subsidy is
granted for a period of 12-15 years, depending on the technology.
In 2017, the SDE+ budget consisted of 12 G€ divided in two rounds and it was fully claimed. In
2018, the spring round of 6 G€ was not fully exhausted. This was thought to be caused mainly
by a decrease in large-scale biomass and wind projects. The budget for the fall round of 2018 is
again expected to not be fully claimed.
The Energy Investment Credit (EIA, Energie Investerings Aftrek) is a fiscal incentive available to
companies in the form of a tax credit on a wide range of RES/EE investments. A percentage of
the investment amount may be subtracted from the company’s profit, resulting in lower taxes
paid. In 2018, this percentage was 54.5 %. At a corporation tax rate of 25 %, the net benefit in
avoided taxes is 54.5 % x 25 % = 13.6 % of the total investment.
Innovation subsidies are available for a wide range of RE/EE topics such as offshore wind,
geothermal, hydrogen, urban environment, CCUS (Carbon Capture, Use and Storage), green gas
and energy in industry, covering the topics of the TKI’s (see above) and adjacent areas of
interest. Subsidies are available for collaboration projects for R&D, pilot and demonstration and
vary between €50 thousand and €6 million. Figure 41 shows the total amount of subsidies for
energy related R&D in the Netherlands by theme.

CHESTER PROJECT NO. 764042
D6.1: Detailed PESTEL and PORTER analysis of the CHEST system 68
Figure 41: Energy related R&D subsidies by theme. Dutch terms, clockwise from top left: “waterstof- en brandstofcellen” = hydrogen and fuel cells; “technieken opwekking en opslag” = techniques for storage and generation; “overig energie-onderzoek” = other energy research; “energiebesparing” = energy saving/efficiency; “fossiele brandstoffen” = fossil fuels; “duurzame energiebronnen” = renewable energy sources; “kernenergy” = nuclear energy. Center: “totale investering” = total investment.
Import and export of electricity
The Dutch energy market is strongly integrated with the North-western European market. The
Netherlands is therefore in large part dependent on developments in neighbouring countries in
areas like renewable energy production (capacity), import/export, and electricity prices. Both
energy prices and investments are tightly connected with the developments in neighbouring
countries. Current and projected interconnections are shown in Figure 42. The Netherlands is a
net importer of electricity, as is shown in Figure 43.
Figure 42: Current (“huidig”) and projected international interconnection capacity in MW.

CHESTER PROJECT NO. 764042
D6.1: Detailed PESTEL and PORTER analysis of the CHEST system 69
Figure 43: Electricity import vs export in the Netherlands in recent years (source: CBS).
Wholesale market
The Netherlands has an energy-only market of electricity. Proponents of a capacity market are
becoming more numerous, but this has not yet materialised. Steps in that direction are being
taken through aggregators, but a formal capacity market has not been established.
Figure 44: Dutch electricity markets as a function of the time between trade and use.
Electricity is traded on several platforms (OTC – month/quarter/year, APX – day-ahead,
intraday). In 2018, the use of the European Cross Border Intraday (XBID) platform was
greenlighted. Figure 44 shows the different electricity markets.
2.5.3. Social factors
Employment
Employment in the conventional energy sector has decreased significantly in recent years, from
83,000 FTE in 2014 to 73,000 in 2016. The decrease is mainly caused by lower investment
activities in the oil and gas industry. In the same period, the number of jobs in renewable energy
related fields grew from 46,000 FTE to 52,000. This increase is expected to continue due to
continuously increasing demand. Job growth is expected mainly in the construction and
installation sectors, which is seeing rapidly increasing shortages of skilled workers. A shortage
of 15,000 workers is expected in the near future. Industry associations are starting initiatives to
attract and train new employees. DSOs are also experiencing shortages of workers.
Another issue is the fact that relatively many employees involved in the energy transition are
over 45 years old and that relatively few educational programs specifically targeting the energy
transition exist. The sector is heavily tilted toward a male workforce.
-30000
-20000
-10000
0
10000
20000
30000
40000
2010 2011 2012 2013 2014 2015 2016 2017
Elec
tric
ity
[GW
h/y
ear]
import export

CHESTER PROJECT NO. 764042
D6.1: Detailed PESTEL and PORTER analysis of the CHEST system 70
General expectations as to needed skills and knowledge are that the average required education
level will go up and that work will get more highly specialized. This also changes the nature of
collaboration, which in turn will increase the importance of social innovation within
organisations (Sociaal Economische Raad, 2018).
Public support and perception
Public support for the energy transition is largely positive, with 75 % of the population in favour
of supporting renewables and only 2 % against. The majority expects developments to result in
larger energy independence and an improved and more competitive economic position.
The Dutch population in 2015 overestimated the progress being made in the transition. They
estimate that 50 % of energy came from fossil fuels (actually 90 %) and that more than a third
was renewable (actually 6 %). This overestimation may weaken the sense of urgency and pose
an obstacle toward reaching sustainability targets.
Only a minority think the attention for sustainability is overblown. The wish for an increase in
the share of renewables is prevalent, although only 20 % put energy in their top-5 of most
pressing societal problems (Motivaction, 2016).
An important aspect of generating public support is ensuring the burdens and benefits are
shared equally. A 2017 study identifies several topics which may cause division among varying
groups in society along dimensions of income, employment, geographical location and mobility
(ECN, 2017). Some examples:
• Investments in solar energy are quite profitable, but low-income households generally are unlikely to invest.
• The forced abolishment of natural gas disproportionally affects poor home owners who generally live in lower-quality homes and cannot invest in alternative RE/EE measures.
• Large scale solar and wind parks are most feasible in areas with low urbanisation, disproportionally impacting the living environment in rural areas.
2.5.4. Technological factors
Current situation
The Dutch energy system is characterized by a high reliance on fossil fuels, mainly natural gas
and coal. Renewable energy represented 6 % of total energy consumption. An overview of the
Dutch energy system in terms of import, export, production, conversion and consumption is
provided in Figure 45. A translation table for the Dutch terms is included.
Electrical grid
The Netherlands has one TSO (TenneT) responsible for the high voltage infrastructure, which
consists of transmission lines at various voltages (380, 220, 150 and 110 kV) and connections
between these (Figure 46). In addition, TenneT is responsible for correcting for imbalance on
the national level by buying or selling energy on the “imbalance market”. The transmission net
consists of around 20,000 km of circuit, 443 substations, 36 million end users and 67 GW of
installed capacity. TenneT aims to make the Netherlands one of the central hubs for the
Northwestern European electricity system. This involves significant upgrades to international
connections to the UK, Norway and Denmark.

CHESTER PROJECT NO. 764042
D6.1: Detailed PESTEL and PORTER analysis of the CHEST system 71
The distribution network is operated by 8 DSOs, connected to the transport network at the
substation level. These are responsible for the low voltage distribution infrastructure and the
connections to the end users. By law, these are prohibited from performing supply activities (see
2.5.6). This role is provided by energy suppliers who trade energy over the distribution grid,
irrespective of geographical location.
The Dutch grid provides a high degree of electricity security with a large surplus of generating
capacity with reserve margins of over 40%. This is in part due to the small share of (intermittent)
renewable production, which means that even under the most ambitious medium-term
renewable expansion, margins are still expected to be more than sufficient. However, this is not
taking into account the possible premature closing of gas or coal fired power plants due to
reduced gas production, changing political climate and public perception (IEA, 2014).
Figure 45: Sankey diagram of the Dutch energy system with translation table for Dutch terms. Size of energy streams is indicated by the numbers (PJ) as well as the width of the bands.
Winning Generation
Invoer Import
Uitvoer Export
Verbruik Consumption
Ruwe aardolie Crude oil
Aardgas Natural gas
Kernenergie Nuclear energy
Hernieuwbaar Renewable
Afval en overig Waste and other
Elektriciteit Electricity
Steenkool Coal
Aardolieproducten Oil products
Bunkers Bunkers
Warmte Heat
Brandstof en warmte-omzetting Fuel and heat conversion
Elektriciteit en WKK-omzetting Electricity and CHP conversion

CHESTER PROJECT NO. 764042
D6.1: Detailed PESTEL and PORTER analysis of the CHEST system 72
Figure 46: Dutch high voltage infrastructure including international interconnections.
Future scenarios
In 2018, the national government committed to more ambitious CO2 emission reduction targets,
notably a 49 % reduction by 2030. This will require major investments in many aspects of the
energy system. Scenarios were evaluated by the Planbureau voor de Leefomgeving (PBL) on cost
versus effectiveness in achieving the goals at two main levels of ambition.
1. Static cost optimal. Measures are selected in order of decreasing cost effectiveness (cheapest first). Measures already agreed on in the coalition accord were included, most importantly the closing of coal-fired power plants. Realizable potential was used as a criterion (versus technical potential, which does not consider possible practical obstacles like currently missing legislation or instruments). EU policy is adhered to. Import/export effects of electricity are kept at minimum.
2. Transition. This takes scenario 1 as a basis, but instead of aiming to reach only the 2030 target, it aims to reach that target and be optimally positioned by that time to reach the 95 % reduction target by 2050. This means that other, more expensive choices than in scenario 1 to reach the 2030 target might be made initially, in order to eventually arrive at the 2050 targets (which might not be feasible building on the choices made in scenario 1). Backcasting is used determine which measures must be prepared for.
These scenarios show that the added costs of the new 49 % target will be between 2.1 and
3.4 G€ per year (Planbureau voor de Leefomgeving 2018). Table 3 lists the most cost-effective
measures per sector, giving an indication of which measures have a higher chance of
implementation.

CHESTER PROJECT NO. 764042
D6.1: Detailed PESTEL and PORTER analysis of the CHEST system 73
Table 3: RES measures considered for the future development of the Dutch energy system.
Measure Emission reduction (Mton) Cost effectiveness (€/ton)
Electricity production
8 GW extra-large scale PV 3.2 -20
5.4 GW extra onshore wind 5.7 -20
1.6 GW extra nuclear 4.5 20
5.3 GW extra offshore wind 8.3 20
Industry
Recycling 2.2 -140
Process efficiency (low cost) 3.3 -120
CSS industrial process emissions 1.5 40
Urban environment
A+++ equipment in homes 0.5 -20
Residential PV 4.9 110
Insulation existing homes 3.3 290
Transportation
Efficient tyres (potential) 0.6 -300
CO2 norm freighting 2% increase by 2021
0.6 -260
CO2 norm freighting 2.8% increase by 2021
0.9 -240
Agriculture and land use
Geothermal horticulture 1.1 -20
Methane oxidation manure 0.6 10
Greenhouse as energy source 1.9 70
2.5.5. Environmental factors
Greenhouse gas emissions were almost 200 MTon of CO2 equivalents in 2017. The Netherlands
ranks 24 in the EU in terms of emissions per capita and 26 in terms of the share of renewables
(annual generation). Figure 47 shows the emissions per sector over time. Although the trend is
downward, recent years have seen an increase in emissions again, mainly due to the improved
economic situation causing e.g. more road traffic.
Progress is being made recently, with a 3 % reduction between 2017 and 2018. This was mainly
caused by the closing of coal-fired power plants. Energy consumption in e.g. transportation,
agriculture and construction has gone up, however, indicating that a society-wide transition is
still challenging.
Figure 47: Greenhouse gas emissions per sector.

CHESTER PROJECT NO. 764042
D6.1: Detailed PESTEL and PORTER analysis of the CHEST system 74
2.5.6. Legal factors
Roles and institutions
The Ministry of Economic Affairs and Climate Policy is responsible for energy and climate policy
in the Netherlands, with certain areas also covered by the Ministry of Infrastructure and Water
Management.
The Netherlands Authority for Consumers and Markets (ACM) is the independent regulator of
the energy market.
The TSO TenneT has a lawful monopoly on the Dutch high voltage infrastructure. It is wholly
owned by the Dutch government and its activities are regulated. Its fees are controlled by the
ACM.
Up to 2004, energy companies performed both energy supply and DSO roles. However, in 2004,
the energy market was opened up through the forced separation of energy companies into
energy providers and DSOs. Both types of companies are privately owned, but their roles are
regulated by the ACM. The two tasks of the DSOs are to maintain the infrastructure and to
facilitate the functioning of the energy market. DSOs are prohibited to take on other roles, which
causes friction when they might want to introduce new concepts or technologies that cross the
boundary between the playing fields of DSOs and energy companies. An example is smart
charging of electric vehicles. DSOs would benefit from managing the infrastructure before and
after the charging station, since this allows them to manage flexibility on the grid, reducing the
need for large grid capacity investments. However, currently they cannot play a role or invest
on the user side of the charging station. Exemptions can be given to experiment with new
models.
Energy providers buy energy from energy producing parties such as power plants or solar parks.
They sell this energy to end users, using the distribution network of DSOs to deliver the energy.
Their activities are regulated by the ACM. For instance, they are required to provide reliable
service and to charge reasonable fees.
Measurement companies are independent of the energy providers or DSOs and are responsible
to accurately determine energy consumption by end users.
Aggregators are a relatively new type of player which tries to match supply and demand by
combining available energy production from various sources and offering this to consumers who
need flexibility.
Laws and regulations
There are distinct laws for different areas of the energy system in the Netherlands:
• Electricity law
• Gas law
• Heat law
The overarching environmental law is called Wet Milieubeheer (“law for environmental
conservation”), which provides the legal tools to protect the environment and which translates
European policy and directives to the Dutch situation. From this law, several energy related
regulations have sprung:

CHESTER PROJECT NO. 764042
D6.1: Detailed PESTEL and PORTER analysis of the CHEST system 75
• EED (European Energy Efficiency Directive) – mandatory 4-yearly audit for energy use and efficiency measures)
• “Activiteitenbesluit” - EE measures with payback period < 5 years are mandatory
• MJA3 - voluntary commitment to 2 % energy reduction per year
• MEE - similar to MJA3, but for companies covered by the ETS
• EPBD (Energy Performance in Buildings Directive)
o Mandatory energy label C or better for all office buildings (2023)
o Mandatory energy label A for all office buildings (2030)
For district heating, laws and regulations apply at various levels of government. At the municipal
level, environmental and building permits are obtained so are the concessions for operators of
heat nets. The provinces supply environmental permits in case of groundwater extraction for
geothermal energy. The national government provides permits related to flora, fauna and soil
quality. All levels of government are responsible for their own inspection and enforcement.
Storage and flexibility
The legal status of energy storage is unclear and covered by a multitude of laws and regulations
(electricity law, system code electricity, tariff code electricity, EU directive 2016/631, heat law,
etc.). This has several unwanted consequences, among others:
• Energy tax is charged twice: when charging and at the end user after discharging.
• Due to taxation, purchase of electricity is more expensive than sale, which makes the price of storing a kWh of electricity more expensive than it should be, dampening the adoption of storage for flexibility.
• Small prosumers (e.g. homes with solar panels) can currently offset their entire energy costs including taxes through their own production, removing any incentive for local storage.
• Time-of-use is not currently a variable in electricity prices for small consumers, removing the incentive for them to store locally generated electricity.
2.5.7. Heating sector – District Heating
District heating in the Netherlands plays a relatively small role, mainly due to the highly
developed and fine-grained natural gas network. A typical energy technology in the large
majority of residential and commercial buildings is a gas-powered heater. Of the 7.7 million
homes in the Netherlands, around 400,000 (5 %) are estimated to be connected to a district
heating system. Another 500,000 (6.5 %) homes are connected to a block heating system (ECN,
2017).
A rough classification into large heat nets, small nets and block heating can be made. The
distribution of connections and consumption over these categories is presented in Table 4.
Table 4: Connections and heat consumption for large and small heat nets and block heating. number of
connections heat consumption
(PJ/year)
Large heat nets (>150 TJ/year)
small users (<100 kW) 294000 8
large users (>100 kW) 5000 11.6
TOTAL 299000 19.6

CHESTER PROJECT NO. 764042
D6.1: Detailed PESTEL and PORTER analysis of the CHEST system 76
The distribution of energy sources for small and large nets is listed in Table 5.
Table 5: Nature and size of energy sources for small and large heat networks.
Consumption (PJ/year) Large nets small nets TOTAL
CHP 13.0 0.9 13.9
gas-powered boiler 1.4 0.1 1.5
biomass 2.9 0.2 3.1
Other (a.o. non-biogenic waste)
3.1 0.0 3.1
heat-cold storage 0.0 0.2 0.2
TOTAL 20.3 1.4 21.7
A recent study on the future of heat networks in the Netherlands anticipates that in the long-
term, two thirds of the low temperature heat demand could be supplied by climate neutral heat
networks fed by renewable sources. In this scenario, geothermal energy would be the main
contributor (Planbureau voor de Leefomgeving, 2017).
Development of district heating projects, especially using renewable energy in the form of e.g.
geothermal or waste heat, can vary greatly depending on circumstances like location, public and
private parties involved and scale. Often municipalities, provinces and the national government
will provide financial support to get projects off the ground. Several Green Deals (see 2.5.2) have
been developed around heat networks.
Small heat nets (<150 TJ/year)
TOTAL 45249 1.5
Block heating TOTAL 496227 16
TOTAL
1184725 37.1

CHESTER PROJECT NO. 764042
D6.1: Detailed PESTEL and PORTER analysis of the CHEST system 77
3. Porter’s Five Forces Analysis
3.1. Introduction
Porter's five forces model (M. E. Porter, 1979) can be used to explain the competitiveness within
a sector. It is the result of five forces (Figure 48), which are briefly described in the sections
3.1.1—3.1.5, after which the five forces for CHESTER is analysed:
1. threat of new competitors,
2. power of suppliers,
3. power of customers,
4. threat of substitutes,
5. industry rivalry.
Awareness of Porter's five forces can help a company understand the structure of the sector in
which it operates and its profitability over the medium/long term. At the same time, it provides
a reference framework through which the company can anticipate and influence the
competition and profitability of the sector over time, thereby determining a lasting competitive
advantage.
Figure 48: Porter's Five Forces.
3.1.1. Threat of new competitors
The threat of new competitors entering a certain sector can limit the profit potential of the
companies already operating in the sector. A lower threat of new competitors is for example
caused by higher barriers to entry. These barriers may be of different natures. Some examples
are:
• Legislative barriers: e.g. the existence of patents, rights, government policy, etc.
Competitive situation(industry rivalry)
Threat of new
competitors
Power of customers
Threat of substitutes
Power of supplier

CHESTER PROJECT NO. 764042
D6.1: Detailed PESTEL and PORTER analysis of the CHEST system 78
• Start-up cost and economies of scale: high start-up costs and cost structures characterized by large fixed cost and low operating cost represent a barrier to entry, because a new player must face a large upfront investment and then be able to become sufficiently large to make profit.
• Restricted/limited access to distribution channels.
• Customer loyalty: customers may be loyal to a brand, and therefore unlikely to change supplier, even when offered a product with equivalent or better quality-to-price ratio.
• Switching costs: customers may be unwilling to change from one supplier to another because of high costs incurred through switching suppliers.
• Profitability: the lower the industry profitability, the lower the threat of new entries.
• Expertise: sectors characterized by steep learning curves may be unattractive to new players, which may struggle to compete against experienced companies.
3.1.2. Power of suppliers
The bargaining power of the suppliers may contribute in reducing profit margins in a certain
sector, by raising the prices or reducing the quality of the supplied goods and services.
The bargaining power of suppliers depends, among other things, on the size of the company
with respect to suppliers, the presence and differentiation of substitute input products that can
be purchased by the company, the costs for switching to another supplier, supplier competition
(i.e., the ability of the supplier to forward-integrate and cut out the buyer). Additionally, it is
important to consider the sensitivity of the overall cost, quality and differentiation of the final
product/service on the cost and quality of the input product.
3.1.3. Power of customers
Customers can exercise their bargaining power and capture greater value by forcing lower
prices, demanding higher quality or better services, and generally forcing companies within a
sector to fight against each other. The power of customers is influenced by different factors: size
of purchases (the larger the volume purchased by a customer, the larger the contractual power),
number of customers (the fewer the customers, the larger their bargaining power), possible
backward-integration, switching costs, availability of existing substitute products.
3.1.4. Threat of substitutes
Substitutes are products technologically different from that proposed by the company treated
in the Porter’s analysis, but which satisfy an identical or similar need of the customer. How much
of a threat a substitute product represents is influenced by several factors, such as buyer's
switching costs, buyer propensity and ease to substitute, price and quality performance of the
substitute. Rapid technological development can dramatically change a sector by creating
completely new substitutes.
3.1.5. Industry rivalry
The level of profit in a sector is determined by the degree of competition between the existing
companies. Several factors affect the degree of competition: concentration of the sector,
differentiation of the product, excess production capacity, barriers to exit, economies of scale
and cost structure.

CHESTER PROJECT NO. 764042
D6.1: Detailed PESTEL and PORTER analysis of the CHEST system 79
3.2. Porter’s Analysis of the CHEST system
Electrical energy storage (EES) technologies are those where electricity is transformed from one
form to another —the latter being suitable to be stored—, which is then converted back to
electricity as per requirement. The stored energy can be used in periods of high demand, high
generation costs and/or low energy production.
Several factors are expected to boost the global market for EES. These include:
• a steady increase in the electricity demand worldwide,
• higher share of RES (often fluctuating) in the electricity generation mix,
• an increase in renewable energy curtailment,
• requirements for reliability of the electrical grid,
• need to increase energy efficiency and reduce CO2 emissions,
• coupling of different energy sectors, such as electricity, heating, cooling and transport.
As of mid-2017 the estimated EES capacity installed worldwide was approximately 4.7 TWh in
terms of energy and 176 GW in terms of power capacity (International Renewable Energy
Agency, 2017), which was about 2 % of the world’s total generation capacity. This percentage is
recommended to be about 8 %, solely for peak shaving and daily charge/discharge cycles (Du &
Lu, 2014). If fluctuating RES are to increase their share in the generation mix, the required
capacity of EES should be even higher. According to (Bloomberg, 2017), the global market for
EES would double six times from 2017 to 2030, reaching a deployment of 125 GW/year,
equivalent to 300 GWh/year (Figure 49). About 90 G€ are expected to be invested in EES over
that period. Moreover, the IEA estimates that limiting global warming to 2 °C would require the
global installed EES capacity to increase to 450 GW by 2050 (Bardajií et al., 2017).
Figure 49: Forecast of EES deployment worldwide until 2030 by country (Bloomberg, 2017).
3.2.1. Threat of new competitors
The strong growth of the EES market which is expected in coming years (Figure 49) and the
strategic importance which is recognized to the sector is likely to favour the profitability of the
EES industry. This may push new players to enter the market either as new suppliers of existing

CHESTER PROJECT NO. 764042
D6.1: Detailed PESTEL and PORTER analysis of the CHEST system 80
technologies or with completely new solutions. The CHEST system itself is proposed as a new
potential competitor in the field of EES.
The sector of EES has been extremely dynamic in the last years. After a century, during which
the sector only had pumped hydro as a player, the last decades have seen the birth and
development of new technologies. In this respect electrochemical EES (batteries) deserves a
notable mention, as this is the technology which has grown more rapidly in the last years.
Although a variety of well-established chemistries already exists (e.g. lead-acid, lithium-ion, etc.
in subsection “Batteries” in Section 3.2.4), the development is non-stopping. New chemistries,
which currently are just in the research phase, are claimed to have the potential to replace
present batteries within the next one or two decades. These chemistries include metal-air,
sodium-ion, lithium-sulphur and sodium nickel chloride (Bardajií et al., 2017).
With respect to hydrogen, the well-established alkaline electrolysis (subsection “Chemical
storage” in Section 3.2.4), could be replaced by proton exchange membrane cells, characterized
by higher power density and efficiency (Bardajií et al., 2017).
Despite the ongoing developments and rapid changes in the EES sector, different barriers in
different countries may currently limit the growth of the stationary EES market worldwide. The
barriers include (Eller & Dexter Gauntlett, 2017):
• lack of familiarity with EES among utilities, regulators and financiers;
• high upfront costs. Although the cost composition changes from one EES technology to
another, all of them are characterized by high investment costs and relatively low
operation costs;
• need for skilled and experienced technicians to maintain and operate the systems;
• regulations preventing third-party or customer ownership of certain distributed energy
resources;
• regulations preventing EES from competing in energy, ancillary service or capacity
markets.
If a new competitor plans to enter the market offering well-established technologies, the threat
toward existing players seems fairly weak, mainly because of the high upfront costs which must
be faced and the required expertise. Another factor that limits the threat of new competitors is
represented by the high switching costs. EES systems have generally fairly long technical
lifetimes (except for some battery chemistries) and high investment costs (Table 7), so
decommissioning an EES to install a new one before the end of its lifetime may be very costly.
Furthermore, the market for EES is expected to grow so much in the near future, that new
technologies could find opportunities for entering the market, focusing on new capacity to be
installed, rather than replacing operating EES.
A potential competitor entering the EES sector with a new technology may rapidly conquer a
large share of the market, because there is currently no EES solution which is applicable in all
contexts. To be competitive and possibly disruptive, new EES technologies should be efficient,
reliable, cost-effective over a long lifetime, site-independent, environmentally and socially
acceptable.

CHESTER PROJECT NO. 764042
D6.1: Detailed PESTEL and PORTER analysis of the CHEST system 81
3.2.2. Power of suppliers
Although the main components of the CHEST system are existing technologies, such as HP and
ORC, the technical characteristics required from these components make them very customized.
The HP shall for example work with unusually high temperatures and temperature differences,
which limits the number of refrigerants that can be used, force mechanical components to their
limits or implies a heat pump configuration with multiple heating stages. The heat-engine pump
is currently in a prototype phase, so it is not a standard component. Also, the components of
the ORC as well as the high temperature latent heat storage system will be manufactured
specifically based on the requirements of the CHESTER project. Therefore, it can be expected
that the number of potential suppliers of the different components will be very limited,
especially in the first period of the CHEST technology. This will give the suppliers a strong
bargaining power and the possibility to drive the prices up.
However, if the technology proves to be promising and competitive, other suppliers of HP, ORC
and TES components would be interested in entering this new market, making their offers to
supply relevant components for the CHEST system. If suppliers spot a good potential in the
CHEST system, they would be keen on favouring its development, by applying reasonable pricing
and providing assistance, for example in R&D.
Heat pump
For the HP, the critical component that will certainly limit the access to this technology is the
compressor. The development of a dedicated high-temperature compressor suitable for the
CHEST system is something considered out of reach of the CHESTER project. Thus, a complete
dependency on the suppliers is expected for this technology.
The development of commercially available low- to medium-sized high-temperature HP
(<2 MWth) is in its initial phases, reaching for the moment temperatures at around 165 °C with
few manufacturers that could reach temperatures above 110 °C (Kobelco, Viking Heat Engines,
Ochsner, Hybrid Energy AS, Mayekawa, Oilon, etc. see Figure 50). However, this market sector
seems very active, mainly due to the recent interest in introducing this technology in industrial
processes (mainly in waste heat recovery and drying processes), so a fast introduction of new
competitors and products may occur in the following years.
Whereas for large-scale high-temperature HP (>2-3 MWth), there are no known manufacturers
that can provide a HP operating at temperatures higher than 90 °C, and the market in this
application range seems to be controlled by a few large corporations (Johnson Controls, GEA,
Carrier, Friotherm, etc. see Figure 51). For this capacity range, it is less likely that a fast
introduction of new high-temperature models could take place in the next years, and the
presence of new manufacturers is not likely.

CHESTER PROJECT NO. 764042
D6.1: Detailed PESTEL and PORTER analysis of the CHEST system 82
Figure 50: Commercially available industrial HT-HPs C (Arpagaus, Bless, Schiffmann, & Bertsch, 2017).
Figure 51: Industrial HT-HPs with temperatures above 90 °C (Arpagaus et al., 2017).
Organic Rankine Cycle
The ORC is considered a mature low-temperature heat-to-power technology. Its application is
found in various fields including geothermal energy, biomass and industrial heat recovery. The
chart in Figure 52 shows the percentage market share of these applications. Geothermal power
shows the largest market share (76%) followed by industrial heat recovery (13%) and biomass
(11%). Each of these niche fields relate to specific temperature levels and capacities.

CHESTER PROJECT NO. 764042
D6.1: Detailed PESTEL and PORTER analysis of the CHEST system 83
Figure 52: Percentage market share of the ORC market (Tartière & Astolfi, 2017).
Because of the applicability and incentives derived from its usage, a fairly large number of
companies have come forward in the manufacturing, design, analysis and testing of ORC
systems. Typically, each company focuses on a single specific field. Figure 53 lists the main ORC
manufacturers and their share in the total installed capacity of these systems. The manufacturer
ORMAT, which focuses on geothermal applications, is the major player with an installed capacity
of 1701 MW with a total of 1102 ORC units installed (all data collected until 2016).
Figure 53: Share in installed capacity of difference ORC manufacturers (Tartière & Astolfi, 2017).
Based on the boundary conditions defined within the CHESTER project, the manufacturers that
may have the experience, interest and required specifications needed to meet the project goals
are listed in Table 6.
The main difference among the different manufacturers is the expander design. The expander
dictates the performance, temperature levels, capacity and the part-load operation. Especially
for the CHESTER project, the part-load performance will be significant, as the load can vary
depending on the grid conditions. Furthermore, the temperature levels at the condenser side
are variable depending on whether the condensing heat is used for DH or dissipated to the
environment. The few manufacturers (Viking Heat Engines, Exoes) that focus on this topic are
76%
11%
9%
4%
0%
Geothermal - 76.5%
Biomass - 10.7%
Heat Recovery (Energy &Gas Turbines) - 8.5%
Heat Recovery (Other) -4.2%
Solar - 0.1%
66%5%
12%
1%
4%10%
1%
1%
ORMAT - 65.7%
TAS - 5.2%
Turboden - 12.6%
Kaishan - 0.8%

CHESTER PROJECT NO. 764042
D6.1: Detailed PESTEL and PORTER analysis of the CHEST system 84
working on waste heat recovery for vehicles where the dynamics are large. Upscaling of this
technology and further modifying it for the CHESTER project will thus be crucial.
Table 6: ORC specifications supplied by the manufacturers.
Manufacturer Temperature source Capacity Reference
ABB T > 200°C 500 kW ABB
Viking Heat Engines 80 to 215°C 15.5 kW
BEP E-Rational 85 to 115°C 500 kW E-Rational Low Temp ORC
Calnetix T > 110°C 125 kW Access Energy ORC System
Enertime 150 to 200°C 300 to 3000 kW Enertime ORC Module
Enogia 80 to 120°C 5 to 100 kW Enogia ORC Module
Exergy 80 to 350 °C 100 to 50 MW Exergy ORC Technology
Electratherm 77 to 122°C 35 to 110 kW Electratherm Power+Generator
Exoes T < 300°C 4 kW Exoes EVE
GE Power T > 155°C 50 - 140 kW Clean Cycle II R-Series
ORMAT T > 126°C ≥45 MW ORMAT ORC
TMEIC T > 125°C 250 kW TMEIC ORC
Turboden - 2 to 10 MW Turboden Waste Heat Recovery
gT – Energy Technologies
T > 108°C 170 kW gTET ORC generator
High-temperature thermal energy storage
For the HT-TES, one must analyse the power of suppliers separately from the passive and active
storage concept perspective. From a manufacturing perspective, a passive latent TES system is
essentially an adapted heat exchanger. Its design for manufacturing can be developed and
optimized by companies that build heat exchangers. The thermal design is more critical, though
with the development of design tools and experience gained from research in the integration
and limits of the technology, this can also be adopted by companies interested in developing
and optimizing the technology. Active latent heat storage systems, on the other hand, are in an
earlier stage of development from the system design perspective, as these concepts have been
developed specifically for heat transfer and storage and not as much experience has been gained
to this date.
In the context of CHEST technology, it can be expected that the forward integration threat will
not assume remarkable dimensions. The complexity of the CHEST system, which makes use of
several non-standards components, reduces the risk that the supplier of a specific component
has interest in and/or the possibility of supplying the entire system as a turnkey solution.
3.2.3. Power of customers
The bargaining power of buyers in the market of EES can be assumed to be fairly strong. Energy
(and, hence, energy storage) is a commodity, so no brand or technology loyalty can be expected.
Much more relevant aspects for customers are reliability of the technology, quality, flexibility,
prices (in terms of €/MW, €/MWh and €/MWh/cycle) and warranty.

CHESTER PROJECT NO. 764042
D6.1: Detailed PESTEL and PORTER analysis of the CHEST system 85
The relatively small number and large size of customers in the large-scale EES market (industry,
power plants, DSOs, TSOs, large entities operating in the electric market) and fairly large variety
of EES technologies (see Section 3.2.4) increases the impact of losing (or not acquiring) a
customer, thereby strengthening the power of the customers.
For example, let us assume that a customer is considering an investment in an EES to increase
the share of fluctuating renewable electricity (the transmission capacity to/from nearby areas is
limited, hence the supply and demand need to match locally). A variety of EES technologies
exists (see Section 3.2.4), but some of them —such as pumped hydro and compressed air EES—
may be immediately excluded due to geographical/topological/geological and environmental
reasons, as they require very specific conditions to be implemented in a cost-effective way. If
the customer looks for EES technologies suitable for supply-demand balancing with a usage time
of several hours or a few days, the choice could be limited to batteries and a CHEST system.
Supposing that all these technologies are mature and can meet the quality/reliability
requirements of the costumer, the investment and operation cost of each single technology
would have a key role in the final choice of the customer, who could, hence, take advantage of
this to ask for better offers from different suppliers.
Assuming that the technical lifetime of the CHEST system can be expected to be twice as long as
the lifetime of battery systems (about 40 years against e.g. 20 years for vanadium redox
batteries), then the CHEST system could be up to twice as expensive (in €/kWh) than the battery
systems and still remain price-competitive.
Obviously, if a customer has stricter and more specific requirements (e.g. with respect to the
environment, safety, response time, space limitations, etc.) the number of feasible solutions
decreases and so does the bargaining power.
Finally, the backward integration threat can be expected to be low. The complexity of the CHEST
system reduces the risk that final customers could have the competences and would be willing
to take the risk of implementing the system themselves, after purchasing several non-standards
components from different manufacturers.
3.2.4. Threat of substitutes
The CHEST system would be a new type of EES, which would enter a very dynamic market,
characterized by many different technologies.
On the one hand, according to the form in which electricity is transformed and stored, EES
technologies can be categorized in mechanical storages (pumped hydro, compressed air,
flywheels), electrochemical storages (batteries), chemical storages (fuels, such as hydrogen and
methane) and electromagnetic storages (supercapacitors and super magnetic storages). Besides
storing electricity, many of these technologies can also provide ancillary services to the grid,
such as reserve capacity and frequency regulation (Sveinbjörnsson, Trier, Hansen, & Mathiesen,
2018).
On the other hand, the CHEST system is a form of thermal energy storage (TES), as electricity is
used to run a HP, whose condensing heat is stored in a high temperature TES. Other TES
technologies for power generation (such as molten salt, steam, crashed rocks/pebble stones
storages usually connected to solar power plants) exist, but these are not treated in this
deliverable. In fact, although the stored energy can be used to drive a steam cycle and so

CHESTER PROJECT NO. 764042
D6.1: Detailed PESTEL and PORTER analysis of the CHEST system 86
produce electricity, the original energy form that is converted and stored is not electricity, hence
these technologies do not comply with the definition of EES given above.
Pumped Hydro Storage (PHS)
In a PHS, electricity is converted and stored in the form of gravitational potential energy, given
by height differences in water levels. It is the most common form of EES, currently representing
more than 97 % of the EES capacity. In 2014, there are about 250 plants, with a total capacity of
120 GW (Du & Lu, 2014). Updated estimates range between 118 and 132 GW (International
Renewable Energy Agency, 2018; Nordling, Englund, Hembjer, & Mannberg, 2016).
The popularity of PHS comes from many factors, such as high efficiency (65-85 %), large power
capacity (100-1000 MW), large storage capacity (1-24+ hours), long storage period, long lifetime
(30-60 years) and low cycle cost (0.1-1.3 €/kWh/cycle). PHS is generally limited to high-power
applications due to its high investment costs (500-1700 €/kW), environmental damages from
flooding large areas of land and long project lead time (Du & Lu, 2014). PHS has a short response
time, thus, it can be used for voltage and frequency control, spinning/non-spinning reserve,
system capacity support and black start (Bardajií et al., 2017; Nordling et al., 2016).
Compressed Air Energy Storage (CAES)
A CAES system uses an underground site, such as a cavern or a mine, to store a compressed gas
at approximately 4-8 MPa. Currently, CAES shows the highest potential for large-scale EES, after
PHS. It is characterized by large power capacity (50-300 MW), large storage capacity (2-50+
hours), long storage period (over a year), quick start up (10 minutes), long lifetime, low
investment cost (350-700 €/kW) and almost no environmental impact (Du & Lu, 2014). On the
contrary, it has a low efficiency (42-54 %) and requires specific geological conditions, i.e. the
presence of a suitable underground storage.
Although only two CAES exist, these have shown high reliability and economic feasibility. These
are the 290 MW plant in Huntorf (Germany) from 1978, and the 110 MW plant in McIntosh
(USA) from 1991 (Crotogino, Mohmeyer, & Scharf, 2001). In both plants, cheap off-peak
electricity is used to compress air, which is stored in a cavern. When needed, the compressed
air is released, natural gas is burnt together with it and then expands in a gas turbine generating
electricity. The natural gas is added to counter the cooling effect generated by the
decompression.
Besides time-shifting, load levelling and peak shaving, CAES can provide system services such as
inertial response, reserve (primary, secondary and tertiary), fast frequency response, dynamic
reactive response and steady state reactive power (Bardajií et al., 2017).
Several new CAES projects have been investigated, especially in the USA and in Europe. For
Europe it is worth mentioning the research projects ADELE-ING (Zunft et al., 2017) and RICAS
(Montanuniversität Leoben, 2018), investigating the feasibility of adiabatic CAES, which should
increase the round-trip efficiency of the system by recycling the heat developed in the
compression phase, minimizing/avoiding the use of natural gas in the expansion phase.
Batteries
Batteries are electrochemical energy conversion and storage devices. Many types of batteries
exist, and more are under development. Although in 2016 batteries represented only 1 % of the
171 GW of installed EES capacity worldwide, they are the EES technology which has been
developing fastest in the last years (Bardajií et al., 2017). This has been caused by increased

CHESTER PROJECT NO. 764042
D6.1: Detailed PESTEL and PORTER analysis of the CHEST system 87
performance and falling costs, which are further expected to decrease in the future: the cost per
unit energy of most battery technologies (lead acid, sodium-sulphur, zinc-bromine, vanadium
redox and lithium-ion) in 2030 is estimated to be 50 %-66 % lower compared to 2016
(International Renewable Energy Agency, 2017).
Batteries can be divided in “conventional” batteries and “flow batteries”. In conventional
batteries, the electrochemical cell acts as both energy conversion and storage devices. The
charge/discharge power and the energy storage capacity depend on the size of the cell and
cannot be varied independently of each other. In flow batteries, the energy conversion occurs
in the cell, while storage takes place in special electrolyte tanks. Hence, the charge/discharge
power depends on the size of the cell, while the storage capacity depends only on the size of the
electrolyte tanks.
Lead-acid (Pb) batteries. More than 130 years old, lead-acid batteries are widely used as small-
medium scale EES, such as vehicles (70 % of the total market), communication and solar PV
systems. They are relatively cheap (100-400 €/kWh), reliable, efficient (65-80 %), hence, are
suitable for uninterruptible power supply, power quality and spinning reserves. Nevertheless,
they are characterized by short lifetime (500 cycles, 3-4 years), low depth of discharge (20 %)
and low energy density (30-50 Wh/kg) (Du & Lu, 2014; Nordling et al., 2016). More recently,
advanced lead-acid batteries have shown better properties, such as 2800 cycles, 50 % discharge
depth and a life of 17 years (Nordling et al., 2016).
The largest lead-acid battery (10 MW/40 MWh) was installed in 1988 in California for load
levelling (Du & Lu, 2014).
Nickel-Cadmium (NiCd) batteries. NiCd batteries are characterized by higher energy density (50-
75 Wh/kg), longer lifetime (2000-2500 cycles), but also higher cost compared to lead-acid
batteries. Their application in connection with RES is strongly limited by the so-called memory
effect. If a battery is not completely discharged before being charged, its capacity will degrade.
In the last decades the use of NiCd batteries has decreased, also due to the stricter rules on the
use of toxic cadmium (such as EU directive 2006/66/EC). The largest NiCd battery is installed in
Alaska, has a nominal power of 27 MW and is used as spinning reserve (Du & Lu, 2014).
Sodium-Sulfur (NaS) batteries. NaS batteries are a mature technology, which has increased
dramatically in the last years (from 10 MW in 1998 to 305 MW in 2008). The reasons for this
success are: long lifetime (1500-4500 cycles, 15 years), high efficiency (80-90 %), intermediate
energy density (60 Wh/kg) and recyclable components. However, drawbacks are the high
operating temperature (300-350 °C), high investment cost (500 €/kWh) and highly corrosive
sodium sulphides (Du & Lu, 2014; Nordling et al., 2016). Additionally, sodium burns in contact
with air, thus the battery must be vacuum-insulated. The largest NaS battery is a 50 MW
300 MWh system, which was installed in Japan in 2016 to balance the grid frequency, when
connected to RES (Ohki, 2016).
Lithium-ion (Li-ion) batteries. Commercialized in 1991, Li-ion batteries have spread massively in
several markets, especially that of portable devices and electric vehicles, thanks to the high
efficiency (>90 %), good lifetime (1000-5000 cycles), high energy density (150-200 Wh/kg) and
high power density (250-340 W/kg) (Du & Lu, 2014). Their cost, around 850 €/kWh in 2010, has
been continuously falling in the last years (170 €/kWh in 2016 (Zart, 2017)). Concerns for large
scale application of Li-ion batteries are their flammability and the fairly centralized supply of key
materials, such as lithium and cobalt. The largest Li-ion battery is a 100 MW 129 MWh system,

CHESTER PROJECT NO. 764042
D6.1: Detailed PESTEL and PORTER analysis of the CHEST system 88
which was installed in 2017 in South Australia, to store fluctuating electricity generated by
Hornsdale’s wind farm (Ayre, 2017).
Zinc-Bromine batteries. These batteries are flow batteries characterized by 75 % efficiency, 75-
85 Wh/kg, long lifetime, no self-discharging and no negative effects from deep-discharge. In
2009 (Du & Lu, 2014). The high cell voltage and highly oxidative bromine set specific
requirements to the electrodes, membranes and fluid handling components, which increase the
cost. Zinc is a limited resource (Du & Lu, 2014), while bromine is a highly toxic and measures
must be taken to guarantee system safety (Energy Storage Association, 2018).
Vanadium Redox Flow (VRF) Batteries. These flow batteries are a proven technology, which has
been installed in various locations, mainly for load levelling, stabilization of energy supply from
RES, uninterruptible power supply, back-up power and power quality. VRF batteries are
characterized by 75-85 % efficiency, long lifetime when properly maintained (up to 12,000 cycles
at 100 % depth discharge with no degradation of the electrolytes), but low energy density (16-
33 Wh/l) (Du & Lu, 2014; Nordling et al., 2016). The largest VRF battery (200 MW 800 MWh) is
under construction in China, and will help balance supply and demand in the province’s power
grid and avoid curtailment of wind electricity production (Lombardo, 2016).
Chemical storage
In chemical EES, electrical energy is used for producing chemical fuels (gaseous or liquid). The
fuels can be stored and later converted again to electrical energy. Hydrogen (H2) (and oxygen) is
produced through electrolysis of water by introducing an electric current. Hydrogen can then be
stored in chemical or physical storages, or converted to methane (CH4) adding carbon dioxide
(Sabatier reaction). When needed, hydrogen is used to run a fuel cell or a combustion engine,
producing electricity. Currently, hydrogen storage is characterized by high investment costs
(650-1000 €/kW), low storage conversion efficiency and low volumetric energy density, which
requires compression between 200 and 700 bar or liquefaction (Bardajií et al., 2017). However,
examples of this technology in connection with wind electricity storage exist in Norway and
Denmark. More than in the energy sector, hydrogen might become relevant in the transport
sector as an alternative to conventional fuels (Du & Lu, 2014; Nordling et al., 2016).
Flywheels
A flywheel is a mechanical EES consisting of a rotating mass. A flywheel stores/retrieves energy
by changing its angular velocity, with the amount of stored energy being proportional to the
square of the velocity. Flywheels are characterized by a long lifetime (20 years), high efficiency
(90-95 %), fast response, high energy density, but also high capital cost (850-4300 €/kWh).
Additionally, the high self-discharge rate (up to 100 %/day) makes them only suitable for short-
term storage.
Electromagnetic EES
Electromagnetic EES include capacitors and superconducting magnetic energy storage (SMES).
These can provide high power only for a very short time, therefore are not usable for energy
storage. Capacitors and supercapacitors can provide power-factor correction, voltage and
reactive power support (Du & Lu, 2014; Sveinbjörnsson et al., 2018).
The main characteristics of the above-mentioned EES technologies are listed in Table 7¡Error!
No se encuentra el origen de la referencia., based on the information retrieved from (Du & Lu,
2014; International Renewable Energy Agency, 2015; Nordling et al., 2016). Figure 54 shows the

CHESTER PROJECT NO. 764042
D6.1: Detailed PESTEL and PORTER analysis of the CHEST system 89
Levelized Cost of Storage (LCOS) for some of the above-listed EES technologies, for
100 MW/400 MWh system with 365 cycles per year and assuming an electricity price of
3 c€/kWh. For the purpose of this report, the LCOS can be seen as the ratio between the sum of
investment cost and the operation cost of the EES over its lifetime, and the total amount of
electricity released by the EES over its lifetime. (for the exact definition of the LCOS, the reader
should refer to (Jülch, 2016)).
Table 7: Main characteristics of different EES technologies.
Cap
acit
y U
sage
ti
me
Effi
cien
cy
Star
t-u
p
tim
e En
ergy
d
ensi
ty
Loss
es
Life
tim
e (y
=ye
ars,
c.
=cyc
les)
Pu
mp
ed h
ydro
<5
GW
1
–24
h
65-
85 %
s-
min
0
.13
-1.1
2
kWh
/m3
0-0
.5 %
/day
5
0-1
00
y
Co
mp
ress
ed a
ir
MW
-GW
1
–24
h
42-
54 %
(n
orm
al)
70
% (
adia
bat
ic)
min
0
.5-0
.8
kWh
/m3
0-1
0 %
/day
2
5-4
0 y
Po
wer
to
H2
kW-G
W
s–m
on
ths
62-
82 %
s-
min
3
kW
h/N
m3
0-1
%/d
ay
10
y
Po
wer
to
CH
4
kW-G
W
s–m
on
ths
49-
56 %
m
in-h
9
.8 k
Wh
/Nm
3
0-1
%/d
ay
20
y
Flyw
hee
ls
2 k
W-2
0 M
W
s–m
in
95
%
s-m
in
200
Wh
/kg
10
0 %
/day
2
0 y
Sup
erm
agn
etic
EE
S 1
kW
-10
MW
s
90
%
ms
40-
60 W
h/k
g 1
0-1
5 %
/day
5
0,0
00
c.
Sup
erca
pac
ito
rs
10-
1000
kW
m
s–s
95
%
m
1-3
0 W
h/k
g 5
-40
%/d
ay
10-
25 y
, 1
06 c
.
Bat
teri
es
Lead
-bas
ed
1 k
W-5
0 M
W
s–3
h
65-
80
%
- 3
0-50
Wh
/kg
5 %
/mo
nth
3
-4 y
, 50
0 c
.
Sod
ium
-Su
lfu
r 0
.5-5
0 M
W
s–h
8
0-90
%
- 6
0 W
h/k
g sm
all
15
y,
15
00
-450
0 c
.
Lith
ium
-bas
ed
kW-M
W
min
–h
85-
99 %
m
s 1
50-2
00
Wh
/kg
5 %
/day
, th
en 2
%/m
on
th
100
0-5
00
0 c
.
Zin
c-b
rom
ide
0.0
5-2
MW
s–
10
h
70-
75 %
m
s 7
5-8
5 W
h/k
g sm
all
>20
00
c.
Van
adiu
m r
edo
x 0
.03
-7 M
W
s–1
0 h
7
5-85
%
ms
16-
33 W
h/l
5
%/m
on
th
20
y, 1
20
00
c.

CHESTER PROJECT NO. 764042
D6.1: Detailed PESTEL and PORTER analysis of the CHEST system 90
Additionally, a database of EES installations throughout the world can be found online (Sandia
National Laboratories, 2018).
Figure 54: Comparison of the LCOS of different EES technologies (Smallbone, Jülch, Wardle, & Roskilly, 2017).
Comparison of substitutes to CHEST
Different EES have different applications in the energy system. Capacity, cost, energy density,
efficiency, and technical and economic lifetime determine which type of EES is more suitable for
a given application. Therefore, PHS and CAES are suitable for energy balancing; batteries are
best suited as reserve power, for over-generation and off-grid systems, while flywheels,
supercapacitors and super magnetic energy storages can be used for electricity quality and
stability.
Due to its potentially large power output capacity, large storage capacity and a start-up time in
the order of minutes, the CHEST system would more directly compete with PHS and CAES
technologies. However, it should be mentioned that battery systems grow increasingly larger
and are now used not only for uninterruptible power supply, but also for balancing supply and
demand on a local and regional scale (Ayre, 2017; Lombardo, 2016)
Compared to the above-mentioned alternatives, the CHEST system offers several advantages.
First, the CHEST system is site-independent, not requiring specific geographical/topographical
and/or geological conditions, unlike PHS and CAES systems, which are currently the main types
of EES for large-scale application. Even in locations where PHS would be technically and
economically feasible, environmental and social considerations —such as destruction of flora,
fauna and landscape; flooding of vast land areas that could otherwise be used; negative effect
on tourism; etc. — may prevent its deployment. On the other hand, the CHEST system has a
minimum interaction with the environment, so it does not pose environmental and/or social
issues. Additionally, if run on renewable electricity, it is completely emission free, unlike the
existing CAES technology, which uses natural gas.
Among the different battery technologies, those expected to dominate the market in the near
future are sodium-sulphur batteries, lithium-ion batteries and vanadium redox batteries (Lee,
Kim, Yeom, & Kim, 2017; Nordling et al., 2016). Compared to the conventional sodium-sulphur

CHESTER PROJECT NO. 764042
D6.1: Detailed PESTEL and PORTER analysis of the CHEST system 91
and lithium-ion batteries, the CHEST system promises to be cyclically stable and have a much
longer lifetime (about 40 years), which gives this system a competitive advantage in a life cycle
analysis perspective.
Regarding safety consideration, it should be noted that the PCM planned to be used in the CHEST
system is a mixture of lithium and potassium nitrate. These materials are oxidizers, so a certain
amount of care is due when handling them. However, also many battery chemistries contain
hazardous materials, e.g. lead, sulphuric acid, sodium and lithium. The CHEST system does not
require limited resources during construction and operation, whereas with the mentioned
battery technologies, there are concerns on the cost, safety and relative difficulty in obtaining
cobalt (a key component of many Li-ion batteries), and on the availability of vanadium
(International Renewable Energy Agency, 2015).
Compared to any other EES technology described above, the CHEST system would be able to
take advantage of the availability of the low/intermediate temperature heat, so creating an
interconnection among the electricity sector and other sectors, such as DH and industrial heat.
In fact, low/intermediate temperature heat can be used as a heat source for the heat pump (HP)
of the CHEST system during the charging of the high temperature thermal energy storage (HT-
TES), thereby improving its COP. Relevant heat sources could be excess heat from industrial
processes, solar heat, a seasonal TES or a DH network. Furthermore, because a heat sink is
needed on the condenser side of the ORC, a CHEST system would also provide heat in output,
its temperature depending on whether priority is given to the electricity or heat production.
Relevant heat sinks could be the external environment (ambient air, rivers, lakes, sea, etc.), a
seasonal TES or a DH network. The presence of two different temperature levels in the CHEST
concept theoretically compensates for any irreversibility within the energy conversion and gives
the possibility of achieving a power ratio (power out/power in) of 100 % or higher. An overview
of the different operation modes of the CHEST system with respect to heat source and heat sink
is shown in Figure 55.

CHESTER PROJECT NO. 764042
D6.1: Detailed PESTEL and PORTER analysis of the CHEST system 92
Figure 55: Different operation modes of the CHEST system with respect to heat source and heat sink.
3.2.5. Industry rivalry
In general, many factors are likely to influence the rivalry within an industry. In the case of EES,
this can vary strongly from country to country according to specific key factors which
characterize that specific market. However, some general considerations independent of the
country can be made.
The rivalry between completely different EES technologies is likely to be limited, as the specific
boundary conditions will mainly determine which technology is the most economically feasible
in a certain location, rather than the prices and add-on services offered by the technology
suppliers. On the contrary, the competitive rivalry within the same technology (PHS, CAES,
batteries, etc.) is high because of the low product differentiation, no brand loyalty, importance
of the offered add-on services and bundling options (e.g. maintenance and decommissioning of
the EES). Additionally, the specialized assets needed to produce EES technologies represent a
very high exit barrier, which may force companies to remain in the market and compete even at
low profit margins.
Consequently, as seen in the subsection “Comparison of substitutes to CHEST” in Section 3.2.4,
a CHEST system offers the additional ability of interacting with the heating sector, which could
make it preferable under specific boundary conditions, e.g. in combination with DH systems,
solar heat, excess heat. A CHEST system could therefore limit curtailment of solar thermal output
in sunny periods, avoid the dissipation to the environment of low temperature excess heat and
add flexibility to a DH network.

CHESTER PROJECT NO. 764042
D6.1: Detailed PESTEL and PORTER analysis of the CHEST system 93
Finally, the expected growth in the EES market in the future (Figure 49) will likely reduce industry
rivalry for acquiring larger market shares. If, for example, the supply of battery EES is not able
to follow the pace of the growing demand, e.g. due to limited production capacity or availability
of raw materials, there would then be space for new technologies, as soon as they prove their
technical feasibility and reliability. Hence, it is of key importance that within the CHESTER project
both a prototype and a full-scale CHEST system are developed.
The Porter’s Five Forces diagram for the CHEST system is shown in Figure 56. This summarizes
the main points presented in the previous sections and rates the strength of each of the five
forces.
Figure 56: Porter’s Five Forces for CHEST system in the EES market.
3.3. Country-specific conditions
3.3.1. Spain
If we neglect the transport sector, in which Spain has a strong dependence on fossil fuels and
CHESTER cannot play a role, we can identify some interesting scenarios in view of the trends
that occur in the country.
The electricity sector presents an energy mix that is highly technologically diversified. RESs has
reached a share of around 35-45 % in recent years with the consequent need of curtailing
renewable electricity, especially wind farms, particularly windy nights when the TSO is forced to
shut down wind farms across the country. To cope with this situation, two scenarios (not
necessarily mutually exclusive) can be foreseen:
• An energy policy that supports an increased amount of interconnection capacity with other countries (France in particular), so that surpluses may be used by other countries.
Competitive situation
medium-low,as EES market is
expected to boom
Threat of new competitors
difficult to predict due to the rapid
technolgy development
Power of customers (power plants, DSOs,
TSOs, ...)
medium-high
Threat of substitutes (PHS, CAES, batteries)
medium-low, depending on
specific location
Power of supplier
medium-high, depending on the CHEST potential

CHESTER PROJECT NO. 764042
D6.1: Detailed PESTEL and PORTER analysis of the CHEST system 94
• Developing other solutions such as CHESTER in which the surpluses will be consumed closer to the producer sites.
One weakness of the second scenario is that most of the wind farm sites are not close to urban
centres, where they can take advantage of the thermal development of the CHESTER solution.
In this scenario, the storage in 'electric' mode for its re-discharge to the network is not fully
deployed normatively and the current battery systems have been oriented to aspects of
protection of facilities for other purposes. A possible improvement in the €/MWh cost would
allow a direct use.
The recently approved Royal Decree-Law 20/2018 on urgent measures to boost economic
competitiveness in the industry and commerce sector in Spain (Ecológica, 2018) allows closed
networks to be developed in industrial zones. This opens up opportunities for the
implementation of generation integration solutions with consumption, so that different
technologies and sources can be exchanged. These are, for example, surplus heat from
industries and renewable electric sources (PV, wind), allowing local production, reducing losses
of the networks, reducing supply costs (electric pool) and defining new business models, with
aggregations of demand and medium-scale generation.
Spain has few DH networks compared to other countries, especially in northern Europe. This
situation represents a loss of opportunity to massively integrate CHESTER solutions taking
advantage of existing heat sources and complementing with new renewable electrical
installations that increase the presence of renewable generation. However, existing networks
can be suitable test benches for the deployment of technology and the promotion of thermal
and electrical solutions based on renewables in other areas.
The regulation of the electricity sector is very restrictive. However, recent political changes have
included new royal decrees: one from October 2018 (which, in addition to reducing
administrative burdens, allows several owners to consume from the same generation point
nearby) and another from December 2018 (for the creation of closed networks in industrial
areas). Although they are waiting for their regulatory deployment, these measures open the
possibility of deployments of renewable production mainly in the sector of industry and
industrial estates.
In the building and urban planning sector, the developed model of building concentration does
not allow the large deployment based on the CHESTER solution for large urban areas, but the
use-scenarios based on neighbourhood communities that had infrastructures, as silos for fuel
tanks in the 60s-70s and now use natural gas, could be analysed. The integration of renewables
in buildings to reduce their demand may allow for the expansion of smaller CHESTER modules
in these facilities.
The acceptance of the public will be determined by the global cost of acquisition of energy
(€/MWh). Thus, the public administrations, should act as promoters, enabling that industrial
networks together with the current existing DHs, can be niche markets (ENGERATI, 2017).
Besides, the relaxation of the regulations in electrical production and consumption will be crucial
to be able to integrate the two sources and allow for increasing initial integration of the CHESTER
technology.
3.3.2. Denmark
The general trend seen in Denmark regarding the progressive phase-out of fossil fuel plants, high
and increasing share of fluctuating RES electricity, spreading use of DH, and the electrification

CHESTER PROJECT NO. 764042
D6.1: Detailed PESTEL and PORTER analysis of the CHEST system 95
of the heating and transport sector seems favourable to EES solutions and demand response
management.
According to the Danish TSO, the primary measures identified as the most suitable to guarantee
power system balancing and integration of more RES electricity are the following: expansion of
the interconnectors (especially towards the Norwegian PHS plants), reinforcement of the grid,
electrification of the DH sector (through electric boilers and heat pumps) and of the transport
sector, and downward regulation aided by low spot prices. Electricity storage would be a
secondary/later option, possibly in form of chemical storage, CAES, batteries (Energinet.dk,
2010). More recent studies have highlighted the importance of EES in the Danish energy system
(Allan Schrøder Pedersen et al., 2014; Sorknæs et al., 2014). Simulations on the possible future
energy mix —with high shares of wind electricity— have shown that EES would likely be required
(especially in West Denmark), even when considering the electrification of the heating sector
and unlimited transmission capacity to Germany (Sorknæs et al., 2014).
In this respect, the CHEST technology may prove to be an attractive EES option, offering large
capacities both in terms of energy and power. In fact, the Danish morphology prevents PHS from
being an option, while large-scale battery storage seems still a very expensive option at the
moment. Another advantage that the CHEST system could benefit from in the Danish context is
the spread availability of DH at relatively low supply and return temperatures, which could be
used respectively as a heat source and heat sink for the CHEST system.
However, the current taxation on stored electricity needs to be changed to favour EES
technologies. In fact, stored electricity is taxed twice (when purchased and when resold), which
is a barrier to a wider use of EES and reduces opportunities for demand-side flexibility in the
power system (IEA, 2017a).
3.3.3. Germany
The ambitious environmental and energy-related targets set by the German government will
entail a strong reduction in the use of fossil-fuel and an increase in the electricity production
from RES (especially wind and solar). Although fast-response gas-fired CHP plants are expected
to balance the fluctuating wind electricity production, the decarbonization and denuclearization
of the energy system seems favourable to EES solutions. Additionally, at a political and legislative
level there is the intention of improving the regulatory framework for EES.
Although Austria has large PHS systems, the interconnection capacity between the two
countries is limited and the PHS capacity is finite. Additionally, the transmission lines between
northern Germany (where most of the RES electricity is produced) and southern Germany
(where most of the electricity demand occurs) have proven insufficient and are currently under
expansion, which is not always welcomed by the local communities. In this respect, locally-based
and site-independent EES solutions may be very attractive, limiting the need for strengthening
and expanding the grid, as well as reducing transmission losses.
The EES technologies that have attracted more attention so far are batteries, power-to-gas and
hydrogen, and their combined market (although still rather small) is increasing rapidly. The
CHEST concept may find its space in this growing market, also taking advantage of the
interaction it can offer with the DH sector.
Regarding power-to-heat-to-power EES, it is relevant to mention the proof-of-system EES facility
which is currently close to being completed in Hamburg-Altenwerder. The concept of the

CHESTER PROJECT NO. 764042
D6.1: Detailed PESTEL and PORTER analysis of the CHEST system 96
project, developed by the company Siemens-Gamesa and funded by the German Ministry for
Economic Affairs and Energy, differs from the CHEST principle in several aspects (such as
temperature levels, components, working fluid, storage material), but both concepts are
examples of power-to-heat-to-power EES. Hence, this proof-of-system facility and the plan of
the Siemens Games to provide commercial solutions by 2021 are very encouraging for the
concept of this type of EES altogether (Siemens Gamesa, 2018).
3.3.4. Belgium
The situation of Belgium in relation to the possibilities offered by CHESTER are ambivalent.
Opportunities and challenges intersect equally.
The first aspect to consider is the strong nuclear dependence of the country. This dependence
is, in turn, at odds with the need to reduce the country's CO2 emissions. The phase out plans for
the Belgian nuclear power plants imply an increasing dependence on interconnections with
neighbouring countries. Likewise, the low availability of nuclear power plants in the most
necessary moments leads to an increase in the use of natural gas plants. Finally, the TSO must
manage demand peaks from the consumption side, complicating the management processes.
In this context, the CHESTER technology would allow for a reduction of the electrical and/or
thermal demand and be a support element to the TSO, from small to large scale. In the small
scale, it could allow for a reduction of the total electricity demand of the country and, on a large
scale, be able to act as peak demand management systems.
The need to increase interconnections reduces the country's investment capacity in other
energy aspects. The country's high dependence on L-gas from Groningen must be considered
and it will involve modifying infrastructures for the use of networks in H-gas mode. It is an
opportunity to drive investments to more distributed projects where the combination of DH and
CHESTER can go hand in hand.
In this sense, the obligations of NZEB buildings by the end of 2020 is another challenge and
opportunity to promote renewable energies. DH is developed very sparsely in the country, but
it has a great potential. The support of local regions, such as the Flemish, for these technologies
is an aspect to be emphasized. In this regard, important steps have been taken by the country
for the massive deployment of small-scale RES.
Finally, public surveys on the energy topic indicate a large support to RES and a fairly high
concern about the need of demand management and storage. Therefore, a social substrate
would support the deployment of the CHESTER technology.
3.3.5. The Netherlands
The Dutch energy system is tightly connected to, and strongly dependent on, neighbouring
countries. With a clear trend towards the increased use of intermittent, decentralized electricity
generation, as well as electrification, there exists an increasing need for flexibility, hence EES.
Several beneficial aspects of large-scale energy storage within the Dutch system can be
identified.
On sunny summer days, the wholesale electricity price is negative due to large-scale solar
electricity generation, both domestically and in e.g. Germany. Storing this electricity is beneficial
for ensuring that the business case for solar remains positive. Analogously, curtailment of wind
energy from the wind farms in the North Sea can be reduced or avoided altogether. Seasonal

CHESTER PROJECT NO. 764042
D6.1: Detailed PESTEL and PORTER analysis of the CHEST system 97
variations are expected to increase, although it is not expected that seasonal storage will
become economically feasible soon.
The application of EES for balancing and backup purposes appears attractive, in addition to, or
as replacement for, conventional gas-powered plants that are prevalent in the Netherlands. The
expected strong increase in the use of electric vehicles will help this application further.
However, the fact that the Dutch market is currently not capacity-based dampens this
development.
The current regulations and system of taxations do not properly value flexibility, as expressed
for instance by the fact that electricity is taxed more heavily than gas. The current government
plans to reverse this in the near future, however, improving the outlook for EES because of the
expected increased electrification, which is also one of the pillars of the 2018 energy accord. The
current system of offsetting residential consumption with production also strongly removes any
incentives for local storage. This system is also expected to end in the near future.
Uncertainty about the future economic viability of EES can pose a problem, created by e.g.
uneven government policies over the past 15 years, uncertain cost price development and
uncertainty about the balance between EES and possible choices for alternatives like demand
response (TU Delft 2015).

CHESTER PROJECT NO. 764042
D6.1: Detailed PESTEL and PORTER analysis of the CHEST system 98
3.4. Discussion
The countries considered in this report have different levels of penetration of RES in the
electricity generation mix: the Netherlands (12 %), Belgium (19 %), Germany (29%), Spain (34 %)
and Denmark (63 %). With respect to the CHEST technology, it is more relevant, however, to
consider the contribution to the energy production given by the non-dispatchable RES, such as
wind and solar. If only this type of RES is considered, the contribution to the electricity
production decreases, varying from 4 % in the case of the Netherlands to 45 % in the case of
Denmark.
According to the energy agendas, these countries have a common goal of decarbonization,
denuclearization of their electricity sectors and to considerably increase (up to 100 %) the
contribution of RES in the generation mix, although the timeline and methodology differs from
country to country. It can therefore be expected that the curtailment of RES electricity,
strengthening of the electric grid, EES and demand-side management will become increasingly
hot topics with the increase of the RES contribution to electricity generation.
Already, curtailment of non-dispatchable RES electricity has been increasingly adopted in these
countries, in times when the electricity production exceeds the demand and cannot be
transferred elsewhere due to bottlenecks in the electricity grid. A solution which can be adopted
to address this issue is the extension and reinforcement of the distribution and transmission
grid, as well as of the interconnectors with neighbouring countries. Currently, all the above-
mentioned countries are implementing and/or planning grid extensions.
Grid extensions are very expensive and may not be able to provide a definitive solution in the
long run, if most of the European countries increase the share of non-dispatchable renewable
electricity in their generation mix. This is probably why EES is currently a hot topic in the agendas
of several countries. Although the implementation of EES remains limited at the moment, mainly
due to economic and technical reasons, this is expected to rapidly increase in the coming years.
In this context, an EES technology such as CHEST may be a very interesting solution, as it
promises to be cost-effective and with a long lifetime (unlike many battery chemistries), site-
independent (unlike PHS and CAES), and environmentally and socially acceptable (unlike PHS).
An important aspect which should be addressed to favour the deployment of EES technologies
are the regulations that currently apply to these systems. The legal framework on how EES can
operate in the electricity market is often unclear, when not unfavourable. For example, EES is
currently seen as a consumer in the considered countries, hence, the stored electricity is taxed
twice: when absorbed by the EES and when used by the end-user. Additionally, due to energy
taxations and grid fees, the price of the electricity is higher when purchased by the operator of
the EES, compared to its price when the same electricity is sold. Therefore, the arbitrage model
(charging the EES when prices are low, and then discharging when prices are higher) appear to
be inadequate. The participation of EES in the reserve market seems more economically viable,
but in this case, obstacles also exist due to stringent requirements that the EES systems must
meet to operate in these markets, e.g. minimum capacity and response time.
Among the listed countries, Germany seems the country that is more oriented toward EES,
having invested significantly in R&D and implementation of EES technologies, such as power-to-
gas, power-to-hydrogen, batteries and even an EES system similar in principle to the CHEST
concept. Also, at a political level, there is willingness to change the current regulation on EES,
which at the moment does not favour its development. Already now, EES are exempted from

CHESTER PROJECT NO. 764042
D6.1: Detailed PESTEL and PORTER analysis of the CHEST system 99
paying grid tariffs and the EEG surcharge, when the electricity withdrawn from the network is
only re-fed with a delay into the same network.
Moreover, other countries, such as Denmark, Belgium and the Netherlands, have declared their
willingness to change legislation with respect to EES to favour their deployment. For example,
the Dutch government plans increase the taxation on natural gas and decrease that on electricity
in the near future, to improve the business models for EES solutions.
Of the considered countries, Denmark is that with the highest share of non-dispatchable RES in
the electricity generation mix, with almost 42 % of the electricity being produced by wind farms.
Additionally, the contribution of wind energy is expected to increase further in the coming years,
as new wind farms will be installed. Denmark plans to produce 100 % of its electricity from RES
by 2030. To cope with this increasing share of fluctuating RES generation, Denmark is investing
in the upgrade of its electricity grid and in new interconnectors. Although EES is mentioned in
the political agenda as a topic of interest, so far, no examples have been implemented. Demand
side management (central electric boilers, central and individual heat pumps), interconnection
to the Norwegian and Swedish PHS, and energy storage in electric vehicles are given a higher
priority, compared to large-scale inland EES.

CHESTER PROJECT NO. 764042
D6.1: Detailed PESTEL and PORTER analysis of the CHEST system 100
References ADHAC. (2017). CENSO DE REDES.
AGEB. (2018). Energy Consumption in Germany 2017. Retrieved from https://ag-energiebilanzen.de/index.php?article_id=29&fileName=ageb_jahresbericht2017_20180420_englisch.pdf
Allan Schrøder Pedersen, Brian Elmegaard, Claus Hviid Christensen, Claus Kjøller, Frank Elefsen, John Bøgild Hansen, … Thorkild Feldthusen Jensen. (2014). Status and recommendations for RD&D on energy storage technologies in a Danish context. Retrieved from https://ens.dk/sites/ens.dk/files/Forskning_og_udvikling/status_and_recommendations_for_rdd_on_energy_storage_technologies_in_a_danish_context_feb_2014.pdf
APPA. (2017). Estudio del impacto macroeconomico de las energias renovablesen España.
Appunn, K. (2018, April). The energy transition and Germany’s power grid. Clean Energy Wire. Retrieved from https://www.cleanenergywire.org/dossiers/energy-transition-and-germanys-power-grid
Appunn, K., & Russell, R. (2018, April). Set-up and challenges of Germany’s power grid. Clean Energy Wire. Retrieved from https://www.cleanenergywire.org/factsheets/set-and-challenges-germanys-power-grid
Arpagaus, C., Bless, F., Schiffmann, J., & Bertsch, S. S. (2017). Review on High Temperature Heat Pumps – Market Overview and Research Status. In International Workshop on High Temperature Heat Pumps. Copenhagen. Retrieved from https://www.researchgate.net/publication/319664298_Review_on_High_Temperature_Heat_Pumps_-_Market_Overview_and_Research_Status
Ateneo de Energia. (2018). VADEMECUM MERCADO ELECTRICO 2018.
Ayre, J. (2017). Tesla Completes World’s Largest Li-ion Battery (129 MWh) In South Australia. Retrieved July 11, 2018, from https://cleantechnica.com/2017/11/23/tesla-completes-worlds-largest-li-ion-battery-129-mwh-energy-storage-facility-south-australia-notfree/
Bardajií, M., Bauer, D., Bauer, T., Becker, B., Bedel, L., Bergins, C., … Crugnola, G. (2017). European Energy Storage Technology Development Roadmap Towards 2030 – Update. Retrieved from https://www.eera-set.eu/wp-content/uploads/2017.01.16_Update-of-the-EASE-EERA-ES-Technology-Development-Roadmap_for-public-consultation.pdf
Bava, F. (2017). Modeling of solar collector fields for solar heating plants in district heating systems. Technical University of Denmark.
Bayer, B., Matschoss, P., Thomas, H., & Marian, A. (2018). The German experience with integrating photovoltaic systems into the low-voltage grids. Renewable Energy, 119, 129–141. Retrieved from https://doi.org/10.1016/j.renene.2017.11.045
Bertsch, V., Hall, M., Weinhardt, C., & Fichtner, W. (2016). Public acceptance and preferences related to renewable energy and grid expansion policy: Empirical insights for Germany. Energy, 114, 465–477. Retrieved from http://dx.doi.org/10.1016/j.energy.2016.08.022
Bloomberg. (2017, November). Global Storage Market to Double Six Times by 2030. Bloomberg Terminal. Retrieved from https://about.bnef.com/blog/global-storage-market-double-six-times-2030/
Brautigam, A., Rothacher, T., Staubitz, H., & Trost, R. (2017). The Energy Storage Market in

CHESTER PROJECT NO. 764042
D6.1: Detailed PESTEL and PORTER analysis of the CHEST system 101
Germany 2017/2018. Retrieved from https://www.gtai.de/GTAI/Content/EN/Invest/_SharedDocs/Downloads/GTAI/Fact-sheets/Energy-environmental/fact-sheet-energy-storage-market-germany-en.pdf?v=9
Buchmann, M. (2018, April). German electricity market in 2017: records for battery storage and redispatch. Energy Post. Retrieved from http://energypost.eu/german-electricity-market-in-2017-records-for-battery-storage-and-redispatch/
CBS. (n.d.). Werkgelegenheid duurzame energiesector.
CNMC, C. N. de los M. y la C. (2018). No Title.
Colthorpe, A. (2018a, February). Enel builds first Germany project with Leclanché, ENERTRAG. Energy Storage News. Retrieved from https://www.energy-storage.news/news/enel-builds-first-germany-project-with-leclanche-enertrag
Colthorpe, A. (2018b, June). 50 MWh battery completed in Germany, claims Europe’s largest crown. Energy Storage News. Retrieved from https://www.energy-storage.news/news/50mwh-battery-completed-in-germany-claims-europes-largest-crown
Concere. (2017). PACTE ÉNERGÉTIQUE LA CONCERTATION ENTRE L’ETAT FÉDÉRAL ET LES RÉGIONS.
CREG. (2017). Study on the functioning and price evolution of the Belgian wholesale electricity market – monitoring report 2016.
Crotogino, F., Mohmeyer, K.-U., & Scharf, R. (2001). Huntorf CAES: More than 20 Years of Successful Operation. In Solution Mining Research Institute (SMRI). Retrieved from http://www.fze.uni-saarland.de/AKE_Archiv/AKE2003H/AKE2003H_Vortraege/AKE2003H03c_Crotogino_ea_HuntorfCAES_CompressedAirEnergyStorage.pdf
Danish Energy Agency. (2014). Analyse af elnettets funktionalitet. Retrieved from http://www.ens.dk/sites/ens.dk/files/undergrund-forsyning/el-naturgas-varmeforsyning/Energianalyser/nyeste/elnettet_-_analyse_2014_web.pdf
Danish Energy Agency. (2016a). Agreement of December 16th, 2016 on the energy companies’ energy savings effort between the minister for energy, utilities and climate and the network and distribution companies within the fields of electricity, natural gas, district heating and oil. Retrieved from https://ens.dk/ansvarsomraader/energibesparelser/energiselskabers-energispareindsats/energispareordningens-regler
Danish Energy Agency. (2016b). Bekendtgørelse af lov om elforsyning. Retrieved from https://www.retsinformation.dk/Forms/R0710.aspx?id=174909#id056d0df9-2d69-4043-a191-35011f01a0d7
Danish Energy Agency. (2016c). Regulation and planning of district heating in Denmark. Retrieved from https://ens.dk/sites/ens.dk/files/Globalcooperation/regulation_and_planning_of_district_heating_in_denmark.pdf
Danish Energy Agency. (2017). Energistatistik 2016. Retrieved from https://ens.dk/sites/ens.dk/files/Statistik/estat2016.pdf
Danish Energy Agency. (2018a). Grøn ordning. Retrieved June 18, 2018, from https://ens.dk/ansvarsomraader/stoette-til-vedvarende-energi/vindmoeller/groen-

CHESTER PROJECT NO. 764042
D6.1: Detailed PESTEL and PORTER analysis of the CHEST system 102
ordning
Danish Energy Agency. (2018b). Køberetsordningen. Retrieved June 18, 2018, from https://ens.dk/ansvarsomraader/stoette-til-vedvarende-energi/vindmoeller/koeberetsordningen
Danish Energy Agency. (2018c). PSO-tariffen for 2. kvartal 2018. Retrieved from https://ens.dk/sites/ens.dk/files/El/baggrundsnotat_vedr._pso-tarif_for_2._kvartal_2018.pdf
Danish Energy Agency. (2018d). Regulering af elområdet i Danmark. Retrieved May 28, 2018, from https://ens.dk/ansvarsomraader/el/regulering-af-elomraadet
Danish Energy Agency. (2018e). Støtte til anvendelse af biogas. Retrieved June 18, 2018, from https://ens.dk/ansvarsomraader/stoette-til-vedvarende-energi/biogas/stoette-til-anvendelse-af-biogas
Danish Energy Regulation Authority. (2018). Marked. Retrieved May 28, 2018, from http://energitilsynet.dk/el/marked/
Danish Government. (2011). Our Future Energy. Retrieved from https://stateofgreen.com/files/download/387
Danish Government. (2018). Energiaftale af 29 juni 2018. Retrieved from https://www.regeringen.dk/nyheder/energiaftale/
Danish Ministry of Energy Utilities and Climate. (2012). Aftale mellem regeringen (Socialdemokraterne, Det Radikale Venstre, Socialistisk Folkeparti) og Venstre, Dansk Folkeparti, Enhedslisten og Det Konservative Folkeparti om den danske energipolitik 2012-2020. Retrieved from http://efkm.dk/ministeriet/aftaler-og-politiske-udspil/energiaftalen-2020/
Danish Ministry of Energy Utilities and Climate. (2017). New Danish wind power record. Retrieved May 16, 2018, from http://en.efkm.dk/news/news-archive/2018/jan/new-danish-wind-power-record/
Danish Ministry of Taxation. (2016). Afgifts- og tilskudsanalysen på energiområdet - Delanalyse 1: Udviklingen i afgifts- og tilskudsgrundlag. Retrieved from http://www.skm.dk/media/1351877/afgifts-og-tilskudsanalysen-delanalyse-1_13052016.pdf
Danish Ministry of Taxation. (2018). Indeksering af energiafgifter. Retrieved July 4, 2018, from http://www.skm.dk/skattetal/beregning/afgiftsberegning/indeksering-af-energiafgifter
Du, D. P., & Lu, N. (2014). Energy Storage for Smart Grids: Planning and Operation for Renewable and Variable Energy Resources (VERs). San Diego (USA): Elsevier.
EA Energy Analysis, Energinet.dk, & Danish Energy Agency. (2017). Integration of Wind Power in Power Systems. Retrieved from https://ens.dk/sites/ens.dk/files/Globalcooperation/integration_of_wind_energy_in_power_systems.pdf
ECN. (2017). De winnaars en verliezers van de energietransitie.
Ecológica, M. para la T. (2017). Inventario de emisiones de gases de efecto invernadero de España.
Ecológica, M. para la T. (2018). Real Decreto-ley 20/2018, de 7 de diciembre, de medidas

CHESTER PROJECT NO. 764042
D6.1: Detailed PESTEL and PORTER analysis of the CHEST system 103
urgentes para el impulso de la competitividad económica en el sector de la industria y el comercio en España.
Edora. (2010). Plan d’action wallon sur les énergies renouvelables à l’horizon 2020.
Eller, A., & Dexter Gauntlett. (2017). Energy Storage Trends and Opportunities in Emerging Markets. Retrieved from https://www.ifc.org/wps/wcm/connect/ed6f9f7f-f197-4915-8ab6-56b92d50865d/7151-IFC-EnergyStorage-report.pdf?MOD=AJPERES
ENERGIAS RENOVABLES, E. periodismo de las energías limpias. (2018). Las redes de calor con biomasa se duplicarán en tres años.
Energinet.dk. (2010). Strategy Plan 2010. Retrieved from https://en.energinet.dk/About-our-reports/Reports/Strategy-Plan-2010
Energinet.dk. (2014). Støtteordringer for decentrale k/v anlæg og nødvendige omkonstninger til at være driftsklar. Retrieved from http://energitilsynet.dk/fileadmin/Filer/Hoeringer/EL/Bilag_4.pdf
Energinet.dk. (2018). Redegørelse for elforsyningssikkerhed 2018. Retrieved June 15, 2018, from https://energinet.dk/Om-publikationer/Publikationer/Redegorelse-for-elforsyningssikkerhed-2018
Energy Storage Association. (2018). Energy Storage Technologies. Retrieved July 11, 2018, from http://energystorage.org/energy-storage/energy-storage-technologies
ENGERATI. (2017). Spain gets its first hybrid wind power battery storage plant.
European Commission. (2016). Clean Energy For All Europeans.
European Commission. (2018). European Economic Forecast - Spring 2018. https://doi.org/10.2765/3931
Eurostat. (2017a). Electricity price statistics, second half 2017.
Eurostat. (2017b). Electricity price statistics. Retrieved May 17, 2018, from http://ec.europa.eu/eurostat/statistics-explained/index.php/Electricity_price_statistics
Eurostat. (2017c). Natural gas price statistics. Retrieved May 17, 2018, from http://ec.europa.eu/eurostat/statistics-explained/index.php/Natural_gas_price_statistics
Federal Public Service Economy. (2017). Energy Key Data 2016. Brussels.
Fraunhofer ISE. (2018). Energy charts. Retrieved August 8, 2018, from https://www.energy-charts.de
German Federal Network Agency. (2018). Leitungsvorhaben. Retrieved August 15, 2018, from https://www.netzausbau.de/leitungsvorhaben/de.html
German Ministry for Economic Affairs and Energy. (2015). An electricity market for Germany’s energy transition. Retrieved from www.bmwi.de
German Ministry for Economic Affairs and Energy. (2017a). An electricity grid for the energy transition. Retrieved August 13, 2018, from https://www.bmwi.de/Redaktion/EN/Dossier/grids-grid-expansion.html
German Ministry for Economic Affairs and Energy. (2017b). Electricity 2030: Long-term trends - tasks for the coming years. Retrieved from www.bmwi.de
German Ministry for Economic Affairs and Energy. (2017c). Renewable Energy Sources in Figures

CHESTER PROJECT NO. 764042
D6.1: Detailed PESTEL and PORTER analysis of the CHEST system 104
- National and International Development 2016. Retrieved from https://www.bmwi.de/Redaktion/EN/Publikationen/renewable-energy-sources-in-figures-2016.pdf?__blob=publicationFile&v=5
German Renewable Energies Agency. (2017). Acceptance of renewable energy in Germany. Retrieved August 15, 2018, from https://www.unendlich-viel-energie.de/english/acceptance-of-renewable-energy-in-germany
German Renewable Energies Agency. (2018). Bürgerenergie bleibt Schlüssel für erfolgreiche Energiewende (in German,. Retrieved August 15, 2018, from https://www.unendlich-viel-energie.de/buergerenergie-bleibt-schluessel-fuer-erfolgreiche-energiewende
Grøn Energi. (2017). Varmeprisstigninger for standardhuse når grundbeløbet udfases. Retrieved from http://www.danskfjernvarme.dk/groen-energi/analyser/051017-varmeprisstigninger-for-standardhuse-når-grundbeløbet-udfases
Hermeier, G., & Spiekermann, K. (2017). Germany Electricity Regulation. Retrieved August 17, 2018, from https://gettingthedealthrough.com/area/12/jurisdiction/11/electricity-regulation-germany/
ICAEN, I. C. D. L. E.-. (2017). No Title.
IEA. (2009). Energy Policies of IEA Countries: Spain.
IEA. (2013). Energy Policies of IEA Countries: Germany. Retrieved from http://www.iea.org
IEA. (2014). Energy policies of IEA countries - The Netherlands.
IEA. (2016a). Energy Policies of IEA Countries, Belgium.
IEA. (2016b). Spain Energy Report.
IEA. (2017a). Energy Policies of IEA Countries: Denmark. Retrieved from http://www.iea.org
IEA. (2017b). Germany - Energy System Overview. Retrieved from https://www.iea.org/media/countries/Germany.pdf
IEA. (2018). Statistics - Global energy data at your fingertips. Retrieved August 8, 2018, from http://www.iea.org/statistics
International Renewable Energy Agency. (2015). Battery Storage for Renewables : Market Status and Technology Outlook. Retrieved from http://www.irena.org/-/media/Files/IRENA/Agency/Publication/2015/IRENA_Battery_Storage_report_2015.pdf
International Renewable Energy Agency. (2017). Electricity Storage and Renewables: Costs and Markets to 2030. Retrieved from http://www.irena.org/-/media/Files/IRENA/Agency/Publication/2017/Oct/IRENA_Electricity_Storage_Costs_2017.pdf
International Renewable Energy Agency. (2018). Renewable Energy Capacity Statistics 2018. Retrieved from www.irena.org
Janzen, D., & Wippich, A. (2016). CMS Guide to Energy Storage: Germany. Retrieved August 28, 2018, from https://www.lexology.com/library/detail.aspx?g=88403c2f-8d88-4c39-a4ff-2aca0bac1b57
Joos, M., & Staffell, I. (2018). Short-term integration costs of variable renewable energy: Wind curtailment and balancing in Britain and Germany. Renewable and Sustainable Energy Reviews, 86, 45–65. Retrieved from https://doi.org/10.1016/j.rser.2018.01.009

CHESTER PROJECT NO. 764042
D6.1: Detailed PESTEL and PORTER analysis of the CHEST system 105
Jülch, V. (2016). Comparison of electricity storage options using levelized cost of storage (LCOS) method. Applied Energy, 183, 1594–1606. https://doi.org/10.1016/j.apenergy.2016.08.165
KPMG. (2015). Taxes and incentives for renewable energy.
Krick, E. (2018). Ensuring social acceptance of the energy transition. The German government’s ‘consensus management’ strategy. Journal of Environmental Policy and Planning, 20(1), 64–80. https://doi.org/10.1080/1523908X.2017.1319264
Lee, C., Kim, J. W., Yeom, S. C., & Kim, K. N. (2017). Global competitiveness analysis of energy storage system:model and index. Wiley Interdisciplinary Reviews: Energy and Environment, 6(1). https://doi.org/10.1002/wene.235
Lombardo, T. (2016). Massive 800 MegaWatt-hour Battery to Be Deployed in China. Retrieved July 11, 2018, from https://www.engineering.com/DesignerEdge/DesignerEdgeArticles/ArticleID/12312/Massive-800-MegaWatt-hour-Battery-to-Be-Deployed-in-China.aspx
Maisch, M. (2018). The weekend read: A watershed year for Belgium.
Market Research Reports. (2017). Belgium PESTEL analysis.
Ministry of Foreign Affairs of Denmark. (2015). A world-leader in wind energy. Retrieved from http://denmark.dk/en/green-living/wind-energy/
Montanuniversität Leoben. (2018). RICAS. Retrieved July 10, 2018, from http://www.ricas2020.eu/
Motivaction. (2016). Energievoorziening 2015-2050: publieksonderzoek naar draagvlak voor verduurzaming van energie.
Nordling, A., Englund, R., Hembjer, A., & Mannberg, A. (2016). Energy Storage - Electricity storage technologies. Retrieved from https://www.iva.se/globalassets/rapporter/vagval-el/201604-iva-vagvalel-ellagring-rapport-english-e-ny.pdf
Norton Rose Fulbright. (2017). Energy storage in Germany – what you should know. Retrieved August 28, 2018, from http://www.nortonrosefulbright.com/knowledge/publications/147129/energy-storage-in-germany-what-you-should-know
Novo, A. V., Bayon, J. R., Castro-Fresno, D., & Rodriguez-Hernandez, J. (2010). Review of seasonal heat storage in large basins: Water tanks and gravel–water pits. Applied Energy, 87(2), 390–397. https://doi.org/10.1016/j.apenergy.2009.06.033
Nucleaire, A. F. de C. (2017). Centrales nucléaires en Belgique.
ODG, O. del D. en la G.-. (2016). El coste real de la energía.
OECD. (2018a). Taxing Energy use 2018.
OECD. (2018b). Taxing Energy Use 2018 - Germany. OECD. Retrieved from https://www.oecd.org/tax/tax-policy/taxing-energy-use-2018-germany.pdf
Ohki, Y. (2016). Commencement of Operation of the World’s Largest Storage Battery Facility. IEEE Electrical Insulation Magazine, 33(1), 59–61. Retrieved from https://ieeexplore.ieee.org/stamp/stamp.jsp?arnumber=7804322
Partners, S. (2018). Energy pact Belgium: Cost analysis of the envisaged ambitions.

CHESTER PROJECT NO. 764042
D6.1: Detailed PESTEL and PORTER analysis of the CHEST system 106
Planbureau voor de Leefomgeving. (2017). Toekomstbeeld klimaatneutrale warmtenetten in Nederland.
Porter, K. (2017, May). Germany-Austria electricity zone to spilt due to renewable power spills into neighbouring grids. Watt-Logic. Retrieved from http://watt-logic.com/2017/05/24/german-electricity-grid/
Porter, M. E. (1979, March). How Competitive Forces Shape Strategy. Harvard Business Review.
PwC. (2017). A European comparison of electricity and gas prices for large industrial consumers.
REE, R. E. D. E.-. (2008). El Marco legal estable. Economía del sector eléctrico español 1988-1997.
REE, R. E. D. E.-. (2017). Informe del Sistema Eléctrico Español.
Regal, M. C. (2012). ANÁLISIS DEL SECTOR ELÉCTRICO ESPAÑOL Y PROPUESTAS DE DESARROLLO FUTURO.
RESCOOP.EU. (n.d.). REScoop 20-20-20 Best practices Report I.
Sandia National Laboratories. (2018). DOE Global Energy Storage Database. Retrieved July 12, 2018, from http://www.energystorageexchange.org
Scholz, U., & Ante, J. (2018). Electricity regulation in Germany: overview. Retrieved from https://uk.practicallaw.thomsonreuters.com/5-524-0808?transitionType=Default&contextData=(sc.Default)&firstPage=true&comp=pluk&bhcp=1
Siemens Gamesa. (2018). Thermal energy storage with ETES. Retrieved November 21, 2018, from https://www.siemensgamesa.com/en-int/products-and-services/hybrid-and-storage/thermal-energy-storage-with-etes
Smallbone, A., Jülch, V., Wardle, R., & Roskilly, A. P. (2017). Levelised Cost of Storage for Pumped Heat Energy Storage in comparison with other energy storage technologies. Energy Conversion and Management, 152, 221–228. https://doi.org/10.1016/j.enconman.2017.09.047
Sociaal Economische Raad. (2018). Energietransitie en werkgelegenheid.
Sorknæs, P., Mæng, H., Weiss, T., & Andersen, A. N. (2014). Overview of current status and future development scenarios of the electricity system in Denmark – allowing integration of large quantities of wind power. Retrieved from https://www.store-project.eu/documents/target-country-results/en_GB/energy-storage-needs-in-denmark
Stoneman, P. (2016). Upgrading the utility business model with smart services.
Sveinbjörnsson, D., Trier, D., Hansen, K., & Mathiesen, B. V. (2018). Technical and Economic Potential of Distributed Energy Storages for the Integration of Renewable Energy Prepared as a part of IEA ECES Annex 28: Distributed Energy Storage for the Integration of Renewable Energy (DESIRE). Retrieved from http://planenergi.dk/wp-content/uploads/2018/05/PlanEnergi-and-Aalborg-University-Technical-and-Economic-Potential-of-Distributed-Energy-Storages-full-report.pdf
Tartière, T., & Astolfi, M. (2017). A World Overview of the Organic Rankine Cycle Market. Energy Procedia, 129, 2–9. https://doi.org/10.1016/J.EGYPRO.2017.09.159
Technopolis Group. (2016). Country Study - Belgium.
TenneT. (2018). Market Review 2017 – Electricity market insights. Retrieved from

CHESTER PROJECT NO. 764042
D6.1: Detailed PESTEL and PORTER analysis of the CHEST system 107
https://www.ensoc.nl/files/20180405-market-review-2017-bron-tennet.pdf
Tortzen, A. (2012). Kampen om vindmøllerne. Danske Kommuner (12/04/2012). Retrieved from http://www.danskekommuner.dk/Blog/Anne-Tortzen/Kampen-om-vindmollerne/
UNFCCC. (n.d.). About us Process and meetings The Kyoto Protocol Mechanisms under the Kyoto Protocol UNFCCC Nav Mechanisms under the Kyoto Protocol.
United Nations. (2018). The Sustainable Development Goals.
Weiß, M., Welke, M., Salb, C., Gül, S., Cuntz, C., Monschauer, Y., & Beyschlag, L. (2017). Climate Action in Figures: Facts, Trends and Incentives for German Climate Policy 2017. Retrieved from www.bmub.bund.de/english
World Nuclear Association. (2018). Nuclear Power in Germany. Retrieved August 13, 2018, from http://www.world-nuclear.org/information-library/country-profiles/countries-g-n/germany.aspx
Zart, N. (2017). Batteries Keep On Getting Cheaper. Retrieved July 11, 2018, from https://cleantechnica.com/2017/12/11/batteries-keep-getting-cheaper/
Zunft, S., Dreißigacker, V., Bieber, M., Banach, A., Klabunde, C., & Warweg, O. (2017). Electricity storage with adiabatic compressed air energy storage : Results of the BMWi-project ADELE-ING System configurations Heat storage. In International ETG Congress 2017 (pp. 448–452). Bonn (Germany).