detailed project report (dpr) iwmp-21...
TRANSCRIPT

GUJARAT STATE WATERSHED MANAGEMENT AGENCY
DETAILED PROJECT REPORT (DPR)
IWMP-21 (FOTDI) IWMP-2010-11

Contents Table no.1: Basic project information ...................................................................................................................................................................................................................................... 5
Table no.2: Weightage of the project ........................................................................................................................................................................................................................................ 5
Table no.3: Watershed information .......................................................................................................................................................................................................................................... 7
Table no.4: Developmental programmes running in the project area: .......................................................................................................................................................................... 7
Table no. 5: Previous Watershed programmes in the project area: ............................................................................................................................................................................... 8
Table no. 6: PIA: ............................................................................................................................................................................................................................................................................... 8
Table no. 7: Staff at PIA level: ...................................................................................................................................................................................................................................................... 8
Table no. 8: Land use pattern:..................................................................................................................................................................................................................................................... 9
Table no. 9: Soil type and topography: ..................................................................................................................................................................................................................................... 9
Table no. 10: Flood and drought condition: ........................................................................................................................................................................................................................... 9
Table no. 11.1: Soil Erosion ......................................................................................................................................................................................................................................................... 9
Table no. 11.2: Soil Salinity/Alkalinity (Salinity ingress) ............................................................................................................................................................................................... 10
Table no. 11.3: Waterlogging Conditions ............................................................................................................................................................................................................................. 10
Table no. 12: Climatic conditions:........................................................................................................................................................................................................................................... 10
Table no. 13: Physiography and relief ................................................................................................................................................................................................................................... 10
Table no. 14: Land ownership details.................................................................................................................................................................................................................................... 10
Table no. 15: Agriculture ........................................................................................................................................................................................................................................................... 11
Table no. 16: Irrigation............................................................................................................................................................................................................................................................... 11
Table no. 17: Crop details: ......................................................................................................................................................................................................................................................... 11
Table no. 18: Livestock ............................................................................................................................................................................................................................................................... 12
Table no. 19: Drinking water .................................................................................................................................................................................................................................................... 12
Table no. 20: Details of Common Property Resources ..................................................................................................................................................................................................... 12

Table no. 21: Demographic information ............................................................................................................................................................................................................................... 13
Table no. 22: Literacy rate ........................................................................................................................................................................................................................................................ 14
Table no. 23: Migration details ................................................................................................................................................................................................................................................ 14
Table no. 24: Poverty .................................................................................................................................................................................................................................................................. 14
Table no. 25: Village infrastructure........................................................................................................................................................................................................................................ 14
Table no. 26 : Facilities / HH assets ....................................................................................................................................................................................................................................... 15
Table no. 27: Income ................................................................................................................................................................................................................................................................... 15
Table no.28: Dependence on Forest/CPR ............................................................................................................................................................................................................................ 15
Table no. 29: Livelihood pattern (Occupational distribution)....................................................................................................................................................................................... 15
Table no. 30: Details of Scientific Planning and Inputs in IWMP projects* ............................................................................................................................................................... 16
Table no. 31: Watershed Committee details ....................................................................................................................................................................................................................... 19
Table no. 32: SHG detail ............................................................................................................................................................................................................................................................. 21
Table no. 33: UG detail................................................................................................................................................................................................................................................................ 22
Table no.34: Entry point activities (EPA) (All financial figures in lakh Rs.).............................................................................................................................................................. 23
Table no.35: Details of activities of preparatory phase (All financial figures in lakh Rs.) ................................................................................................................................... 17
Table no.36: Activities related to Surface water resources in the project areas (all financial figures in lakh Rs.) ....................................................................................... 24
Table no.37: Activities related to recharging ground water resources in the project areas (all financial figures in lakh Rs.) ................................................................. 27
Table no. 38: Activities related to livelihoods by Self Help Groups (SHGs) in the project areas ........................................................................................................................ 28
Table no. 39: Other activities of watershed works phase – Proposed target .................................................................................................. Error! Bookmark not defined.
Table no.40: Details of engineering structures in watershed works* ................................................................................................................ Error! Bookmark not defined.
Table no.41: Details of activities connected with vegetative cover in watershed works ..................................................................................................................................... 29
Table no.42: Details of allied / other activities ................................................................................................................................................................................................................... 27
Table no.43: Details of activities in the CPRs in the project areas................................................................................................................................................................................ 29
Table no. 44: Capacity Building Institution: ........................................................................................................................................................................................................................ 30

Table no. 45: Capacity Building plan: .................................................................................................................................................................................................................................... 30
Table no.46: Information, education and Communication Activities: ........................................................................................................................................................................ 30
Table no. 47: Village wise- activity wise budget ................................................................................................................................................................................................................ 31
Table no. 48: Budget at a glance .............................................................................................................................................................................................................................................. 31
Table no.49: Details of Convergence of IWMP with other Schemes ............................................................................................................................................................................ 32
Table no. 50: Public-Private Partnership in the IWMP projects* ................................................................................................................................................................................. 32
Table no. 51: Employment in Project area:.......................................................................................................................................................................................................................... 34
Table no. 52: Details of seasonal migration from Project area ...................................................................................................................................................................................... 34
Table no. 53: Details of average ground water table depth in the project areas (in meters) .............................................................................................................................. 34
Table no. 54: Status of Drinking water* ................................................................................................................................................................................................................................ 33
Table no. 55: Details of Kharif crop area and yield in the project areas ..................................................................................................................................................................... 33
Table no. 56: Area under horticulture ................................................................................................................................................................................................................................... 33
Table no. 57: Forest/vegetative cover ........................................................................................................................................................................ Error! Bookmark not defined.
Table no. 58: Details of livestock in the project areas * (for fluids please mention in litres, for solids please mention in kgs. and income in Rs.) .......................... 34
Table no. 59: Backward-Forward linkages .......................................................................................................................................................................................................................... 35

Table no.1: Basic project information
Sr. No.
Name of the project
Villages Gram Panchayats Taluka District Area of the
project
Area proposed to be treated
Total project
cost PIA Name Census
code 1 IWMP-21 Fotadi 00043700 Fotadi Bhuj Kutch 2638 Ha. 2138 Ha. 32070000 DWDU,Bhuj-
Kutch 2 Nagiyari 00045300 Nagiyari Bhuj
Area proposed to be treated Table no.2: Weightage of the project
Project name
Project type Weightage
IWMP-21
Hilly/ Desert
i ii iii iv v vi vii viii ix x xi xii xiii 7.5 3.0 5.0 5.0 3.0 15.0 15.0 5.0 15.0 10.0 10.0 15.0 15.0
Table no. 2.1 Criteria and weightage for selection of watershed
Sr. No. Criteria Maximum
Scores Range & Scores
1 Poverty index (% of poor to population)
10 Above 80 % (10) 80 to 50 % (7.5) 50 to 20 % (5) Below 20 -2.5%
2 % of SC/ ST population
10 More than 40 % (10) 20 to 40 % (5) Less than 20 % (3)
3
Actual wages 5 Actual wages are significantly lower
than minimum wages (5)
Actual wages are equal to or higher than
minimum wages (0)
4 % of small and
marginal Farmers 10 More than 80 % (10) 50 to 80 % (5) Less than 50 % (3)
5 Ground water status 5 Over exploited (5) Critical (3) Sub critical (2) Safe (0)

6 Moisture index/
DPAP/ DDP Block 15 . -66.7 & below (15)
DDP Block .-33.3 to -66.6 (10)
DPAP Block 0 to -33.2 (0) Non DPAP/ DDP Block
7 Area under rain-fed
Agriculture 15 More than 90 % (15) 80 to 90 % (10) 70 to 80% (5) Above 70 %
(Reject)
8 Drinking water 10 No source (10) Problematic village
(7.5) Partially covered
(5) Fully covered
(0)
9 Degraded land 15 High – above 20 %
(15) Medium – 10 to 20 %
(10) Lawless than 10 %
of TGA (5)
10 Productivity potential of the land 15
Lands with low production & where productivity can be
significantly enhanced with
reasonable efforts (15)
Lands with moderate production & where productivity can be
enhanced with reasonable efforts (10)
Lands with high production &
where productivity can be marginally
enhanced with reasonable efforts
(5)
11
Contiguity to another watershed
that has already been developed/
treated
10
Contiguous to previously treated
watershed & contiguity within the micro watersheds in
the project (10)
Contiguity within the micro watersheds in the
project but non contiguous to
previously treated watershed (5)
Neither contiguous to previously
treated watershed nor contiguity
within the micro watersheds in the
project (0)
12
Cluster approach in the plains (more
than one contiguous micro watersheds in
the project)
15 Above 6 micro-watersheds in
cluster (15)
4 to 6 micro watersheds in cluster (10)
2 to 4 micro watersheds in
cluster (5)
Area is hilly, therefore, not
applicable
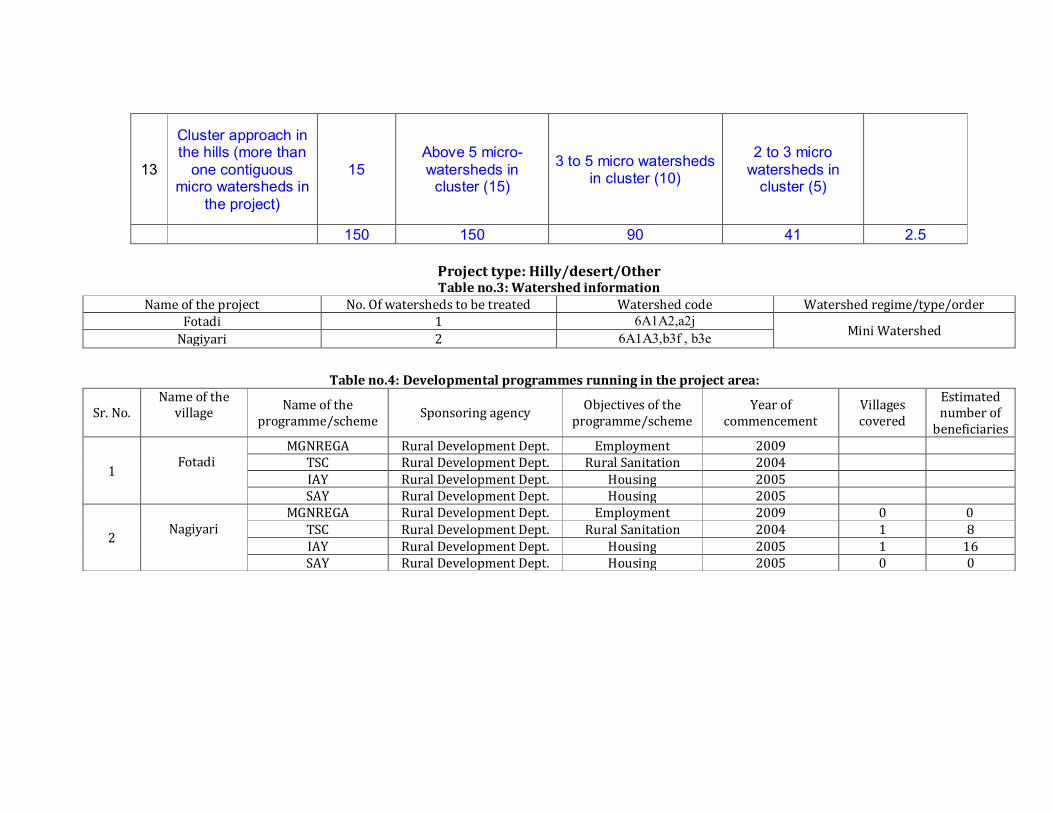
13
Cluster approach in the hills (more than
one contiguous micro watersheds in
the project)
15 Above 5 micro-watersheds in
cluster (15)
3 to 5 micro watersheds in cluster (10)
2 to 3 micro watersheds in
cluster (5)
150 150 90 41 2.5
Project type: Hilly/desert/Other Table no.3: Watershed information
Name of the project No. Of watersheds to be treated Watershed code Watershed regime/type/order Fotadi 1 6A1A2,a2j
Mini Watershed Nagiyari 2 6A1A3,b3f , b3e
Table no.4: Developmental programmes running in the project area:
Sr. No. Name of the
village Name of the programme/scheme Sponsoring agency Objectives of the
programme/scheme Year of
commencement Villages covered
Estimated number of
beneficiaries
1
Fotadi
MGNREGA Rural Development Dept. Employment 2009 TSC Rural Development Dept. Rural Sanitation 2004 IAY Rural Development Dept. Housing 2005 SAY Rural Development Dept. Housing 2005
2
Nagiyari
MGNREGA Rural Development Dept. Employment 2009 0 0 TSC Rural Development Dept. Rural Sanitation 2004 1 8 IAY Rural Development Dept. Housing 2005 1 16 SAY Rural Development Dept. Housing 2005 0 0
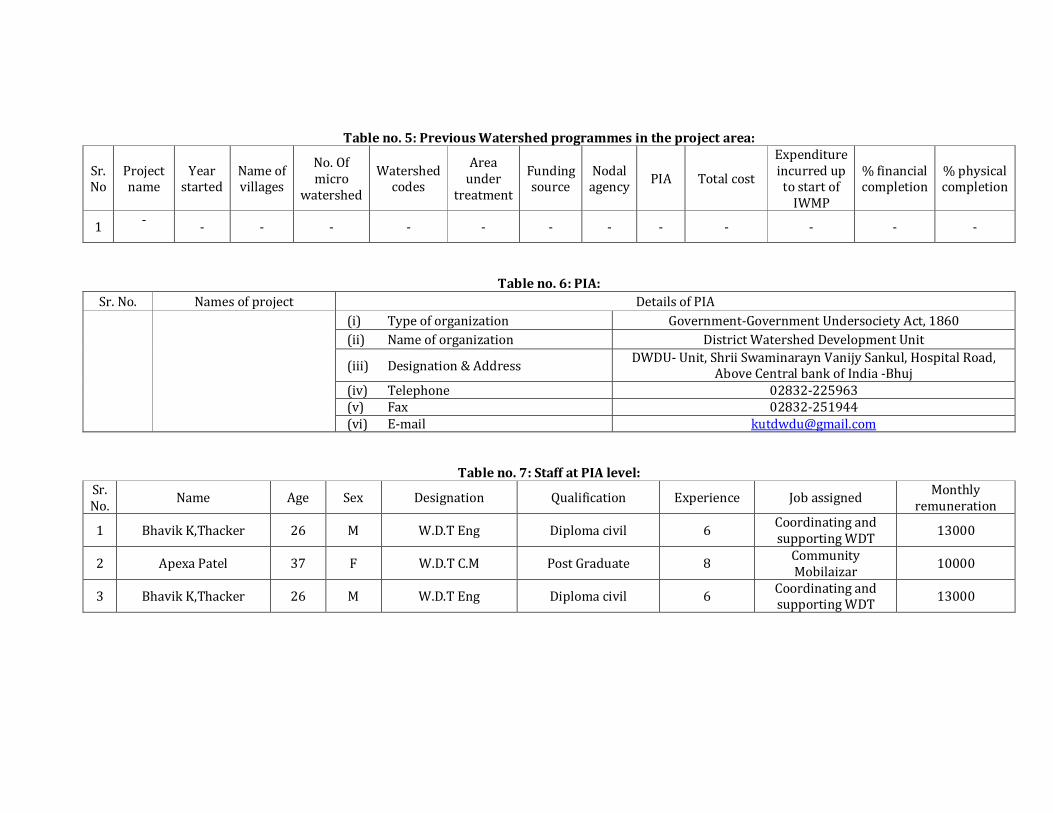
Table no. 5: Previous Watershed programmes in the project area:
Sr. No
Project name
Year started
Name of villages
No. Of micro
watershed
Watershed codes
Area under
treatment
Funding source
Nodal agency PIA Total cost
Expenditure incurred up to start of
IWMP
% financial completion
% physical completion
1 - - - - - - - - - - - - -
Table no. 6: PIA: Sr. No. Names of project Details of PIA
(i) Type of organization Government-Government Undersociety Act, 1860 (ii) Name of organization District Watershed Development Unit
(iii) Designation & Address DWDU- Unit, Shrii Swaminarayn Vanijy Sankul, Hospital Road, Above Central bank of India -Bhuj
(iv) Telephone 02832-225963 (v) Fax 02832-251944 (vi) E-mail [email protected]
Table no. 7: Staff at PIA level: Sr. No. Name Age Sex Designation Qualification Experience Job assigned Monthly
remuneration
1 Bhavik K,Thacker 26 M W.D.T Eng Diploma civil 6 Coordinating and supporting WDT 13000
2 Apexa Patel 37 F W.D.T C.M Post Graduate 8 Community Mobilaizar 10000
3 Bhavik K,Thacker 26 M W.D.T Eng Diploma civil 6 Coordinating and supporting WDT 13000

Table no. 8: Land use pattern:
Sr. No. Names of villages
Geographical Area of the village Forest Area Land under
agricultural use Rainfed area Perm-anent pastu-res
Wasteland Cultivable Non-cultivable
1 Fotadi 1525.00 0.00 43.00 43.00 0.00 783.00 699.00 2 Nagiyari 1113.00 0.00 571.00 571.00 0.00 159.00 384.00
Total 2638.00 0.00 614.00 614.00 0.00 942.00 1083.00
Table no. 9: Soil type and topography:
Sr. No. Name of the Agro-climatic zone covers project area Area in ha Names of the villages
Major soil types Topo-graphy a)Type b) Area in ha
1 Semi arid 2638 Fotadi Sandy 1525
Undulating Nagiyari Sandy 1113 # Flat, undulating, moderate slope, Steep slope
Table no. 10: Flood and drought condition: Sr. No. Village Flood (Incidence) Drought (Incidence)
1 Fotadi No Every 3 Year 2 Nagiyari No Every 3 Year
11. Edaphic Factors Table no. 11.1: Soil Erosion
Cause Type of erosion Area affected (ha) Run off (mm/ year)
Average soil loss (Tonnes/ ha/ year)
Water erosion A Sheet 802.02 10.20
9.22 11.20
0.11 0.18 0.13
B Rill 382.45 C Gully 619.23
Sub-Total 1803.70 30.62 0.42 Wind erosion 1082.20 NA 0.30
Total 2885.90 30.62 0.72

Table no. 11.2: Soil Salinity/Alkalinity (Salinity ingress)
Name of the Village Survey Number Soil pH Type of Salinity (Inherent/Ingress)
Fotadi,Nagiyari Peripheral Govt. & Pvt. SV no. 9.4 Ingress
Table no. 11.3: Waterlogging Conditions Name of the Village Survey Number Reasons
Fotadi,Nagiyari No No
Table no. 12: Climatic conditions: Name of project Average rainfall- last 5 years Average temperature
IWMP-21 517 Summer Winter
Max Min Max Min 43 23 28 3
Table no. 13: Physiography and relief Project name Elevation (Mtr) Slope range (%) Major streams
Fotadi 15 8 to 10 Sangvaro 12 10 to 12 Katora 20 7 to 9 Parodavaro
Nagiyari 23 7 to 10 Kateswar 17 5 to 8 Changdai 14 4 to 7 Gayavaro
Table no. 14: Land ownership details Sr. No. Village Total owned land HHs giving land
on lease HHs taking land
on lease Gen OBC SC ST 1 Fotadi 113 0 11 0 0 0 2 Nagiyari 106 0 5 0 0 0
Total 219 0 16 0 0 0

Table no. 15: Agriculture Sr. No. Village Net sown area
One time Two times Three times 1 Fotadi 389 42 0 2 Nagiyari 253 25 0
Table no. 16: Irrigation
Sr. No Village
Source 1 : Canal Source 2 : Check dam / Pond Source 3 : Well Availability
months Net area Gross area Availability months Net area Gross area Availability
months Net area Gross area
1 Fotadi 0 0 0 0 0 0 6 Month 42 42 2 Nagiyari 0 0 0 0 0 0 6 Month 25 25
Table no. 17: Crop details:
Sr. No Village Kharif (Monsoon)
Crop 1 Guvar Crop 2 Mag Crop 3 Magfali Area Production Productivity Area Production Productivity Area Production Productivity
1 Fotadi 156 19075 122.27 130.88 13965 106.70 77.08 13275 172.22 2 Nagiyari 65.10 6030 92.62 15.57 7360 472.70 6.99 3250 464.94
Sl no Village Rabi (Winter)
Crop 1 Wheet Crop 2 Isabgul Crop 3 Area Production Productivity Area Production Productivity Area Production Productivity
1 Fotadi 35 2365 67.57 7 524 74.85 - - - 2 Nagiyari 25 2021 80.84 - - - - - -
Sl no Village Zaid (Summer)
Crop 1 Crop 2 Crop 3 Area Production Productivity Area Production Productivity Area Production Productivity
1 Fotadi - - - - - - - - - 2 Nagiyari - - - - - - - - -

Table no. 18: Livestock Sr. No. Village Buffalo Cow Total Milk
(Buffalo+Cow) Goat Sheep Bullock Hen Others No milk No Milk No Milk
1 Fotadi 175 42 314 335 377 656 40 50 4 0 122 2 Nagiyari 114 426 217 1024 1250 1363 200 21 7 0 129
Total 289 468 531 1359 1627 2019 240 71 11 0 251
Table no. 19: Drinking water
Sr. No. Village Ground water table (mt) Source of drinking water Availability in months Quality
1 Fotadi 117 Bore Well 12 Medium 2 Nagiyari 110 Bore Well 12 Medium
Table no. 20.1: Fotadi Details of Common Property Resources
Sr. No.
Names of project
CPR Particulars
Total Area (ha) Area owned/ In possession of Area available for treatment (ha)
Pvt. persons Govt.
(specify deptt.)
PRI Any other (Pl. Specify)
Pvt. persons
Govt. (specify deptt.)
PRI Any other (Pl. Specify)
1 Fotadi
Wasteland/ degraded land - 1309 - - - 1309 - - Pastures - - 27.69 - - - 27.69 - Orchards - - - - - - - - Village Woodlot - - - - - - - - Forest - - - - - - - - Village Ponds/ Tanks - 3 - - - 3 - Community Buildings 1 2 2 - - - - - Weekly Markets - - - - - - - - Permanent markets - - - - - - - - Temples/ Places of worship - - - - - - - - Others (Pl. specify) (Smashan) - - 2 - - - - -

Table no. 20.2 : Nagiyari Details of Common Property Resources
Sr. No.
Names of project
CPR Particulars
Total Area (ha) Area owned/ In possession of Area available for treatment (ha)
Pvt. persons Govt.
(specify deptt.)
PRI Any other (Pl. Specify)
Pvt. persons
Govt. (specify deptt.)
PRI Any other (Pl. Specify)
2 Nagiyari
Wasteland/ degraded land - 604 - - - 604 - - Pastures - - 0.84 - - - 0.84 - Orchards - - - - - - - - Village Woodlot - - - - - - - - Forest - - - - - - - - Village Ponds/ Tanks - - 3 - - - 3 - Community Buildings 1 2 2 - - - 1 - Weekly Markets - - - - - - - - Permanent markets - - - - - - - - Temples/ Places of worship - - - - - - - - Others (Pl. specify) (Smashan) - - 0.02 - - - - -
Table no. 21: Demographic information
Sr. No. Village Population SC ST
Total Male Female Total Male Female % Total Male Female % 1 Fotadi 478 254 224 112 60 52 23.43 0 0 0 0 2 Nagiyari 336 180 156 0 0 0 0 0 0 0 0
Total 814 434 380 112 60 52 13.75 0 0 0 0
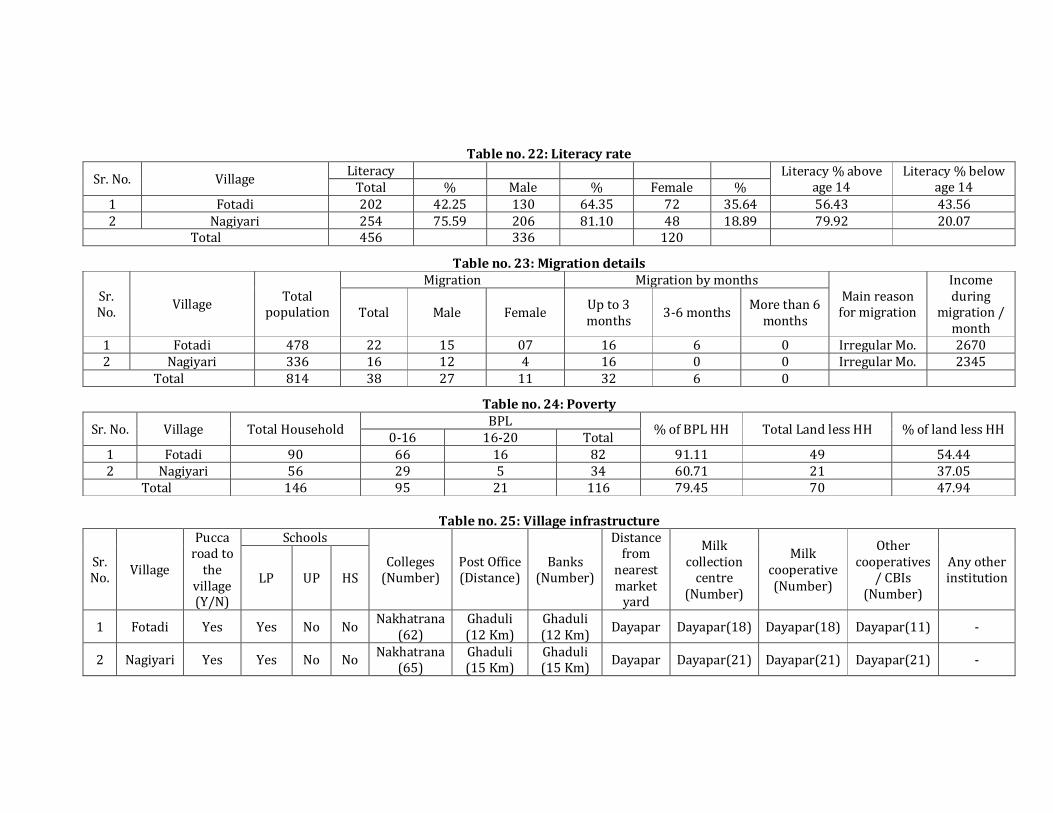
Table no. 22: Literacy rate
Sr. No. Village Literacy Literacy % above age 14
Literacy % below age 14 Total % Male % Female %
1 Fotadi 202 42.25 130 64.35 72 35.64 56.43 43.56 2 Nagiyari 254 75.59 206 81.10 48 18.89 79.92 20.07
Total 456 336 120
Table no. 23: Migration details
Sr. No. Village Total
population
Migration Migration by months Main reason
for migration
Income during
migration / month
Total Male Female Up to 3 months 3-6 months More than 6
months
1 Fotadi 478 22 15 07 16 6 0 Irregular Mo. 2670 2 Nagiyari 336 16 12 4 16 0 0 Irregular Mo. 2345
Total 814 38 27 11 32 6 0
Table no. 24: Poverty
Sr. No. Village Total Household BPL % of BPL HH Total Land less HH % of land less HH 0-16 16-20 Total 1 Fotadi 90 66 16 82 91.11 49 54.44 2 Nagiyari 56 29 5 34 60.71 21 37.05
Total 146 95 21 116 79.45 70 47.94
Table no. 25: Village infrastructure
Sr. No. Village
Pucca road to
the village (Y/N)
Schools
Colleges (Number)
Post Office (Distance)
Banks (Number)
Distance from
nearest market
yard
Milk collection
centre (Number)
Milk cooperative (Number)
Other cooperatives
/ CBIs (Number)
Any other institution LP UP HS
1 Fotadi Yes Yes No No Nakhatrana (62)
Ghaduli (12 Km)
Ghaduli (12 Km) Dayapar Dayapar(18) Dayapar(18) Dayapar(11) -
2 Nagiyari Yes Yes No No Nakhatrana (65)
Ghaduli (15 Km)
Ghaduli (15 Km) Dayapar Dayapar(21) Dayapar(21) Dayapar(21) -

Table no. 26 : Facilities / HH assets
Sr. No. Village HHs with electricity
HHs with
safety latrines
HHs with phones HHs with vehicle HHs with
TV set
HHs with
cooking gas
HHs with
Drinking water
HHs with
freedge Land line Mobile 2-wheeler 4-wheeler
1 Fotadi 155 121 0 148 86 10 155 0 157 149 2 Nagiyari 221 69 0 201 35 3 157 0 223 9
Table no. 27: Per capita Income Sr. No. Village Agriculture Forestry Animal
husbandry Casual labour Services Handicraft Others Total
1 Fotadi 57.50 0.00 36.85 37.80 9.00 2.34 34.70 178.19 2 Nagiyari 48.55 0.00 19.85 23.47 2.90 1.03 28.00 123.8
Total 106.05 0.00 56.70 61.27 11.90 3.37 62.70 301.99
Table no.28: Dependence on Forest/CPR
Sr. No. Village Benefit type 1 Benefit type 2 Benefit type 2 Total income % sells Income % sells Income % sells Income 1 Fotadi - - - - - - - 2 Nagiyari - - - - - - -
Table no. 29: Livelihood pattern (Occupational distribution)
Sr. No. Village Total
workforce Agriculture Animal
husbandry (AH)
Agriculture + AH
Casual labour Services Handicraft Others
1 Fotadi 195 32 54 16 57 2 27 7 2 Nagiyari 128 20 25 12 54 3 8 6
Total 323 52 79 28 111 5 35 13

Table no. 30: Details of Scientific Planning and Inputs in IWMP projects
S. No. Scientific criteria/ inputs used Whether scientific criteria was used
(A) Planning Cluster approach Yes Whether technical back-stopping for the project has been arranged? If yes, mention the name of the Institute KVK, Agriculture Uni. ,BISAG
Baseline survey Yes Hydro-geological survey Yes Contour mapping Yes Participatory Net Planning (PNP) Yes Remote sensing data-especially soil/ crop/ run-off cover Yes Ridge to Valley treatment Yes Online IT connectivity between (1) Project and DRDA cell/ZP Yes (2) DRDA and SLNA Yes (3) SLNA and DoLR Yes Availability of GIS layers 1. Cadastral map Yes 2. Village boundaries Yes 3. Drainage Yes 4. Soil (Soil nutrient status) Yes 5. Land use Yes 6. Ground water status Yes 7. Watershed boundaries Yes 8. Activity No Crop simulation models# No Integrated coupled analyzer/ near infrared visible spectroscopy/ medium spectroscopy for high speed soil nutrient analysis No
Normalized difference vegetation index (NDVI)# No
Weather Station Yes
(B) Inputs
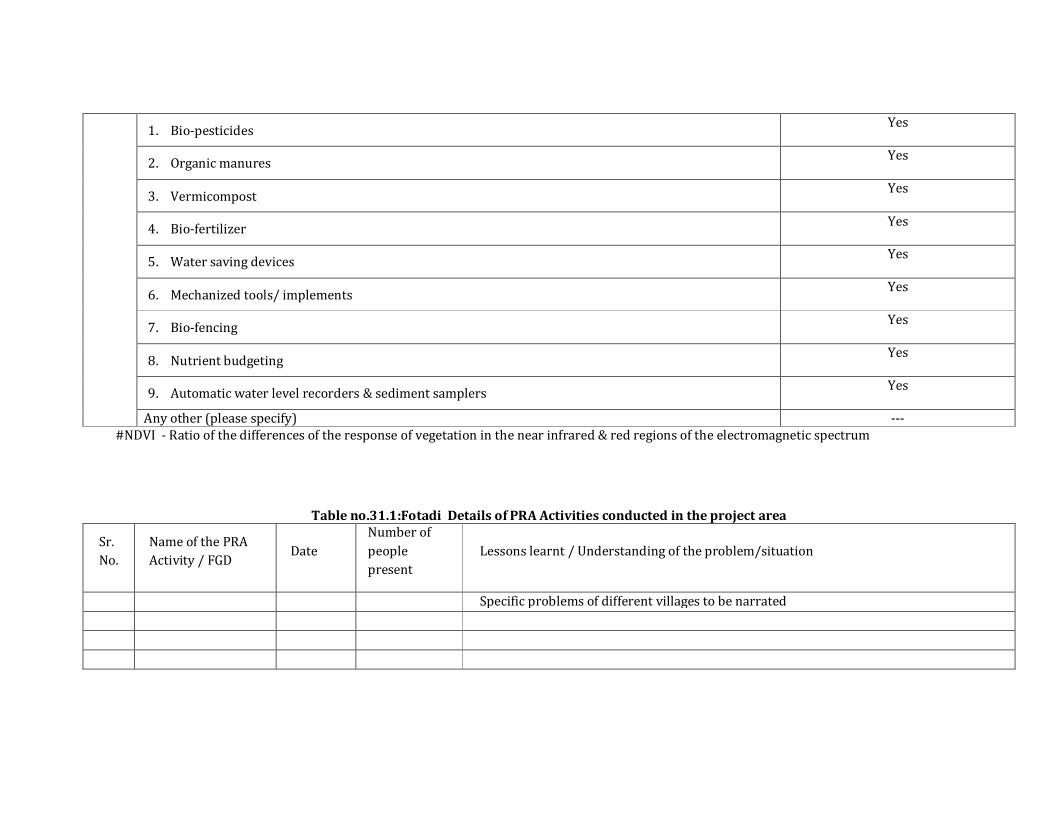
1. Bio-pesticides Yes
2. Organic manures Yes
3. Vermicompost Yes
4. Bio-fertilizer Yes
5. Water saving devices Yes
6. Mechanized tools/ implements Yes
7. Bio-fencing Yes
8. Nutrient budgeting Yes
9. Automatic water level recorders & sediment samplers Yes
Any other (please specify) --- #NDVI - Ratio of the differences of the response of vegetation in the near infrared & red regions of the electromagnetic spectrum
Table no.31.1:Fotadi Details of PRA Activities conducted in the project area
Sr. No.
Name of the PRA Activity / FGD
Date Number of people present
Lessons learnt / Understanding of the problem/situation
Specific problems of different villages to be narrated

Table no.31.2:Nagiyari Details of PRA Activities conducted in the project area
Sr. No.
Name of the PRA Activity / FGD
Date Number of people present
Lessons learnt / Understanding of the problem/situation
Specific problems of different villages to be narrated PRA 3/06/11 55
Note:
1. After this table, add the problem tree analysis 2. Then add the object tree analysis

Table no. 32.1: Fotadi Watershed Committee details
Sr.. No.
Names of WCs
Date of Registration as a Society (dd/mm/
yyyy)
Designation
Name Of wc
Member M/F SC ST SF MF LF Land-less UG SHG GP Any
other
Educa-tional
qualifi-cation
Function/s assigned#
1
Fotadi
President Sodha
Bablubha Vankaji
M - - - - - Yes - - - - 8th
2 Secretary Harijan Valji Devji M - - - - - Yes - - - - 7th
3 Member Hingorja
Khamisha Latif
M - - - - - Yes - - - - Illetrated
4 Member Sodha
Sangramji ladhuji
M - - - - Yes - Yes - - - 10th
5 Member Harijan
Khajuriya Juma
M - - - - Yes - Yes - - - 2th
6 Member Hingorja
Jakab Kasam
M - - - - Yes - Yes - - - Illetrated
7 Member Harijan
Jivanbhai Dayabhai
M - - - - - Yes - - - - 7th
8 Member Sodha
Gangaba Pratapji
F - - - - - - - Yes - - Illetrated
9 Member Hingorja
Rajbai Juma
F - - - - - - - Yes - - Illetrated
10 W.D.T Meta
Dipaliben Mudubhai
F - - - - - - - - - W.D.T M.S.W

Table no. 32.2: Nagiyari Watershed Committee details
Sr.. No.
Names of WCs
Date of Registration as a Society (dd/mm/
yyyy)
Designation
Name Of wc Member M/
F SC ST SF MF LF Land-less UG SHG GP Any
other
Educa-tional
qualifi-cation
Function/s assigned#
1
Nagiyari
President Bafan
Jusabh bhachu
M - - - - Yes - Yes - - - 10th
2 Secretary Bafan Haji
Ibrahim M - - - - - Yes - - - - 10th
3 Member Ismail Salimamad M - - - - - Yes - - - - 8th
4 Member Bafan Jusab Abdulla M - - - - - Yes - - - - 7th
5 Member Bafan Fatama Abdulla F - - - - - Yes - - - - 7th
6 Member Kamaben Jakab F - - - - - Yes - - - - 10th
7 Member Bafan
Ismail Umar M - - - - - Yes - Yes - - 4th
8 Member Bafan Jenabai Amad F - - - - - - - Yes - - 2nd
9 Member Bafan
Sarabai Kasu
F - - - - - - - Yes - - Illetrated
10 Member Bafan
Bhachu Ibrahim
M
11 W.D.T Parmar
Kiranben Hirabhai
F - - - - - - - - W.D.T B.R.S. M.S.W.

# Only the letter assigned, as below, needs to be typed, except for `J’, where the type may be specifically mentioned. A. PNP and PRA B. Planning C. Maintenance of Accounts D. Signing of cheques and making payments E. Supervision of construction activities F. Cost Estimation G. Verification & Measurement H. Record of labour employed I. Social Audit J. Any other (please specify).
Table no. 33.1:Fotadi SHG detail
S. No.
Name of village Total no. of registered SHGs No. of members No. of SC/ST in each
category No. of BPL in each
category With only Men
With only Women
With both Total Categories M F Total M F Total M F Total
1
Fotadi
- 1 - 1
(i) Landless - - - - - - - - - (ii) SF - - - - - - - - -
(iii) MF - - - - - - - - - (iv) LF - 14 14 - - - - - -
Total - - 1 - 1 - 14 14 - - - - - -
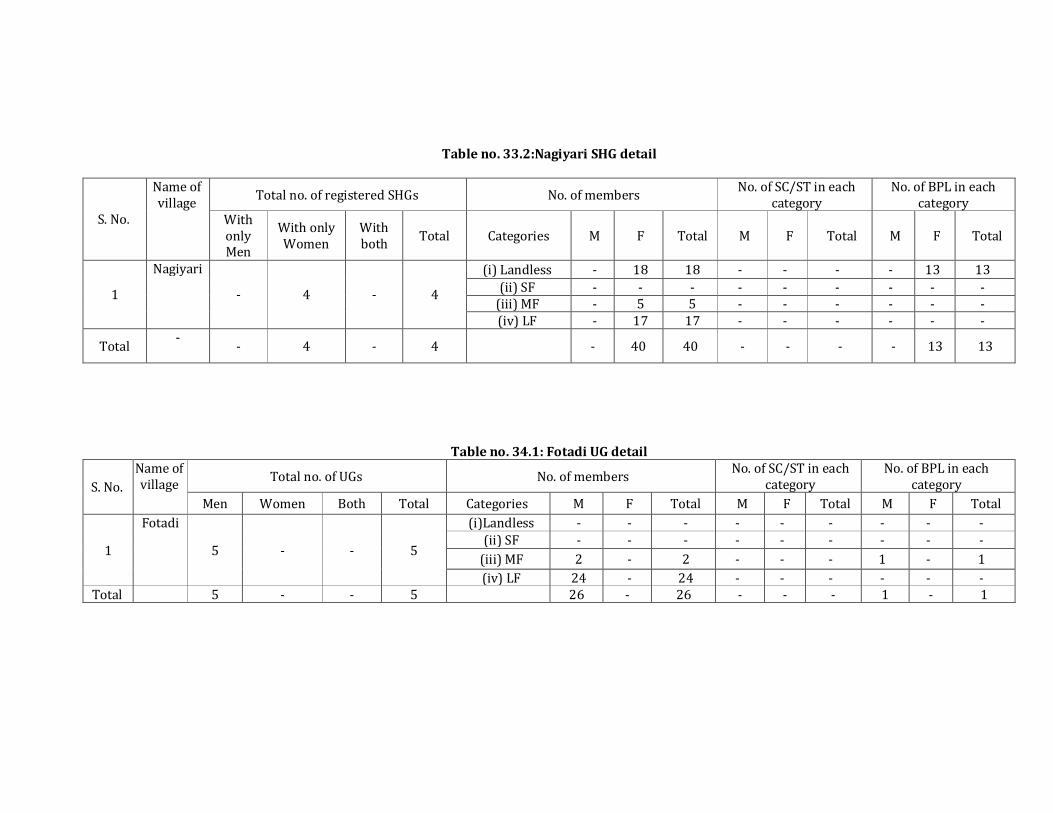
Table no. 33.2:Nagiyari SHG detail
S. No.
Name of village Total no. of registered SHGs No. of members No. of SC/ST in each
category No. of BPL in each
category With only Men
With only Women
With both Total Categories M F Total M F Total M F Total
1
Nagiyari
- 4 - 4
(i) Landless - 18 18 - - - - 13 13 (ii) SF - - - - - - - - -
(iii) MF - 5 5 - - - - - - (iv) LF - 17 17 - - - - - -
Total - - 4 - 4 - 40 40 - - - - 13 13
Table no. 34.1: Fotadi UG detail
S. No. Name of village Total no. of UGs No. of members No. of SC/ST in each
category No. of BPL in each
category Men Women Both Total Categories M F Total M F Total M F Total
1
Fotadi
5 - - 5
(i)Landless - - - - - - - - - (ii) SF - - - - - - - - -
(iii) MF 2 - 2 - - - 1 - 1 (iv) LF 24 - 24 - - - - - -
Total 5 - - 5 26 - 26 - - - 1 - 1

Table no. 34.2: Nagiyari UG detail
S. No. Name of village Total no. of UGs No. of members No. of SC/ST in each
category No. of BPL in each
category Men Women Both Total Categories M F Total M F Total M F Total
2
Nagiyari
3 - - 3
(i)Landless - - - - - - - - - (ii) SF - - - - - - - - -
(iii) MF - - - - - - - - - (iv) LF 15 - 15 - - - - - -
Total 3 - - 3 15 - 15 - - - - - -
Table no.35: Entry point activities (EPA) (All financial figures in lakh Rs.)
S. No. Names of Villages Amount earmarked for EPA Entry Point Activities planned Estimated cost Expected outcome
1
Fotadi 8.89
Renovation of Amablijar pond 2.97
Development of drinking water for cattle and
increase of ground water
recharge.
2 Renovation of Bedgar pond 2.96
Development of drinking water for cattle and
increase of ground water
rechage.
3 Renovation of Tampvari pond 2.96
Development of drinking water for cattle and
increase of ground water
rechage.

4
Nagiyari 3.66
Renovation of Navobandh pond 2.96
Development of rinking water for
cattle and increase of
ground water rechage.
5 Water supply pipeline & HDPE Tank 0.58 Development of drinking water
facility.
6 Stand Post 0.12 Development of drinking water
facility
Table no.36: Details of ridge line treatment / land based activities in watershed works*
S. No. Village name Name of structures
Type of treatment Type of land Target
(i) Ridge area (R)
(ii) Drainage line (D)
(iii) Land dev.
(L)
(i) Pri-vate
(ii) Community
(iii) Others (pl.
specify)
No. of units (No./ cu.m./
rmt)
Estimated cost (Rs. in lakh)
Expected month & year of
completion (mm/yyyy) M W O T
Staggered trenching Contour bunding Graded bunding Bench terracing Earthern bunding Masonry stop dams Gully plug Gabion structures Underground dykes Field bunds Any others (pl. specify)
Total
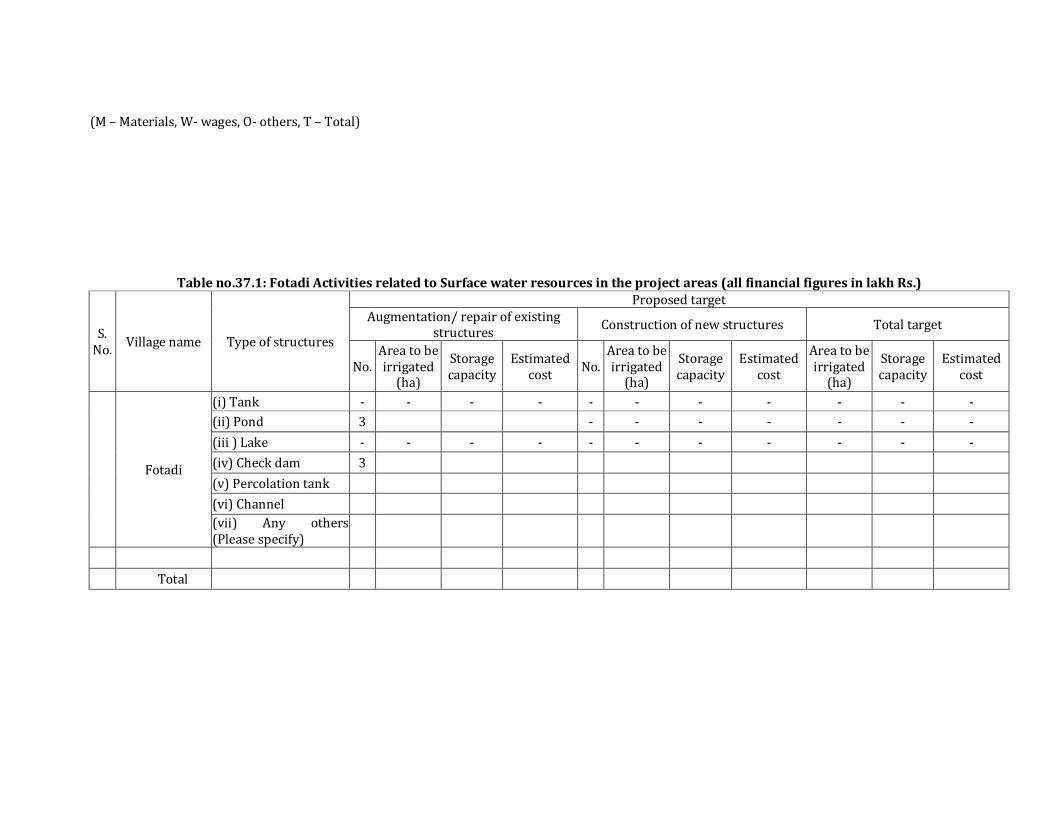
(M – Materials, W- wages, O- others, T – Total)
Table no.37.1: Fotadi Activities related to Surface water resources in the project areas (all financial figures in lakh Rs.)
S. No. Village name Type of structures
Proposed target Augmentation/ repair of existing
structures Construction of new structures Total target
No. Area to be irrigated
(ha)
Storage capacity
Estimated cost No.
Area to be irrigated
(ha)
Storage capacity
Estimated cost
Area to be irrigated
(ha)
Storage capacity
Estimated cost
Fotadi
(i) Tank - - - - - - - - - - - (ii) Pond 3 - - - - - - - (iii ) Lake - - - - - - - - - - - (iv) Check dam 3 (v) Percolation tank (vi) Channel (vii) Any others (Please specify)
Total

Table no.37.2:Nagiyari Activities related to Surface water resources in the project areas (all financial figures in lakh Rs.)
S. No. Village name Type of structures
Proposed target Augmentation/ repair of existing
structures Construction of new structures Total target
No. Area to be irrigated
(ha)
Storage capacity
Estimated cost No.
Area to be irrigated
(ha)
Storage capacity
Estimated cost
Area to be irrigated
(ha)
Storage capacity
Estimated cost
Nagiyari
(i) Tank - - - - - - - - - - - (ii) Pond 4 - - - - (iii ) Lake - - - - - - - - - - - (iv) Check dam - - - - 3 (v) Percolation tank - - - - - - - - - - - (vi) Channel - - - - - - - - - - - (vii) Any others (Please specify)
Total

Table no.38: Activities related to recharging ground water resources in the project areas (all financial figures in lakh Rs.)
S. No. Name of Villages Type of structures
Proposed target Augmentation/ repair of existing
recharging structures Construction of new recharging
structures Total target
No. Area to be irrigated (ha)
Estimated cost No. Area to be
irrigated (ha) Estimated
cost Area to be
irrigated (ha) Estimated
cost
(i)Open wells (ii)Bore wells (iii)Any others (Pl. specify)
Total for the village Total for the Project
Table no.39: Details of activities related to livelihood, production system and micro-enterprises
S. No. Name of village Name of activity
Type of land Executing agency Target
(i) Private (ii) Community
(iii) Others (pl. specify)
(i) UG (ii)SHG
(iii) Others (pl. specify)
Estimated cost
(Rs. in lakh)
Expected month & year of completion
(mm/yyyy)
Agriculture productivity enhancement Agro-processing Animal Husbandry/ dairy development Handicraft Ecotourism Minor Activities- upto maximum 10% of Total Livelihood funds

Note: 1. Please provide the list of works and names of beneficiaries in the annexure 2. Ensure that 10% of the total project funds go to the assetless- give separate list in the annexure
Table no. 40: Activities related to livelihoods by Self Help Groups (SHGs) in the project areas
S. No. Names of Villages
Major activities of the SHGs
Name of activity No. of SHGs involved Average annual income from activity per SHG
Table no. 41: Linkages developed at village level
Sr. No. Village Name of activity Forward/Backward linkage Linkage with Outcome
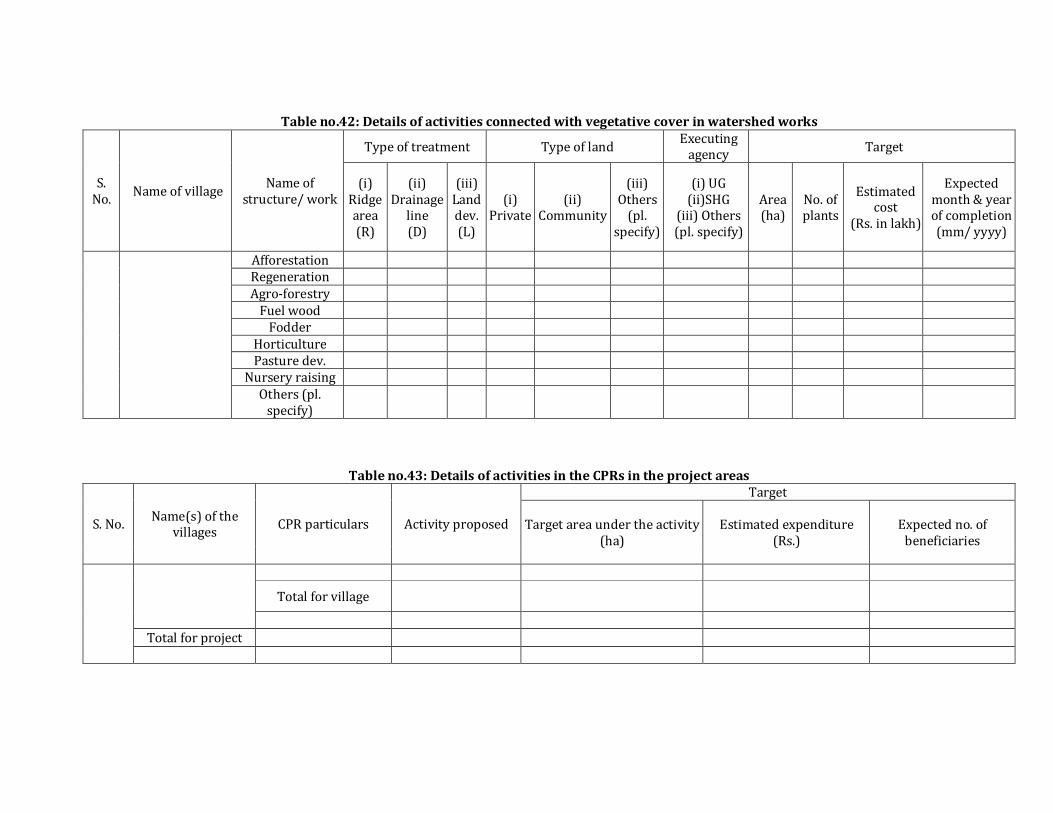
Table no.42: Details of activities connected with vegetative cover in watershed works
S. No. Name of village Name of
structure/ work
Type of treatment Type of land Executing agency Target
(i) Ridge area (R)
(ii) Drainage
line (D)
(iii) Land dev. (L)
(i) Private
(ii) Community
(iii) Others
(pl. specify)
(i) UG (ii)SHG
(iii) Others (pl. specify)
Area (ha)
No. of plants
Estimated cost
(Rs. in lakh)
Expected month & year of completion (mm/ yyyy)
Afforestation Regeneration Agro-forestry
Fuel wood Fodder
Horticulture Pasture dev.
Nursery raising Others (pl.
specify)
Table no.43: Details of activities in the CPRs in the project areas
S. No. Name(s) of the villages CPR particulars Activity proposed
Target
Target area under the activity (ha)
Estimated expenditure (Rs.)
Expected no. of beneficiaries
Total for village
Total for project

Table no. 44: Capacity Building Institution:
S. No. Name of the
Training Institute
Full Address with contact no., website
Type of Institute#
Area(s) of speciali-zation$
Accredita-tion details
Trainings
Reference Year No. of trainings assigned
No. of trainees to be trained
# Central govt. Dept./ State govt. Dept./ Autonomous Body/ Research Institutes/ Universities/ Others (pl. specify) $ Capacity Building/ Agriculture/ Horticulture/ Animal Husbandry/ Pisciculture/ Remote Sensing/ Water conservation/ Ground water/ Forestry/
livelihoods/ entrepreneurship development/ others (pl. specify)
Table no. 45: Capacity Building plan:
S. No. District Project Stakeholders Total no. of persons
No. of persons to be trained No. of training programmes Estimated cost
PIA WDTs UGs
SHGs WCs GPs
Community Others
(Pl. specify)
Table no.46: Information, Education and Communication Activities:
Sr.No. Activity Executing agency Estimated expenditure (Rs.) Outcome (may quantify, wherever possible)

BUDGET
Table no. 47: Budget at a glance for the project Sr. No. Budget component Cost requirement
1 Administrative costs 51.67 2 Monitoring 5.17 3 Evaluation 5.17 4 Entry Point activity 20.67 5 Institution and Capacity Building 25.84 6 Detailed Project Report 5.17 7 Watershed Development Works 289.38 8 Livelihood activities for asset less 46.51 9 Production systems and micro-enterprises 51.67
10 Consolidation phase 15.50 TOTAL 516.75
Table no. 48: Village wise- component wise budget available under IWMP
Sr.No. Village Activity EPA Institution
and CB DPR Watershed
development Work
Livelihood for asset less
Production system and Microenterprises
Consolidation Total
1 Fotadi 10.87 13.59 2.72 152.21 24.46 27.18 8.15 239.18 2 Nagiyari 5.87 7.33 1.46 82.15 13.20 14.67 4.40 129.08 Total 20.67 25.83 5.16 289.38 46.5 51.67 15.5 454.71
Table no. 49: Village wise gap in funds requirement Sr. No.
Village Total cost requirement Total funds available under IWMP
Gap in funds requirement
1 Fotadi 2.72 2.71 0 2 Nagiyari 1.46 1.46 0 Total 5.16 5.16 0

Table no.50: Details of Convergence of IWMP with other Schemes
S. No. Village Phase/ Type of work*
Activity to be carried out
Fund made available to
IWMP due to convergence (Rs.
in lakh)
Scheme with which convergence took
place Reference no. of activity/ task/
structure in DPR
Level at which decision for
convergence was taken
1 Fotadi 2 Nagiyari Total
*Phase/Type of work: EPA, Land base, Surface water, Ground water, Livelihood
Table no. 51: Public-Private Partnership in the IWMP projects
S. No. Name of Private Sector Partner
Agency
Type of agreement signed Financial contribution Partnership
Interventions Expected Outcomes Comments a)MoU b)Contract c) Any other
(pl. specify) IWMP Private sector
OUTCOMES
Table no.52: Environmental Benefits Sr. No. Village Soil loss (cmt)
Water storage (Cmt) Ground water table (mt) Tree cover
Pre-project
Expected post-project
Pre-project
Expected post-project
Open well: pre-project
Open well: post-project
Bore well: pre-project
Bore well: post-project
Area in Ha.: pre- project
Area in Ha.: post-project
Tree count: pre-project
Tree count: post-project
Average
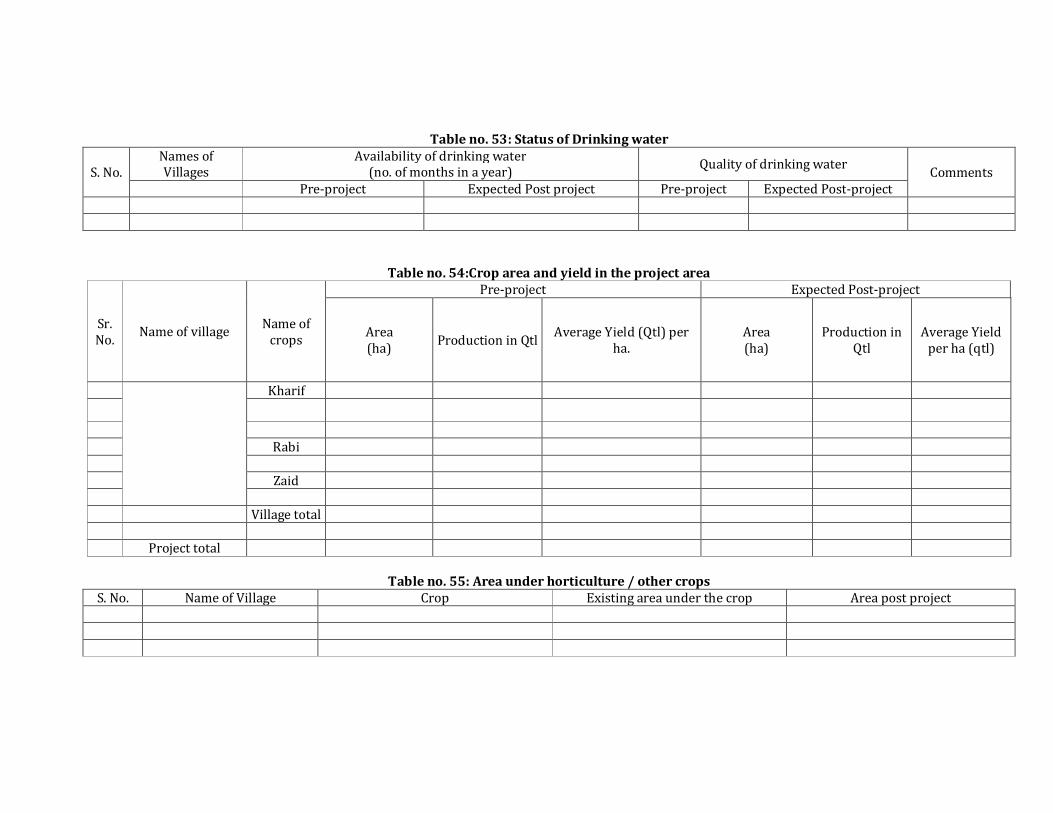
Table no. 53: Status of Drinking water
S. No. Names of Villages
Availability of drinking water (no. of months in a year) Quality of drinking water Comments
Pre-project Expected Post project Pre-project Expected Post-project
Table no. 54:Crop area and yield in the project area
Sr. No. Name of village Name of
crops
Pre-project Expected Post-project
Area (ha) Production in Qtl Average Yield (Qtl) per
ha. Area (ha)
Production in Qtl
Average Yield per ha (qtl)
Kharif Rabi Zaid Village total Project total
Table no. 55: Area under horticulture / other crops
S. No. Name of Village Crop Existing area under the crop Area post project

Table no. 56: Details of livestock in the project areas (for fluids please mention in litres, for solids please mention in kgs. and income in Rs.)
S. No. Name of Village Type of Animal Pre-Project Expected Post-project Remarks No. Yield Income No. Yield Income
Milch-animals Draught Purpose animals Animals for other purpose
Table no. 57: Employment to be supplemented in the Project area:
S. NO.
Names of
Villages
Wage employment Self employment No. of mandays No. of beneficiaries No. of beneficiaries
SC ST Others Women Total SC ST Others Women Total SC ST Others Women Total
Table no. 58: Seasonal migration from Project area Sl. No. Names of villages No. of persons migrating No. of days per year of migration
Pre-project Expected post project Pre-project Expected post project
Table no.59: Per capita Income
Sr. No. Village Source of Income Pre-project Expected post project Agriculture Forestry Animal Husbandry Casual Labour Services Handicraft Business Others Total

Table no. 60: Backward-Forward linkages
S. No. Project Type of Marketing Facility Pre-project (no.) During the project (no.) Post-project (no.)
Backward linkages Seed certification Seed supply system Fertilizer supply system Pesticide supply system Credit institutions Water supply Extension services Nurseries Tools/machinery suppliers Price Support system Labour Any other (please specify) Forward linkages Harvesting/threshing machinery Storage (including cold storage) Road network Transport facilities Markets / Mandis Agro and other Industries Milk and other collection centres Labour Any other (please specify)