detecting crypto-ransomware in iot networks based on
TRANSCRIPT

Detecting cryptoransomware in IoT networks based on energy consumption
footprintAzmoodeh, A, Dehghantanha, A, Conti, M and Raymond Choo, KK
http://dx.doi.org/10.1007/s1265201705585
Title Detecting cryptoransomware in IoT networks based on energy consumption footprint
Authors Azmoodeh, A, Dehghantanha, A, Conti, M and Raymond Choo, KK
Type Article
URL This version is available at: http://usir.salford.ac.uk/43410/
Published Date 2017
USIR is a digital collection of the research output of the University of Salford. Where copyright permits, full text material held in the repository is made freely available online and can be read, downloaded and copied for noncommercial private study or research purposes. Please check the manuscript for any further copyright restrictions.
For more information, including our policy and submission procedure, pleasecontact the Repository Team at: [email protected].
Vol.:(0123456789)1 3
J Ambient Intell Human Comput DOI 10.1007/s12652-017-0558-5
ORIGINAL RESEARCH
Detecting crypto‑ransomware in IoT networks based on energy consumption footprint
Amin Azmoodeh1 · Ali Dehghantanha2 · Mauro Conti3 · Kim‑Kwang Raymond Choo4
Received: 5 March 2017 / Accepted: 28 July 2017 © The Author(s) 2017. This article is an open access publication
Keywords Ransomware detection · Power consumption · Internet of Things security · Machine learning · Malware detection · Android
1 Introduction
The Internet of Things (IoT) refers to interrelated connected network of smart devices, sensors, embedded computers and etc. that store,process and communicate heterogeneous data. IoT and its applications propagate to majority of life’s infrastructure ranging from health and food production to smart cities and urban management. While efficiency and prevalence of IoT are increasing, security issues remain a necessary concern for industries (Tankard 2015). Internet-connected devices, including those deployed in an IoT archi-tecture, are increasingly targeted by cybercriminals due to their pervasiveness and the ability to use the compromised devices to further attack the underlying architecture (Choo 2014; Pajouh et al. 2016; D’Orazio et al. 2017; Fortino and Trunfio 2014; Watson and Dehghantanha 2016). In the case of ransomware, for example, devices that are capable of storing a reasonably amount of data (e.g., Android and iOS devices) are likely to be targeted (Damshenas et al. 2015; D’Orazio and Choo 2016; Gubbi et al. 2013). Thus, ensuring the security of IoT nodes against threats such as malware is a topic of ongoing interest (Bertino et al. 2016; Sicari et al. 2015; Kumar and Patel 2014; Abomhara and Kien 2015; Daryabar et al. 2012; Teing et al. 2017; Dezfouli et al. 2016).
While malware detection and mitigation research is now new, ransomware detection and mitigation remains chal-lenging. Ransomware is a relatively new malware type that attempts to encrypt a compromised device’s data using a strong encryption algorithm (O’Gorman and McDonald 2012). The victim will then have to pay the ransom (usually
Abstract An Internet of Things (IoT) architecture gener-ally consists of a wide range of Internet-connected devices or things such as Android devices, and devices that have more computational capabilities (e.g., storage capacities) are likely to be targeted by ransomware authors. In this paper, we present a machine learning based approach to detect ransomware attacks by monitoring power consumption of Android devices. Specifically, our proposed method moni-tors the energy consumption patterns of different processes to classify ransomware from non-malicious applications. We then demonstrate that our proposed approach outper-forms K-Nearest Neighbors, Neural Networks, Support Vec-tor Machine and Random Forest, in terms of accuracy rate, recall rate, precision rate and F-measure.
* Ali Dehghantanha [email protected]
Amin Azmoodeh [email protected]
Mauro Conti [email protected]
Kim-Kwang Raymond Choo [email protected]
1 Department of Computer Science and Engineering, Shiraz University, Shiraz, Iran
2 Department of Computer Science School of Computing Science and Engineering, University of Salford, Greater Manchester, UK
3 Department of Mathematics, University of Padua, Padua, Italy
4 Department of Information Systems and Cyber Security, The University of Texas at San Antonio, San Antonio, TX, USA
A. Azmoodeh et al.
1 3
using bitcoins) in order to obtain the password or decryption key (Song et al. 2016). Consequences include temporary or permanent loss of sensitive information, disruption of regu-lar operations, direct/indirect financial losses (e.g., to restore systems and restore an organizations reputation) (FBI 2016).
A popular malware detection approach is the use of machine learning techniques to identify patterns of spe-cific feature(s) within a malware code or behavior to dis-tinguish malware from non-malicious applications (Faruki et al. 2015; Damshenas et al. 2015; Pajouh et al. 2016). For example, Andronio et al. (2015) proposed an Android ran-somware detection system, Heldroid, that is based on Natu-ral Language Processing (NLP). The approaches identify ransomware based on their typical characteristics, such as call function and application manifests. EldeRan (Sgandurra et al. 2016) is another machine learning based model for dynamically analyzing and classifying ransomware based on their installation activities. Mercaldo et al. (2016) presented a parser that analyzes a sample code and automatically iden-tifies ransomware related instructions. In Caviglione et al. (2016), malware covert communications are detected using neural networks and decision tree techniques.
Changes in the energy consumption of a typical infected device can also be used as a feature for malware detection (Caviglione et al. 2016), as it could be trivial for a malware developer to change malware function calls or its behav-iour but changing its power usage pattern is less likely and more difficult to realise (Shaerpour et al. 2013). Addition-ally, power usage pattern is relatively similar on different platforms; thus, power consumption based detection meth-ods appear to be a viable approach (Potlapally et al. 2006). Kim et al. (2008) proposed a power-aware malware detection framework based on anomalies in a device energy consump-tion pattern. Similarly, Merlo et al. (2015) demonstrated the potential of detecting a malware on an Android device based on its energy consumption.
In this paper, we use machine learning techniques to detect ransomware based on their power usage patterns on IoT nodes, and specifically Android devices. The proposed model grinds device’s power usage into subsamples, clas-sifies them and aggregates outputs to increase the detection rate to 95.65%.
2 Related literature
Securing IoT nodes is an active research area. For example, Sicari et al. (2015) and Jing et al. (2014) discussed several key research challenges and identified potential solutions and research opportunities for IoT security, and Abomhara and Kien (2015) provided a categorisation of IoT related threats.
Malware detection and mitigation for IoT nodes is one of several research challenges and opportunities identi-fied, and is an ongoing research topic (Faruki et al. 2015; Suarez-Tangil et al. 2014). Detection methods include those based on malware’s properties (e.g., application signatures), and tracking of malicious activity and their energy consumption (Shaerpour et al. 2013). Malware detection based on energy consumption footprint is known to be more robust against malware anti-forensic techniques as changing a malware power consumption pattern is much more challenging in practice, compared to changing its function calls or application codes (Damshenas et al. 2013).
Kim et al. (2008) proposed a power-aware malware detection framework that detects previously unknown battery-draining malware. Their framework comprises a power monitoring tool and a data analyzer which gener-ates a power signature to identify a malware. Merlo et al. (2015) presented an energy-related measurement at a dif-ferent levels of abstraction for Android devices in order to achieve a trade-off between measurement precision and effective energy based profiling of malware. Yang and Tang (2016) used the frequencies of energy consumption waveform to generate a Gaussian Mixture Model (GMM) based on Mel frequency cepstral coefficients (MFCC) to detect malicious software. In Yang and Tang (2016), authors use a complex statistical approach to make deci-sion based on power usage. This, however, is generally too computationally expensive for IoT nodes. The authors also employed frequencies of waveform in their approach; therefore, changes in the CPU’s specification would have a substantial impact on the results even though the wave-form’s visual form remains invariant.
Machine learning algorithm, as previously discussed, has been widely employed in cyber security research, including malware detection. Andronio et al. (2015) pre-sented Heldroid to detect Android ransomware Heldroid based on file encryption activities using a NLP-based text classifier, locking detector and a tracker. Heldroid utilises extracted features from malware application such as alert messages, function call and etc. Sgandurra et al. (2016) proposed EldeRan for dynamically analysing and classi-fying ransomware based on the set of actions performed by the applications in their installation phase. EldeRan is designed for Windows platform and the most relevant fea-ture to the class label is Registry Keys Operations, which is not applicable for Android devices. Mercaldo et al. (2016) presented a three-step process to detect Android ransomware family. Similar to other static malware detec-tion approaches, techniques such as code metamorphism could be used to evade detection.
Detecting crypto-ransomware in IoT networks based on energy consumption footprint
1 3
3 Research methodology
To develop a fingerprint of ransomware’s energy consump-tion, initially, we need to record the power usage of tar-geted applications. Similar to the approaches in previous studies (Yang 2012; Merlo et al. 2015) we used Power-Tutor to monitor and sample power usage of all running processes in 500 ms intervals. PowerTutor creates logfiles containing sequence of energy usage of each process at given sampling interval. We conducted our experiments on three different Android devices, namely: a Samsung Gal-axy SIII (CPU: 1.4 GHz, RAM: 2GB, OS: Android 4.4), a Samsung Galaxy S Duos (CPU: 1.0 GHz, RAM: 768 MB, OS: Android 4.0.1), and an Asus Padfone Infinity (CPU: 1.7 GHz, RAM: 2 GB, OS: Android 4.4). To collect energy consumption logs of both ransomware and goodware, we installed the most popular Android applications, namely: Gmail (version 9.6.83), Facebook (version 99.0.0.26.69), Google Chrome (version 53.0.2785.124), Youtube (version 11.39.56), Whatsapp (version 2.16.306), Skype (version 7.20.0.411), AngryBrids (version 6.1.5), Google Maps (version 9.39.2), Music Player (version 4.2.52), Twitter (version 6.19.0), Instagram (version 9.6.0) and Guardian (version 3.13.107) and six active and recent ransomware samples (see Table 1) on all devices. All ransomware were downloaded via VirusTotal1 Intelligence API, and these ransomware have active Command and Control (C2) servers.
We then use PowerTutor to monitor and record the device processes’ power usage (while running the appli-cations and ransomware, separately) for 5 min. While run-ning the applications (also referred to as goodware), the user interactions mirrored a real world usage. This proce-dure was repeated five times per device; thus, we obtained 5repeation × 3device = 15 power usage samples for each and every application and ransomware.
As each device’s CPU has its own power usage specifi-cation, the energy consumption of all devices were mapped to a specific range in order to have a meaningful evalua-tion. So, we normalised the CPU power consumption for
all monitored processes on the devices to [0, 1], where 0 indicates no power usage and 1 presents the maximum CPU power utilisation. Scripts were written to process log-files, extract and normalize power usage values, and gener-ate a row-normalized dataset. Each row includes a label (i.e., goodware or ransomware) and a normalized sequence of energy consumption for five minutes of activity.
3.1 Classification
Assigning correct label to a sample based on previous observations is a key element of Supervised Learning and Classification (Michalski et al. 2013). We applied four state-of-the-art classifiers, namely: k-Nearest Neighbor (KNN), Neural Network (NN), Support Vector Machine (SVM) and Random Forest (RF), on the power usage samples to recog-nise the class of each sequence of power consumption. KNN is a simple and powerful classifier which seeks K nearest sample(s) and assigns the majority of neighbor’s label to the given samples (Cover and Hart 1967). NN (Haykin 1998) is an implementation of human brain networks and mostly used to approximate the function between inputs and output. Another popular technique for supervised learning is SVM (Burges 1998), which is based on the concept of decision planes that define decision boundaries. A decision plane dif-ferentiates a set of objects based on their class memberships. Ensemble learning has been the motivation of developing RF (Verikas et al. 2011) that operates by constructing a mul-titude of decision trees at training time and generating the class label.
Power usage sequence of each process can be consid-ered as time-series data. A wide range of methods have been proposed to classify time-series data (Xing et al. 2010; Fu 2011). In this study, a distance based time-series classifi-cation approach based on Dynamic Time Warping (DTW) (Müller 2007) is used for distance measure, and KNN is used as a classifier. Similarity distance is a key element in KNN classification and we apply two different distances to find the closest neighbor as follows:
• Euclidean distance: Euclidean distance or Euclidean metric is the intuitive distance between two vectors in Euclidean space and calculated as follow:
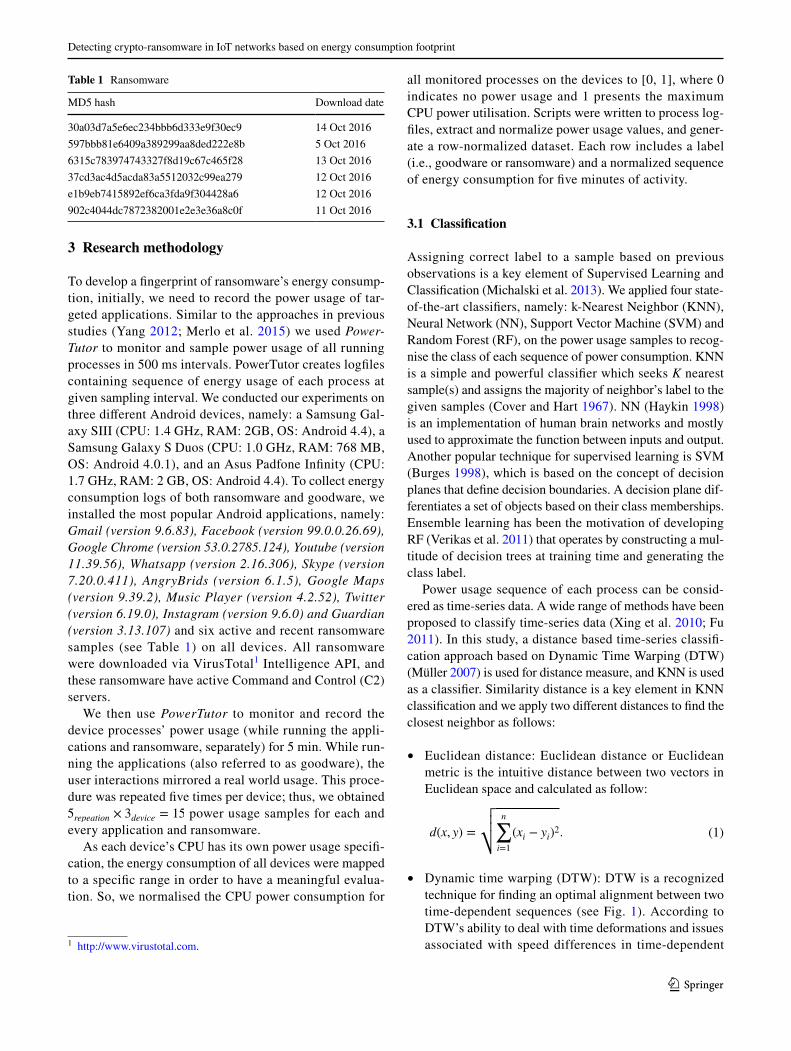
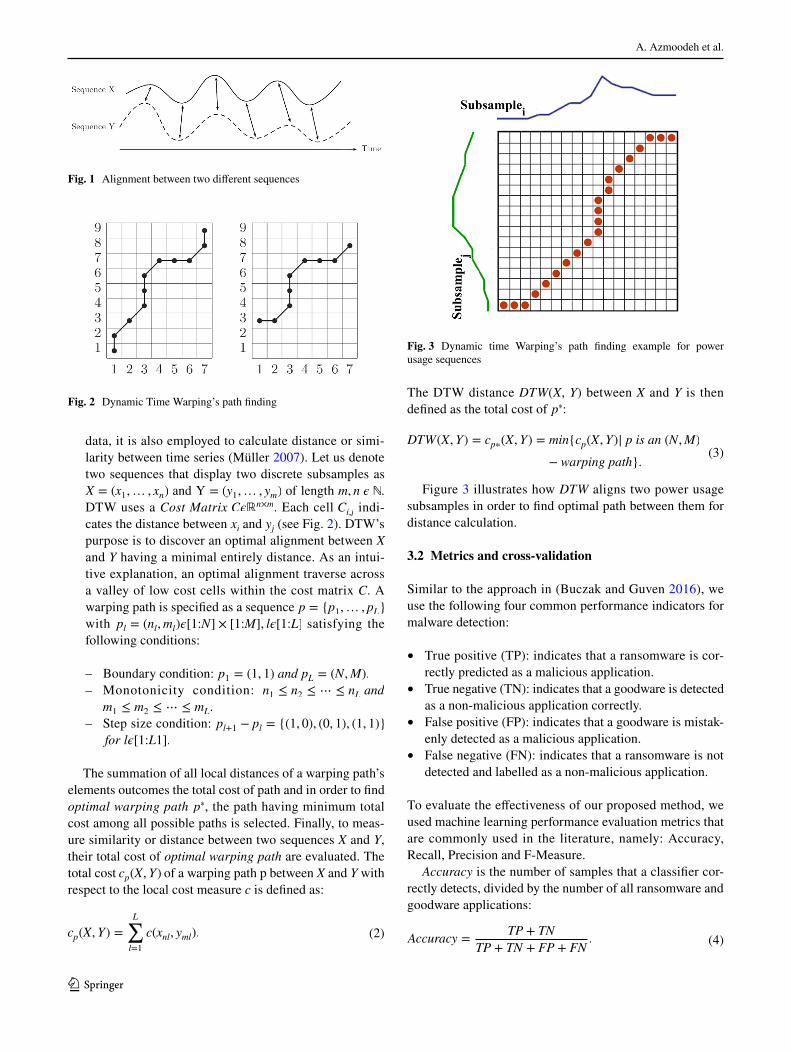
• Dynamic time warping (DTW): DTW is a recognized technique for finding an optimal alignment between two time-dependent sequences (see Fig. 1). According to DTW’s ability to deal with time deformations and issues associated with speed differences in time-dependent
(1)d(x, y) =
√√√√n∑
i=1
(xi − yi)2.
Table 1 Ransomware
MD5 hash Download date
30a03d7a5e6ec234bbb6d333e9f30ec9 14 Oct 2016597bbb81e6409a389299aa8ded222e8b 5 Oct 20166315c783974743327f8d19c67c465f28 13 Oct 201637cd3ac4d5acda83a5512032c99ea279 12 Oct 2016e1b9eb7415892ef6ca3fda9f304428a6 12 Oct 2016902c4044dc7872382001e2e3e36a8c0f 11 Oct 2016
1 http://www.virustotal.com.
A. Azmoodeh et al.
1 3
data, it is also employed to calculate distance or simi-larity between time series (Müller 2007). Let us denote two sequences that display two discrete subsamples as X = (x1,… , xn) and Y = (y1,… , ym) of length m, n � ℕ. DTW uses a Cost Matrix C�ℝn×m. Each cell Ci,j indi-cates the distance between xi and yj (see Fig. 2). DTW’s purpose is to discover an optimal alignment between X and Y having a minimal entirely distance. As an intui-tive explanation, an optimal alignment traverse across a valley of low cost cells within the cost matrix C. A warping path is specified as a sequence p = {p1,… , pL} with pl = (nl,ml)�[1:N] × [1:M], l�[1:L] satisfying the following conditions:
– Boundary condition: p1 = (1, 1) and pL = (N,M).
– Monotonicity condition: n1 ≤ n2 ≤ ⋯ ≤ nLand
m1 ≤ m2 ≤ ⋯ ≤ mL.
– Step size condition: pl+1 − pl = {(1, 0), (0, 1), (1, 1)}
for l�[1:L1].
The summation of all local distances of a warping path’s elements outcomes the total cost of path and in order to find optimal warping path p∗, the path having minimum total cost among all possible paths is selected. Finally, to meas-ure similarity or distance between two sequences X and Y, their total cost of optimal warping path are evaluated. The total cost cp(X, Y) of a warping path p between X and Y with respect to the local cost measure c is defined as:
(2)cp(X, Y) =
L∑
l=1
c(xnl, yml).
The DTW distance DTW(X, Y) between X and Y is then defined as the total cost of p∗:
Figure 3 illustrates how DTW aligns two power usage subsamples in order to find optimal path between them for distance calculation.
3.2 Metrics and cross‑validation
Similar to the approach in (Buczak and Guven 2016), we use the following four common performance indicators for malware detection:
• True positive (TP): indicates that a ransomware is cor-rectly predicted as a malicious application.
• True negative (TN): indicates that a goodware is detected as a non-malicious application correctly.
• False positive (FP): indicates that a goodware is mistak-enly detected as a malicious application.
• False negative (FN): indicates that a ransomware is not detected and labelled as a non-malicious application.
To evaluate the effectiveness of our proposed method, we used machine learning performance evaluation metrics that are commonly used in the literature, namely: Accuracy, Recall, Precision and F-Measure.
Accuracy is the number of samples that a classifier cor-rectly detects, divided by the number of all ransomware and goodware applications:
(3)DTW(X,Y) = cp∗(X,Y) = min{cp(X,Y)| p is an (N,M)
− warping path}.
(4)Accuracy =TP + TN
TP + TN + FP + FN.
Fig. 1 Alignment between two different sequences
Fig. 2 Dynamic Time Warping’s path finding
Fig. 3 Dynamic time Warping’s path finding example for power usage sequences
Detecting crypto-ransomware in IoT networks based on energy consumption footprint
1 3
Precision is the ratio of predicted ransomware that are cor-rectly labelled a malware. Thus, Precision is defined as follows:
Recall or detection rate is the ratio of ransomware samples that are correctly predicted, and is defined as follows:
(5)Precision =TP
TP + FP.
(6)Recall =TP
TP + FN.
F-Measure is the harmonic mean of precision and recall, and is defined as follows:
Cross-validation (Kohavi et al. 1995) is a fundamental technique in machine learning to assess the extent that the findings of an experiment can be generalized into an inde-pendent dataset. In order to evaluate the performance of the proposed method, we used the leave-one-out cross valida-tion. We are aware that in order to implement this validation method, all subsamples of a sample need to be excluded
(7)F −Measure =2 ∗ TP
2 ∗ TP + FP + FN.
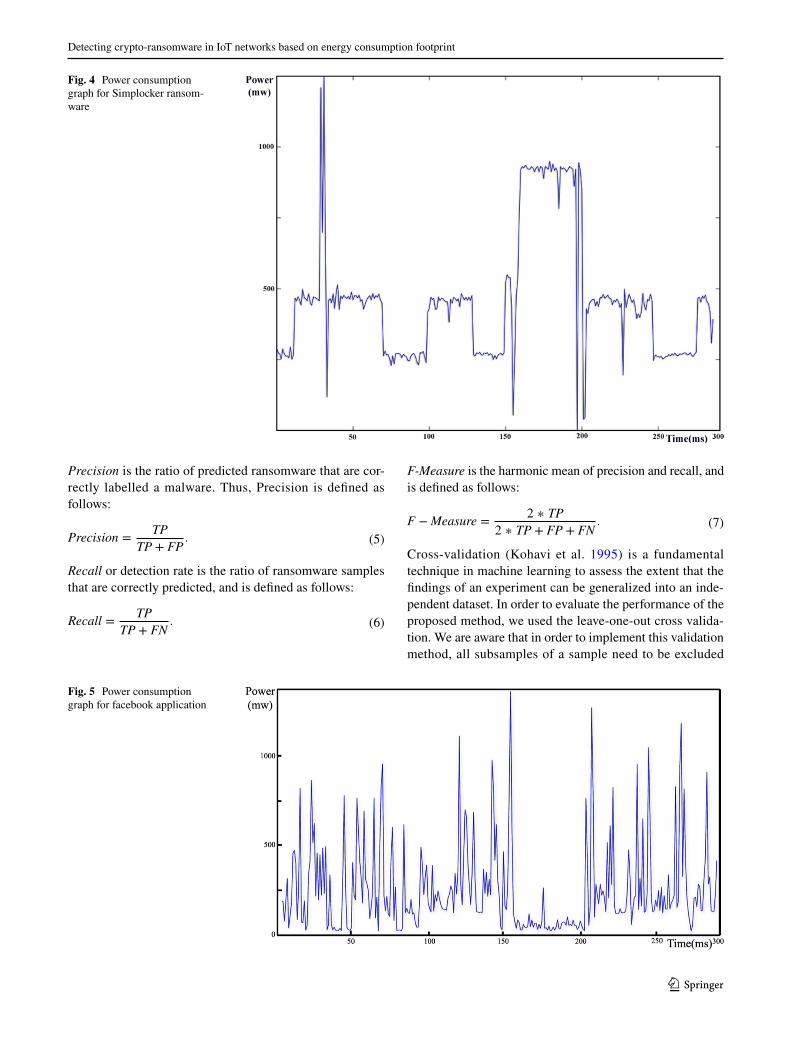
Fig. 4 Power consumption graph for Simplocker ransom-ware
Fig. 5 Power consumption graph for facebook application
A. Azmoodeh et al.
1 3
from the classifier training phase. All evaluations were con-ducted using MATLAB R2015a running on a Microsoft Windows 10 Pro personal computer powered by Intel Core i7 2.67 GHz and 8 GB RAM.
We will evaluate the performance of the classification algorithms in the next section.
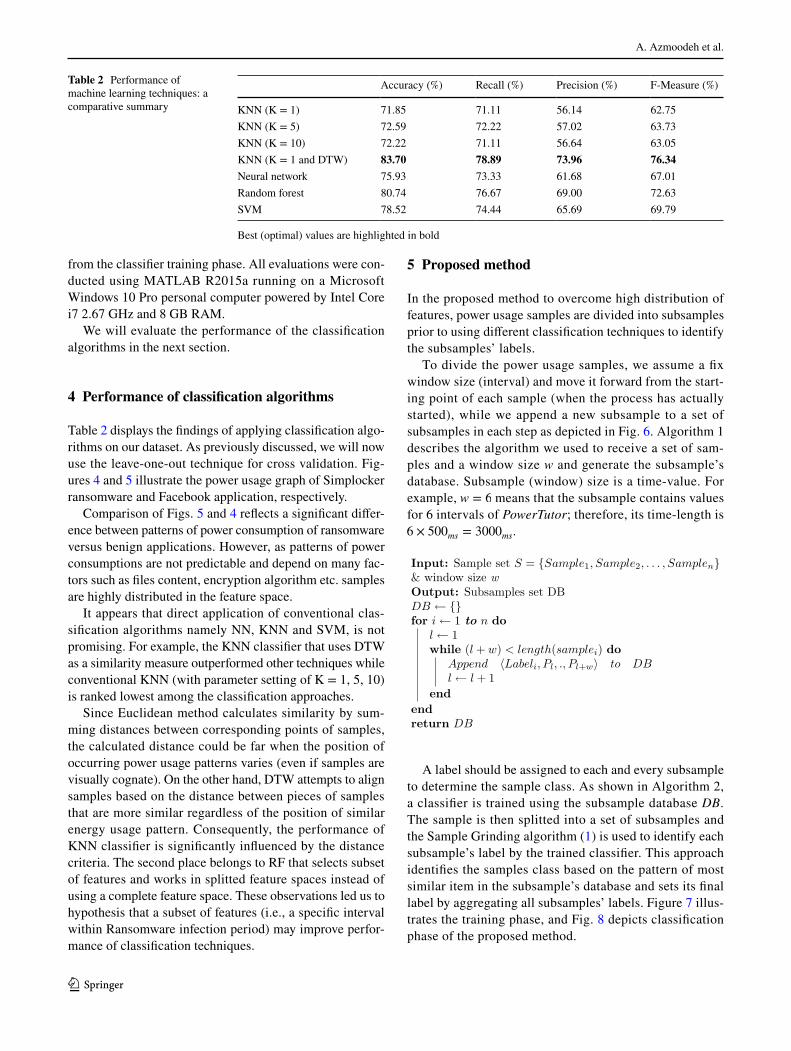
4 Performance of classification algorithms
Table 2 displays the findings of applying classification algo-rithms on our dataset. As previously discussed, we will now use the leave-one-out technique for cross validation. Fig-ures 4 and 5 illustrate the power usage graph of Simplocker ransomware and Facebook application, respectively.
Comparison of Figs. 5 and 4 reflects a significant differ-ence between patterns of power consumption of ransomware versus benign applications. However, as patterns of power consumptions are not predictable and depend on many fac-tors such as files content, encryption algorithm etc. samples are highly distributed in the feature space.
It appears that direct application of conventional clas-sification algorithms namely NN, KNN and SVM, is not promising. For example, the KNN classifier that uses DTW as a similarity measure outperformed other techniques while conventional KNN (with parameter setting of K = 1, 5, 10) is ranked lowest among the classification approaches.
Since Euclidean method calculates similarity by sum-ming distances between corresponding points of samples, the calculated distance could be far when the position of occurring power usage patterns varies (even if samples are visually cognate). On the other hand, DTW attempts to align samples based on the distance between pieces of samples that are more similar regardless of the position of similar energy usage pattern. Consequently, the performance of KNN classifier is significantly influenced by the distance criteria. The second place belongs to RF that selects subset of features and works in splitted feature spaces instead of using a complete feature space. These observations led us to hypothesis that a subset of features (i.e., a specific interval within Ransomware infection period) may improve perfor-mance of classification techniques.
5 Proposed method
In the proposed method to overcome high distribution of features, power usage samples are divided into subsamples prior to using different classification techniques to identify the subsamples’ labels.
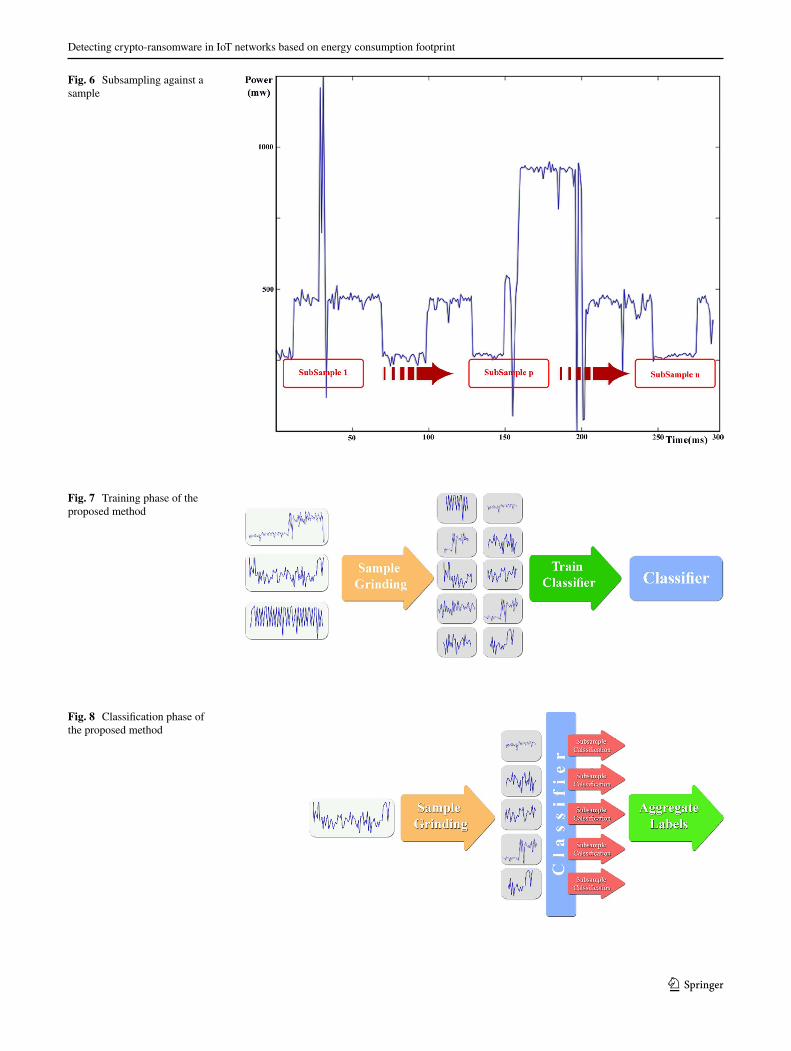
To divide the power usage samples, we assume a fix window size (interval) and move it forward from the start-ing point of each sample (when the process has actually started), while we append a new subsample to a set of subsamples in each step as depicted in Fig. 6. Algorithm 1 describes the algorithm we used to receive a set of sam-ples and a window size w and generate the subsample’s database. Subsample (window) size is a time-value. For example, w = 6 means that the subsample contains values for 6 intervals of PowerTutor; therefore, its time-length is 6 × 500ms = 3000ms.
Input: Sample set S = {Sample1, Sample2, . . . , Samplen}& window size wOutput: Subsamples set DBDB ← {}for i ← 1 to n do
l ← 1while (l + w) < length(samplei) do
Append 〈Labeli, Pl, ., Pl+w〉 to DBl ← l + 1
endendreturn DB
A label should be assigned to each and every subsample to determine the sample class. As shown in Algorithm 2, a classifier is trained using the subsample database DB. The sample is then splitted into a set of subsamples and the Sample Grinding algorithm (1) is used to identify each subsample’s label by the trained classifier. This approach identifies the samples class based on the pattern of most similar item in the subsample’s database and sets its final label by aggregating all subsamples’ labels. Figure 7 illus-trates the training phase, and Fig. 8 depicts classification phase of the proposed method.
Table 2 Performance of machine learning techniques: a comparative summary
Best (optimal) values are highlighted in bold
Accuracy (%) Recall (%) Precision (%) F-Measure (%)
KNN (K = 1) 71.85 71.11 56.14 62.75KNN (K = 5) 72.59 72.22 57.02 63.73KNN (K = 10) 72.22 71.11 56.64 63.05KNN (K = 1 and DTW) 83.70 78.89 73.96 76.34Neural network 75.93 73.33 61.68 67.01Random forest 80.74 76.67 69.00 72.63SVM 78.52 74.44 65.69 69.79
Detecting crypto-ransomware in IoT networks based on energy consumption footprint
1 3
Fig. 6 Subsampling against a sample
Fig. 7 Training phase of the proposed method
Fig. 8 Classification phase of the proposed method
A. Azmoodeh et al.
1 3
Input: Subsample database DB&SampleOutput: Labelε{R,G}Labels ← {}Classifier = TrainClassifier(DB)Subsamples = Grind Sample Using Algorithm 1i ← 1while i < size(Subsamples) do
L ← Classifier(Subsamplei)Append L to Labelsi ← i+ 1
endreturn most frequent item in Labels
In the next section, we will discuss our findings.
6 Findings and discussion
We experimented with different window sizes, ranging from 5 to 50 each an increment of 5 in each experiment. Hence, the window size of each dataset includes subsamples with length w.
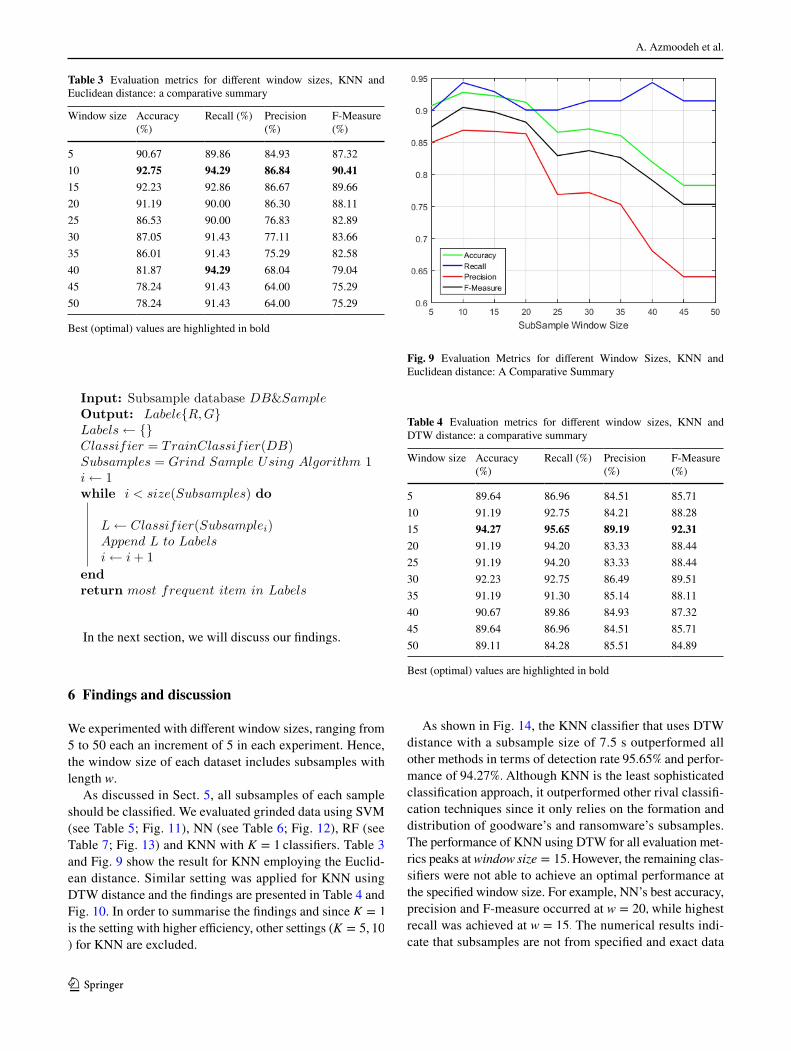
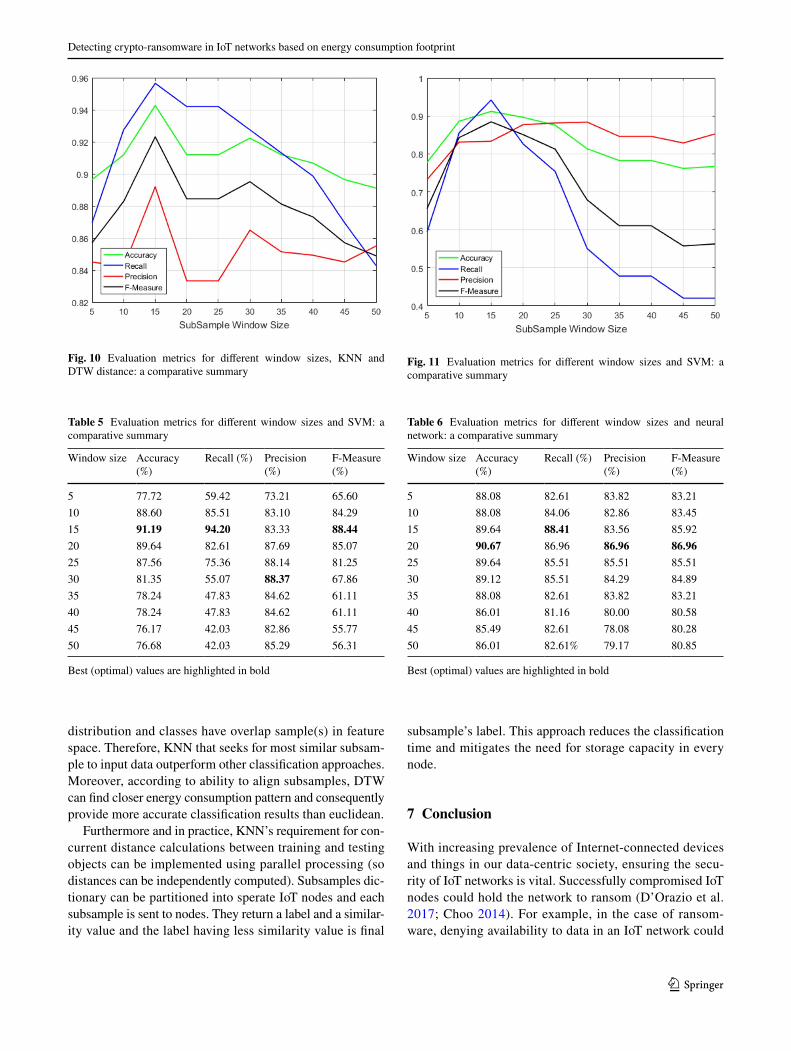
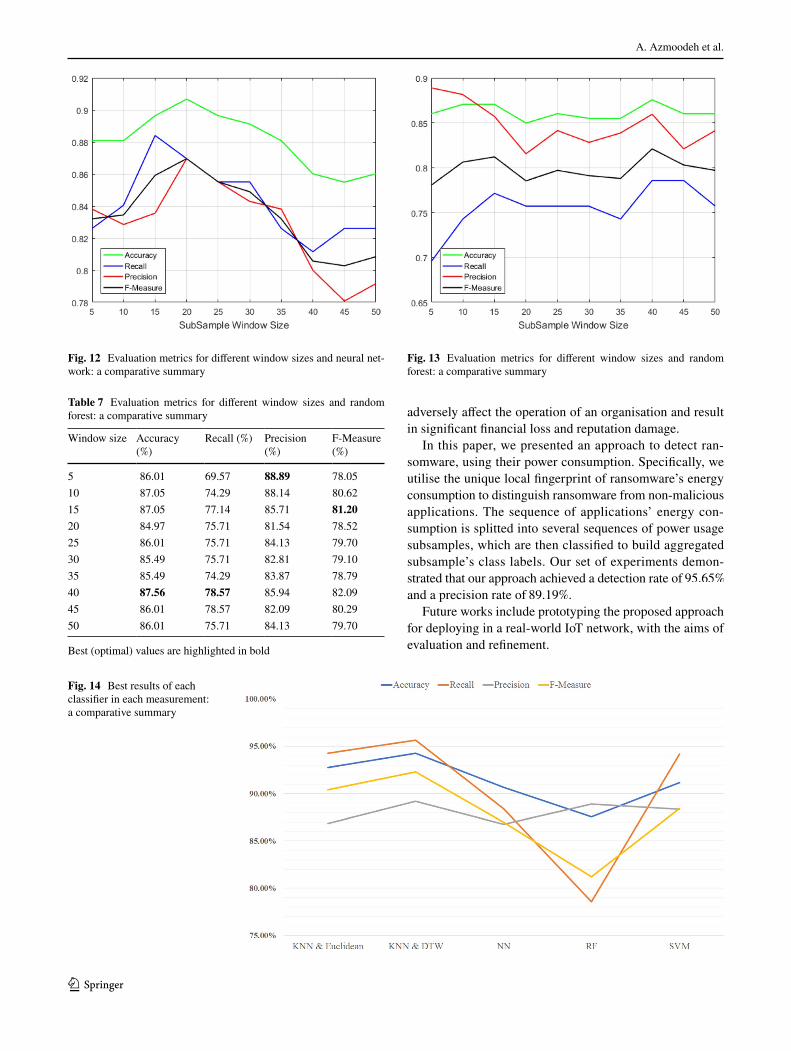
As discussed in Sect. 5, all subsamples of each sample should be classified. We evaluated grinded data using SVM (see Table 5; Fig. 11), NN (see Table 6; Fig. 12), RF (see Table 7; Fig. 13) and KNN with K = 1 classifiers. Table 3 and Fig. 9 show the result for KNN employing the Euclid-ean distance. Similar setting was applied for KNN using DTW distance and the findings are presented in Table 4 and Fig. 10. In order to summarise the findings and since K = 1 is the setting with higher efficiency, other settings (K = 5, 10
) for KNN are excluded.
As shown in Fig. 14, the KNN classifier that uses DTW distance with a subsample size of 7.5 s outperformed all other methods in terms of detection rate 95.65% and perfor-mance of 94.27%. Although KNN is the least sophisticated classification approach, it outperformed other rival classifi-cation techniques since it only relies on the formation and distribution of goodware’s and ransomware’s subsamples. The performance of KNN using DTW for all evaluation met-rics peaks at window size = 15. However, the remaining clas-sifiers were not able to achieve an optimal performance at the specified window size. For example, NN’s best accuracy, precision and F-measure occurred at w = 20, while highest recall was achieved at w = 15. The numerical results indi-cate that subsamples are not from specified and exact data
Table 3 Evaluation metrics for different window sizes, KNN and Euclidean distance: a comparative summary
Best (optimal) values are highlighted in bold
Window size Accuracy (%)
Recall (%) Precision (%)
F-Measure (%)
5 90.67 89.86 84.93 87.3210 92.75 94.29 86.84 90.4115 92.23 92.86 86.67 89.6620 91.19 90.00 86.30 88.1125 86.53 90.00 76.83 82.8930 87.05 91.43 77.11 83.6635 86.01 91.43 75.29 82.5840 81.87 94.29 68.04 79.0445 78.24 91.43 64.00 75.2950 78.24 91.43 64.00 75.29
Fig. 9 Evaluation Metrics for different Window Sizes, KNN and Euclidean distance: A Comparative Summary
Table 4 Evaluation metrics for different window sizes, KNN and DTW distance: a comparative summary
Best (optimal) values are highlighted in bold
Window size Accuracy (%)
Recall (%) Precision (%)
F-Measure (%)
5 89.64 86.96 84.51 85.7110 91.19 92.75 84.21 88.2815 94.27 95.65 89.19 92.3120 91.19 94.20 83.33 88.4425 91.19 94.20 83.33 88.4430 92.23 92.75 86.49 89.5135 91.19 91.30 85.14 88.1140 90.67 89.86 84.93 87.3245 89.64 86.96 84.51 85.7150 89.11 84.28 85.51 84.89
Detecting crypto-ransomware in IoT networks based on energy consumption footprint
1 3
distribution and classes have overlap sample(s) in feature space. Therefore, KNN that seeks for most similar subsam-ple to input data outperform other classification approaches. Moreover, according to ability to align subsamples, DTW can find closer energy consumption pattern and consequently provide more accurate classification results than euclidean.
Furthermore and in practice, KNN’s requirement for con-current distance calculations between training and testing objects can be implemented using parallel processing (so distances can be independently computed). Subsamples dic-tionary can be partitioned into sperate IoT nodes and each subsample is sent to nodes. They return a label and a similar-ity value and the label having less similarity value is final
subsample’s label. This approach reduces the classification time and mitigates the need for storage capacity in every node.
7 Conclusion
With increasing prevalence of Internet-connected devices and things in our data-centric society, ensuring the secu-rity of IoT networks is vital. Successfully compromised IoT nodes could hold the network to ransom (D’Orazio et al. 2017; Choo 2014). For example, in the case of ransom-ware, denying availability to data in an IoT network could
Fig. 10 Evaluation metrics for different window sizes, KNN and DTW distance: a comparative summary
Table 5 Evaluation metrics for different window sizes and SVM: a comparative summary
Best (optimal) values are highlighted in bold
Window size Accuracy (%)
Recall (%) Precision (%)
F-Measure (%)
5 77.72 59.42 73.21 65.6010 88.60 85.51 83.10 84.2915 91.19 94.20 83.33 88.4420 89.64 82.61 87.69 85.0725 87.56 75.36 88.14 81.2530 81.35 55.07 88.37 67.8635 78.24 47.83 84.62 61.1140 78.24 47.83 84.62 61.1145 76.17 42.03 82.86 55.7750 76.68 42.03 85.29 56.31
Fig. 11 Evaluation metrics for different window sizes and SVM: a comparative summary
Table 6 Evaluation metrics for different window sizes and neural network: a comparative summary
Best (optimal) values are highlighted in bold
Window size Accuracy (%)
Recall (%) Precision (%)
F-Measure (%)
5 88.08 82.61 83.82 83.2110 88.08 84.06 82.86 83.4515 89.64 88.41 83.56 85.9220 90.67 86.96 86.96 86.9625 89.64 85.51 85.51 85.5130 89.12 85.51 84.29 84.8935 88.08 82.61 83.82 83.2140 86.01 81.16 80.00 80.5845 85.49 82.61 78.08 80.2850 86.01 82.61% 79.17 80.85
A. Azmoodeh et al.
1 3
adversely affect the operation of an organisation and result in significant financial loss and reputation damage.
In this paper, we presented an approach to detect ran-somware, using their power consumption. Specifically, we utilise the unique local fingerprint of ransomware’s energy consumption to distinguish ransomware from non-malicious applications. The sequence of applications’ energy con-sumption is splitted into several sequences of power usage subsamples, which are then classified to build aggregated subsample’s class labels. Our set of experiments demon-strated that our approach achieved a detection rate of 95.65% and a precision rate of 89.19%.
Future works include prototyping the proposed approach for deploying in a real-world IoT network, with the aims of evaluation and refinement.
Fig. 12 Evaluation metrics for different window sizes and neural net-work: a comparative summary
Table 7 Evaluation metrics for different window sizes and random forest: a comparative summary
Best (optimal) values are highlighted in bold
Window size Accuracy (%)
Recall (%) Precision (%)
F-Measure (%)
5 86.01 69.57 88.89 78.0510 87.05 74.29 88.14 80.6215 87.05 77.14 85.71 81.2020 84.97 75.71 81.54 78.5225 86.01 75.71 84.13 79.7030 85.49 75.71 82.81 79.1035 85.49 74.29 83.87 78.7940 87.56 78.57 85.94 82.0945 86.01 78.57 82.09 80.2950 86.01 75.71 84.13 79.70
Fig. 13 Evaluation metrics for different window sizes and random forest: a comparative summary
Fig. 14 Best results of each classifier in each measurement: a comparative summary
Detecting crypto-ransomware in IoT networks based on energy consumption footprint
1 3
Acknowledgements We thank VirusTotal for providing us a private API key to access their data for constructing our dataset. This work is partially supported by the European Council International Incoming Fellowship (FP7-PEOPLE-2013-IIF) Grant.
Open Access This article is distributed under the terms of the Creative Commons Attribution 4.0 International License (http://crea-tivecommons.org/licenses/by/4.0/), which permits unrestricted use, distribution, and reproduction in any medium, provided you give appro-priate credit to the original author(s) and the source, provide a link to the Creative Commons license, and indicate if changes were made.
References
Abomhara M, Kien G (2015) Cyber security and the internet of things: vulnerabilities, threats, intruders and attacks. J Cyber Secur 4:65–88
Andronio N, Zanero S, Maggi F (2015) HelDroid: dissecting and detecting mobile Ransomware. In: Proceedings of the 18th international symposium on research in attacks, intrusions, and defenses, Volume 9404. RAID 2015. Springer, New York, pp 382–404
Bertino E, Choo KKR, Georgakopolous D, Nepal S (2016) Internet of things (iot): smart and secure service delivery. ACM Trans Internet Technol 16(4):22:1–22:7
Buczak AL, Guven E (2016) A survey of data mining and machine learning methods for cyber security intrusion detection. IEEE Commun Surv Tutor 18(2):1153–1176
Burges CJ (1998) A tutorial on support vector machines for pattern recognition. Data Min Knowl Disc 2(2):121–167
Caviglione L, Gaggero M, Lalande JF, Mazurczyk W, Urbański M (2016) Seeing the unseen: revealing mobile malware hidden com-munications via energy consumption and artificial intelligence. IEEE Trans Inf Forensics Secur 11(4):799–810
Choo K-KR (2014) A conceptual interdisciplinary plug-and-play cyber security framework. In: Kaur H, Tao X (eds) ICTs and the millen-nium development goals: a United Nations perspective. Springer, Boston, pp 81–99
Cover T, Hart P (1967) Nearest neighbor pattern classification. IEEE Trans Inf Theory 13(1):21–27
Damshenas M, Dehghantanha A, Choo K-KR, Mahmud R (2015) M0droid an android behavioral-based malware detection model. J Inf Priv Secur 11(3):141–157
Damshenas M, Dehghantanha A, Mahmoud R (2013) A survey on malware propagation, analysis, and detection. Int J Cyber Secur Digit Forensics 2(4):10–29
Daryabar F, Dehghantanha A, Udzir NI, binti Mohd Sani NF, bin Shamsuddin S (2012) Towards secure model for SCADA sys-tems. In: Proceedings title: 2012 International Conference on Cyber Security, Cyber Warfare and Digital Forensic (CyberSec), pp 60–64
Dezfouli FN, Dehghantanha A, Eterovic-Soric B, Choo K-KR (2016) Investigating social networking applications on smartphones detecting facebook, twitter, linkedin and google+ artefacts on android and ios platforms. Aust J Forensic Sci 48(4):469–488
D’Orazio CJ, Choo K-KR (2016) Circumventing iOS security mecha-nisms for APT forensic investigations: a security taxonomy for cloud apps. Future Gener Comput Syst. https://doi.org/10.1016/j.future.2016.11.010
D’Orazio CJ, Choo K-KR, Yang LT (2017) Data exfiltration from inter-net of things devices: IOS devices as case studies. IEEE Internet Things J 4(2):524–535
Faruki P, Bharmal A, Laxmi V, Ganmoor V, Gaur MS, Conti M, Rajarajan M (2015) Android security: a survey of issues, mal-ware penetration, and defenses. IEEE Commun Surv Tutor 17(2):998–1022
FBI (2016) How to protecting your networks from Ransomware. Tech. rep., USA Government. https://www.justice.gov/criminal-ccips/file/872771/download. Accessed 10 Feb 2017
Fortino G, Trunfio P (2014) Internet of things based on smart objects: technology, middleware and applications. Springer, Berlin
Fu T-C (2011) A review on time series data mining. Eng Appl Artif Intell 24(1):164–181
Gubbi J, Buyya R, Marusic S, Palaniswami M (2013) Internet of things (IOT): a vision, architectural elements, and future directions. Future Gener Comput Syst 29(7):1645–1660
Haykin S (1998) Neural networks: a comprehensive foundation, 2nd edn. Prentice Hall, Upper Saddle River
Jing Q, Vasilakos AV, Wan J, Lu J, Qiu D (2014) Security of the internet of things: perspectives and challenges. Wireless Netw 20(8):2481–2501
Kim H, Smith J, Shin KG (2008) Detecting energy-greedy anomalies and mobile malware variants. In: Proceedings of the 6th interna-tional conference on mobile systems, applications, and services. ACM, pp 239–252
Kohavi R et al (1995) A study of cross-validation and bootstrap for accuracy estimation and model selection. Ijcai 14:1137–1145
Kumar JS, Patel DR (2014) A survey on internet of things: security and privacy issues. Int J Comput Appl 90(11):20–26
Mercaldo F, Luo X, Liao Q, Mercaldo F, Nardone V, Santone A, Visag-gio CA (2016) Ransomware steals your phone. formal methods rescue it. In: Formal techniques for distributed objects, compo-nents, and systems: 36th IFIP WG 6.1 International Conference, FORTE 2016, Held as Part of the 11th International Federated Conference on Distributed Computing Techniques, DisCoTec 2016, Heraklion, Crete, Greece, June 6–9, 2016, Proceedings. Vol. 9688 of Lecture Notes in Computer Science. Springer, pp 212–221
Merlo A, Migliardi M, Caviglione L (2015a) A survey on energy-aware security mechanisms. Pervasive Mob Comput 24:77–90
Merlo A, Migliardi M, Fontanelli P (2015b) Measuring and estimating power consumption in android to support energy-based intrusion detection. J Comput Secur 23(5):611–637
Michalski RS, Carbonell JG, Mitchell TM (2013) Machine learning: an artificial intelligence approach. Artificial intelligence series. Springer, Berlin
Müller M (2007) Dynamic time warping. Springer, BerlinO’Gorman G, McDonald G (2012) Ransomware: a growing menace.
Tech. rep., Symantec Corporation. http://www.symantec.com/content/en/us/enterprise/media/security_response/whitepapers/ransomware-a-growing-menace.pdf. Accessed 12 Feb 2017
Pajouh HH, Javidan R, Khayami R, Ali D, Choo K-KR (2016) A two-layer dimension reduction and two-tier classification model for anomaly-based intrusion detection in IoT backbone net-works. IEEE Trans Emerg Top Comput. https://doi.org/10.1109/TETC.2016.2633228
Potlapally NR, Ravi S, Raghunathan A, Jha NK (2006) A study of the energy consumption characteristics of cryptographic algorithms and security protocols. IEEE Trans Mob Comput 5(2):128–143
Sgandurra D, Muñoz-González L, Mohsen R, Lupu EC (2016) Auto-mated dynamic analysis of ransomware: Benefits, limitations and use for detection. arXiv:1609.03020 (preprint)
Shaerpour K, Dehghantanha A, Mahmod R (2013) Trends in android malware detection. J Digit Forensics Secur Law 8(3):21–40
Sicari S, Rizzardi A, Grieco LA, Coen-Porisini A (2015) Security, privacy and trust in internet of things: the road ahead. Comput Netw 76:146–164
A. Azmoodeh et al.
1 3
Song S, Kim B, Lee S (2016) The effective ransomware prevention technique using process monitoring on android platform. Mob Inf Syst 2016:3–11
Suarez-Tangil G, Tapiador JE, Peris-Lopez P, Ribagorda A (2014) Evo-lution, detection and analysis of malware for smart devices. IEEE Commun Surv Tutor 16(2):961–987
Tankard C (2015) The security issues of the internet of things. Comput Fraud Secur 2015(9):11–14
Teing Y-Y, Dehghantanha A, Choo K-KR, Yang LT (2017) Forensic investigation of P2P cloud storage services and backbone for IoT networks: BitTorrent Sync as a case study. Comput Electr Eng 58:350–363. https://doi.org/10.1016/j.compeleceng.2016.08.020
Verikas A, Gelzinis A, Bacauskiene M (2011) Mining data with ran-dom forests: a survey and results of new tests. Pattern Recogn 44(2):330–349
Watson S, Dehghantanha A (2016) Digital forensics: the missing piece of the internet of things promise. Comput Fraud Secur 2016(6):5–8
Xing Z, Pei J, Keogh E (2010) A brief survey on sequence classifica-tion. ACM SIGKDD Explor Newsl 12(1):40–48
Yang H, Tang R (2016) Power consumption based android malware detection. J Electr Comput Eng 2016:1–7
Yang Z (2012) Powertutor—a power monitor for android-based mobile platforms. Tech. rep., EECS, University of Michigan. http://ziyang.eecs.umich.edu/projects/powertutor. Accessed 25 Jan 2017