detecting, diagnosing and controlling process variations
TRANSCRIPT

Detecting, Diagnosing and Controlling Process Variations: A Review of Modeling Options
Venkat Venkatasubramanian
Laboratory for Intelligent Process SystemsSchool of Chemical Engineering
Purdue UniversityW.Lafayette, IN47907

© V.Venkatasubramanian
Outline
IntroductionExceptional Events (Abnormal Events) Management (AEM/EEM) Intelligent ControlChallenges and Issues
Model based and Process History-based methodsEmerging TrendsFuture Directions

© V.Venkatasubramanian
Lecture Philosophy
Broad overviewNot a detailed, in-depth reviewIdentify key concepts, issues, challengesCompare and contrast different approaches
© V.Venkatasubramanian
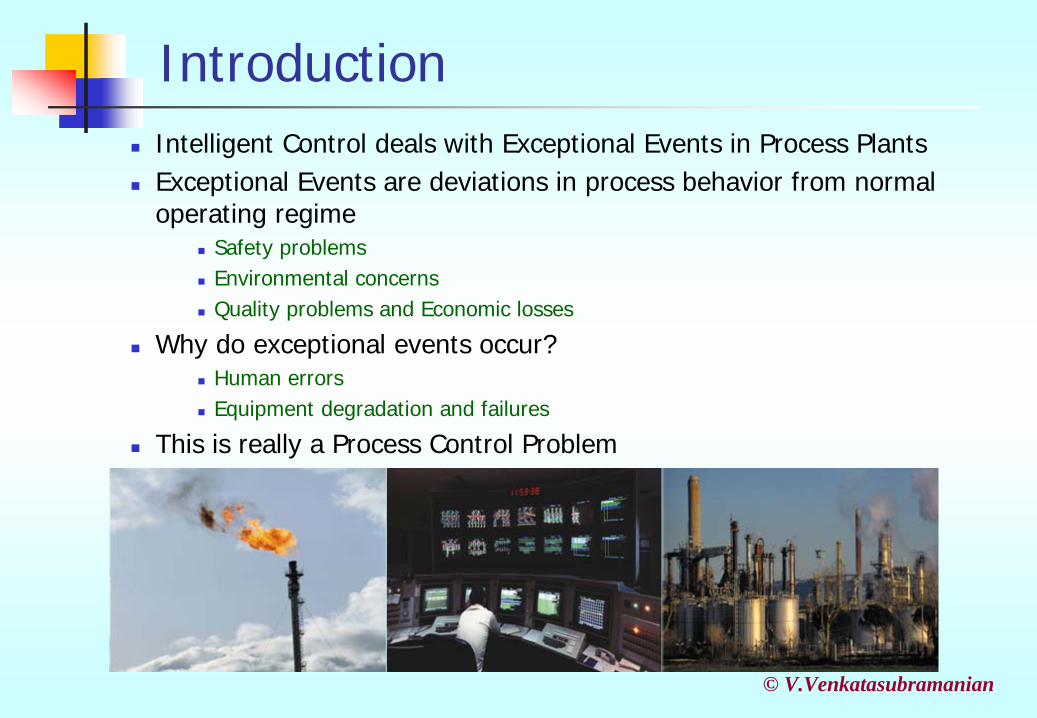
IntroductionIntelligent Control deals with Exceptional Events in Process PlantsExceptional Events are deviations in process behavior from normal operating regime
Safety problemsEnvironmental concernsQuality problems and Economic losses
Why do exceptional events occur?Human errors Equipment degradation and failures
This is really a Process Control Problem

© V.Venkatasubramanian
Process Fault Detection and DiagnosisFirst Step in Exceptional Events Management
Find out what is wrong
Interpreting current status of process Utilizing sensor data & process knowledge, isolate abnormal situations
DiagnosticSystem
Sensor Readings
Process KnowledgeProcess
Infer Process State - Detection: Normal/Abnormal& Isolation of abnormality
Problem Size and ComplexityAs many as 1500 variables monitored every few secondsIntegrated Process Operations
Broad scope of the task: Variety of Process Failures Parametric Faults, Structural faults, Malfunctioning Sensors/Actuators
Process Measurements may beInsufficient, Incomplete, Unreliable

Diagnostic Approaches – Brief Review
Process Fault Diagnosis: First Step in Intelligent ControlDiagnostic Philosophies
Source of Process knowledge- Process Model - Process History
Form of Process knowledge- Qualitative - Quantitative
Process Model : Deep, Causal or Model-Based knowledgeProcess History : Shallow, Compiled, Evidential knowledge
V. Venkatasubramanian, R. Rengaswamy, K. Yin and S. N. Kavuri, “Review of Process Fault Diagnosis - Part I, II and III”, Computers and Chemical Engineering, 27(3), 293-346, 2003.

© V.Venkatasubramanian
TransformationsDiagnostic Decision Process
View as a series of transformations or mappings on process measurements
Important Components in the process:a priori process knowledge and search technique
Measurement Space
Feature Space
Decision Space
Class Space
Sets of measurements input to the diagnostic system
Useful features extracted as a function of measurementsusing a priori problem knowledge
Map feature space to decision space to meet some objective - minimizing misclassification e.g. using discriminant function/threshold function
Class space: fault classes, final interpretation of the system deliveredto the user. By threshold functions, template matching, symbolic reasoning

© V.Venkatasubramanian
Example
x1
xn
ynn
f1
f1
f2
f2
f3
Hidden layer Output layerInput layer
wi
... ... ... ...
Measurement Space Feature Space Decision Space
Class Space
Neural Network based classifierInput Nodes: Measurement SpaceHidden Nodes: Feature SpaceOutput Nodes: Decision SpaceInterpretation of Outputs: Class Space

© V.Venkatasubramanian
Classification of Diagnostic Methods: Options
DiagnosticMethods
Structural
Functional
Causal Models
AbstractionHierarchy
Fault Trees
Digraphs
Quantitative Qualitative
EKF
ParitySpace
Observers
QualitativePhysics
Process History Based
Qualitative Quantitative
Expert systems
QTA Statistical
StatisticalClassifiers
PCA/PLS
Neural Networks
Model-Based

QUANTITATIVE MODEL-BASED

© V.Venkatasubramanian
Model-based Detection and Diagnosis
Consistency Checking (Analytical Redundancy): Compare actual behavior with a nominal fault-free model driven by same inputs, using residuals.Residuals: Functions accentuated by faults representing this inconsistency
ProcessActual Operation
Model ofNormal Operation
MeasuredSituation
CalculatedSituation
Knowninputs (u)
Unknowninputs (d) Faults (f) Known
inputs (u)
Comparison
ResidualGeneration
DecisionMaking
Statistical testing of residuals to arrive at a diagnostic conclusion
Unknown fault modes, uncertain nominal model,system/measurement noise
ResidualAnalysis
FaultsResiduals

© V.Venkatasubramanian
Quantitative ModelsKey idea is to check the parity (consistency) of plant models by using actual measurements - sensor outputs (measurements) and process inputs
Observer-based MethodsDevelop a set of observers each sensitive to set of faults while being insensitive to the other faults/unknown inputs.Observers for nonlinear systems: Elegant approach for fault-affine (Frank,1990)Bilinear nonlinearity (Ding et. al. 1995); Differential geometric methods (Yang and Saif, 1995)Good Reviews by Frank (1990,1994); Patton & Chen (1997)
Parity-Space ApproachesRearranged/transformed variants of the input-output/state-space modelsChow and Willsky (1984) provided a general scheme for both direct and temporal redundancyOnce residual properties have been selected all parity and observer based designs are fundamentally equivalent (Gertler, 1991) Reviews of parity space by Patton and Chen (1991); Gertler (1997)

© V.Venkatasubramanian
Quantitative ModelsKalman Filters
Stochastic version of observers: Estimating x based on u and y; with gaussian white noisesKalman filter in state space model is equivalent to an optimal predictor for a linear stochastic system in the input-output model.Single Filter (Mehra and Peshon, 1971, Clark 1978)Bank of filters (Wilbers and Speyer, 1989)Extended Kalman Filter (Chang and Huang, 1998; Huang et. al., 2000)
Parameter Estimation TechniquesAlternative Approach: Not based on state estimationFaults of a dynamic system are reflected in the physical parametersDetect faults via estimation of the parameters (Isermann, 1984)Different estimation techniques: least squares, nonlinear optimizationGood Reviews: Young (1981), Isermann (1984), Patton et al., (1989), Frank (1990)

© V.Venkatasubramanian
Issues in Model-Based Diagnosis
Modeling uncertainty: Availability of a ‘decent’ modelPerfectly accurate/complete model of a physical system is rarelyavailableUncertainty: Mismatch between actual process and its math modelEffect of modeling uncertainties is very crucial
Sensitizing/Desensitizing & RobustnessDecoupling fault effects, system/measurement noiseInsensitive to modeling uncertainty, noise, disturbances with increased sensitivity to faults
Online speed: Computations Vs PerformanceTheory
Well developed for linear systems, nonlinear systems’ still not mature
© V.Venkatasubramanian
Quantitative Model-Based
MeritsMathematical approach based on first principlesEstimation of fault magnitude, multiple fault identifiabilityHandling novel situations
DemeritsRequirement of a good modelEffect of modeling uncertainties is very crucialNeed robustness to shifts in normal regimes, noiseLinear Vs Nonlinear systemsProcedural nature: No explanation facility
Online speed: Computations Vs Performance

© V.Venkatasubramanian
Classification of Diagnostic Methods
DiagnosticMethods
Structural
Functional
Causal Models
AbstractionHierarchy
Fault Trees
Digraphs
Quantitative Qualitative
EKF
ParitySpace
Observers
QualitativePhysics
Process History Based
Qualitative Quantitative
Expert systems
QTA Statistical
StatisticalClassifiers
PCA/PLS
Neural Networks
Model-Based

© V.Venkatasubramanian
QUALITATIVE MODEL-BASED

© V.Venkatasubramanian
Qualitative Models
Fault Trees Qualitative cause-effect relationships represented as a treeFault Trees (Lapp & Powers, 1977)
Top-down, symptom-driven approachQualitative ambiguities
Signed Digraphs and Causal ModelsQualitative cause-effect relationships as a directed graph with nodes and arcsBottom-up, cause-driven approachQualitative ambiguitiesSingle fault diagnosis (Iri et.al., 1979; Kramer and Palowitch, 1987;Wilcox and Himmelblau, 1994)
Multiple fault diagnosis (Morales and Garcia, 1990; Vedam and Venkatasubramanian, 1999)
Abstraction Hierarchy

© V.Venkatasubramanian
Qualitative Model Based
MeritsQualitative nature facilitates their development without exact model equationsCompleteness: Enumerates all possible root causes
DemeritsNeed to develop and maintain SDGQualitative nature results in poor resolutionNumber of spurious solutions

© V.Venkatasubramanian
Model based Framework: Challenges
Appropriate level of modelingToo Coarse: Not very useful resultsToo Fine: Too complex and buried in details Quantitative vs Qualitative
ALL MODELS ARE WRONG, SOME ARE USEFUL
-- George Box

PROCESS HISTORY-BASED

© V.Venkatasubramanian
Process History Based Techniques
Process-History Data from normal/abnormal operationQuantitative Methods
Neural Networks : Easy learning & interpolation capabilities leading to numerous diagnostic applications (Venkatasubramanian et. al. 1989, 93, 94)
Statistical Techniques :Univariate SPC based on limit-checkingMultivariate PCA/PLS based monitoring (MacGregor et. al., 1994)
Qualitative MethodsQualitative Trend Analysis : Sensor Trend Information
Trend Language, Trend Identification and Mapping to faults (Cheung & Stephanopoulos, 1990; Janusz & Venkatasubramanian, 1991; Rengaswamy & Venkatasubramanian, 1995)
Rule-Based Expert-Systems : Mapping of known symptoms to root causes (Kramer, 1987; Rich & Venkatasubramanian, 1987)
Process History enters the antecedent and consequent of rulesLack of generality; Poor handling of novel situations

Qualitative Trend Analysis: Representation
Primitives RepresentationEach segment is represented by a quadratic polynomial equation and is characterized by its first and second derivatives
23Janusz, M. et al. (1991). Automatic generation of qualitative description of process trends for fault detection and diagnosis. Engineering Applications of
Artificial Intelligence 4(5), 329‐339
D B C
G E F
A
(+,-) (+,+)(+,0)
(-,-) (-,+) (-,0)
(0, )
Fundamental Language: Primitives
D G
E B
D G
All trends can be represented by these seven basic shapes (primitives)
This sequence of basic shapes (primitives) represents the trend

© V.Venkatasubramanian
Desirable Features of an Intelligent Control System
Early detection & diagnosis
Isolability : discriminate between failures
Robustness : to noise & uncertainities
Novelty Identifiability : novel malfunction
Explanation facility : Fault propagation
Adaptability : Processes change & evolve
Reasonable storage & computational requirement
Multiple Fault Identifiability : Difficult requirement

© V.Venkatasubramanian
Comparison of Different Diagnostic Methods
No single method achieves all !!!

© V.Venkatasubramanian
Hybrid FrameworkNo single method meets all the criteria of
a ‘good’ diagnostic methodA Hybrid Framework
Involving different methodologiesBased on a collective and synergistic approach to problem solving seems most promising (Mylaraswamy & Venkatasubramanian, 1997)Compensate one method’s weakness with the strengths of another’s
DKit implemented in G2Effectiveness demonstrated on Model IV FCCU by successfully diagnosing wide varieties of faultsCombined causal model-based diagnosis with statistical classifiersBasis for the prototype of the ASM ConsortiumLicensed to Honeywell by Purdue University

Hybrid Methods
27Maurya, M.R. et al (2007). A signed directed graph and qualitative trend analysis‐based framework for incipient fault diagnosis. Chemical Engineering
Research and Design 85(A10), 1407‐1422
Obtain SDG based on equations governing the processObtain Measured IRT
Obtain Set of Possible Candidate Faults
Compare IRT
Simple UnimodalsRepresent faults as sequences of basic shapes
Compare sequences
Knowledge Base of Fault
Patterns
Knowledge Base of Fault
Patterns
Most Probable Fault Determined
Qualitative Trend Analysis (QTA)
Fault Detection
& Diagnosis
(Level 1)
Fault Detection
& Diagnosis
(Level 1)
Fault Detection
& Diagnosis
(Level 2)
Fault Detection
& Diagnosis
(Level 2)
Data from ProcessSigned Directed Graphs (SDG)
Hybrid Methods: All methods have advantages and disadvantages. Combining methods allows us to capitalize on the advantages and make up for the disadvantages
28
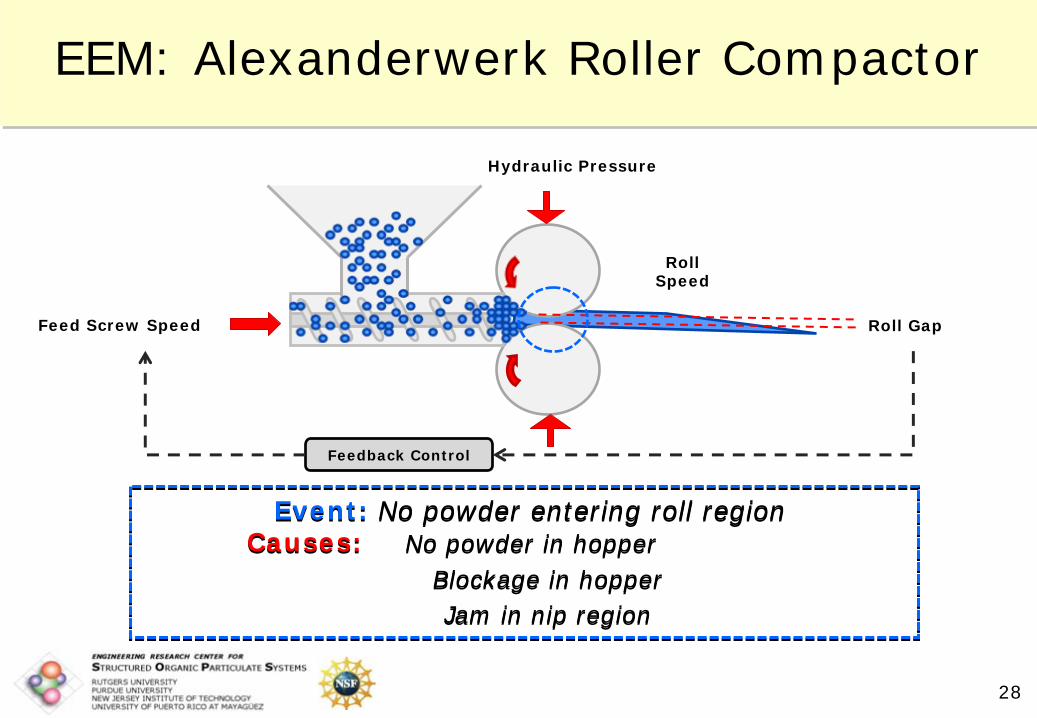
EEM: Alexanderwerk Roller Compactor
Roll GapFeed Screw Speed
Hydraulic Pressure
Feedback Control
Roll Speed
Event: No powder entering roll regionCauses: No powder in hopper
Blockage in hopperJam in nip region
Event: No powder entering roll regionCauses: No powder in hopper
Blockage in hopperJam in nip region

Roller Compactor
29
Feedback Controller
Governing Equations of Roller Compaction Process
Qualitative Simplification of Mathematical Model
Signed Directed Graph and Initial Response Table
In the absence of models that capture abnormal behavior, expert and/or operator knowledge of exceptional events can be incorporated into initial response table

Qualitative Trend Analysis: Hybrid Methods
30
Fault Detection & Diagnosis: SDGFirst Level of Diagnosis
Fault Detection & Diagnosis: QTASecond Level of Diagnosis
Roll Gap Feed Speed Hydraulic Pressure
Roll Speed
Confidence Index
0.592 0.503 0.653 1.000 0.503
Step 1 Calculate Similarity Match Step 2 Calculate Similarity Measure
B curve under AreaA curve under Area
Based-Shaped =
( )⎥⎥⎦
⎤
⎢⎢⎣
⎡ −−= 2
2
21
expmr
ab
σBased-Size
∑Δ∑ Δ
=i
iittS
MeasureSimilarity
Maurya, M.R. et al (2007). A signed directed graph and qualitative trend analysis‐based framework for incipient fault diagnosis. Chemical Engineering
Research and Design 85(A10), 1407‐1422

31
Feedback Controller

32
EEM detected and diagnosed exceptional within 10 seconds of its inception
EEM detected and diagnosed before feedback controller reacted to decrease in roll gap by increasing feed screw speed
Incipient detection & diagnosis
Currently, exceptional event and mitigation strategy appear as warning
0 5 10 15 202200
2400
2600
2800Roll Gap
0 5 10 15 2029
30
31
32Hydraulic Pressure
0 5 10 15 2018
18.5
19
19.5
20Feed Screw Speed
0 5 10 15 203
3.5
4
4.5
5Roll Speed

Continuous Manufacturing Line
33
Feeder A
Feeder B
Blender Roller Compactor
API
Blend
Excipients
Ribbons
Partially Continuous Dry Granulation Line
Powder Weight (kg)
Powder Weight (kg)
Feed Rate (kg/hr)
Feed Rate (kg/hr)
Roll Gap (microns)
Feed Screw Speed (rpm)
Hydraulic Pressure (bar)
Roll Speed (rpm)
Blender Mix Speed (rpm)

© V.Venkatasubramanian
Integrated Intelligent Control Systems
Intelligent MonitoringIntelligent Monitoring
Fault DiagnosisFault Diagnosis
Regulatory Control(MPC)
Regulatory Control(MPC)
ProcessProcess
Data AcquisitionData Acquisition
OperatorOperator
Data Reconciliation Parameter EstimationData Reconciliation Parameter Estimation
Supervisory ControlFault Administration
and RTOSupervisory ControlFault Administration
and RTO
Data
Data
Data Data
Manipulated Variables
Reconciled Data
Sens
or
Tren
ds
Faults
Faults FDDDesign
Setpoints
Cont
rolle
r Se
ttin
gs
Information Specifications
Parameter Estimates

© V.Venkatasubramanian
Summary
Reviewed the approaches, challenges, and emerging trends in Intelligent Control Systems
Model based and Process history based approachesHybrid Systems
Intelligent control systems can make a substantial improvement to current practices
Considerable challenges remain but good progress has been made in recent years
Future potential is enormous and exciting

© V.Venkatasubramanian
Acknolwedgements
CollaboratorsNSF ERC C-SOPS Team
Funding AgenciesHoneywell ASM ConsortiumExxonMobil, ICI, Air Products, Mitsubishi, A D Little, Searle, Eli Lilly, Nova ChemicalsNSF, NIOSH, DOE, INLNSF ERC C-SOPSPurdue Trask Fund