detecting nonpersonal and spam users on geotagged twitter
TRANSCRIPT

Detecting Non-personal and Spam Users on Geo-taggedTwitter Network
Diansheng Guo and Chao Chen
Department of Geography, University of South Carolina
AbstractWith the rapid growth and popularity of mobile devices and location-aware technologies, online socialnetworks such as Twitter have become an important data source for scientists to conduct geo-socialnetwork research. Non-personal accounts, spam users and junk tweets, however, pose severe problems tothe extraction of meaningful information and the validation of any research findings on tweets or twitterusers. Therefore, the detection of such users is a critical and fundamental step for twitter-related geo-graphic research. In this study, we develop a methodological framework to: (1) extract user characteristicsbased on geographic, graph-based and content-based features of tweets; (2) construct a training datasetby manually inspecting and labeling a large sample of twitter users; and (3) derive reliable rules andknowledge for detecting non-personal users with supervised classification methods. The extracted geo-graphic characteristics of a user include maximum speed, mean speed, the number of different countiesthat the user has been to, and others. Content-based characteristics for a user include the number oftweets per month, the percentage of tweets with URLs or Hashtags, and the percentage of tweets withemotions, detected with sentiment analysis. The extracted rules are theoretically interesting and practi-cally useful. Specifically, the results show that geographic features, such as the average speed and fre-quency of county changes, can serve as important indicators of non-personal users. For non-spatialcharacteristics, the percentage of tweets with a high human factor index, the percentage of tweets withURLs, and the percentage of tweets with mentioned/replied users are the top three features in detectingnon-personal users.
1 Introduction
With the increasing popularity of location-aware devices and platforms, there are more andmore user-generated and geo-tagged data sources (Goodchild 2007), which can be classifiedinto two types. For the first type, citizens explicitly provide geographic data, such as roads orgeographic boundaries, with examples including OpenstreetMap, Google Mymap, andWikimapia. For the second type, citizens are willing to turn on their location informationwhen involved in various social activities on different platforms, such as Twitter, Foursquare,Instagram and Flickr. The latter type of data is mostly from location-based social networks,combining social networking services with location technologies such as GPS-enabled mobiledevices (Bertrand De et al. 2009).
Twitter is a microblog service that allows users to send messages of at most 140 charactersto their followers. As of October in 2013, there are about 231.7 million active users world-wide and 300 billion tweets since Twitter was established. Among all tweets, there are about
Address for correspondence: Diansheng Guo, Department of Geography, University of South Carolina, 709 Bull Street, Columbia, SC29208, USA. [email protected]: This work was supported in part by the National Science Foundation under Grant No. 0748813. Part of the researchis also supported by the Institute of Museum and Library Services (IMLS) through the National Leadership Grant LG-00-14-0030-14.
bs_bs_banner
Research Article Transactions in GIS, 2014, 18(3): 370–384
© 2014 John Wiley & Sons Ltd doi: 10.1111/tgis.12101

2–3% that have geographic locations, i.e. geotagged. In this research, we focus on the tweetswith point locations (i.e. latitude and longitude) and exclude those that only have place names(city, county, or state). For example, for 10-months in the US, there are 5,284,910 activetwitter users with at least one geo-tagged tweet, among which 2,935,975 users have at leastfive geo-tagged tweets with latitudes and longitudes. The analysis of geotagged tweets hasproved useful in various areas, such as crisis detection and management (Bertrand De et al.2009; MacEachren et al. 2011) and location-based marketing and recommendation (Sitaramand Bernardo 2010).
However, not all twitter accounts represent individual people. Driven by various purposes,there are more and more emerging accounts that are organizations, agencies, services, bots,and spammers. The tweets from these non-personal accounts can distort or mislead twitteranalysis results in various applications (Benevenuto et al. 2010), especially those on studiesof human behavior, choice, and activities, which assume that each involved twitter user is anindividual person and that his/her tweets represent personal interests and activities. Therefore,it becomes critical to detect non-personal accounts (e.g. organizations, services, bots, andspam users) and exclude them (or treat them separately) in spatial analysis of tweets or twitterusers.
In this article, we propose an approach to the detection of non-personal users with geo-tagged tweets on the Twitter network by: (1) extracting content-based features, graph-basedfeatures, and geographic features; (2) manually constructing training data sets for supervisedclassification and knowledge discovery; and (3) evaluating the extracted rules with additionalreclassification of new twitter data to understand the characteristics of non-personal twitterusers. In this research, we broadly define non-personal twitter users as those that do not postcontents on personal daily lives. In general, there are four different kinds of non-personaltwitter accounts, including bots (machine accounts that automatically send tweets), organiza-tion accounts (such as group or organizational accounts), individual accounts that only postcareer information, or spam users that post commercial or malicious content. Some of thesenon-personal accounts and their tweets can be useful services otherwise, such as weatherreports and crime alerts. However, they are appropriate for the analysis of spatial and socialbehaviors of individuals. Therefore, as defined above, we classify organizational accounts andtwitter messages as ‘non-personal’ and separate them from accounts that represent a realperson. To our best knowledge, this is the first study that evaluates the characteristics of non-personal twitter accounts within geo-tagged tweets.
2 Literature Review
Spam detection is a classic topic in the study of email systems and web contents (Mishne 2005;Ntoulas et al. 2006). Spam email detection has been studied for a long time (Sahami et al.1998), with many spam filtering techniques developed and implemented. Compared withemail spam, web spam is more challenging to tackle, as it changes rapidly on a large scale.Techniques for detecting web spam can be based on directed graph models (Zhou et al. 2007),link-based and content-based features (Castillo et al. 2007), and semi-supervised algorithms(Geng et al. 2009; Wang 2010a). Meanwhile, spam detection also exists in other fields, such ascall spam detection (Wu et al. 2009), video spammer detection, and blog spammer detection(Mishne 2005).
In the past several years, online social networks have become an ideal target for dissemi-nating information, including personal activities, organizational messages, advertisements
Detecting Non-personal and Spam Users on Geo-tagged Twitter Network 371
© 2014 John Wiley & Sons Ltd Transactions in GIS, 2014, 18(3)

or even malicious content (Chu et al. 2012). For example, according to a study (Grier et al.2010), the probability of a user clicking a Twitter spam is around 0.13%, which is 20 timeshigher than the probability of clicking an email spam. The reasons for such a high click-through rate are related to several features of the Twitter network and tweets that spamusers can take advantage of. First, a tweet message is very short and users often insert URLsto point to target contents such as photos and web pages. The second feature is relatedto the hashtag, which can be inserted into a tweet to help users identify specific topics.The third feature is the trending topic, which is the most popular and recent of hashtags orkeywords in the Twitter network. Spammers can abuse the above features by insertingURLs, identical hashtags or keywords into a large number of tweets. The fourth feature isbased on the reply or mention functionality, with which a user can reply or mention otherusers by adding “@username” in their tweets. The fifth feature is the retweet functionality,which can be used to appeal to potential followers by retweeting other users’ tweets. Rela-tionship links on Twitter are directional through the follower network, in which Twitterusers can follow other Twitter users (Benevenuto et al. 2010). By analyzing the contents oftweets, one can also extract a friend network to reveal the actual interactions on the Twitternetwork (Huberman et al. 2009; Yang and Counts 2011). For example, a tweeter user canbe deemed as a friend to another user if one is mentioned by another user in tweets using“@username”.
Twitter spam detection approaches can be classified into three different types on thebasis of the analysis unit, including tweet-level analysis, user-level analysis and campaign-level analysis, At the tweet level, Martinez-Romo and Araujo (2013) applied probabilisticlanguage models to detect the topic divergence of each tweet by analyzing a large number oftweets related to some trending topics. After detecting the topic of a tweet, they calculate thedivergence of the topic from the relevant trending topic, using language models, and thusidentify spam tweets. In contrast, user-level spam detection has received the most attentionwith highest classification accuracy. Twitter spam can be detected by studying the tweetingbehavior, account age, and network structure of non-spammers and spammers (Yardi et al.2010). Wang (2010b) provided a prototype to classify suspicious users based on Twitter’sspam policy, a number of content-based features, and graph-based features. In a similarwork, McCord et al. (2011) applied four traditional classifiers to identify spammers withuser and content-based features and the Random Forest classifier. A spam campaign isdefined as a collection of Twitter accounts controlled and manipulated by a spammer.Chu et al. (2012) cluster Twitter users into different campaigns based upon the URLsretrieved from the tweets, and then extract features that can be incorporated to classifytwitter users.
Unlike previous research on spam detection on the Twitter network, our study focuseson Twitter users who have geo-tagged tweets (e.g. with latitudes and longitudes). Twitterusers can send geo-tagged tweets by turning on the location information at various plat-forms such as the Twitter website, Twitter apps on mobile devices, or other mobile applica-tions (e.g. Instagram and Foursquare). As explained earlier, in this study we are interestedin detecting non-personal twitter users who do not post contents related to individuals’ dailylives. There can be three different kinds of such accounts: (1) bots, organizations, and usergroups; (2) service-oriented accounts that send job-related information; and (3) spammersthat distribute commercial or even malicious content. The majority of such accounts arebots with various purposes, including weather alerts, traffic alerts, crime alerts, jobs adver-tisements, and sales promotions. A list of samples of geo-tagged non-personal accounts isprovided in Table 1.
372 D Guo and C Chen
© 2014 John Wiley & Sons Ltd Transactions in GIS, 2014, 18(3)

3 Detection of Non-personal Twitter Users with Geo-tagged Tweets
3.1 Overview
In this research, we collected all the geo-tagged tweets for the entire US through the Twitterstreaming API. Particularly, we focus on the tweets with point locations (i.e. latitude and lon-gitude) and exclude those that only have place names (city, county, or state). For each tweet wehave the account name, latitude/longitude, post time, and the message. We construct trainingdata sets using tweets from a 10-month period (December 2, 2012 – October 6, 2013) for the48 US contiguous states and Washington DC. The data include 637,330,759 tweets and5,284,910 unique users, among which 2,935,975 users have at least five geo-tagged tweetswith point locations (i.e. latitude and longitude). We extract a collection of content-based,graph-based and geographic features for each user based on all his/her tweets. To ensure thevalidity of each feature, we only include users that have at least five geo-tagged tweets duringthat time period. A training data set is constructed through an iterative sampling process withmanual inspection and labeling of user types (personal or non-personal accounts). A decisiontree is then learned with the training data to extract classification rules for non-personalaccount detection.
To evaluate the discovered rules, we extract the same set of features for users withtweets from a more recent four-month period (October 7, 2013 – February 8, 2014) for the 48US contiguous states and Washington DC. This data set includes 314,004,436 tweets and
Table 1 A list of sampled geo-tagged non-personal accounts and their tweets
Type Tweet Sample
Weather alert Severe Weather Statement issued November 01 at 5:11AMEDT until November 01 at 6:00AM EDT by NWSBlacksburg http://twitzip.com/alerts/294504
Police alert OrlPolice 32808@orlpol3280821m#ThreatsAssaultsArmed at 2757 Bent Willow Circle. #orlpol
News alert Man questioned after home explosion in Oak Lawn: OakLawn police question a man following a house fire and. . . http://dlvr.it/4hBxbs
Traffic alert In Guilford closed due to road construction on US-1 NBnear Church St. Stopped traffic from I 95
Sales promotion Single Family, $169000 4 beds 2.1 Baths, 77379http://www.har.com/87158245RE/MAXIntegrity#Spring
Job advertisement #CaliforniaJobs, CA #Insurance #Job: Auto DamageAdjuster Trainee at GEICO http://bit.ly/19VVclf#geicojobs#Jobs #TweetMyJobs
Sales promotion accounts @arrowmediadesig Hi can you promote my companyhttp://imperialimportsinc.com thanks.
Accounts with malicious content <URL links to inappropriate porn pictures>Non-individual accounts AVAILABLE PETS: Bull Winkle http://bit.ly/1bRZ7vQOther geotagged spammers hing. Good thing the tacs don’t care about culture or
history any more than you do, Captain, or they’d neverhave put hi
Detecting Non-personal and Spam Users on Geo-tagged Twitter Network 373
© 2014 John Wiley & Sons Ltd Transactions in GIS, 2014, 18(3)

4,109,330 unique users, among which 2,375,717 unique users have at least five tweets. Thediscovered rules are applied to classify the 2,375,717 unique users into two categories: non-personal and personal accounts, which we may also call “spam” and legitimate users, respec-tively. Then we randomly sample a set of predicted non-personal and personal accounts,separately, and manually check the tweets of each sampled user and determine the category.With this re-classification process, we can more reliably assess the robustness of the discoveredrules, with data from the different time period that is separate from the training data set.
Before presenting our methodology and results, we would like to emphasize the followingtwo points to ensure correct understanding of our approach. First, in our study we use non-personal accounts and “spammer” interchangeably, referring to non-personal accounts thatmay be bots, organization accounts, individual accounts that send only work-related informa-tion, or spammers that send commercial or malicious content. Figure 1 shows an account thatoccasionally posts non-geotagged tweets to advertise her products; but most of her geotaggedtweets are valid tweets sent through Foursquare Check-ins and showing her spatial mobility,thus this account is considered a legitimate (i.e. personal) user in our study. Second, certaintypes of non-personal users can only be discovered in the geotagged Twitter network by usinggeographic features such as speed. As shown in Figure 2, the user can be easily identified asa spammer since there is no reasonable transportation to help the user move 7,824 km in oneminute.
3.2 Feature Extraction
Conventional spam detection schemes on the Twitter network usually use content-basedand graph-based features. In this study, we not only extract and use traditional features suchas percentage of URLs and percentage of Hashtags, but also derive and use a collection ofnew features, including geographic features (such as speed and county changes), frequency
Figure 1 Screenshot of a legitimate geo-tagged account who occasionally posts advertisements inher non-spatial tweets but has valid geo-tagged tweets through Foursquare check-ins
374 D Guo and C Chen
© 2014 John Wiley & Sons Ltd Transactions in GIS, 2014, 18(3)

patterns (e.g. the variance of frequency being mentioned), sentiment-based features (e.g.percentage of tweets with emotions), and an indicator of friendship through replies andmentions.
3.2.1 Content-based features
Our initial detection schema includes 10 content-based features. With the initial classificationresult, we observed that all users but one who posted through five specific apps were personalusers. These five location-based apps are Instagram, Foursquare, Path, Endomondo, andFlickr, all of which provide location-based services such as restaurants check-ins. The tweetsposted through these apps contain corresponding external links, which non-spatial approachestend to treat as spam. Therefore, to improve the detection precision for our definition of non-personal accounts, we take these apps into consideration to refine related features and alsopropose a new feature called appTwtsPerc, measuring the percentage of such app-based tweetsof a user’s geo-tagged tweets.
Percentage of URLs (urlPerc): URLs are widely used in disseminating disruptive contentsin the Twitter network. According to Twitter’s policy, any user who mainly posts tweets withURLs is considered a spammer. The percentage of URLs is the ratio of the number of tweetscontaining URL links to the total retrieved geo-tagged tweets for each user. In calculating thisfeature, we exclude URLs posted through the aforementioned five location-based apps. Other-wise, this feature will be less useful because a certain number of individual users post geo-tagged tweets primarily through these apps, which tend to be identified as spam users due tothe extreme high percentage of URLs.
Percentage of Hashtags (hashtagsPerc): Hashtag is used to help users to identify particulartopics, defined with the format “#symbol” in a tweet. Very popular hashtags become trendingtopics. This feature is defined as the percentage of tweets that contain hashtags in all retrievedgeo-tagged tweets for a particular user.
Percentage of Retweets (retweetPerc): Retweets can be abused by spammers by automati-cally posting retweets. This feature represents the number of tweets containing “RT@username” over all retrieved tweets for each user.
User Sentiment Index (emotweetPerc): A sentiment index is proposed to determinewhether a user is a bot or a person. Sentiment analysis is used to assess the emotion of each
Figure 2 A spammer that has invalid locational information (with unreasonable speed)
Detecting Non-personal and Spam Users on Geo-tagged Twitter Network 375
© 2014 John Wiley & Sons Ltd Transactions in GIS, 2014, 18(3)

tweet and assign it an emotion value: positive (1), neutral (0), or negative (−1). The Senti-ment140 API, a computing service that can detect sentiment from tweets, is used to conductthe sentiment analysis, which relies on maximum entropy (Go et al. 2009; Nigam et al. 1999).We define the sentiment index for user Ui as follows:
S P TotalTi ik i= ∑ (1)
where Pik is the emotion value for the kth tweet of user Ui, and TotalTi is the total number ofretrieved geo-tagged tweets for Ui.
Human Factor Index (humanFactorPerc): If a tweet is sent via the aforementioned apps(i.e. Instagram, Foursquare, Path, Endomondo, and Flickr) or has a non-zero emotion score(emotweetPerc), we consider that this tweet has the potential to be from a real person and giveit a positive human factor score. We calculate a Human Factor Index for each user as the per-centage of his/her tweets with a positive human factor score.
In addition to the above mentioned features, we also extract six additional content-basedfeatures for each user:
• maxNumTwtsPerM – the maximum number of geotagged tweets per month, which isobtained from a 30-day time window for the study period and the maximum value for allwindows.
• minNumTwtsPerM – the minimum number of geotagged tweets per month in the studyperiod.
• diffTwtsPerM – the difference between maxNumTwtsPerM and minNumTwtsPerM.• meanTimeInterval – the mean time intervals between two consecutive geotagged tweets.• timeIntervalStd – the standard deviation of time intervals between two consecutive
geotagged tweets.• percAppTwts – the percentage of tweets posted via the five above mentioned apps.
3.2.2 Graph-based features
Graph-based features are based on the interaction among users through tweet replies and men-tions, which can be used by both legitimate (personal) and non-personal users. We hope toextract features that can find distinctively different patterns for the two types of users.
Percentage of Replies/Mentions (repliedPerc): A user can reply to or mention other usersby inserting “@username” in tweets. This feature is calculated as the percentage of total tweetsfor a user that have mentioned or replied someone. Note: the mentioned user in the tweetsmay or may not have geo-tagged tweets.
Mention/Reply User Count (uniMentnUsersPerM): The number of unique users that auser Ui mentioned, normalized with the number of months. Since different users can be men-tioned multiple times by Ui, the variance of the frequencies for all mentioned users is calcu-lated, called normVar. We also calculate the number of times that Ui is mentioned by otherusers per month (beMntCntsPerM).
Friend-Network Relationship (friendIndicator): A measure defined as the number ofunique mentioned/replied users over the number of times of being mentioned by other users(see Equation 2, where 0.01 is added to the denominator to avoid dividing a zero value).
friendIndicatorbeMntCntsPerM
uniMentnUsers beMntCntsPeri
i
i
=+ MMi + 0 01.
(2)
376 D Guo and C Chen
© 2014 John Wiley & Sons Ltd Transactions in GIS, 2014, 18(3)

3.2.3 Geographic features
We extract seven geographic features for each user. The tweeting speed in our article is definedas the distance between two consecutive tweets of a user divided by the time interval betweenthe two tweets. If the time interval is longer than one day, then we use one day instead. Thedistance interval is the geographical distance between two consecutive tweets.
• hasLocsCntsPerM – the average monthly number of mentioned/replied users who havegeotagged tweets. To get this value, we firstly retrieve all the mentioned/replied users foreach account based upon his or her geotagged tweets. Then we iterate through all theseusers and consider one as a user with locations if this user ever sent geotagged tweets.Lastly, we divide the number of users with locations by the number of months to get thisvariable.
• uniqueCntyCntsPerM – the average monthly number of counties in which the user hasbeen.
• cntyChangesPerM – the number of times per month that a user moves across countyboundaries between consecutive tweets.
• maxSpeed – the maximum tweeting speed for a user. To get this value, we find themaximum speed among all of the tweeting speeds between each pair of consecutivetweets that has a distance interval more than 1.6 km (1 mi). The distance threshold isset to avoid speed errors caused by location inaccuracy within a short distance. Mostcellular service providers have adopted Assisted-GPS technology that combines GPS (withan average accuracy of 10 m), Wi-Fi (70–80 m), and cellular position (100–300 m) toprovide location information (Zandbergen 2009). The distance between two tweet loca-tions can have an error of as much as 500 m or even more when GPS or Wi-Fi signalsare not available. Therefore we only calculate speed for distances longer than 1,600 m(i.e. about one mile).
• meanSpeed – the average tweeting speed.• maxSpeedDist – the distance interval when the maximum tweeting speed occurs.• speedLimitCntsPerM – average monthly number of times that the user has a traveling
speed exceeding a speed threshold (145 km/h), which is about the maximum speed onemay drive on most highways. In the process of manual classification, we notice thattweets sent through Instagram and Flickr may be associated with ‘wrong’ timestampsbecause users may keep their photos and then update them to Twitter through Instagramor Flickr later. In this case, our computed speed may be higher than the speed thresholdand thus may affect our classification. To address this, we ignore the speed for tweetsfrom Instagram or Flickr.
3.3 Manual Creation of Training Data
We construct a training dataset by drawing a sample of users, manually inspecting theirtweets and assigning each user a label: personal (legitimate user) or non-personal (“spam”).Due to the large number of Twitter users and the time-consuming process of manual label-ing, a random sampling does not work well, as it would require a very large sample size toobtain a sufficient number of non-personal accounts. To disproportionally draw non-personal samples, we take an iterative process. First, we detect suspicious non-personal userswith an initial and simple detection scheme based upon the derived speed and the time inter-val between consecutive tweets. Specifically, we set a time interval limit of two seconds and
Detecting Non-personal and Spam Users on Geo-tagged Twitter Network 377
© 2014 John Wiley & Sons Ltd Transactions in GIS, 2014, 18(3)
a speed limit threshold of 1000 km/hr (which is faster than airplanes) between two consecu-tive tweets by a user. Through automatic processing, a spam label is assigned to a user ifthey have more than three violations of the two limits, i.e. with a faster speed or a shortertime interval.
After this initial labeling, we randomly select 500 personal users and 500 suspicious non-personal users. Then we manually classify these 1,000 users by manually reading each user’stop 30 geo-tagged tweets and their top 30 recent non-spatial tweets on the Timeline. Out ofthe 1,000 sampled users, 204 are actual non-personal users based on our judgment. Toincrease the diversity and representation of non-personal users, we perform a supervised clas-sification with the above training data set, using the decision tree method and all the extracteduser features introduced in Section 3.2. A set of classification rules is obtained, which we applyto label each of the 2,935,975 users in the entire data set. From this labeled data set, we ran-domly select 100 new “non-personal users” and 100 new personal users. We manually reclas-sify them by reading their tweets and added 47 non-personal users to the training set.Eventually, the training data has 925 personal users and 252 non-personal users and thus1,177 users in total. This process can be repeated to add more training samples, in order toobtain sufficient samples of non-personal twitter users.
3.4 Supervised Classification
Four supervised classifiers were applied for the classification task, including Decision Tree(Quinlan 1996), Naive Bayes (Schneider 2003), Support Vector Machine (SVM) (Joachims1998), and Random Forest (Breiman 2001). In terms of the F-Measure and root mean squarederror, Random Forest is the best classifier. For each model, a 10-fold cross-validation wascarried out to assess the classification accuracy. For each run, the training data set is randomlysplit into 10 subsets, of which nine subsets are used together to train the classifier and theremaining subset is used to test the classifier. Each subset is used exactly once for validation.Random Forest is an ensemble method, using many decision tree models, which selects asubset of the dataset with replacement to train each tree, estimates error and variable impor-tance using the remaining dataset, and assigns each user a class based on votes from all trees(Breiman 2001).
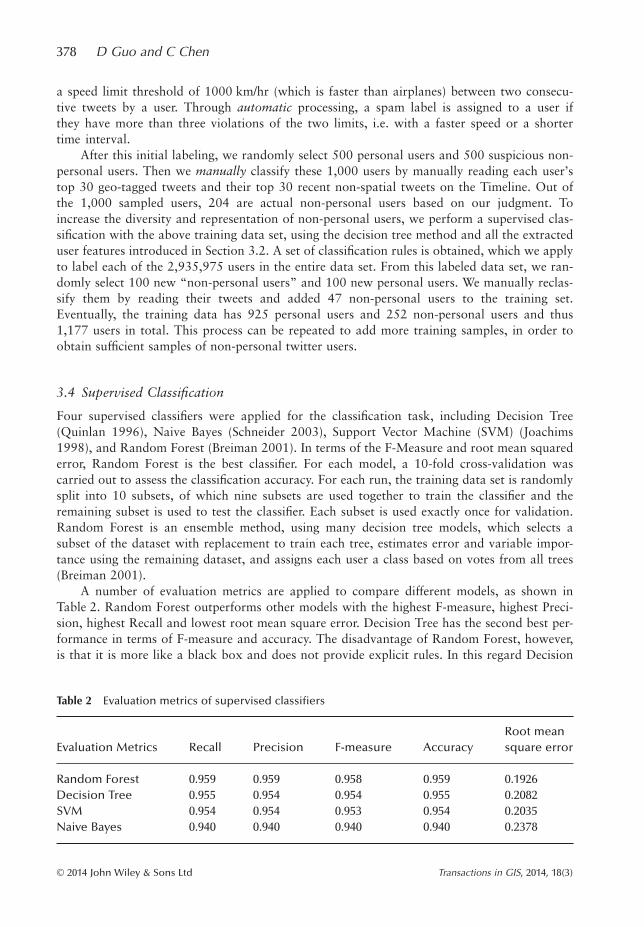
A number of evaluation metrics are applied to compare different models, as shown inTable 2. Random Forest outperforms other models with the highest F-measure, highest Preci-sion, highest Recall and lowest root mean square error. Decision Tree has the second best per-formance in terms of F-measure and accuracy. The disadvantage of Random Forest, however,is that it is more like a black box and does not provide explicit rules. In this regard Decision
Table 2 Evaluation metrics of supervised classifiers
Evaluation Metrics Recall Precision F-measure AccuracyRoot meansquare error
Random Forest 0.959 0.959 0.958 0.959 0.1926Decision Tree 0.955 0.954 0.954 0.955 0.2082SVM 0.954 0.954 0.953 0.954 0.2035Naive Bayes 0.940 0.940 0.940 0.940 0.2378
378 D Guo and C Chen
© 2014 John Wiley & Sons Ltd Transactions in GIS, 2014, 18(3)

Tree is better and easier to understand, with explicit rules that can be easily understood andapplied. The confusion matrix of the Random Forest classifier is provided in Table 3 and theconfusion matrix for decision tree is provided in Table 4. Decision Tree and Random Forestare very close in performance, both achieving >95% accuracy. Decision tree tends to predictmore non-personal users.
The decision tree result and rules are shown in Figure 3, which provides interesting infor-mation on the characteristics and differences between non-personal and personal users. Thetwo major rules that can predict 1082 cases are:
• IF (humanFactorPer <= 1.4% and urlPerc > 90%) THEN non-personal user• IF (humanFactorPer>1.4% and meanSpeed>3.16e-4 and repliedPerc<=84%) THEN
personal user
This indicates that the sources for tweets (five apps) and embedded emotions in tweets (viasentiment analysis), which are combined in the humanFactorPer feature, are among the mostimportant characteristics that can distinguish non-personal users.
Figure 4 shows the value distributions and differences between non-personal and per-sonal users based on eight selected features, seven of which are used in the decision tree.First, it confirms that the lack of emotions or usage of location-based apps is a dominantcharacteristic of non-personal users, although there is also a large number of personal userswho have similar feature values. Therefore, multiple features are needed to collectively dis-tinguish non-personal users. Second, the two geographic features show very interestingpatterns. The majority of non-personal users have frequent movements across countyboundaries (indicated by the cntyChangesPerM feature). Examples of such non-personalusers are those that use the same account to send tweets from different locations such asweather station alerts or advertisement bots that work from multiple locations. This isimportant to know, since tweets can be used for population mobility analyses and these non-personal tweets/users, if not removed, can affect the analysis result. Third, the meanSpeedfeature also shows interesting patterns since most non-personal users have a relatively low
Table 3 Confusion matrix of Random Forest with 10-fold evaluation
Predicted Label
Personal users Non-personal users
True Label Personal users 916 9Non-personal users 39 213
Table 4 Confusion matrix of Decision Tree with 10-fold evaluation
Predicted Label
Personal users Non-personal users
True Label Personal users 909 16Non-personal users 37 215
Detecting Non-personal and Spam Users on Geo-tagged Twitter Network 379
© 2014 John Wiley & Sons Ltd Transactions in GIS, 2014, 18(3)

speed on average but some non-personal users can also have a high speed. On the otherhand, the speed distribution for personal users is a more normal distribution, with a meanvalue about 5 km/hr.
4 Evaluation and Reclassification
To evaluate the prediction power of the explicit rules shown in Figure 3, we compiled a differ-ent and new data set of tweets from the recent four-month period (October 7, 2013–February8, 2014) for the 48 US contiguous states and Washington DC. This data set includes morethan 300 million tweets and 4,109,330 unique users, among which 2,375,717 unique usershave at least five tweets. We extract the same set of features for this new data set. The discov-ered rules in Figure 3 are applied to classify the 2,375,717 unique users The classification iden-tified 61,555 non-personal users (2.6%).
To check the correctness of this classification, we randomly retrieved 100 predicted non-personal users and 100 predicted personal users. We then read the tweets of these users andmanually assign a true label based on our judgment. Based on the manual labeling, the confu-sion matrix for the classification is constructed and shown in Table 5. Out of the 100 predictedspammers, 51 are true non-personal users and thus the precision is 51% and the recall rate51/(51+2) = 96%. The overall accuracy is 74%. However, since the sampling is not random(i.e. we deliberately sampled more non-personal users disproportionally), these rates should beinterpreted with caution. This reclassification shows that accuracy with the new data is not ashigh as with the training data. While further investigation is needed to improve the perfor-mance, it is already very useful considering that: (1) this is a new data set for a completely dif-ferent time period; (2) spam activities may have evolved and are not well represented in the oldtraining data set; and (3) non-spatial twitter spam detection does not achieve a much higheraccuracy. Potential improvements can be made with a larger and more comprehensive trainingdata set, which ideally should be dynamically updated to capture recent changes.
humanFactorPerc <= 0.014| urlPerc <= 0.9| | speedLimitCntsPerM <= 1.2: L (26 / 5)| | speedLimitCntsPerM > 1.2: N (2)| urlPerc > 0.9: N (207 / 2)humanFactorPer > 0.014| meanSpeed <= 3.16E-4| | maxNumTwtsPerM <= 10: L (15 / 2)| | maxNumTwtsPerM > 10: N (11 / 1)| meanSpeed > 3.16E-4| | repliedPerc <= 0.84: L (875 / 20)| | repliedPerc > 0.84| | | normVar <= 0.79: N (5 / 1)| | | normVar > 0.79| | | | emotweetPerc <= 0.38: L (24)| | | | emotweetPerc > 0.38| | | | | friendIndicator <= 0.63: L (9 / 1)| | | | | friendIndicator > 0.63: N (3)
Figure 3 Rules identified by the J48 Decision Tree. Prediction labels (N for non-personal users andL for legitimate users) are placed at the end of each tree leaf (corresponding to a rule). The numbersin a bracket mean (total users / wrong predictions)
380 D Guo and C Chen
© 2014 John Wiley & Sons Ltd Transactions in GIS, 2014, 18(3)

Figure 4 Comparison of non-personal users (labeled ‘spam’) and personal users (labeled ‘legiti-mate’) on eight selected features
Table 5 Reclassification confusion matrix with new data
Prediction Label
Personal users Non-personal users
True Label Personal users 98 49Non-personal users 2 51
Detecting Non-personal and Spam Users on Geo-tagged Twitter Network 381
© 2014 John Wiley & Sons Ltd Transactions in GIS, 2014, 18(3)

5 Discussion and Conclusions
In this article, we presented an analysis and detection approach for non-personal users ongeo-tagged twitter network. With our definition, a non-personal user is one that does not postcontents on personal daily lives, which can be a machine bot that automatically send tweets,an organization account that does not represent an individual, an individual that only sendsnon-personal information, or a spammer that posts commercial or malicious content. Thefocus of our analysis is on geo-tagged tweets with accurate locations (not just place names)and the users that have sent geo-tagged tweets. This research is important for understandingthe characteristics of non-personal users on geo-social networks like Twitter and providing aneffective means to detect and remove such users from subsequent analysis, in various applica-tions which often assume that each twitter user is a real person. To the best of our knowledge,this is the first attempt to understand the behavior of non-personal users on a geo-taggedtwitter network.
Our approach consists of multiple steps:
1. Extract user characteristics based on the geographic, graph-based and content informationin tweets;
2. Construct training datasets by manually inspecting tweets and labeling a large sample oftwitter users;
3. Conduct supervised classification and derive rules and knowledge for detecting non-personal users; and
4. Evaluate the derived rules with new training data and manual inspection. In this process,the design and extraction of effective features is very important.
We have extracted dozens of different features to describe the tweet contents, the friend-ship network, and the geographic patterns of each user. It remains a research question toextract more appropriate features for spam detection. Nevertheless, as a first attempt ourstudy provides interesting and useful findings and insights about the differences between non-personal users and personal users according to their patterns. The top features that emerged inour study include not only known features such as the percentage of URLs and replies but alsonew features such as the mean tweeting speed, emotion, and location-based app usage.
We estimate that about 2–3% of twitter users with geo-tagged tweets are non-personalusers. Many non-personal accounts involving geo-tagged tweets are normally limited tolocation-based services, such as job news, weather reports and local crime alerts. Someaccounts that may be labeled as spammers in non-geotagged analysis are actually consideredas personal users in our study, such as those who mainly post tweets from location-based appslike Foursquare. As our study shows, non-personal geotagged twitter users exhibit dramati-cally different patterns in terms of spatial mobility, such as frequent moves across countyboundaries, different temporal patterns of movements, and different geo-social connectionssuch as replies and mentions. Therefore, it is important to understand and filter out such out-liers in a geo-social analysis of tweets or twitter users.
The classification accuracy with the training dataset is excellent, although there-classification accuracy with the new data is not very high. There may be several reasons forthis, which require further investigation. First, due to the time-consuming nature of the task,our training data set is still relatively small, with limited representation of the diversity andcomplexity of twitter activities. A larger and more comprehensive data set is needed, which islikely to improve the reclassification accuracy. Nevertheless, the discovered patterns haveshown a clear difference between non-personal users and personal users. Second, non-personal
382 D Guo and C Chen
© 2014 John Wiley & Sons Ltd Transactions in GIS, 2014, 18(3)

users, especially accounts operated by people, tend to demonstrate complex behaviors that areoften a mix of non-personal and personal characteristics. On a fast changing social networkingplatform like Twitter, the spam activities also change quickly. To improve the detectionschema, dynamic training data sets are needed that can capture and adapt to changes.
References
Benevenuto F, Magno G, Rodrigues T, and Almeida V 2010 Detecting spammers on Twitter. In Proceedings ofthe Seventh Annual Collaboration, Electronic Messaging, Anti-Abuse and Spam Conference, Redmond,Washington
Bertrand De L, Robin S S, and Gianluca L 2009 “OMG, from here, I can see the flames!”: A use case of mininglocation based social networks to acquire spatio-temporal data on forest fires. In Proceedings of the Inter-national Workshop on Location Based Social Networks, Seattle, Washington
Breiman L 2001 Random forests. Machine Learning 45: 5–32Castillo C, Donato D, Gionis A, Murdock V, and Silvestri F 2007 Know your neighbors: Web spam detection
using the web topology. In Proceedings of the Thirtieth Annual International ACM SIGIR Conference onResearch and Development in Information Retrieval, Amsterdam, The Netherlands
Chu Z, Gianvecchio S, Wang H, and Jajodia S 2012 Detecting automation of Twitter accounts: Are you ahuman, bot, or cyborg? IEEE Transactions on Dependable and Secure Computing 9: 811–24
Geng G-G, Li Q, and Zhang X 2009 Link based small sample learning for web spam detection. In Proceedingsof the Eighteenth International Conference on the World Wide Web, Madrid, Spain
Go A, Bhayani R, and Huang L 2009 Twitter sentiment classification using distant supervision. Processing150(12): 1–6
Goodchild M F 2007 Citizens as voluntary sensors: Spatial data infrastructure in the world of Web 2.0. Interna-tional Journal of Spatial Data Infrastructures Research 2: 24–32
Grier C, Thomas K, Paxson V, and Zhang M 2010 @spam: The underground on 140 characters or less. In Pro-ceedings of the Seventeenth ACM Conference on Computer and Communications Security, Chicago,Illinois
Huberman B A, Romero D M, and Fang W 2009 Social networks that matter: Twitter under the microscope.First Monday 14(1): 1–5
Joachims T 1998 Text categorization with Support Vector Machines: Learning with many relevant features.In Proceedings of the Tenth European Conference on Machine Learning (ECML ’98), Chemnitz, Germany
MacEachren A M, Robinson A C, Jaiswal A, Pezanowski S, Savelyev A, Blanford J, and Mitra P 2011 Geo-Twitter analytics: Applications in crisis management. In Proceedings of the Twenty-fifth InternationalCartographic Conference, Paris, France
Martinez-Romo J and Araujo L 2013 Detecting malicious tweets in trending topics using a statistical analysis oflanguage. Expert Systems Applications 40: 2992–3000
McCord M and Chuah M 2011 Spam detection on twitter using traditional classifiers. In Proceedings of theEighth International Conference on Autonomic and Trusted Computing, Banff, Alberta
Mishne G 2005 Blocking blog spam with language model disagreement. In Proceedings of the First InternationalWorkshop on Adversarial Information Retrieval on the Web (AIRWeb ’05), Chiba, Japan
Nigam K, Lafferty J, and McCallum A 1999 Using maximum entropy for text classification. In Proceedings ofthe Sixteenth International Joint Conference on Artificial Intelligence Workshop on Machine Learning forInformation Filtering, Stockholm, Sweden
Ntoulas A, Najork M, Manasse M, and Fetterly D 2006 Detecting spam web pages through content analysis.In Proceedings of the Fifteenth International Conference on the World Wide Web, New York
Quinlan J R 1996 Improved use of continuous attributes in C4.5. Journal of Artificial Intelligence Research 4:77–90
Sahami M, Dumais S, Heckerman D, and Horvitz E 1998 A Bayesian approach to filtering junk e-mail. In Pro-ceedings of the 1998 Learning for Text Categorization Workshop, Madison, Wisconsin
Schneider K-M 2003 A comparison of event models for Naive Bayes anti-spam e-mail filtering. In Proceedings ofthe Tenth conference of the European Chapter of the Association for Computational Linguistics, Budapest,Hungary
Sitaram A and Bernardo A H 2010 Predicting the future with social media. In Proceedings of the 2010 IEEE/WIC/ACM International Conference on Web Intelligence and Intelligent Agent Technology, Toronto,Ontario
Detecting Non-personal and Spam Users on Geo-tagged Twitter Network 383
© 2014 John Wiley & Sons Ltd Transactions in GIS, 2014, 18(3)

Wang A H 2010a Detecting spam bots in online social networking sites: A machine learning approach. InForesti S and Jajodia S (eds) Data and Applications Security and Privacy XXIV. Berlin, Springer LectureNotes in Computer Science Vol. 6166: 335–42
Wang A H 2010b Don’t follow me: Spam detection in Twitter. In Proceedings of the International Conferenceon Security and Cryptography (SECRYPT 2010), Athens, Greece
Wu Y-S, Bagchi S, Singh N, and Wita R 2009 Spam detection in Voice-over-IP calls through semi-supervisedclustering. In Proceedings of the ACM/IEEE Conference on Dependable Systems and Networks, Boston,Massachusetts: 307–16
Yang J and Counts S 2011 Predicting the speed, scale, and range of information diffusion in Twitter. In Proceed-ings of the Fourth International AAAI Conference on Weblogs and Social Media, Washington, DC
Yardi S, Romero D, Schoenebeck G, and Boyd D 2010 Detecting spam in a Twitter network. First Monday15(1): 1–14
Zandbergen P A 2009 Accuracy of iPhone locations: A comparison of assisted GPS, WiFi and cellular position-ing. Transactions in GIS 13(s1): 5–25
Zhou D, Burges C J C, and Tao T 2007 Transductive link spam detection. In Proceedings of the Third Interna-tional Workshop on Adversarial Information Retrieval on the Web, Banff, Alberta
384 D Guo and C Chen
© 2014 John Wiley & Sons Ltd Transactions in GIS, 2014, 18(3)