detection, identification, and quantification of ... · detection, identification, and...
TRANSCRIPT

Detection, Identification, and Quantification of HydroxylatedBis(2-ethylhexyl)-Tetrabromophthalate Isomers in House DustHui Peng,†,○ David M. V. Saunders,†,○ Jianxian Sun,† Garry Codling,† Steve Wiseman,† Paul D. Jones,†,‡
and John. P. Giesy*,†,§,∥,⊥,#,▽
†Toxicology Centre, University of Saskatchewan, 44 Campus Drive, Saskatoon, Saskatchewan, Canada, S7N 5B3‡School of Environment and Sustainability, 117 Science Place, Saskatoon, Saskatchewan, Canada, S7N 5C8§Department of Veterinary Biomedical Sciences, University of Saskatchewan, Saskatoon, Saskatchewan, Canada S7N 5B3∥Zoology Department, Center for Integrative Toxicology, Michigan State University, East Lansing, Michigan, United States⊥Department of Biology and Chemistry, City University of Hong Kong, Kowloon, Hong Kong Special Administrative Region,Peoples Republic of China
#School of Biological Sciences, University of Hong Kong, Pok Fu Lam, Hong Kong Special Administrative Region, Peoples Republicof China▽State Key Laboratory of Pollution Control and Resource Reuse, School of the Environment, Nanjing University, Nanjing,People’s Republic of China
*S Supporting Information
ABSTRACT: Ultra-High Resolution LC/mass spectrometry (LC-UHRMS;Thermo Fisher Q-Exactive) was used to identify two novel isomers of hydrox-ylated bis(2-ethylhexyl)-tetrabromophthalate (OH-TBPH) which were unexpect-edly observed in a commercial standard of TBPH. By combining ultra-high resolution(UHR) mass spectra (MS1), mass errors to theoretical [TBPH-Br+O]− were 2.1 and1.0 ppm for the two isomers, UHR-MS2 spectra and NMR analysis; the structuresof the two compounds were identified as hydroxylated TBPH with a hydroxylgroup on the aromatic ring. Relatively great proportions of the two isomers ofOH-TBPH were detected in two technical products, Firemaster 550 (FM-550; 0.1%and 6.2%, respectively) and Firemaster BZ 54 (BZ-54; 0.1% and 7.9%), compared toa commercial standard (0.4% and 0.9%). To simultaneously analyze OH-TBPHisomers and TBPH in samples of dust, a method based on LC-UHRMS wasdeveloped to quantify the two compounds, using negative and positive ion modes,respectively. The instrumental limit of detection for TBPH was 0.01 μg/L, which was 200−300 times better than traditionalmethods (2.5 μg/L) based on gas chromatography−mass spectrometry. The analytical method combined with a Florisil cleanup wassuccessfully applied to analyze TBPH and OH-TBPH in 23 indoor dust samples from Saskatoon, Saskatchewan, Canada. TwoOH-TBPH isomers, OH-TBPH1 and OH-TBPH2, were detected in 52% and 91% of dust samples, respectively. Concentrations ofOH-TBPH2 (0.35 ± 1.0 ng/g) were 10-fold greater than those of OH-TBPH1 (0.04 ± 0.88 ng/g) in dust, which was similar toprofiles in FM-550 and BZ-54. TBPH was also detected in 100% of dust samples with a mean concentration of 733 ± 0.87 ng/g. Asignificant (p < 0.001) log−linear relationship was observed between TBPH and OH-TBPH isomers, further supporting thehypothesis of a common source of emission. Relatively small proportions of OH-TBPH isomers were detected in dust (0.01% ±0.67 OH-TBPH1 and 0.1% ± 0.60 OH-TBPH2), which were significantly less than those in technical products (p < 0.001). Thisresult indicated different environmental behaviors of OH-TBPH and TBPH. Detection of isomers of OH-TBPH is important, sincecompounds with phenolic groups have often shown relatively greater toxicities than nonhydroxylated analogues. Further study iswarranted to clarify the environmental behaviors and potential toxicities of OH-TBPH isomers.
■ INTRODUCTIONBrominated flame retardants (BFRs) have caused concernto regulatory agencies and the general public,1 particularlyregarding polybrominated diphenyl ethers (PBDEs), which werethe most widely used BFRs.2 Previous studies have reported thatPBDEs are ubiquitous in the environment,3−5 bioaccumulatedinto organisms,6−8 and can cause toxicity.9−11 Since 2004, due tothese concerns, production and sales of two major commercial
PBDE products, penta- and octa-BDEs, have been voluntarilywithdrawn or banned in some parts of the world.12 Followingthe phase-out of PBDEs, the BFR industry has begun to use
Received: November 24, 2014Revised: January 18, 2015Accepted: January 26, 2015Published: January 26, 2015
Article
pubs.acs.org/est
© 2015 American Chemical Society 2999 DOI: 10.1021/es505743dEnviron. Sci. Technol. 2015, 49, 2999−3006

alternative brominated compounds to replace PBDEs. Investiga-tions of the behaviors of these alternative BFRs and assessment oftheir potential health and ecological risk is thus of special interest.Firemaster 550 (FM-550) and Firemaster BZ-54 (BZ-54)
are two PBDE replacement mixtures, both of which contain2-ethylhexyl-2,3,4,5-tetrabromo-benzoate (TBB) and bis(2-ethylhexyl)-tetrabromophthalate (TBPH). The percentage ofTBPH in FM-550 and BZ-54 is 15% and 30%, respectively.13
Since TBPH is a brominated analogue of bis(2-ethylhexyl)-phthalate (DEHP), a well-studied compound that has exhibiteda range of toxicities,14−16 concerns are emerging regarding thepotential health risks of TBPH. For example, metabolic pathwaysfor TBPH similar to those of DEHP have been observed. In vitrometabolism of TBPH has resulted in production of a mono-ester metabolite, mono-(2-ethyhexyl) tetrabromophthalate(TBMEHP).17 Furthermore, hepatotoxic effects and interactionwith the peroxisome proliferator activated receptor (PPAR),known effects of DEHP, have also been elicited by the monoestermetabolite of TBPH.18 A recent study, using in vitro cellularassays, has also reported the antiestrogenic potency of TBPH.19
In addition to potential toxicities, results of previous studieshave demonstrated the widespread presence of TBPH in housedust,20 air,21 sediment,22 and tissues of wildlife.23 Of particularimportance, a recent study has reported the presence of TBPHin blood serum and milk of nursing women, which indicates itspotential risk to the health of humans, particularly infants.24
Since TBPH has been detected at relatively great concentrationsin dust (geometric mean (GM) concentration was 234 ng/g,dry mass (dm)), which was comparable to concentrations ofhexabromocyclododecane (HBCD; GM was 354 ng/g) in thesame samples from the United States, indoor dust ingestion isexpected to be one of the primary routes of exposure.20 Threeother studies have also foundTBPH in house dust fromCaliforniaand Norway at similar concentrations, ng/g, dm.25−27
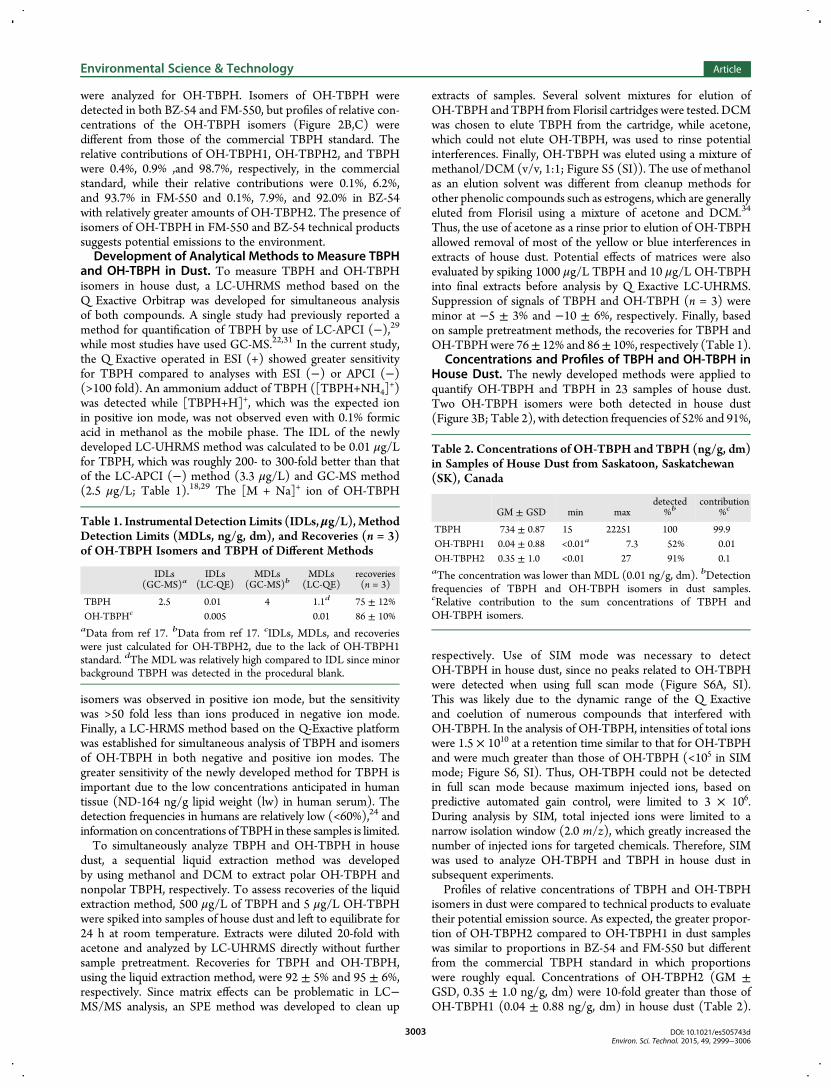
The study reported here developed a sensitive liquid chromato-graphy ultrahigh resolution mass spectrometry (LC-UHRMS)method to analyze TBPH in dust samples collected from housesin Saskatoon, Saskatchewan (SK), Canada. Using UHRMS,two isomers of hydroxylated TBPH (Figure 1) in commercialstandards and technical products were unexpectedly detected.Finally, the UHRMS method combined with a Florisil cartridgecleanup was used to simultaneously analyze TBPH and OH-TBPH isomers in 23 dust samples from eight homes in Saskatoon,Saskatchewan (SK), Canada.
■ MATERIALS AND METHODSChemicals and Reagents. Native TBPH standard (purity,
98.1%) was purchased from AccuStandard (New Haven, CT,USA), and its surrogate, mass-labeled standard d34,
13C6-TBPH(purity, >98%) was purchased fromWellington Laboratories Inc.(Guelph, Ontario, Canada). Commercial standards of TBPH(purity, >95%) were purchased from Waterstone Technology(WST; Carmel, IN, USA), and BZ-54 and FM-550 technicalproducts were gifts from the Heather Stapleton Research Groupat Duke University, Nicholas School of the Environment. OH-TBPH2 was purified by use of the HPLC fraction from BZ-54technical products as shown in the Supporting Information.Florisil (6 cm3, 1 g, 30 μm) solid-phase extraction (SPE)cartridges were purchased from Waters (Milford, MA, USA).Ammonia solution (28−30%) was purchased from Alfa AesarChemical Industries (Ward Hill, MA, USA). Dichloromethane(DCM), methanol, and acetone were all “omni-Solv” grade andwere purchased from EMD Chemicals (Gibbstown, NJ, USA).
Collection of Dust. Twenty-three samples of dust werecollected from eight houses (2−3 dust samples per house) acrossSaskatoon, Saskatchewan, Canada from May to August, 2013.Dust was collected by use of a Eureka Mighty-Mite vacuumcleaner (model 3670)20,28 into a cellulose extraction thimble(Whatman International, Pittsburgh, PA, USA) which wasinserted between the vacuum tube extender and suction tube andwas secured by use of a metal hose clamp. Extraction thimbleswere Soxhlet-extracted with DCM for 2 h prior to use. Theequivalent of the entire floor-surface area was sampled in eachroom. All sampling components upstream of the extractionthimble were cleaned after each sampling event.
Sample Pretreatment and Analysis. Approximately 0.1 g,dm of dust was transferred to a 15 mL centrifuge tube. Twentymicroliters (20 μL) of 1 mg/Lmass-labeled internal standard d34,13C6-TBPH, and 5 mL of methanol were added to the housedust samples for extraction. Samples were vigorously shaken(Heidolph Multi Reax Vibrating Shaker, Brinkmann) for 30 minfollowed by sonication for an additional 30 min, and themethanol extract was separated by centrifugation at 1669g for10 min and transferred to a new tube. The extraction wasrepeated using 5 mL of DCM. The methanol and DCM extractswere combined and blown to dryness under a gentle stream ofnitrogen. Extracts were dissolved in 500 μL of DCM and loadedonto Florisil cartridges, which had been sequentially conditionedby 6mL of acetone andDCM. TBPHwas eluted from the Florisilcartridges using 5 mL of DCM. Following a washing rinseof 4 mL of acetone, OH-TBPH isomers was eluted to a new tubeusing 5 mL of methanol/DCM mixture (v/v, 1:1). Final extractswere blown to dryness under a gentle stream of nitrogen andreconstituted with 200 μL of acetone for analysis.
Instrumental Analysis. Aliquots of extracts were analyzedusing aQExactive mass spectrometer (Thermo Fisher Scientific)interfaced to a Dionex UltiMate 3000 ultra high-performanceliquid chromatography (UHPLC) system (Thermo FisherScientific). Separation of TBPH and OH-TBPH was achievedwith a Betasil C18 column (5 μm; 2.1 mm × 100 mm;Thermo Fisher Scientific) with an injection volume of 5 μL.
Figure 1. Chemical structures of TBPH and two identified OH-TBPHisomers.
Environmental Science & Technology Article
DOI: 10.1021/es505743dEnviron. Sci. Technol. 2015, 49, 2999−3006
3000

Ultrapure water (A) and methanol containing 0.1% NH4OH(v/v) (B) were used as mobile phases. Initially, 20% B wasincreased to 80% in 3 min, then increased to 100% at 8 min andheld static for 19.5 min, followed by a decrease to initialconditions of 20% B and held for 2 min to allow for column re-equilibration. The flow rate was 0.25 mL/min. The column andsample chamber temperatures were maintained at 30 and 10 °C,respectively. Data were acquired using full scan mode andselected ionmonitoring (SIM). Briefly,MS scans (200−2000m/z)were recorded at resolution R = 70 000 (at m/z 200) with amaximum of 3 × 10⁶ ions collected within 200 ms, based on thepredictive automated gain control. SIM scans were recorded at aresolutionR =70 000 (atm/z 200)with amaximumof 5× 10⁴ ionscollected within 200 ms, based on the predictive automated gaincontrol, with isolation width set at 2.0m/z. For MS2 identification,selected ions were fragmented in the collision cell utilizing higher-energy collisional dissociation (HCD). MS2 scans with a targetvalue of 1 × 10⁵ ions were collected with a maximum fill timeof 120 ms and R = 35 000 (at m/z 200). The general massspectrometry settings applied for negative ion mode were asfollows: spray voltage, 2.7 kV; capillary temperature, 375 °C; sheathgas, 46 L/h; auxiliary gas, 11 L/h; probe heater temperature,375 °C.The general mass spectrometry settings applied for positiveion mode were as follows: spray voltage, 3.0 kV; capillary tem-perature, 400 °C; sheath gas, 46 L/h; auxiliary gas, 15 L/h; probeheater temperature, 350 °C.Quality Assurance/Quality Control.Minor contamination
of TBPH was detected during sample processing, so proceduralblank experiments were performed along with each batch ofsamples. Standards were reinjected after four to six injections ofsamples, and acetone was injected after each standard injection tomonitor background contamination. Due to minor backgroundcontamination, the method detection limit (MDL) for TBPH,defined as 3 times the procedural blanks, was 1.1 ng/g, dm. As forOH-TBPH without background contamination, its MDLswere calculated based on the peak-to-peak noise of the baselinenear the analyte peak obtained by analyzing field samples on aminimum value of signal-to-noise of 3, and was 0.01 ng/g, dm.Compound-specific matrix spiking recoveries were calculatedby spiking standards into samples of dust that contained theleast concentrations of TBPH (n = 3). Standards were spiked at500 ng TBPH/g and 10 ng OH-TBPH/g, dm. Recoveries fromdust were 75 ± 12% and 86 ± 10% for TBPH and OH-TBPH,respectively. Quantification of TBPH was conducted by internalcalibration curve by use of internal standard d34,
13C6-TBPH, forwhich recoveries from dust averaged 82 ± 27%. Concentrationsof OH-TBPH were calculated without internal standard sincerecoveries were >80% and stable among recovery samples.Due to the lack of OH-TBPH1 standard, its concentrationswere quantified using purified OH-TBPH2 standard. Externalcalibration curves of target analytes were calculated for TBPH, 0,49, 98, 195, 391, 781, 1563, 3125, 6250, 12 500, 25 000, 50 000,and 100 000 pg/mL and for OH-TBPH, 0, 63, 125, 250, 500, and1000 pg/mL. Both calibration curves showed strong linearity(correlation coefficients >0.99).Data Analysis. Statistical analyses were carried out using
SPSS 19.0. Values less than the MDLs were replaced by MDL/2.Normal distributions of chemical concentrations were assessedusing the Shapiro-Wilk test, and a log-transformation was usedto ensure the normality of the distribution of data. All 23 dustsamples from eight homes were treated as independent data andwere included in the log-regression analysis. Differences withp < 0.05 were considered significant.
■ RESULTS AND DISCUSSIONObservation and Chemical Structure Identification of
OH-TBPH in TBPH Standards. The primary purpose of thestudy was to develop a LC-UHRMS method based on the LC-QExactive platform that could be used to quantify TBPH inenvironmental samples. Unexpectedly, three separate peaks wereobserved when ions were extracted at m/z 640.9946 (10 ppmwindow) from full scan mass spectra (200−2000 m/z) from thecommercial TBPH standards in negative ion mode (Figure 2A).
Based on full scan mass spectra, the m/z values for the threepeaks were 640.9949, 640.9946, and 640.9948, with mass errorsof 2.1, 1.0, and 1.9 ppm, respectively (Figure 2D) comparedto the theoretical m/z value (640.9936; [TBPH-Br+O]−) asreported previously.29 Based on the results of the UHRMS dataand the isotopic distribution pattern, the three peaks likely hadthe same formula, C24H35Br3O5, which could have been isomersor adducts of TBPH with the same protonated ion. The HPLCmobile phases were optimized, and the first two peaks (peaka and peak b) were eluted from the HPLC column earlier(5.85 and 6.92 min) with 0.1% NH4OH as an additive inmethanol compared to pure methanol (12.5 min, Figure S1, SI),whereas the retention time of the third peak (c) remainedunchanged (15.9 min). These results indicated that the first twopeaks were likely acidic compounds, and their retention on C18columns would likely be reduced with the use of basic mobilephases. To further identify the peak associated with TBPH,retention times of the identified peaks were compared to thoseof PBDEs under the same HPLC conditions; retention timesof most PBDEs were 5−15 min (data not shown), which wereearlier than the third peak (c) but later than peaks a and b.Considering that the log KOW of TBPH (11.95) is greater thanthose of PBDEs (6.3−6.58 and 6.29 for penta- and octa BDE)and that the retention of compounds on C18 columns iscorrelated withKOW values,30,31 peak c was thought to most likelybe TBPH. To further confirm this hypothesis, two strategies were
Figure 2. Chromatogram of extracted ions withm/z 640.9946 (10 ppmwindow) for (A) commercial standard, (B) FM-550 technical product,(C) BZ-54 technical product using Q Exactive in negative ion mode.(D) Mass spectra of OH-TBPH. (E) Product ion mass spectra of ion atm/z 640.9946. (a) OH-TBPH1, (b) OH-TBPH2, (c) TBPH.
Environmental Science & Technology Article
DOI: 10.1021/es505743dEnviron. Sci. Technol. 2015, 49, 2999−3006
3001

used: (i) confirmation of the third peak with highly purifiednative and mass-labeled TBPH standardsthe third peak (c)was specifically observed while peaks a and b were detected onlyat lesser intensities (Figure S2, SI)and (ii) analysis of thecommercial standard in positive ion mode to detect TBPHadducts that were theoretically possible. The m/z of the aminoadduct of TBPH ([TBPH+NH4]
+, which was 719.9534 with0.42 ppm mass accuracy) was only observed at a retention timesimilar to that of peak c (15.9 min) (Figure 3A,C). Together,these four lines of evidence, alterations of retention times usingbasic mobile phases, retention times relative to PBDEs, relativelygreater proportions in highly purified standards, and observationof ions of adducts in positive ion mode, were consistent with thethird peak (c) at 15.9 min being TBPH. To further confirm thestructure, high resolution MS2 spectra (R = 35 000 at m/z 200)were analyzed in positive ion mode at 30−50 eV. As shown inFigure 3D, typical fragment ions of TBPH were observed with amass error less than 10 ppm. The fragment ions clearly showedthat TBPH precursor ions were fragmented at the alkyl sidechains, while cleavage of the C−O bond yielded a predominantproduct ion at m/z 464.6611. Such routes of cleavage weresimilar to those of phthalates, which also produced a phthalicanhydride fragment when using collision induced dissociation(CID),32 in triple quadruple mass spectrometry mode, despitethe fact that HCD was used to fragment ions in the Q Exactiveinstrument.To evaluate chemical structures of the two unknown peaks
a and b, the Q Exactive was used in negative ion mode toobtain ultrahigh-resolution (R = 35 000 at m/z 200) product ionspectra. Several product ions with m/z at 245.1179, 326.7484,404.9526, and 484.8787 were observed (Figure 2E). Thestructures of the product ions were evaluated based on elementalcomposition with a mass error of 0.4, 1.5, 0.7, and 1.0 ppm,respectively. Patterns of peaks associated with products offragmentation were more complex than that of TBPH, and theaddition of a hydroxyl substituent to the aromatic ring was
observed for each of the four predominant fragments. To avoidthe possibility that the addition of the hydroxyl was due to asubstitution reaction during negative ionization, as has previouslybeen reported for brominated compounds,33 OH-TBPH wasalso analyzed in positive ion mode. When this was done,a sodium adduct of OH-TBPH ([M + Na]+; m/z value was666.9861 and the mass error was 0.75 ppm) was observed(Figure S3, SI). Based on all of this information, it was clear thatthe first two peaks were hydroxylated derivatives of TBPH withformulas C24H35Br3O5 and with hydroxylation at the aromaticring which formed a phenolic group. To further confirm thechemical structures of the compounds, 1H NMR was used tocharacterize the structures of OH-TBPH2 purified from theBZ-54 technical product using HPLC (Figure S4). A chemicalshift characteristic of a phenolic group with carboxylic acid estersubstituent was observed in the purified OH-TBPH2 standard at8.6 ppm (Figure S4, SI). Isomers of OH-TBPH were identifiedin purified standards of TBPH and technical products and hadsimilar product ion spectra with TBPH; therefore, we proposedstructures of these two novel compounds as shown in Figure 1.To further investigate the widespread presence of OH-TBPH
isomers as byproducts of TBPH, we also determined OH-TBPHisomers in other standards. In addition to the commercialTBPH standard, OH-TBPH isomers were also observed inpurified TBPH standards from AccuStandard and in technicalmaterials. Percentages of OH-TBPH in the native standard fromAccuStandard were <0.1% (Figure S2, SI). Furthermore, smallproportions, <0.1%, of mass-labeled OH-TBPH (d17,
13C6−OH-TBPH) were detected in the mass-labeled TBPH standard fromWellington Laboratories Inc. This result indicated potentialwidespread occurrence of isomers of OH-TBPH as byproductsin TBPH standards. These results indicated that OH-TBPHmight also be present in technical products. To confirm thishypothesis, technical products, BZ-54 and FM-550, which,along with the flame retardant product, DP-45, are two ofthree potential major sources of TBPH in the environment,13
Figure 3. Chromatogram of extracted ions withm/z 640.9946 andm/z 723.9486 (10 ppm window) for (A) FM-550 technical product, (B) house dustusing Q Exactive (SIM) in both negative positive ion modes. (C) Mass spectra of TBPH in positive ion mode. (D) Product ion mass spectra of ion atm/z 723.9486 in positive ion mode.
Environmental Science & Technology Article
DOI: 10.1021/es505743dEnviron. Sci. Technol. 2015, 49, 2999−3006
3002
were analyzed for OH-TBPH. Isomers of OH-TBPH weredetected in both BZ-54 and FM-550, but profiles of relative con-centrations of the OH-TBPH isomers (Figure 2B,C) weredifferent from those of the commercial TBPH standard. Therelative contributions of OH-TBPH1, OH-TBPH2, and TBPHwere 0.4%, 0.9% ,and 98.7%, respectively, in the commercialstandard, while their relative contributions were 0.1%, 6.2%,and 93.7% in FM-550 and 0.1%, 7.9%, and 92.0% in BZ-54with relatively greater amounts of OH-TBPH2. The presence ofisomers of OH-TBPH in FM-550 and BZ-54 technical productssuggests potential emissions to the environment.Development of Analytical Methods to Measure TBPH
and OH-TBPH in Dust. To measure TBPH and OH-TBPHisomers in house dust, a LC-UHRMS method based on theQ Exactive Orbitrap was developed for simultaneous analysisof both compounds. A single study had previously reported amethod for quantification of TBPH by use of LC-APCI (−),29while most studies have used GC-MS.22,31 In the current study,the Q Exactive operated in ESI (+) showed greater sensitivityfor TBPH compared to analyses with ESI (−) or APCI (−)(>100 fold). An ammonium adduct of TBPH ([TBPH+NH4]
+)was detected while [TBPH+H]+, which was the expected ionin positive ion mode, was not observed even with 0.1% formicacid in methanol as the mobile phase. The IDL of the newlydeveloped LC-UHRMS method was calculated to be 0.01 μg/Lfor TBPH, which was roughly 200- to 300-fold better than thatof the LC-APCI (−) method (3.3 μg/L) and GC-MS method(2.5 μg/L; Table 1).18,29 The [M + Na]+ ion of OH-TBPH
isomers was observed in positive ion mode, but the sensitivitywas >50 fold less than ions produced in negative ion mode.Finally, a LC-HRMS method based on the Q-Exactive platformwas established for simultaneous analysis of TBPH and isomersof OH-TBPH in both negative and positive ion modes. Thegreater sensitivity of the newly developed method for TBPH isimportant due to the low concentrations anticipated in humantissue (ND-164 ng/g lipid weight (lw) in human serum). Thedetection frequencies in humans are relatively low (<60%),24 andinformation on concentrations of TBPH in these samples is limited.To simultaneously analyze TBPH and OH-TBPH in house
dust, a sequential liquid extraction method was developedby using methanol and DCM to extract polar OH-TBPH andnonpolar TBPH, respectively. To assess recoveries of the liquidextraction method, 500 μg/L of TBPH and 5 μg/L OH-TBPHwere spiked into samples of house dust and left to equilibrate for24 h at room temperature. Extracts were diluted 20-fold withacetone and analyzed by LC-UHRMS directly without furthersample pretreatment. Recoveries for TBPH and OH-TBPH,using the liquid extraction method, were 92 ± 5% and 95 ± 6%,respectively. Since matrix effects can be problematic in LC−MS/MS analysis, an SPE method was developed to clean up
extracts of samples. Several solvent mixtures for elution ofOH-TBPH andTBPH from Florisil cartridges were tested. DCMwas chosen to elute TBPH from the cartridge, while acetone,which could not elute OH-TBPH, was used to rinse potentialinterferences. Finally, OH-TBPH was eluted using a mixture ofmethanol/DCM (v/v, 1:1; Figure S5 (SI)). The use of methanolas an elution solvent was different from cleanup methods forother phenolic compounds such as estrogens, which are generallyeluted from Florisil using a mixture of acetone and DCM.34
Thus, the use of acetone as a rinse prior to elution of OH-TBPHallowed removal of most of the yellow or blue interferences inextracts of house dust. Potential effects of matrices were alsoevaluated by spiking 1000 μg/L TBPH and 10 μg/L OH-TBPHinto final extracts before analysis by Q Exactive LC-UHRMS.Suppression of signals of TBPH and OH-TBPH (n = 3) wereminor at −5 ± 3% and −10 ± 6%, respectively. Finally, basedon sample pretreatment methods, the recoveries for TBPH andOH-TBPHwere 76± 12% and 86± 10%, respectively (Table 1).
Concentrations and Profiles of TBPH and OH-TBPH inHouse Dust. The newly developed methods were applied toquantify OH-TBPH and TBPH in 23 samples of house dust.Two OH-TBPH isomers were both detected in house dust(Figure 3B; Table 2), with detection frequencies of 52% and 91%,
respectively. Use of SIM mode was necessary to detectOH-TBPH in house dust, since no peaks related to OH-TBPHwere detected when using full scan mode (Figure S6A, SI).This was likely due to the dynamic range of the Q Exactiveand coelution of numerous compounds that interfered withOH-TBPH. In the analysis of OH-TBPH, intensities of total ionswere 1.5 × 10¹⁰ at a retention time similar to that for OH-TBPHand were much greater than those of OH-TBPH (<105 in SIMmode; Figure S6, SI). Thus, OH-TBPH could not be detectedin full scan mode because maximum injected ions, based onpredictive automated gain control, were limited to 3 × 10⁶.During analysis by SIM, total injected ions were limited to anarrow isolation window (2.0 m/z), which greatly increased thenumber of injected ions for targeted chemicals. Therefore, SIMwas used to analyze OH-TBPH and TBPH in house dust insubsequent experiments.Profiles of relative concentrations of TBPH and OH-TBPH
isomers in dust were compared to technical products to evaluatetheir potential emission source. As expected, the greater propor-tion of OH-TBPH2 compared to OH-TBPH1 in dust sampleswas similar to proportions in BZ-54 and FM-550 but differentfrom the commercial TBPH standard in which proportionswere roughly equal. Concentrations of OH-TBPH2 (GM ±GSD, 0.35 ± 1.0 ng/g, dm) were 10-fold greater than those ofOH-TBPH1 (0.04 ± 0.88 ng/g, dm) in house dust (Table 2).
Table 1. Instrumental Detection Limits (IDLs, μg/L),MethodDetection Limits (MDLs, ng/g, dm), and Recoveries (n = 3)of OH-TBPH Isomers and TBPH of Different Methods
IDLs(GC-MS)a
IDLs(LC-QE)
MDLs(GC-MS)b
MDLs(LC-QE)
recoveries(n = 3)
TBPH 2.5 0.01 4 1.1d 75 ± 12%OH-TBPHc 0.005 0.01 86 ± 10%aData from ref 17. bData from ref 17. cIDLs, MDLs, and recoverieswere just calculated for OH-TBPH2, due to the lack of OH-TBPH1standard. dThe MDL was relatively high compared to IDL since minorbackground TBPH was detected in the procedural blank.
Table 2. Concentrations of OH-TBPH and TBPH (ng/g, dm)in Samples of House Dust from Saskatoon, Saskatchewan(SK), Canada
GM ± GSD min maxdetected
%bcontribution
%c
TBPH 734 ± 0.87 15 22251 100 99.9OH-TBPH1 0.04 ± 0.88 <0.01a 7.3 52% 0.01OH-TBPH2 0.35 ± 1.0 <0.01 27 91% 0.1aThe concentration was lower than MDL (0.01 ng/g, dm). bDetectionfrequencies of TBPH and OH-TBPH isomers in dust samples.cRelative contribution to the sum concentrations of TBPH andOH-TBPH isomers.
Environmental Science & Technology Article
DOI: 10.1021/es505743dEnviron. Sci. Technol. 2015, 49, 2999−3006
3003

TBPH was also detected in all samples of house dust with anaverage concentration, 734 ± 0.87 ng/g, dm. Concentrations ofTBPH were comparable to dust samples from the UK (meanvalue was 381 ng/g, dm) but greater than dust samples fromCalifornia (mean value 260 ng/g, dm).27,35 It should be notedthat the maximum detected concentration of TBPH in thisstudy was 22251 ng/g, dm, several fold greater than previouslyreported maximum concentrations in dust from houses in theUnited Kingdom (6175 dm) andCalifornia (3800 ng/g dm).27,35
In this study, dust samples were collected in 2013 and were morerecent than those in previous studies. Since previous reports haveshown trends of increasing concentrations of TBPH in housedust over time,25 greater concentrations of TBPH in more recentsamples were expected in this study. In fact, in a more recentstudy by Stapleton et al., concentrations of TBPH (maximumconcentration 20960 ng/g, dm) were similar to concentrationsreported here.36 In addition, as shown in Figure 4, relatively great
concentrations of TBPH and OH-TBPH isomers were detectedin three samples from the same home. Information provided ina brief survey showed that the house was constructed in 2004,and most electronics and furniture were recently purchased.Furthermore, several pieces of furniture with TB 117 labelswere discovered in the home. The newly built house, recentlypurchased consumer items, and adherence to Californianfurniture flammability standards might have contributed to therelatively great concentrations of TBPH in this home.Isomers of OH-TBPH were not detected in two samples of
house dust, and concentrations of TBPH in these samples werealso small (74 ng/g and 158 ng/g). Furthermore, a log−linearregression analysis showed a significant relationship betweenconcentrations of TBPH and OH-TBPH isomers (r2 = 0.67 forOH-TBPH1 and r2 = 0.50 for OH-TBPH2, p < 0.001 for both;Figure 5A), which, when paired with evidence of similar isomer
profiles in dust and technical products, indicated commonsources of OH-TBPH and TBPH. However, it should be notedthat the percentage of isomers of OH-TBPH contributing to thesum of concentrations of OH-TBPH and TBPH in samples ofdust were relatively small (0.01% ± 0.67 and 0.1% ± 0.60).Percentages of OH-TBPH in house dust were less than in BZ-54(0.1% and 7.9%), FM-550 (0.1% and 6.2%), and the commercialstandards (0.4% and 0.9% respectively; p < 0.001; Figure 5B),while relative contributions of TBPH in samples of house dust(99.9% ± 0.0) were significantly greater than in the technicalproduct and commercial standard (p < 0.001). The relatively lowcontributions of OH-TBPH might be due to different physical−chemical properties and environmental fates during application,or mechanical or chemical emissions from products to theenvironment. Alternatively, the sample number for technicalproducts was limited, and the proportions of OH-TBPH mightvary among different manufacturers.
Implications. Detection of OH-TBPH contamination inanalytical standards, technical products, and environmental dustsamples is of great importance due to differences in the physical−chemical properties between TBPH and OH-TBPH and theimplications for bioavailability and toxicity. For example, thetoxic potency of OH-TBPH likely differs from that of TBPH asthe addition of a phenolic group, as observed with OH-PBDEs,has been shown to increase the toxic potency of compounds.37
Increased toxicities might be due to structural similarities to
Figure 4. Concentrations of TBPH (A), OH-TBPH1 (B), and OH-TBPH2 (C) in 23 samples of dust from eight houses. Dotted linesseparate house dust samples among houses. Samples between the twored dotted lines were from a house built in 2004, which had greaterconcentrations of TBPH and OH-TBPH isomers.
Figure 5. (A) Log−linear regression between concentrations of TBPHand OH-TBPH in 23 dust samples. (B) Comparison of relativecontributions of TBPH and OH-TBPH isomers in dust samples,commercial standard, BZ-54 technical product, and FM-550 technicalproduct. The y axis indicates the log-transformed percentages of TBPHand OH-TBPHs in different samples. Colors differentiate dust samplesor standard. Chinastd indicates the commercial TBPH standardproduced in China. A t-test was used to evaluate statistical difference.***p < 0.001.
Environmental Science & Technology Article
DOI: 10.1021/es505743dEnviron. Sci. Technol. 2015, 49, 2999−3006
3004

endogenous compounds including 17-β-estradiol, triiodothyro-nine, or thyroxine, and/or greater binding affinities with importantreceptors or transport proteins.38 In addition, because of itsextreme hydrophobicity (estimated log KOW, 11.95), bioavail-ability of TBPH is likely relatively limited.31,39 The substitution ofbromine for the hydroxyl group of OH-TBPH would lead to alesser logKOW, estimated at 9.56 (ChemDraw Ultra 8.0), and thusgreater bioavailability. Therefore, the addition of a phenolic group,potential increased toxic potency, and increased bioavailabilityof OH-TBPH might lead to greater concerns about risks posedto the environment and human health.
■ ASSOCIATED CONTENT*S Supporting InformationFigures addressing (1) chromatogram of extracted ions withm/z640.9946 (10 ppm window) in negative ion mode using puremethanol as the mobile phase, (2) chromatogram of extractedions with m/z 640.9946 (10 ppm window) for highly purifiedstandard (AccuStandard, New Haven, CT, USA), (3) chromato-grams and mass spectra for OH-TBPH in positive ion mode, (4)NMR results for purified OH-TBPH, (5) TBPH and OH-TBPHin different fractions from florisil cartridges, (6) comparison ofSIM of full scan mode for detection of OH-TBPH and TBPH.This material is available free of charge via the Internet at http://pubs.acs.org.
■ AUTHOR INFORMATIONCorresponding Author*Tel. (direct): 306-966-2096. Tel. (secretary): 306-966-4680.Fax: 306-966-4796. E-mail: [email protected] Contributions○Contributed equally to the work.NotesThe authors declare no competing financial interest.
■ ACKNOWLEDGMENTSThe authors would like to thank Mingliang Fang of the HeatherStapleton Research Group, Duke University, Nicholas School ofthe Environment for his kind gift of Firemaster technicalproducts. D.M.V.S was supported by the Vanier CanadaGraduate Scholarship and the NSERC CREATE HERAProgram. J.P.G. was supported by the Canada Research Chairprogram, a Visiting Distinguished Professorship in the Depart-ment of Biology and Chemistry and State Key Laboratory inMarine Pollution, City University of Hong Kong, the 2012 “HighLevel Foreign Experts” (GDW20223200120) program fundedby the State Administration of Foreign Experts Affairs, the P. R.China to Nanjing University, and the Einstein Professor Programof the Chinese Academy of Sciences. The research was supportedby a Discovery Grant from the Natural Science and EngineeringResearch Council of Canada (Project #326415-07) and a grantfrom the Western Economic Diversification Canada (Project#6578 and 6807). The authors wish to acknowledge the supportof an instrumentation grant from Western Economic Diversifi-cation (WED; 000012711).
■ REFERENCES(1) Alaee, M.; Wenning, R. J. The significance of brominated flameretardants in the environment: current understanding, issues andchallenges. Chemosphere 2002, 46 (5), 579−582.(2) Birnbaum, L. S.; Staskal, D. F. Brominated flame retardants: Causefor concern? Environ. Health Perspect. 2004, 112 (1), 9−17.
(3) Kohler, M.; Zennegg, M.; Bogdal, C.; Gerecke, A. C.; Schmid, P.;Heeb, N. V.; Sturm, M.; Vonmont, H.; Kohler, H. P. E.; Giger, W.Temporal trends, congener patterns, and sources of Octa-, Nona-, anddecabromodiphenyl ethers (PBDE) and hexabromocyclododecanes(HBCD) in Swiss lake sediments. Environ. Sci. Technol. 2008, 42 (17),6378−6384.(4) Xie, Z. Y.; Moller, A.; Ahrens, L.; Sturm, R.; Ebinghaus, R.Brominated Flame Retardants in Seawater and Atmosphere of theAtlantic and the Southern Ocean. Environ. Sci. Technol. 2011, 45 (5),1820−1826.(5) Lake, I. R.; Foxall, C. D.; Fernandes, A.; Lewis, M.; Rose,M.;White,O.; Dowding, A. Effects of river flooding on polybrominated diphenylether (PBDE) levels in cows’ milk, soil, and grass. Environ. Sci. Technol.2011, 45 (11), 5017−24.(6) Boon, J. P.; Lewis, W. E.; Tjoen-A-Choy, M. R.; Allchin, C. R.; Law,R. J.; de Boer, J.; ten Hallers-Tjabbes, C. C.; Zegers, B. N. Levels ofpolybrominated diphenyl ether (PBDE) flame retardants in animalsrepresenting different trophic levels of the North Sea food web. Environ.Sci. Technol. 2002, 36 (19), 4025−4032.(7) Wan, Y.; Hu, J. Y.; Zhang, K.; An, L. H. Trophodynamics ofpolybrominated diphenyl ethers in the marine food web of Bohai Bay,North China. Environ. Sci. Technol. 2008, 42 (4), 1078−1083.(8) Wolkers, H.; Van Bavel, B.; Derocher, A. E.; Wiig, O.; Kovacs, K.M.; Lydersen, C.; Lindstrom, G. Congener-specific accumulation andfood chain transfer of polybrominated diphenyl ethers in two Arcticfood chains. Environ. Sci. Technol. 2004, 38 (6), 1667−1674.(9) Zhou, T.; Ross, D. G.; DeVito, M. J.; Crofton, K. M. Effects ofshort-term in vivo exposure to polybrominated diphenyl ethers onthyroid hormones and hepatic enzyme activities in weanling rats.Toxicol. Sci. 2001, 61 (1), 76−82.(10) Muirhead, E. K.; Skillman, D.; Hook, S. E.; Schultz, I. R. Oralexposure of PBDE-47 in fish: Toxicokinetics and reproductive effects inJapanese medaka (Oryzias latipes) and fathead minnows (Pimephalespromelas). Environ. Sci. Technol. 2006, 40 (2), 523−528.(11) Alm, H.; Scholz, B.; Kultima, K.; Nilsson, A.; Andren, P. E.;Savitski, M. M.; Bergman, A.; Stigson, M.; Fex-Svenningsen, A.;Dencker, L. In Vitro Neurotoxicity of PBDE-99: Immediate andConcentration-Dependent Effects on Protein Expression in CerebralCortex Cells. J. Proteome Res. 2010, 9 (3), 1226−1235.(12) Ma, Y. N.; Salamova, A.; Venier, M.; Hites, R. A. Has the Phase-Out of PBDEs Affected Their Atmospheric Levels? Trends of PBDEsand Their Replacements in the Great Lakes Atmosphere. Environ. Sci.Technol. 2013, 47 (20), 11457−11464.(13) Ma, Y. N.; Venier, M.; Hites, R. A. 2-Ethylhexyl Tetrabromo-benzoate and Bis(2-ethylhexyl) Tetrabromophthalate Flame Retardantsin the Great Lakes Atmosphere. Environ. Sci. Technol. 2012, 46 (1),204−208.(14) Schmidt, J. S.; Schaedlich, K.; Fiandanese, N.; Pocar, P.; Fischer,B. Effects of Di(2-ethylhexyl) Phthalate (DEHP) on Female Fertilityand Adipogenesis in C3H/N Mice. Environ. Health Perspect. 2012, 120(8), 1123−1129.(15) Feige, J. N.; Gerber, A.; Casals-Casas, C.; Yang, Q.; Winkler, C.;Bedu, E.; Bueno, M.; Gelman, L.; Auwerx, J.; Gonzalez, F. J.; Desvergne,B. The Pollutant Diethylhexyl Phthalate Regulates Hepatic EnergyMetabolism via Species-Specific PPAR alpha-Dependent Mechanisms.Environ. Health Perspect. 2010, 118 (2), 234−241.(16) Chauvigne, F.; Menuet, A.; Lesne, L.; Chagnon, M. C.; Chevrier,C.; Regnier, J. F.; Angerer, J.; Jegou, B. Time- and Dose-Related Effectsof Di-(2-ethylhexyl) Phthalate and Its Main Metabolites on theFunction of the Rat Fetal Testis in Vitro. Environ. Health Perspect.2009, 117 (4), 515−521.(17) Roberts, S. C.; Macaulay, L. J.; Stapleton, H. M. In VitroMetabolism of the Brominated Flame Retardants 2-Ethylhexyl-2,3,4,5-Tetrabromobenzoate (TBB) and Bis(2-ethylhexyl) 2,3,4,5-Tetrabro-mophthalate (TBPH) in Human and Rat Tissues. Chem. Res. Toxicol.2012, 25 (7), 1435−1441.(18) Springer, C.; Dere, E.; Hall, S. J.; McDonnell, E. V.; Roberts, S. C.;Butt, C. M.; Stapleton, H. M.; Watkins, D. J.; McClean, M. D.; Webster,T. F.; Schlezinger, J. J.; Boekelheide, K. Rodent Thyroid, Liver, and Fetal
Environmental Science & Technology Article
DOI: 10.1021/es505743dEnviron. Sci. Technol. 2015, 49, 2999−3006
3005

Testis Toxicity of the Monoester Metabolite of Bis-(2-ethylhexyl)Tetrabromophthalate (TBPH), a Novel Brominated Flame RetardantPresent in Indoor Dust. Environ. Health Perspect. 2012, 120 (12), 1711−1719.(19) Saunders, D. M. V.; Higley, E. B.; Hecker, M.; Mankidy, R.; Giesy,J. P. In vitro endocrine disruption and TCDD-like effects of three novelbrominated flame retardants: TBPH, TBB, & TBCO. Toxicol. Lett.2013, 223 (2), 252−259.(20) Stapleton, H. M.; Allen, J. G.; Kelly, S. M.; Konstantinov, A.;Klosterhaus, S.; Watkins, D.; McClean, M. D.; Webster, T. F. Alternateand new brominated flame retardants detected in US house dust.Environ. Sci. Technol. 2008, 42 (18), 6910−6916.(21) M?ller, A.; Xie, Z. Y.; Cai, M. H.; Zhong, G. C.; Huang, P.; Cai, M.G.; Sturm, R.; He, J. F.; Ebinghaus, R. Polybrominated Diphenyl Ethersvs Alternate Brominated Flame Retardants and Dechloranes from EastAsia to the Arctic. Environ. Sci. Technol. 2011, 45 (16), 6793−6799.(22) Liu, H. H.; Hu, Y. J.; Luo, P.; Bao, L. J.; Qiu, J. W.; Leung, K.M. Y.;Zeng, E. Y. Occurrence of Halogenated Flame Retardants in Sedimentoff an Urbanized Coastal Zone: Association with Urbanization andIndustrialization. Environ. Sci. Technol. 2014, 48 (15), 8465−8473.(23) Lam, J. C. W.; Lau, R. K. F.; Murphy, M. B.; Lam, P. K. S.Temporal Trends of Hexabromocyclododecanes (HBCDs) andPolybrominated Diphenyl Ethers (PBDEs) and Detection of TwoNovel Flame Retardants in Marine Mammals from Hong Kong, SouthChina. Environ. Sci. Technol. 2009, 43 (18), 6944−6949.(24) Zhou, S. N.; Buchar, A.; Siddique, S.; Takser, L.; Abdelouahab, N.;Zhu, J. P. Measurements of Selected Brominated Flame Retardants inNursing Women: Implications for Human Exposure. Environ. Sci.Technol. 2014, 48, 8873−8880.(25) Cequier, E.; Ionas, A. C.; Covaci, A.; Marce, R. M.; Becher, G.;Thomsen, C. Occurrence of a Broad Range of Legacy and EmergingFlame Retardants in Indoor Environments in Norway. Environ. Sci.Technol. 2014, 48 (12), 6827−6835.(26) Cao, Z. G.; Xu, F. C.; Covaci, A.; Wu, M.; Wang, H. Z.; Yu, G.;Wang, B.; Deng, S. B.; Huang, J.; Wang, X. Y. Distribution Patterns ofBrominated, Chlorinated, and Phosphorus Flame Retardants withParticle Size in Indoor and Outdoor Dust and Implications for HumanExposure. Environ. Sci. Technol. 2014, 48 (15), 8839−8846.(27) Dodson, R. E.; Perovich, L. J.; Covaci, A.; Van den Eede, N.; Ionas,A. C.; Dirtu, A. C.; Brody, J. G.; Rudel, R. A. After the PBDE Phase-Out:A Broad Suite of Flame Retardants in Repeat House Dust Samples fromCalifornia. Environ. Sci. Technol. 2012, 46 (24), 13056−13066.(28) Allen, J. G.; McClean, M. D.; Stapleton, H. M.; Webster, T. F.Critical factors in assessing exposure to PBDEs via house dust. Environ.Int. 2008, 34 (8), 1085−1091.(29) Zhou, S. N.; Reiner, E. J.; Marvin, C.; Helm, P.; Riddell, N.;Dorman, F.; Misselwitz, M.; Shen, L.; Crozier, P.; MacPherson, K.;Brindle, I. D. Development of liquid chromatography atmosphericpressure chemical ionization tandem mass spectrometry for analysis ofhalogenated flame retardants in wastewater. Anal. Bioanal. Chem. 2010,396 (3), 1311−1320.(30) Hardy, M. L. The toxicology of the three commercialpolybrominated diphenyl oxide (ether) flame retardants. Chemosphere2002, 46 (5), 757−777.(31) Klosterhaus, S. L.; Stapleton, H. M.; La Guardia, M. J.; Greig, D. J.Brominated and chlorinated flame retardants in San Francisco Baysediments and wildlife. Environ. Int. 2012, 47, 56−65.(32) Chang-Liao, W. L.; Hou, M. L.; Chang, L. W.; Lee, C. J.; Tsai, Y.M.; Lin, L. C.; Tsai, T. H. Determination and Pharmacokinetics of Di-(2-ethylhexyl) Phthalate in Rats by Ultra Performance LiquidChromatography with Tandem Mass Spectrometry. Molecules 2013,18 (9), 11452−11466.(33) Kato, Y.; Okada, S.; Atobe, K.; Endo, T.; Matsubara, F.; Oguma,T.; Haraguchi, K. Simultaneous Determination by APCI-LC/MS/MS ofHydroxylated and Methoxylated Polybrominated Diphenyl EthersFound in Marine Biota. Anal. Chem. 2009, 81 (14), 5942−5948.(34) Chang, H.; Wan, Y.; Hu, J. Y. Determination and SourceApportionment of Five Classes of Steroid Hormones in Urban Rivers.Environ. Sci. Technol. 2009, 43 (20), 7691−7698.
(35) Ali, N.; Harrad, S.; Goosey, E.; Neels, H.; Covaci, A. “Novel”brominated flame retardants in Belgian and UK indoor dust:Implications for human exposure. Chemosphere 2011, 83 (10), 1360−1365.(36) Stapleton, H. M.; Misenheimer, J.; Hoffman, K.; Webster, T. F.Flame retardant associations between children’s handwipes and housedust. Chemosphere 2014, 116, 54−60.(37) Dingemans, M. M. L.; van den Berg, M.; Westerink, R. H. S.Neurotoxicity of Brominated Flame Retardants: (In)direct Effects ofParent and Hydroxylated Polybrominated Diphenyl Ethers on the(Developing) Nervous System. Environ. Health Perspect. 2011, 119 (7),900−907.(38) Hamers, T.; Kamstra, J. H.; Sonneveld, E.; Murk, A. J.; Visser, T.J.; Van Velzen, M. J. M.; Brouwer, A.; Bergman, A. Biotransformation ofbrominated flame retardants into potentially endocrine-disruptingmetabolites, with special attention to 2,2’,4,4’-tetrabromodiphenylether (BDE-47). Mol. Nutr. Food Res. 2008, 52 (2), 284−298.(39) Bearr, J. S.; Stapleton, H. M.; Mitchelmore, C. L. Accumulationand DNA damage in Fathead Minous (Pimephales Promelas) expsoed to2 brominated flame-retardant mixtures, Firemaster (R) 550 andFiremaster (R) BZ-54. Environ. Toxicol. Chem. 2010, 29 (3), 722−729.
Environmental Science & Technology Article
DOI: 10.1021/es505743dEnviron. Sci. Technol. 2015, 49, 2999−3006
3006

Supporting Information for “Detection, Identification, and Quantification of Hydroxylated
Bis(2-ethylhexyl)-Tetrabromophthalate Isomers in House Dust”
Hui PENG, David M.V. Saunders, Jianxian SUN, Codling Garry, Steve Wiseman, Paul D. Jones,
and John. P. Giesy
Words 171
Figures 6
This supporting information provides figures addressing (1) Chromatogram of extracted ions
with m/z 640.9946 (10 ppm window) in negative ion using pure methanol as mobile phase; (2)
Chromatogram of extracted ions with m/z 640.9946 (10 ppm window) for highly purified
standard (AccuStandard, New Haven, CT, USA); (3) Chromatograms and mass spectra for OH-
TBPH in positive ion mode; (4) NMR results for purified OH-TBPH; (5) TBPH and OH-TBPH
in different fractions from florisil cartridges; (6) Comparison of SIM of full scan mode for
detection of OH-TBPH and TBPH.

Purification of OH-TBPH by HPLC fractionation. HPLC fractionation was used to isolate
OH-TBPH from technical product BZ-54 which contained only TBB and TBPH compared to
FM-550. Fractions were collected at 2-min interval from 0 min to 120 min, and then OH-TBPH2
in each fraction was quantified by use of UHPLC-Q Exactive after 10,000-fold dilution with a
mixture of methanol and acetone (v/v, 1:1). Fractions which contained OH-TBPH2 were
collected and combined, and then evaporated. Fractionation was conducted by use of a Betasil
C18 column (5 µm; 22.1 mm × 150 mm; Thermo Fisher Scientific) which was maintained at
30 °C. The flow rate and the injection volume were 6 mL/min and 100 µL, respectively. Mixture
of methanol and ultrapure water (v/v, 8:2) containing 0.1% NH4OH (v/v) was used as mobile
phase. After purification, the OH-TBPH2 was characterized by 1H NMR spectra (Figure S4).
The purified OH-TBPH2 (0.1 mg/L) was also characterized using UHPLC-Q Exactive with full
scan range from m/z 200-2000. The intensity of OH-TBPH2 was 100-folds higher than TBPH,
indicated the relatively high purity of the OH-TBPH2 standard (Figure S4).

Figure S1. Chromatogram of extracted ions with m/z 640.9946 (10 ppm window) in negative ion
mode for commercial standard using pure methanol as mobile phase.

Figure S2. Chromatogram of extracted ions with m/z 640.9946 (10 ppm window) in negative ion
mode for highly purified standard (AccuStandard, New Haven, CT, USA).

Figure S3. (A) Chromatogram of extracted ions with m/z 666.9861 (10 ppm window) in positive
ion mode for BZ-54 standard. (B) Mass spectra of OH-TBPH in positive ion mode with mass
error of 0.75 ppm to sodium adduct.
(A)
(B)

Figure S4. Ultra-High Resolution LC/mass spectrometry (above) and 1H NMR (bottom) analysis
of purified OH-TBPH standards. The impurity of TBPH was 100 folds lower than OH-TBPH2 in
purified standard.

Figure S5. (A) TBPH was eluted in the first fraction from Florisil cartridges using DCM; (B)
OH-TBPH isomers were eluted in the third fraction from Florisil cartridges using a mixture of methanol:DCM (v/v, 1:1).

Figure S6. Comparison of the SIM mode and full scan mode for OH-TBPH analysis in dust
samples. (A) OH-TBPH isomers could not be detected under full scan mode when extracted the
ions at 10 ppm window. (B) Two OH-TBPH isomers were successfully detected using SIM mode
when extracted the ions at 10 ppm window. (C) TBPH was observed in full scan mode. (D) The
total ion intensity in negative ion mode was much greater than those of OH-TBPH at the similar
elution time. (E) Total ion intensity in positive ion mode and comparison to TBPH intensity.