detection, identification and conformational dynamic characterization of single molecules by...
TRANSCRIPT

Detection, identification and Detection, identification and conformational dynamic conformational dynamic
characterization of single molecules characterization of single molecules by ultra-sensitive fluorescence by ultra-sensitive fluorescence
spectroscopy techniques.spectroscopy techniques.
Detection, identification and Detection, identification and conformational dynamic conformational dynamic
characterization of single molecules characterization of single molecules by ultra-sensitive fluorescence by ultra-sensitive fluorescence
spectroscopy techniques.spectroscopy techniques.
Jerker WidengrenJerker WidengrenExp. Biomol. PhysicsExp. Biomol. Physics
Dept. PDept. Physicshysics, KTH, KTH
Topics of DiscussionTopics of Discussion
FFluorescence Correlation Spectroscopy (FCS)luorescence Correlation Spectroscopy (FCS)- Concept- Concept- strategies to study molecular kinetics / - strategies to study molecular kinetics /
applicationsapplications
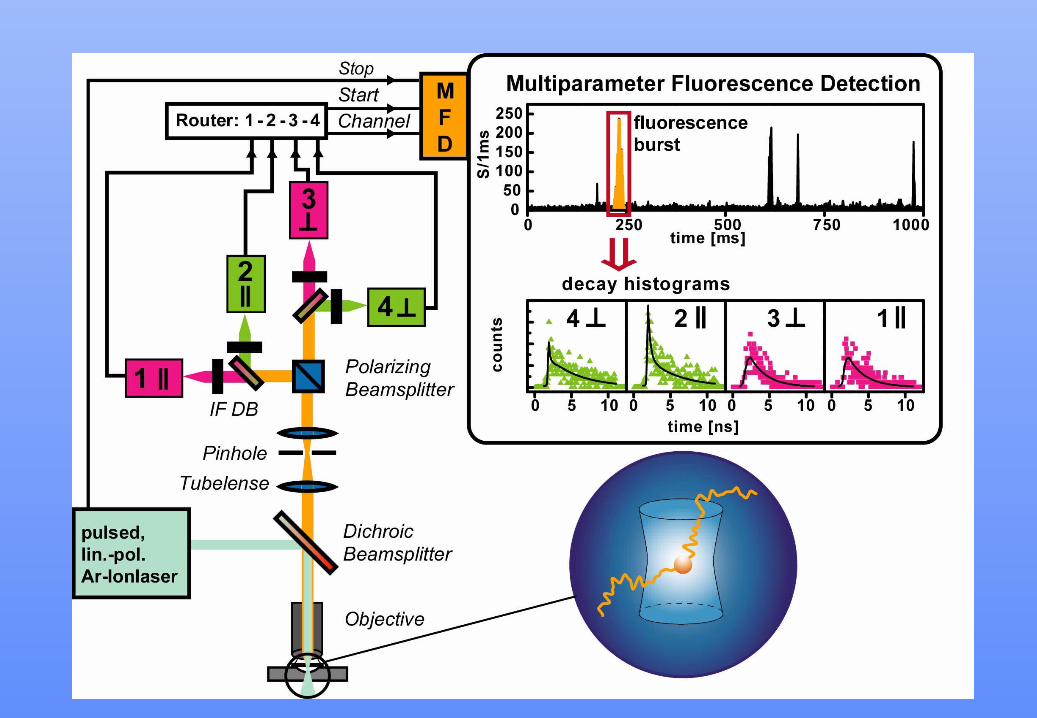
Single-molecule Multi-parameter fluorescence Single-molecule Multi-parameter fluorescence detection (smMFD)detection (smMFD)- Concept- Concept- single-molecule FRET studies- single-molecule FRET studies

Fluorescence Correlation Fluorescence Correlation SpectroscopySpectroscopyFluorescence Correlation Fluorescence Correlation SpectroscopySpectroscopy
Dynamic properties of molecules probed via Dynamic properties of molecules probed via their thermodynamic fluctuationstheir thermodynamic fluctuations
At equilibrium, no perturbationAt equilibrium, no perturbation OOriginal conceptriginal concept
Magde, Elson and Webb, Magde, Elson and Webb, 19721972, , Phys. Rev. Lett. 29, 705Phys. Rev. Lett. 29, 705
Elson and Magde, Elson and Magde, 19741974, , Biopolymers, 13, 1Biopolymers, 13, 1Magde, Elson and Webb, Magde, Elson and Webb, 19741974, , Biopolymers, 13, 29Biopolymers, 13, 29Ehrenberg and Rigler, Ehrenberg and Rigler, 19741974, , Chem. Phys., 4, 390Chem. Phys., 4, 390
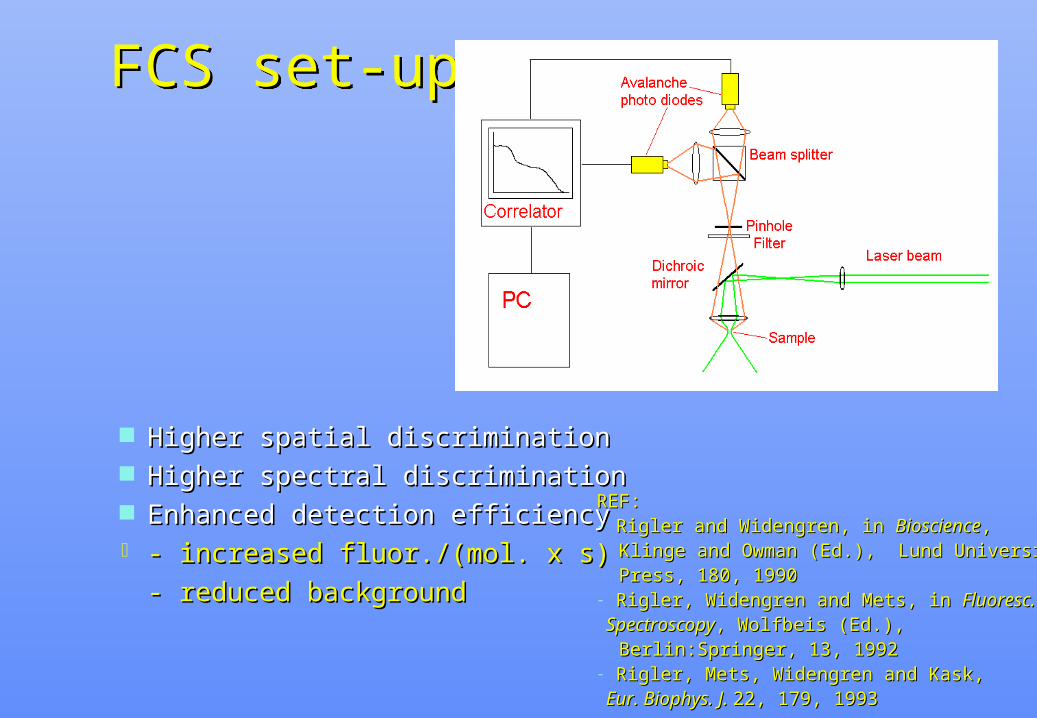
FCS set-upFCS set-up
Higher spatial discriminationHigher spatial discrimination Higher spectral discriminationHigher spectral discrimination Enhanced detection efficiencyEnhanced detection efficiency - increased fluor./(mol. x s)- increased fluor./(mol. x s)
- reduced background- reduced background
REF:REF:- Rigler and Widengren, in Rigler and Widengren, in BioscienceBioscience, , Klinge and Owman (Ed.), Klinge and Owman (Ed.), Lund UniversityLund University Press, 180, 1990Press, 180, 1990 - Rigler, Widengren and Mets, in Rigler, Widengren and Mets, in FluorescFluoresc.. SpectroscopySpectroscopy, Wolfbeis (Ed.), , Wolfbeis (Ed.), Berlin:Springer, 13, 1992Berlin:Springer, 13, 1992- Rigler, Mets, Widengren and Kask, Rigler, Mets, Widengren and Kask, Eur. Biophys. J. Eur. Biophys. J. 22, 179, 199322, 179, 1993
<I>
t
I(t)
<I>
t
I(t)
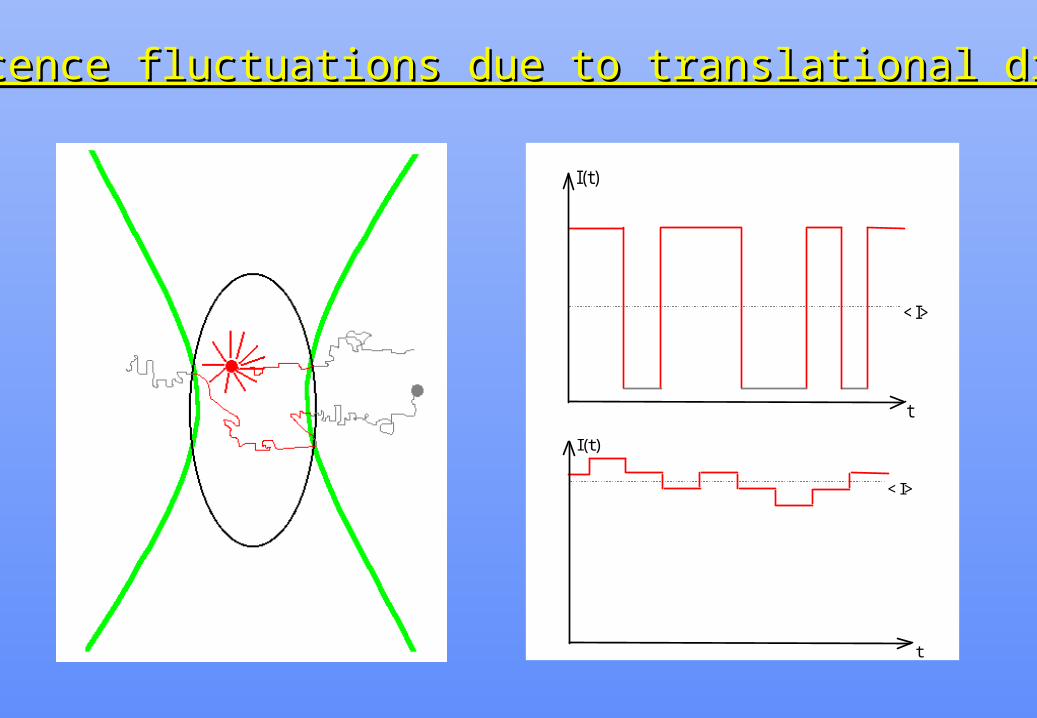
Fluorescence fluctuations due to translational diffusionFluorescence fluctuations due to translational diffusion
GN D D
D ( ) (/
)(/
) /
1 1
1 4
1
1 41
12
22
1 2
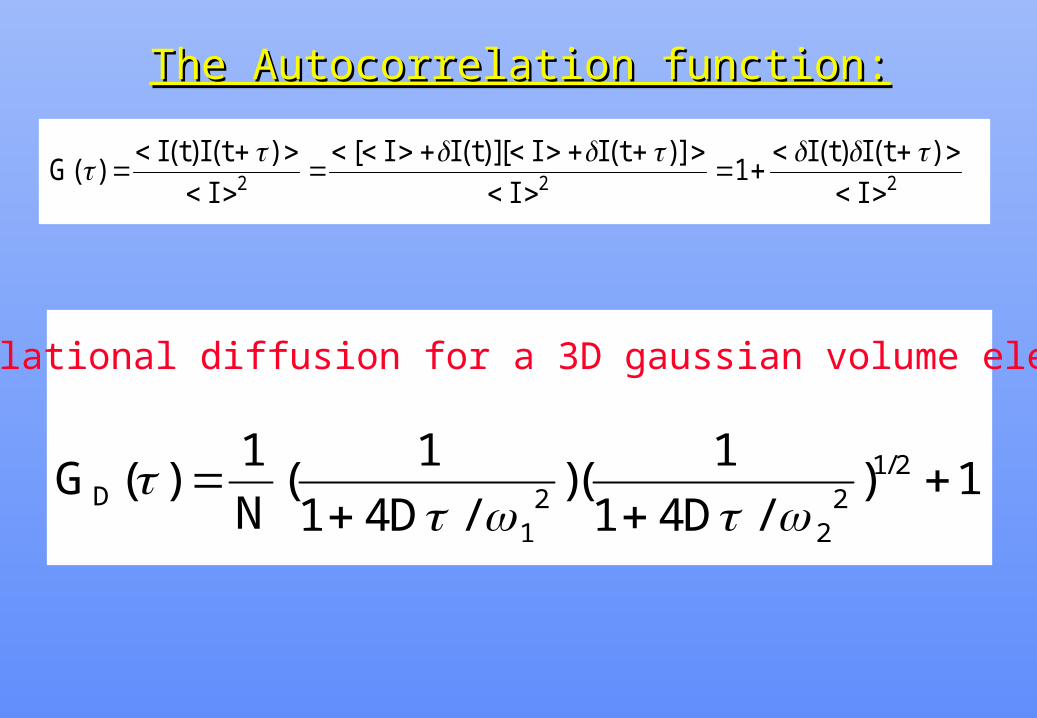
The Autocorrelation function:The Autocorrelation function:
Translational diffusion for a 3D gaussian volume element:
GI t I t
I
I I t I I t
I
I t I t
I( )
( ) ( ) [ ( )][ ( )] ( ) ( )
2 2 21
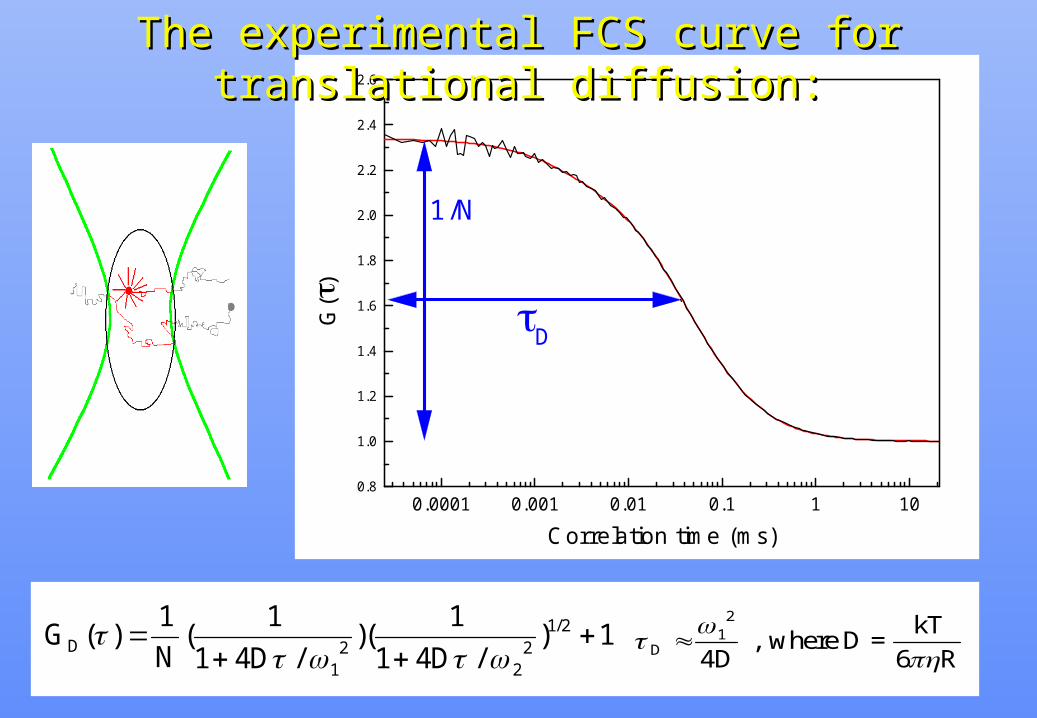
0.0001 0.001 0.01 0.1 1 100.8
1.0
1.2
1.4
1.6
1.8
2.0
2.2
2.4
2.6
D
1/N
G( )
Correlation time (ms)
The experimental The experimental FCS curveFCS curve for translational diffusion: for translational diffusion:
GN D D
D ( ) (/
)(/
) /
1 1
1 4
1
1 41
12
22
1 2
D D 1
2
4 , where D =
kT
6 R
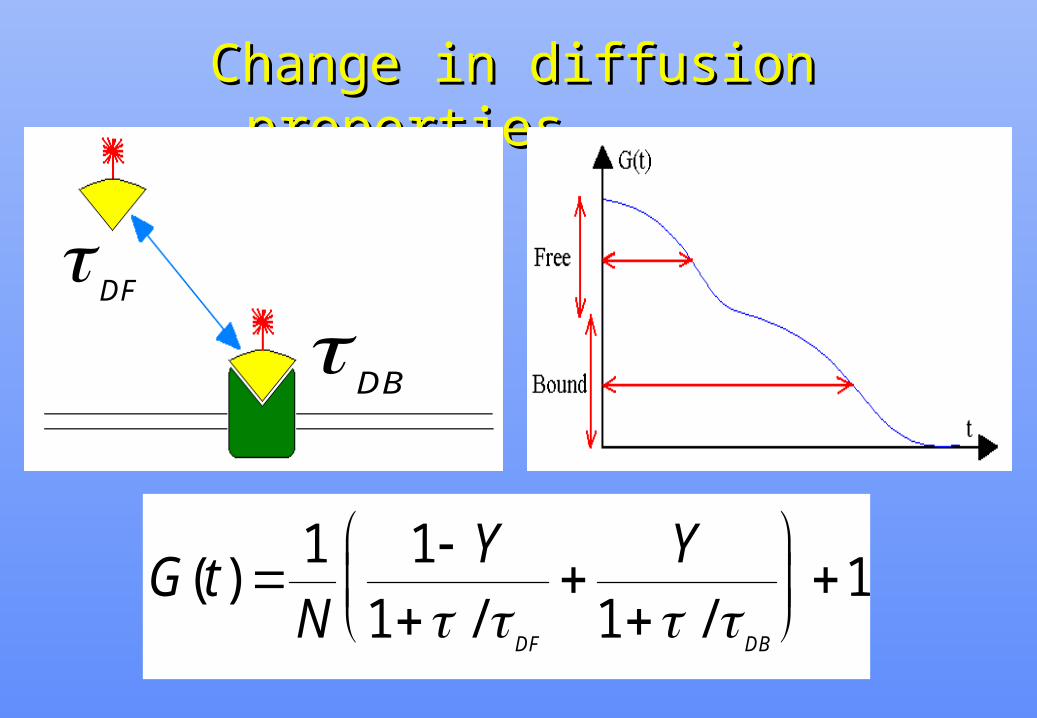
Change in diffusion propertiesChange in diffusion properties
DF
DB
G tN
Y Y
DF DB
( )/ /
1 1
1 11
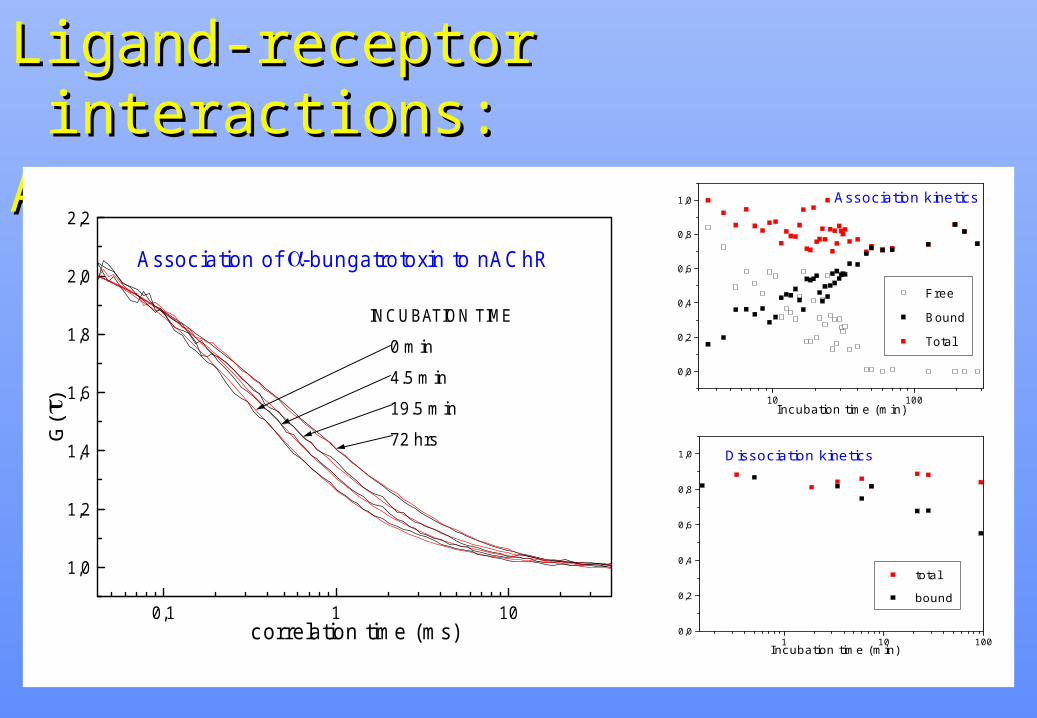
Ligand-receptor interactions:Ligand-receptor interactions:A:A: nAChR in solutionnAChR in solution
0,1 1 10
1,0
1,2
1,4
1,6
1,8
2,0
2,2
INCUBATION TIME
0 min
4.5 min
19.5 min
72 hrs
Association of -bungatrotoxin to nAChR
G(
)
correlation time (ms)
10 100
0,0
0,2
0,4
0,6
0,8
1,0 Association kinetics
Free
Bound
Total
Incubation time (min)
1 10 1000,0
0,2
0,4
0,6
0,8
1,0 Dissociation kinetics
total
bound
Incubation time (min)
High sensitivity, ligand-receptor High sensitivity, ligand-receptor interactions at low conc. can be interactions at low conc. can be followedfollowed
low conc. of labelled ligands ---> low conc. of labelled ligands ---> facilitates displacements studiesfacilitates displacements studies
No separation of bound from unboundNo separation of bound from unbound Low quantities of material neededLow quantities of material needed No radioactivity No radioactivity
REF: Rauer, Neumann, Widengren, Rigler 1996, REF: Rauer, Neumann, Widengren, Rigler 1996, Biophys. ChemBiophys. Chem
58, 58, 3-123-12

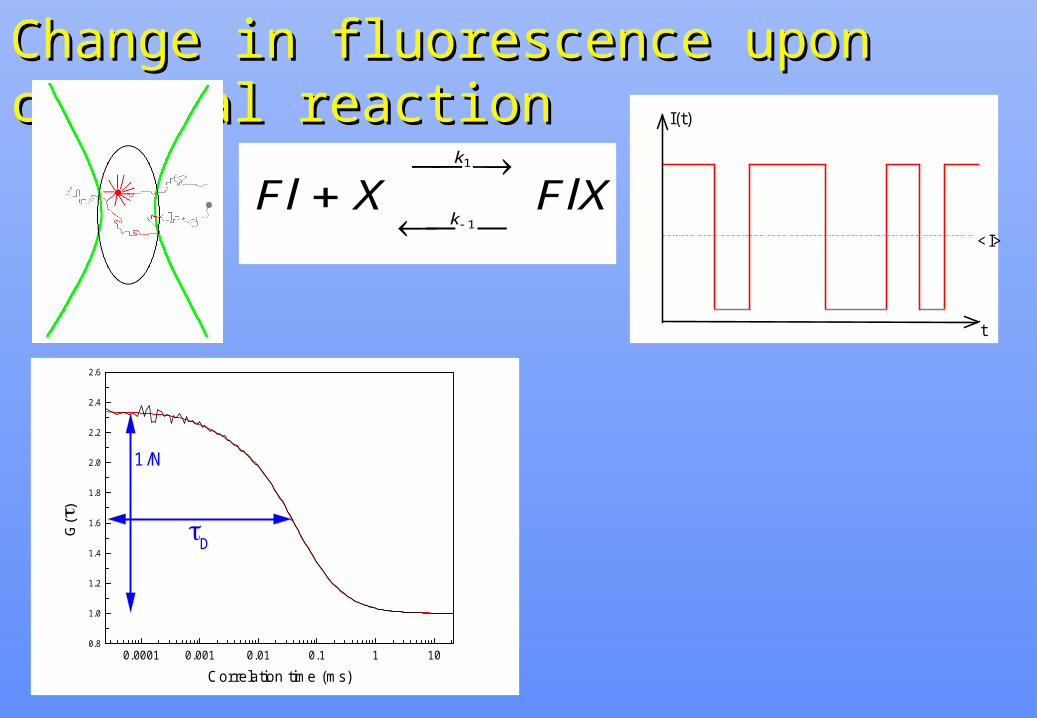
Change in fluorescence upon chemical reactionChange in fluorescence upon chemical reaction
<I>
t
I(t)
0.0001 0.001 0.01 0.1 1 100.8
1.0
1.2
1.4
1.6
1.8
2.0
2.2
2.4
2.6
D
1/N
G(
)
Correlation time (ms)
Change in fluorescence upon chemical reactionChange in fluorescence upon chemical reaction
<I>
t
I(t)
0.0001 0.001 0.01 0.1 1 100.8
1.0
1.2
1.4
1.6
1.8
2.0
2.2
2.4
2.6
D
1/N
G(
)
Correlation time (ms)
Fl X FlXk
k
1
1

Change in fluorescence upon chemical reactionChange in fluorescence upon chemical reaction
<I>
t
I(t)
Fl X FlXk
k
1
1
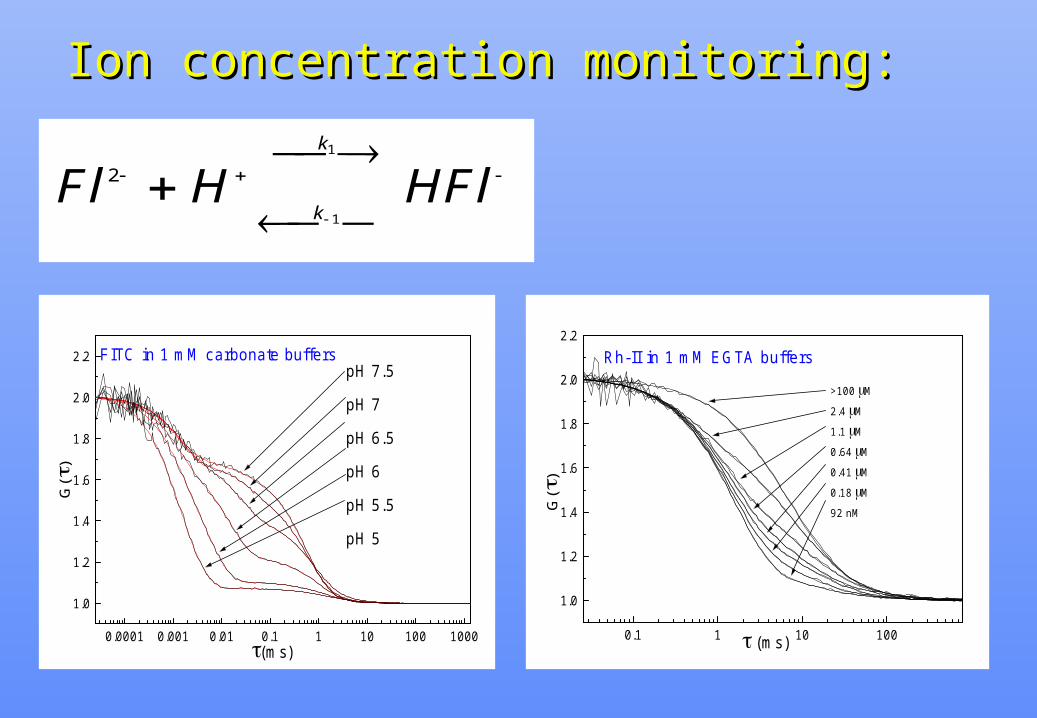
Ion concentration monitoring:Ion concentration monitoring:
Fl H HFlk
k
2
1
1
0.1 1 10 100
1.0
1.2
1.4
1.6
1.8
2.0
2.2
Rh-II in 1 mM EGTA buffers
>100 M
2.4 M
1.1 M
0.64 M
0.41 M
0.18 M
92 nMG(
)
(ms)0.0001 0.001 0.01 0.1 1 10 100 1000
1.0
1.2
1.4
1.6
1.8
2.0
2.2 FITC in 1 mM carbonate bufferspH 7.5
pH 7
pH 6.5
pH 6
pH 5.5
pH 5
G(
)
(ms)
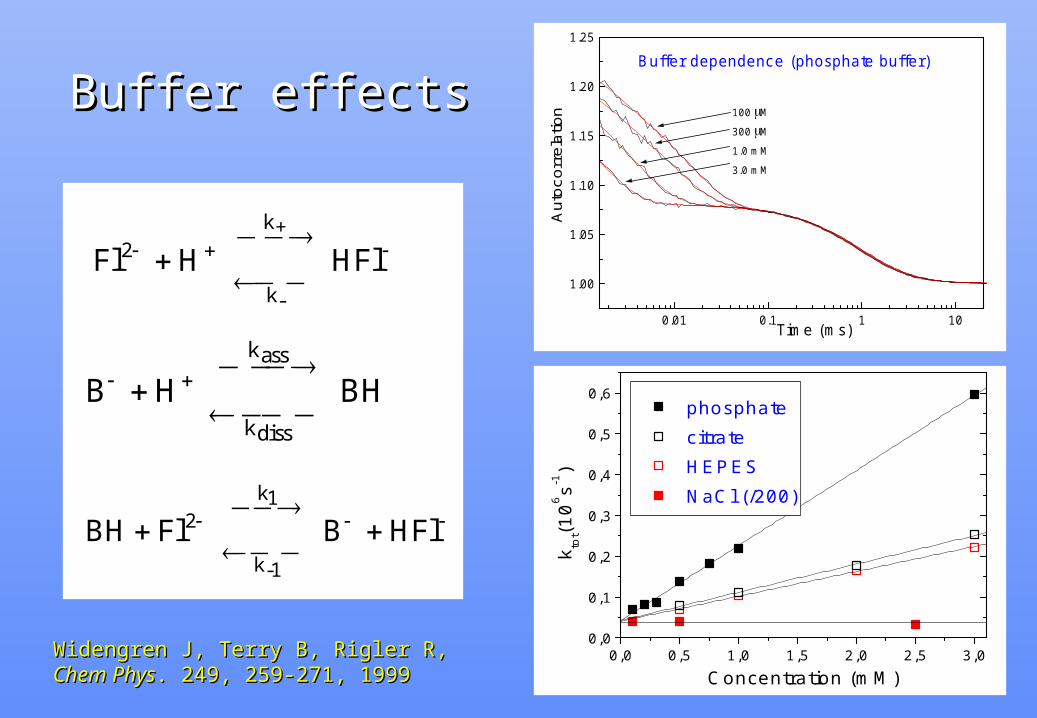
Buffer effectsBuffer effects
Fl H HFl2
k+
k-
B H BH
kass
kdiss
BH Fl B HFl2
k1
k-1
0.01 0.1 1 10
1.00
1.05
1.10
1.15
1.20
1.25
100 M
300 M
1.0 mM
3.0 mM
Buffer dependence (phosphate buffer)
Aut
ocor
rela
tion
Time (ms)
0,0 0,5 1,0 1,5 2,0 2,5 3,00,0
0,1
0,2
0,3
0,4
0,5
0,6
phosphatecitrateHEPESNaCl (/200)
k tot(1
06 s-1)
Concentration (mM)Widengren J, Terry B, Rigler R,Widengren J, Terry B, Rigler R,Chem PhysChem Phys. 249, 259-271, 1999. 249, 259-271, 1999
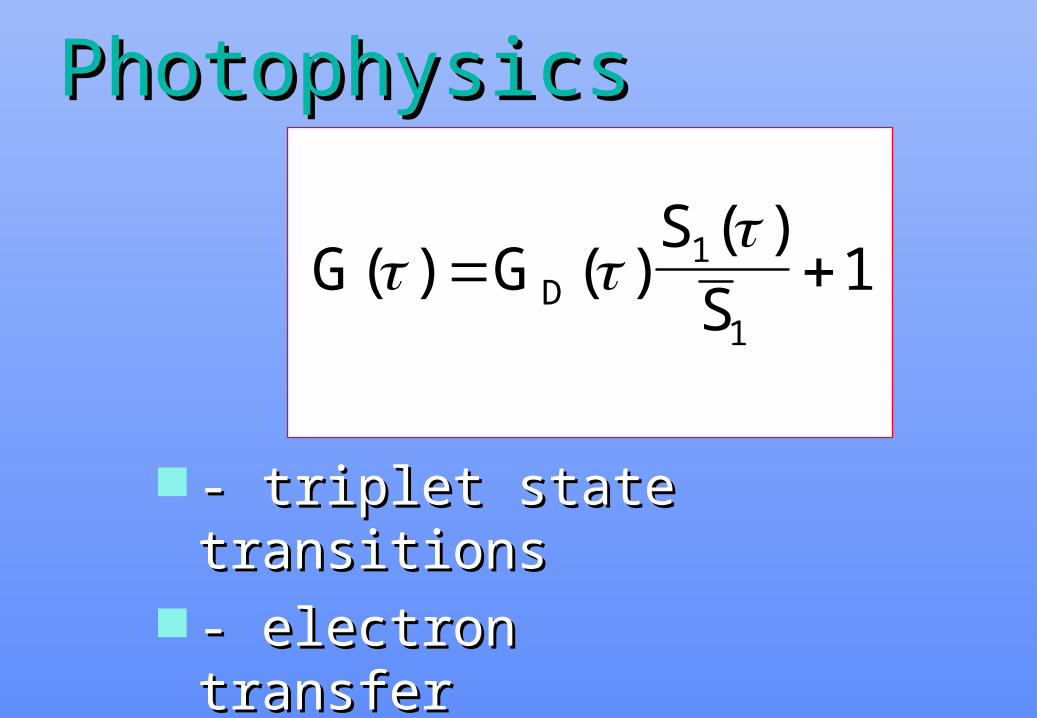
PhotophysicsPhotophysics
- triplet state transitions - triplet state transitions - electron transfer- electron transfer - trans-cis isomerization- trans-cis isomerization
G GS
SD( ) ( )( )
1
1
1

Triplet state monitoring by FCSTriplet state monitoring by FCS
FFluctuations inluctuations in fluorescence due to singlet-triplet transitionsfluorescence due to singlet-triplet transitions
TS0+S
1TS
0+S
1
k21
k12
=abs
Iexc
k31
k23
S0
S1
T1
)(T
)(1S
)(0
31230
02123k-12k31k21k12
)(
)(1S
)(0
t
t
tS
kk
k
k
tT
t
tS
dt
d
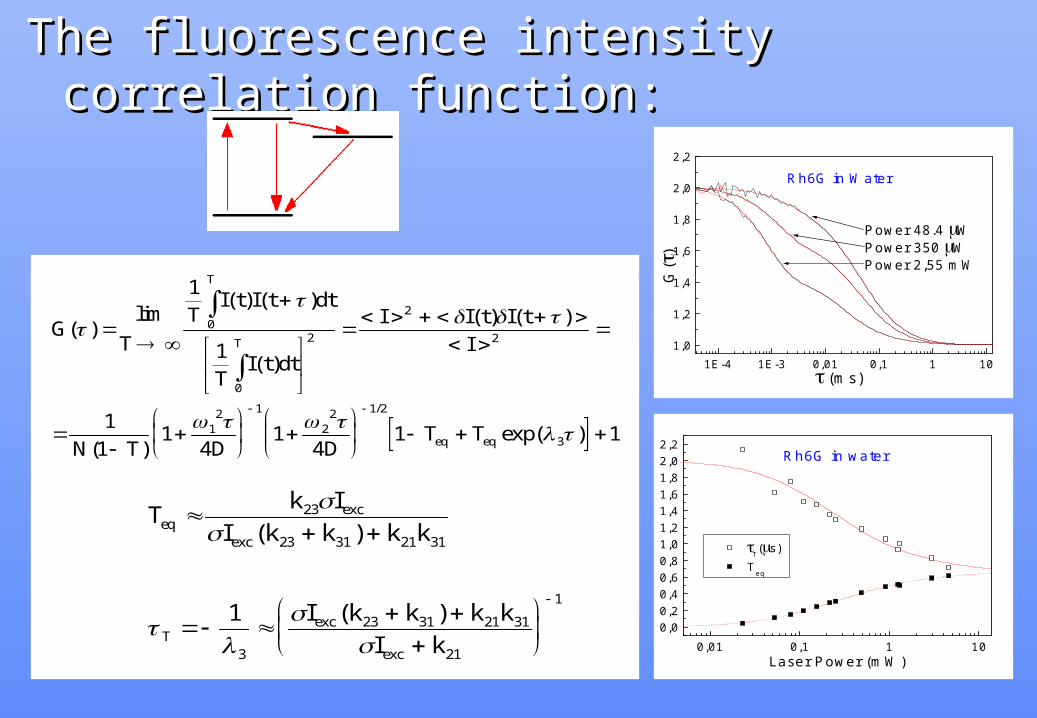
The fluorescence intensity correlation function:The fluorescence intensity correlation function:
GT
TI t I t dt
TI t dt
I I t I t
I
N T D DT T
T
T
eq eq
( )lim
( ) ( )
( )
( ) ( )
( )exp( )
/
1
1
1
11
41
41 1
0
0
2
2
2
12 1
22 1 2
3
1E-4 1E-3 0,01 0,1 1 101,0
1,2
1,4
1,6
1,8
2,0
2,2
Rh6G in Water
Power 2,55 mWPower 350 WPower 48.4 W
G()
(ms)
0,01 0,1 1 100,00,20,40,60,81,01,21,41,61,82,02,2
Rh6G in water
T(s)
Teq
Laser Power (mW)
Tk I
I k k k k
I k k k k
I k
eqexc
exc
Texc
exc
23
23 31 21 31
3
23 31 21 31
21
11
( )
( )
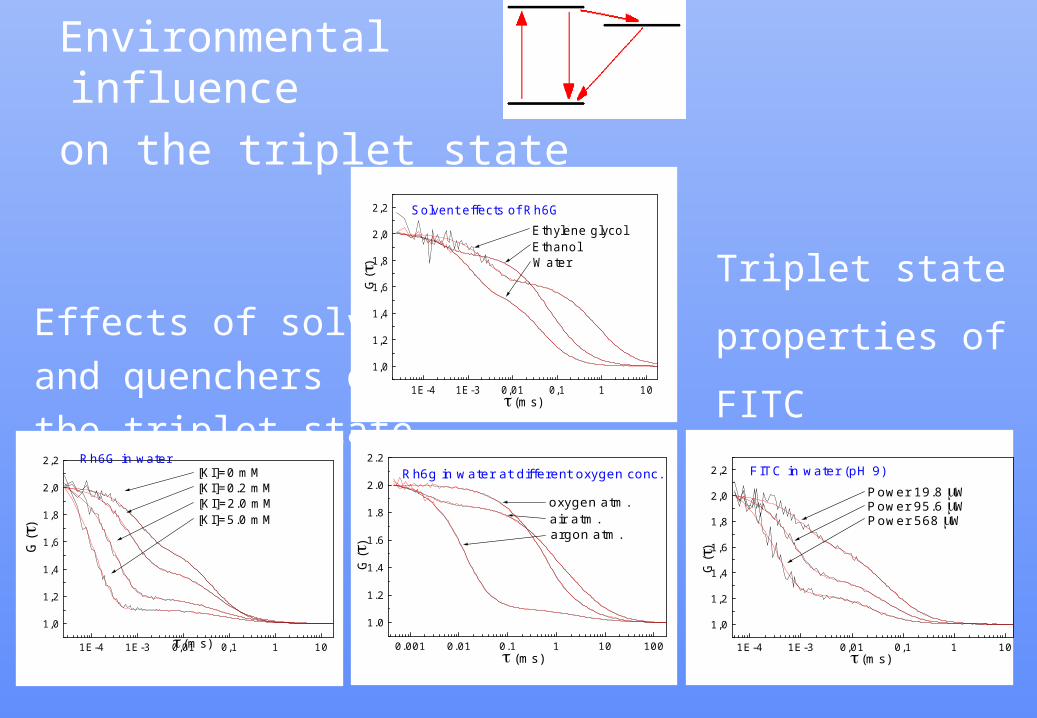
Environmental influence
on the triplet state
Effects of solvents
and quenchers on
the triplet state
1E-4 1E-3 0,01 0,1 1 10
1,0
1,2
1,4
1,6
1,8
2,0
2,2 Rh6G in water
[KI]=5.0 mM[KI]=2.0 mM[KI]=0.2 mM[KI]=0 mM
G()
(ms)
1E-4 1E-3 0,01 0,1 1 10
1,0
1,2
1,4
1,6
1,8
2,0
2,2 Solvent effects of Rh6G
WaterEthanolEthylene glycol
G(
)
(ms)
0.001 0.01 0.1 1 10 100
1.0
1.2
1.4
1.6
1.8
2.0
2.2
argon atm.air atm.oxygen atm.
Rh6g in water at different oxygen conc.
G(
)
(ms)1E-4 1E-3 0,01 0,1 1 10
1,0
1,2
1,4
1,6
1,8
2,0
2,2 FITC in water (pH 9)
Power 568 WPower 95.6 WPower 19.8 W
G()
(ms)
Triplet state
properties of
FITC
Triplet state monitoring:Triplet state monitoring:
• Distortion of FCS curves at high excitation intensities can to a large extent be attributed to triplet state build-up.
• By FCS it is possible to measure intersystem crossing rates, triplet state lifetimes and excitation cross sections.
• The environmental sensitivity of the triplet parameters suggests the use of FCS for micro-environmental probing.
• Knowledge of triplet parameters important for optimization of fluorescence
REF: - Widengren, Rigler and Mets REF: - Widengren, Rigler and Mets J. Fluoresc. J. Fluoresc. 4(3), 255-258, 19944(3), 255-258, 1994
- Widengren, Mets and Rigler - Widengren, Mets and Rigler J. Phys. Chem. J. Phys. Chem. 99, 13368-13379, 199599, 13368-13379, 1995
- Mets, Widengren and Rigler - Mets, Widengren and Rigler Phys. Chem. Phys. Chem. 218, 191-198, 1997218, 191-198, 1997
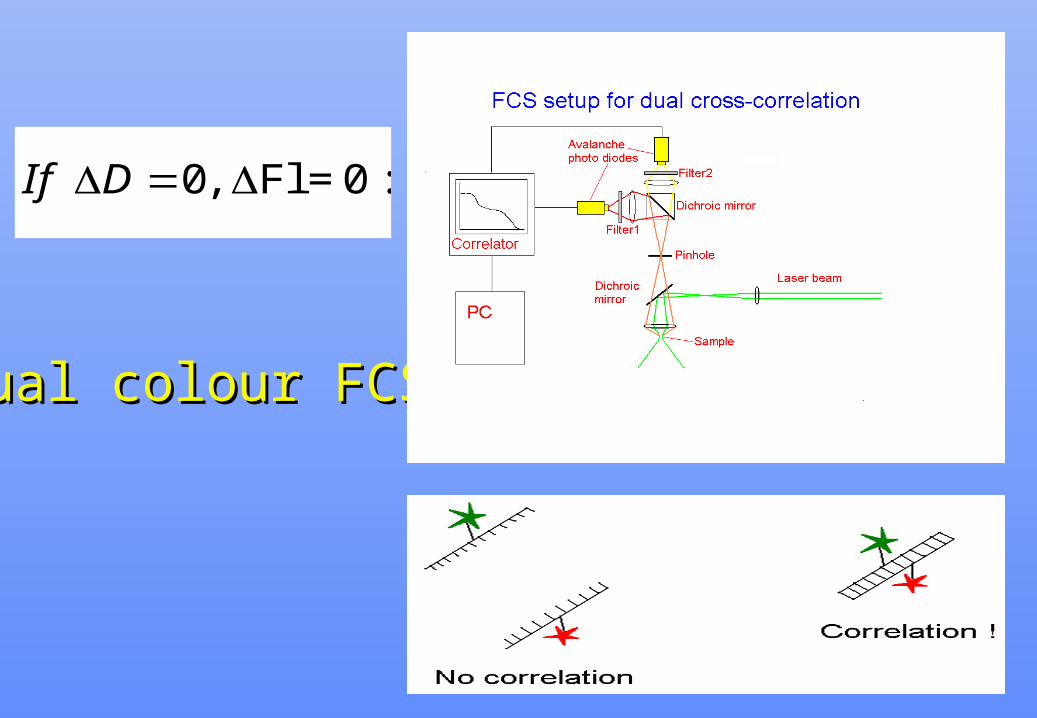
Dual colour FCSDual colour FCS
If D Fl = 0 : 0,
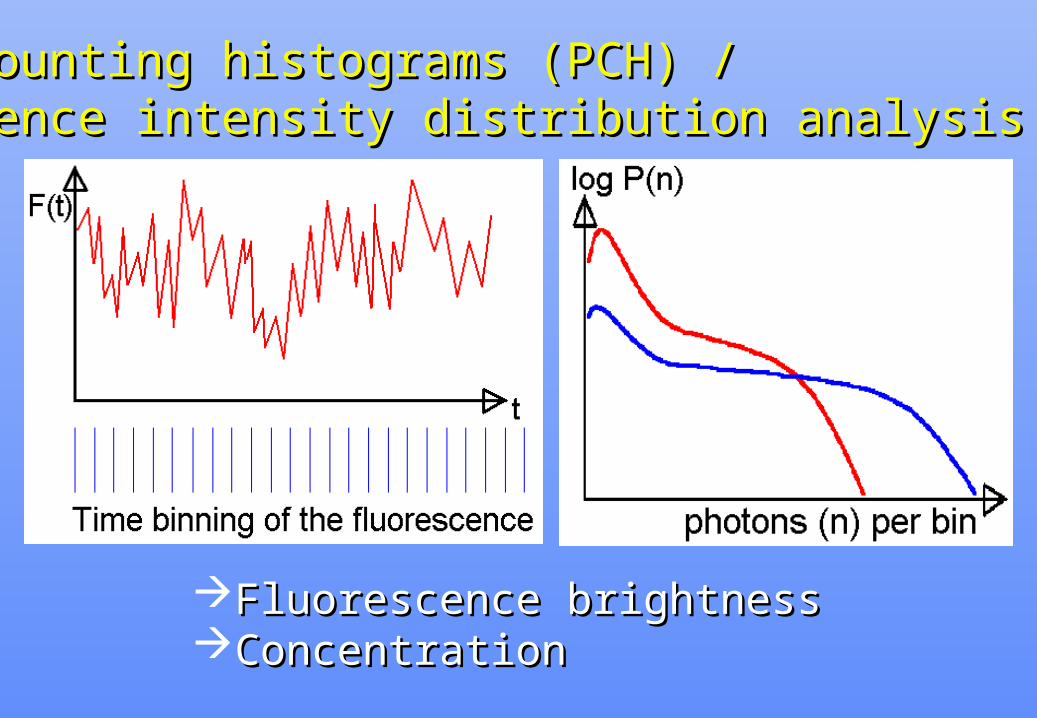
Photon counting histograms (PCH) / Photon counting histograms (PCH) / Fluorescence intensity distribution analysis (FIDA):Fluorescence intensity distribution analysis (FIDA):
Fluorescence brightnessFluorescence brightnessConcentrationConcentration
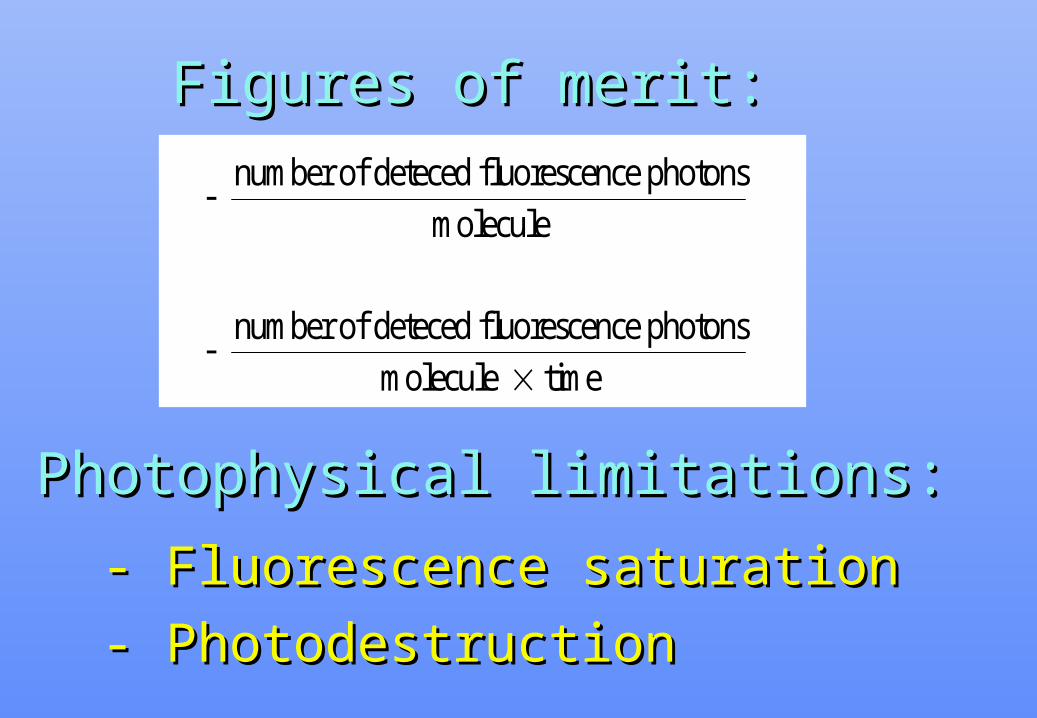
Photophysical limitations:Photophysical limitations:
- Fluorescence saturation- Fluorescence saturation
- Photodestruction- Photodestruction
Figures of meritFigures of merit::
- number of deteced fluorescence photons
molecule
- number of deteced fluorescence photons
molecule time
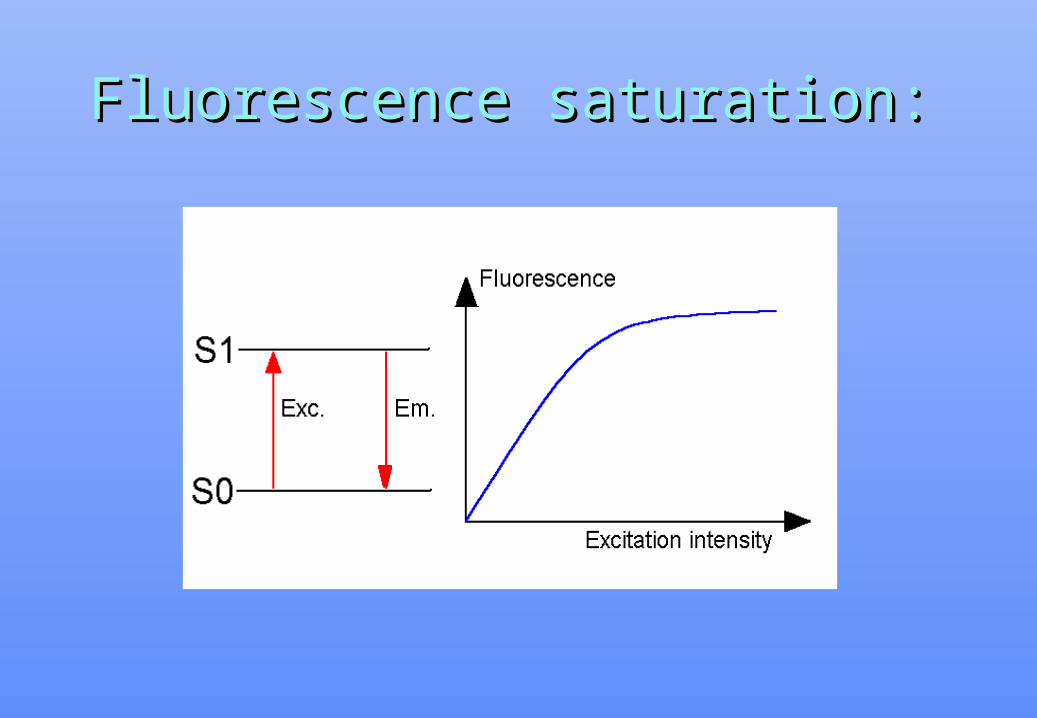
Fluorescence saturation:Fluorescence saturation:
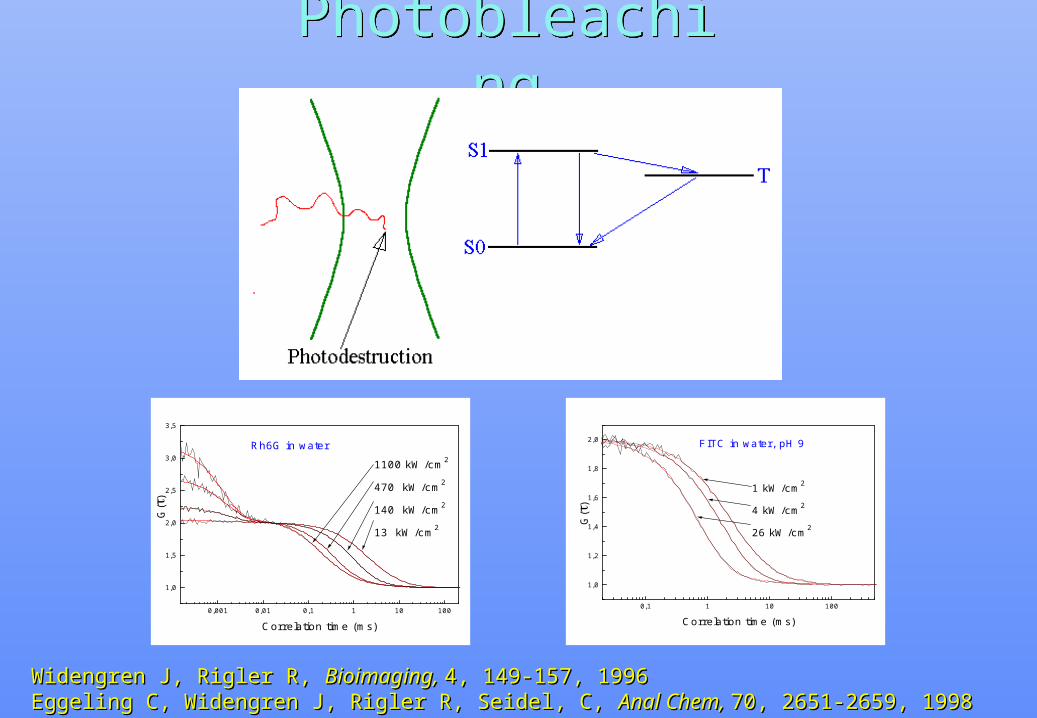
PhotobleachingPhotobleaching
0,1 1 10 100
1,0
1,2
1,4
1,6
1,8
2,0
1 kW/cm2
4 kW/cm2
26 kW/cm2
FITC in water, pH 9
G( )
Correlation time (ms)0,001 0,01 0,1 1 10 100
1,0
1,5
2,0
2,5
3,0
3,5
1100 kW/cm2
470 kW/cm2
140 kW/cm2
13 kW/cm2
Rh6G in water
G( )
Correlation time (ms)
Widengren J, Rigler R, Widengren J, Rigler R, Bioimaging, Bioimaging, 4, 149-157, 19964, 149-157, 1996Eggeling C, Widengren J, Rigler R, Seidel, C, Eggeling C, Widengren J, Rigler R, Seidel, C, Anal Chem, Anal Chem, 70, 2651-2659, 199870, 2651-2659, 1998

Photobleaching effects in a cell surface Photobleaching effects in a cell surface
Rcell
Pexc
Exposure time: t Excitation power: Pexc
Diffusion coeff: D Radius of cell area: Rcell
0 1 2 3 4 5
0,00,10,20,30,40,50,60,70,80,91,0
0,00,10,20,30,40,50,60,70,80,91,0
D=7x10⁻¹⁰
cm2/s
2.5 W5.0 W10 W25 W50 W100 W250 WN
orm
aliz
ed c
once
ntra
tion
Radial distance (m)
Widengren J submitted to Widengren J submitted to Biophys. J.Biophys. J.
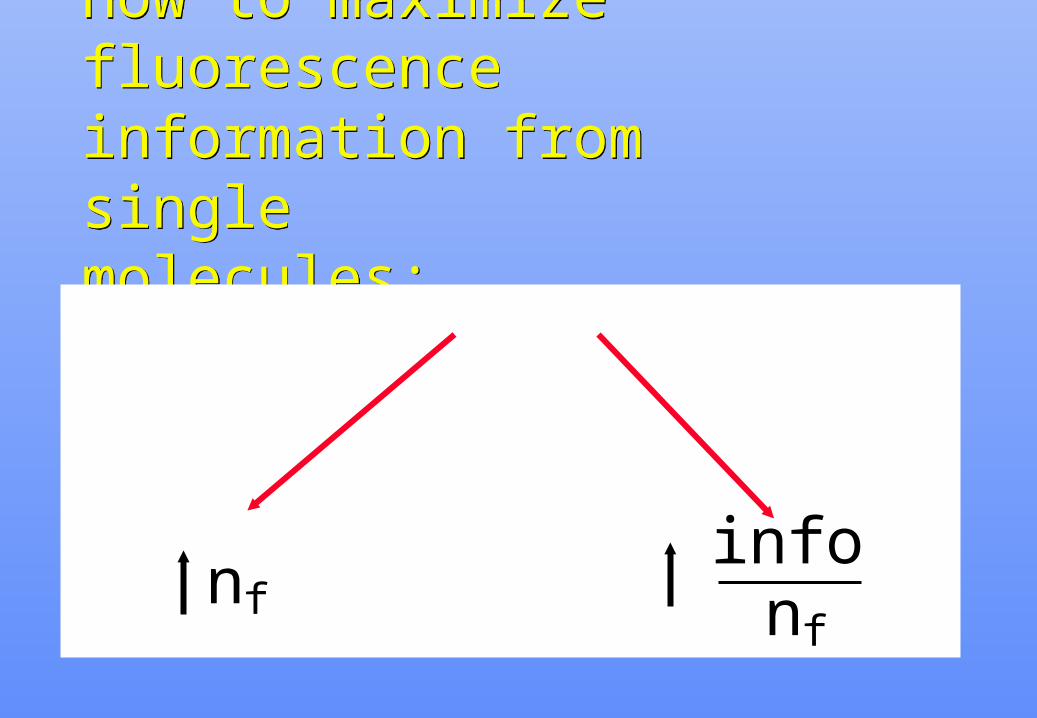
How to maximize fluorescence information from single molecules:
How to maximize fluorescence information from single molecules:
n finfon f

Single-molecule Multi-parameter Fluorescence detection (smMFD)Single-molecule Multi-parameter Fluorescence detection (smMFD)

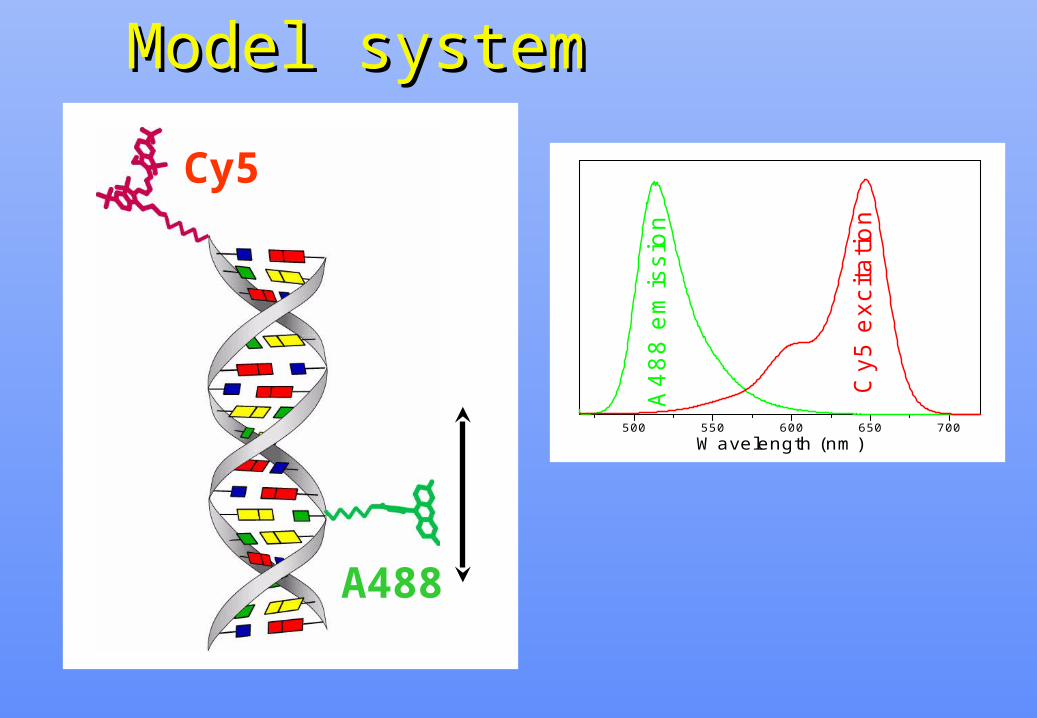
Cy5
A488
Model systemModel system
500 550 600 650 700
Cy5
exc
itatio
n
A4
88
em
issi
on
Wavelength (nm)

Fluorescence resonance energy transfer
kA10kFRET´
kFRET
kD10DIexc
AD
ER
R RDA
06
06 6
R0=8.7910-5 J() FD n-4 21/6 Å
E(FD, FA, rD, rA, FA, FD)
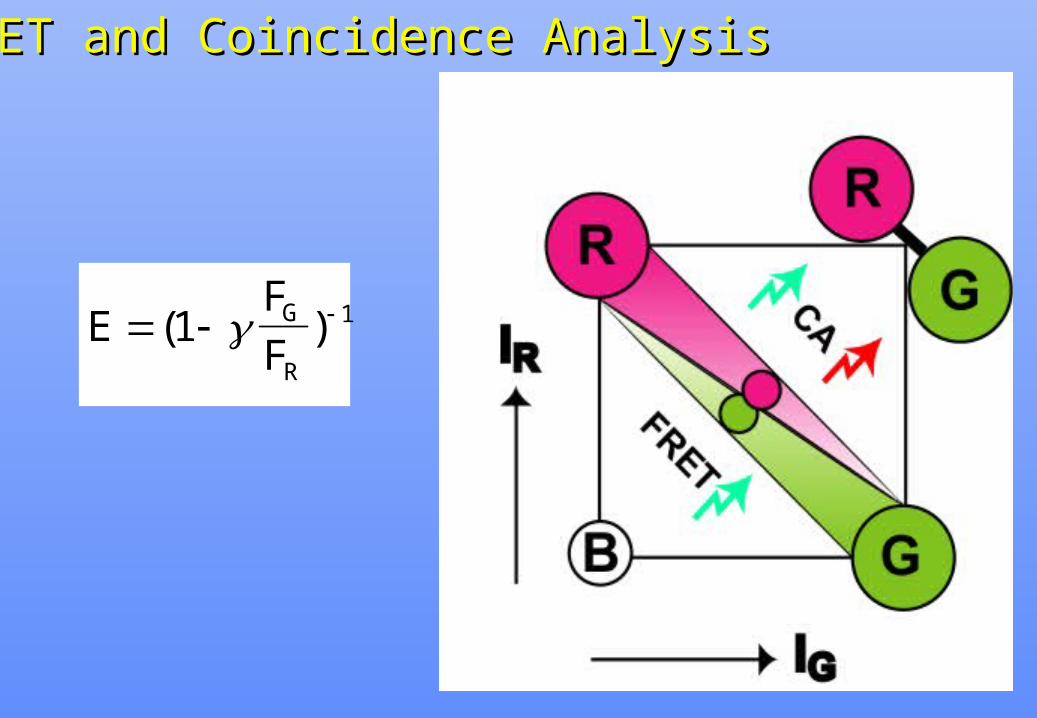
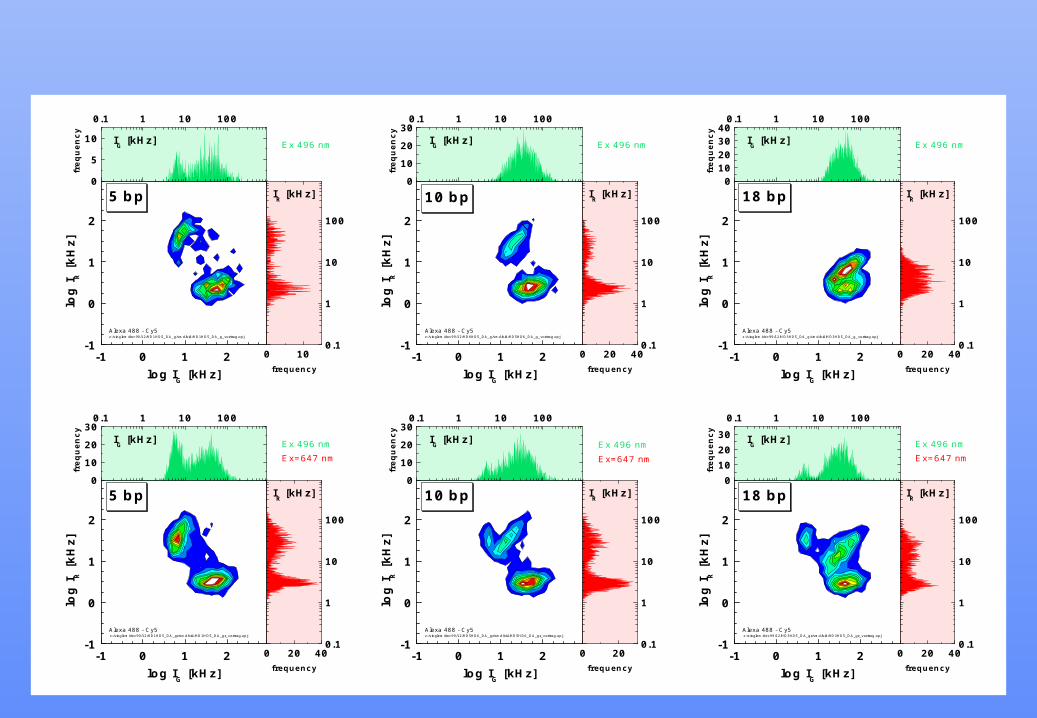
FRET and Coincidence AnalysisFRET and Coincidence Analysis
E (1F
FG
R
) 1
-1 0 1 2-1
0
1
2
Alexa 488 - Cy5z:/singlem/dec99/12/HD1HD5_DA_g/smd/bi4/HD1HD5_DA_g_vortrag.opj
log
I R [
kH
z]
log IG [kHz]
0
5
10
0.1 1 10 100
IG [kHz]
fre
qu
en
cy
0 100.1
1
10
100
Ex 496 nm
5 bp
IR [kHz]
frequency
-1 0 1 2-1
0
1
2
Alexa 488 - Cy5z:/singlem/dec99/12/HD1HD5_DA_gr/smd/bi4/HD1HD5_DA_gr_vortrag.opj
log
I R [
kH
z]
log IG [kHz]
0
10
20
300.1 1 10 100
IG [kHz]
fre
qu
en
cy
0 20 400.1
1
10
100
Ex 496 nmEx=647 nm
5 bp
IR [kHz]
frequency
-1 0 1 2-1
0
1
2
Alexa 488 - Cy5z:/singlem/dec99/12/HD3HD5_DA_g/smd/bi4/HD3HD5_DA_g_vortrag.opj
log
I R [
kH
z]
log IG [kHz]
010203040
0.1 1 10 100
IG [kHz]
fre
qu
en
cy
0 20 400.1
1
10
100
Ex 496 nm
18 bp
IR [kHz]
frequency
-1 0 1 2-1
0
1
2
Alexa 488 - Cy5z:/singlem/dec99/12/HD3HD5_DA_gr/smd/bi4/HD3HD5_DA_gr_vortrag.opj
log
I R [
kH
z]
log IG [kHz]
0102030
0.1 1 10 100
IG [kHz]
fre
qu
en
cy
0 20 400.1
1
10
100
Ex 496 nmEx=647 nm
18 bp
IR [kHz]
frequency
-1 0 1 2-1
0
1
2
Alexa 488 - Cy5z:/singlem/dec99/12/HD6HD5_DA_g/smd/bi4/HD5HD6_DA_g_vortrag.opj
log
I R [
kH
z]log IG [kHz]
0
10
20
300.1 1 10 100
IG [kHz]
fre
qu
en
cy
0 20 400.1
1
10
100
Ex 496 nm
10 bp
IR [kHz]
frequency
-1 0 1 2-1
0
1
2
Alexa 488 - Cy5z:/singlem/dec99/12/HD5HD6_DA_gr/smd/bi4/HD5HD6_DA_gr_vortrag.opj
log
I R [
kH
z]
log IG [kHz]
0
10
20
300.1 1 10 100
IG [kHz]
fre
qu
en
cy
0 200.1
1
10
100
Ex 496 nmEx=647 nm
10 bp
IR [kHz]
frequency
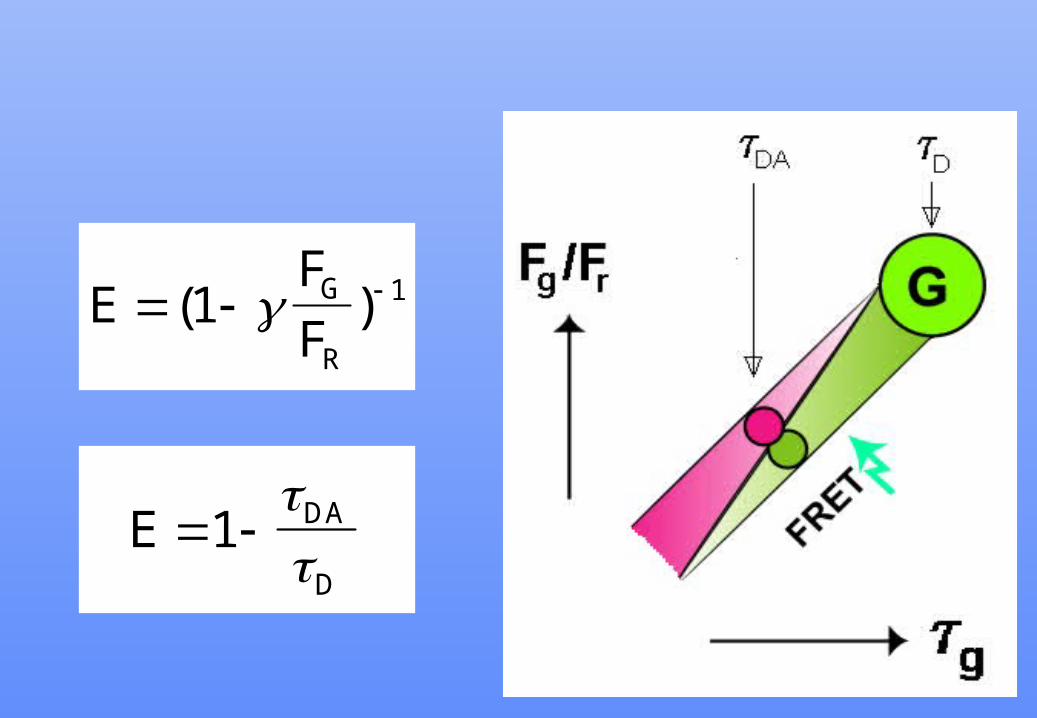
E (1F
FG
R
) 1
E 1 DA
D
0
100
0 2 4 6
g [ns]
freq
uen
cy
0 1500,1
1
10
100
Fg/F
r
frequency0 2 4 6
0,1
1
10
100
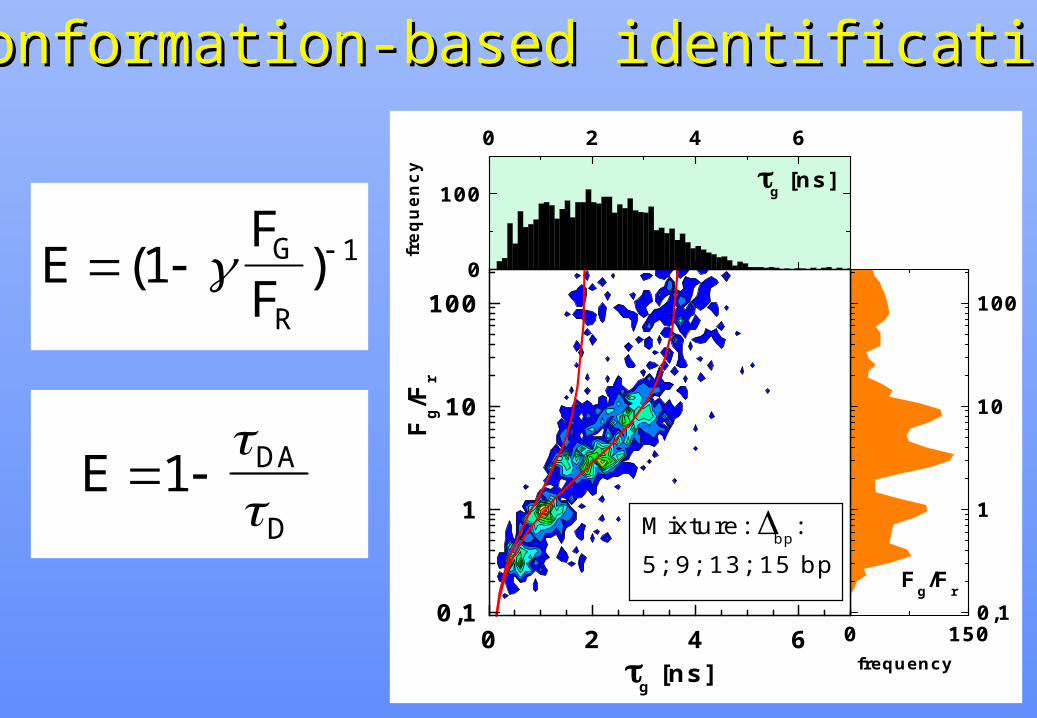
Mixture: bp
:5; 9; 13; 15 bp
Fg/F
r
g [ns]
E (1F
FG
R
) 1
E 1 DA
D
Conformation-based identificationConformation-based identification
:
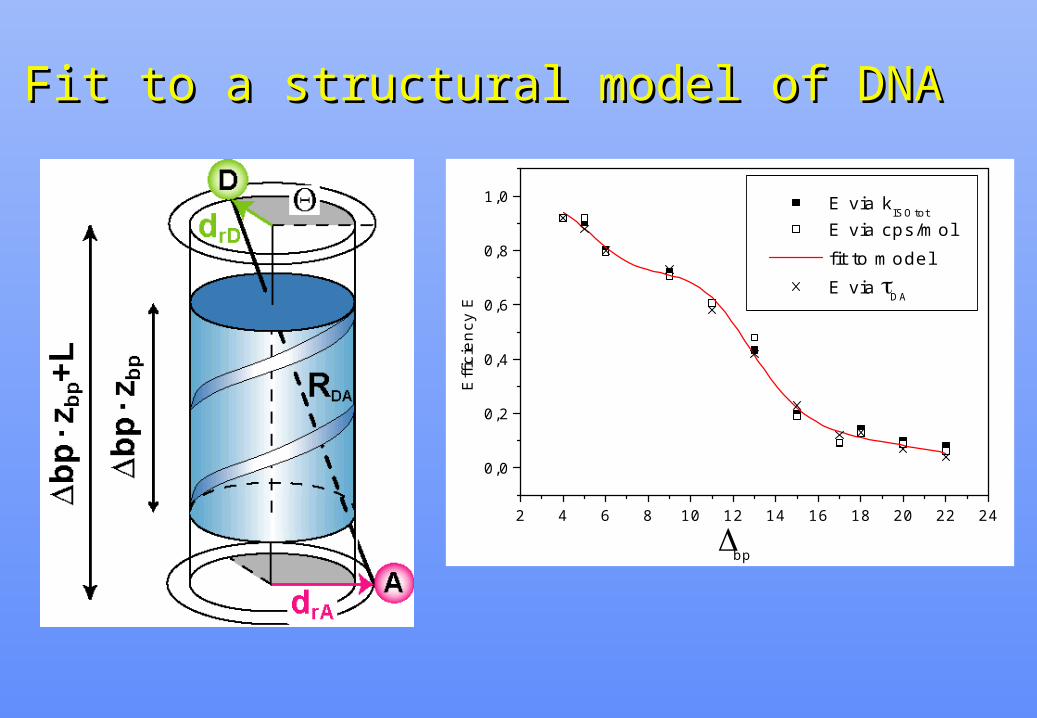
Fit to a structural model of DNAFit to a structural model of DNA
2 4 6 8 10 12 14 16 18 20 22 24
0,0
0,2
0,4
0,6
0,8
1,0
E via kISOtot
E via cps/mol fit to model E via DA
Effi
cien
cy E
bp

FRET studies withFRET studies withsmMFDsmMFD::-High sensitivity, precision andHigh sensitivity, precision and accuracyaccuracy
-resolution better than 1 nmresolution better than 1 nm
- identification based on- identification based on conformationaconformational l propertiesproperties (”conformational fingerprints”)(”conformational fingerprints”)
- range: 10-100 range: 10-100 ÅÅngströmngström
- Detection and selective analysis of subpopulationsDetection and selective analysis of subpopulations
em , F, r, F
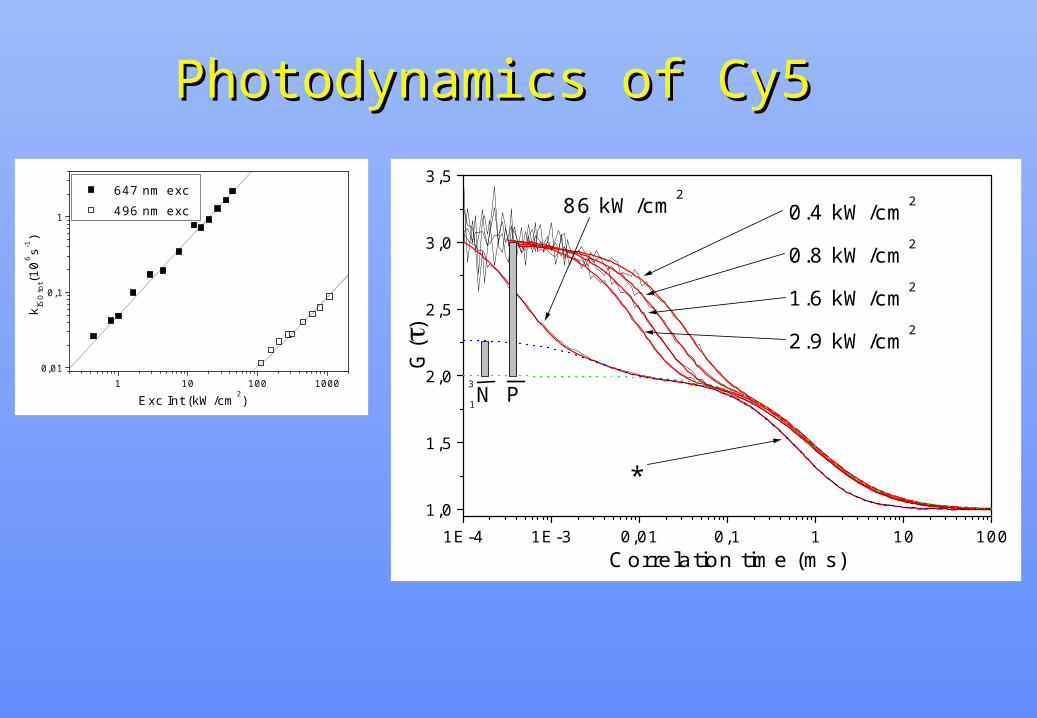
1 10 100 10000,01
0,1
1
647 nm exc 496 nm exc
k ISO
tot(1
06 s-1
)
Exc Int (kW/cm2)
1E-4 1E-3 0,01 0,1 1 10 1001,0
1,5
2,0
2,5
3,0
3,5
86 kW/cm20.4 kW/cm2
0.8 kW/cm2
1.6 kW/cm2
2.9 kW/cm2
1
3
*
PNG
()
Correlation time (ms)
Photodynamics of Cy5Photodynamics of Cy5
N
N P
P
PN
1
3 3
1
11
0
1 1
0
11
k
k
k
k
k k
1
= I = I
k k
k k
P N
T
IS C
N 0 1
N 0 1 P 0 1
P e rp
Pe x c e x c
N p e rp P p e rp
P 0 1 P 1 0
k N 1 0
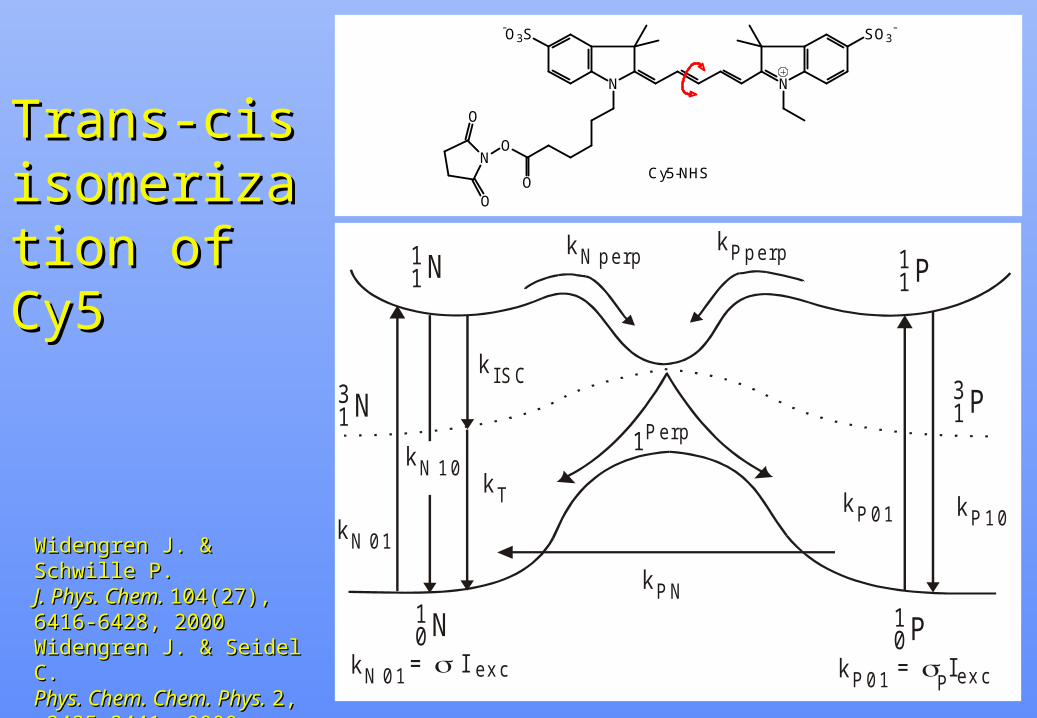
Trans-cis Trans-cis isomerization isomerization of Cy5of Cy5
Widengren J. & Schwille P. Widengren J. & Schwille P. J. Phys. Chem. J. Phys. Chem. 104(27), 6416-104(27), 6416-6428, 20006428, 2000Widengren J. & Seidel C. Widengren J. & Seidel C. Phys. Chem. Chem. Phys. Phys. Chem. Chem. Phys. 2, 2, 3435-3441, 20003435-3441, 2000
N
-O3S SO3
-
N
ON
O
OO
Cy5-NHS
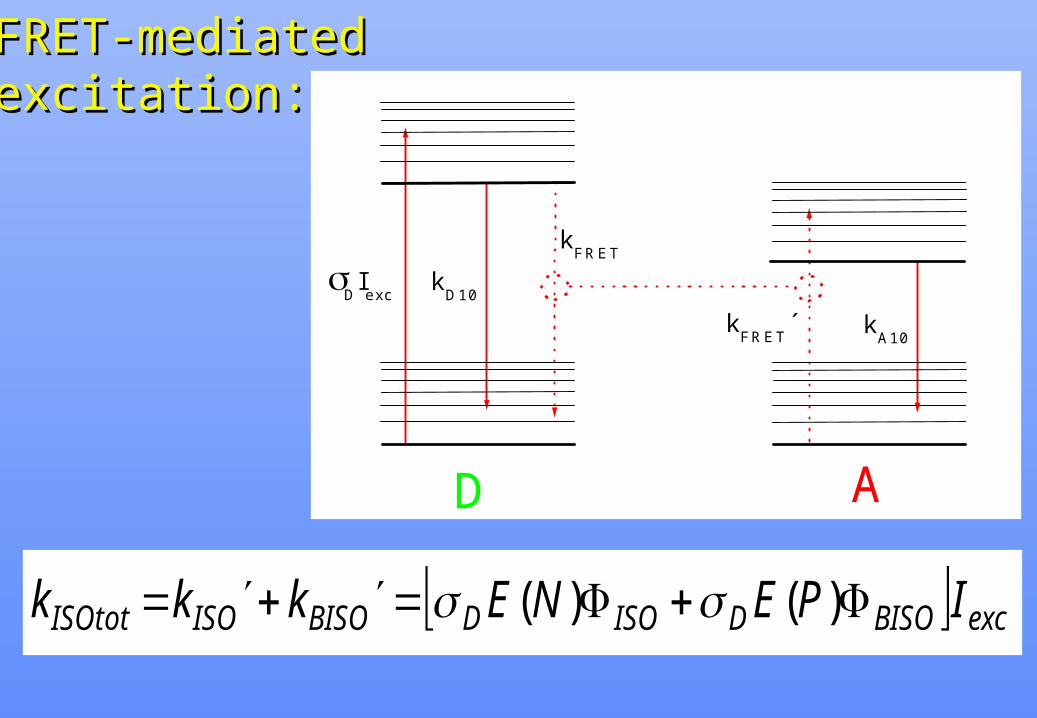
FRET-mediatedFRET-mediatedexcitation:excitation:
kA10kFRET´
kFRET
kD10DIexc
AD
excBISODISODBISOISOISOtot IPENEkkk )()(

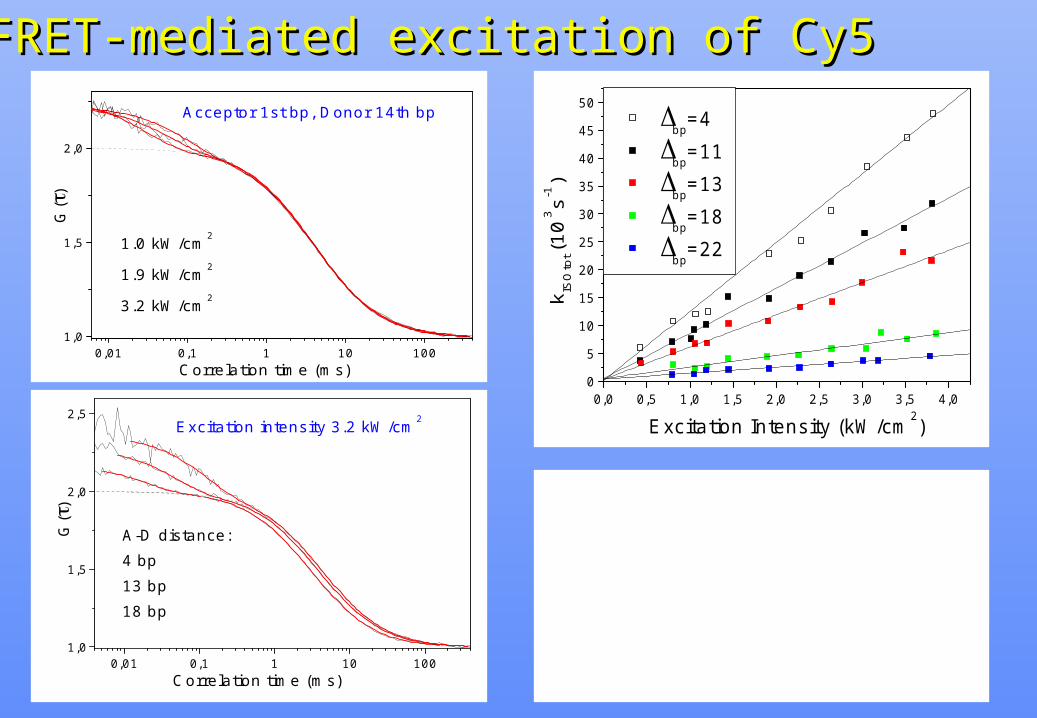
FRET-mediated excitationFRET-mediated excitation of Cy5 of Cy5
0,01 0,1 1 10 1001,0
1,5
2,0
1.0 kW/cm2
1.9 kW/cm2
3.2 kW/cm2
Acceptor 1st bp, Donor 14th bp
G()
Correlation time (ms)
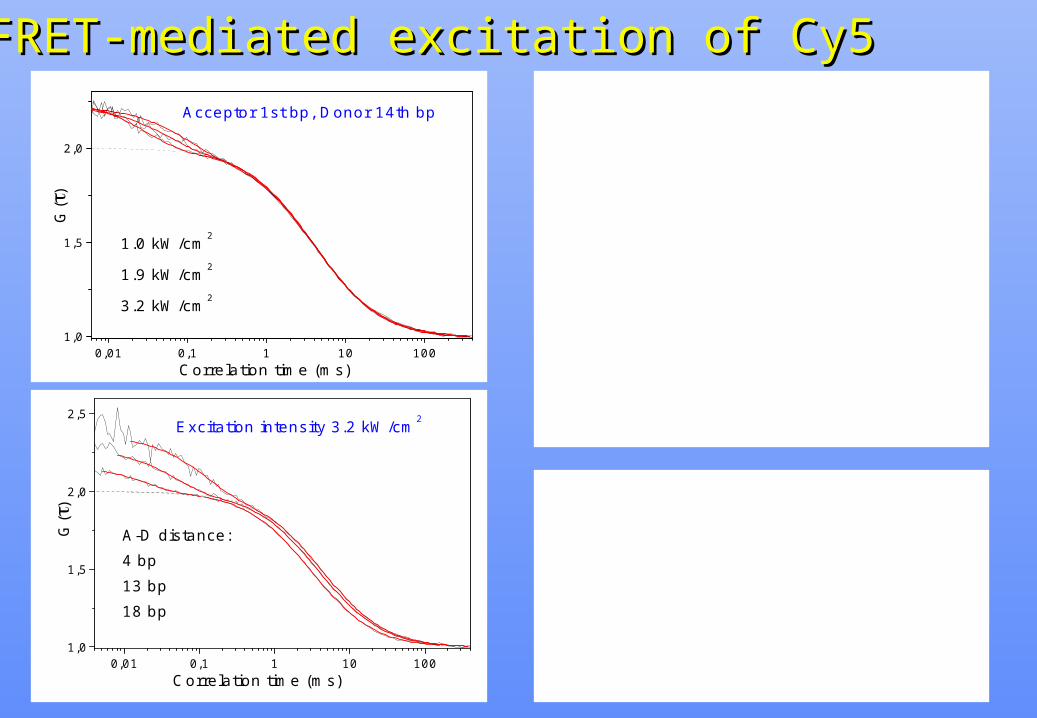
FRET-mediated excitationFRET-mediated excitation of Cy5 of Cy5
0,01 0,1 1 10 1001,0
1,5
2,0
2,5
A-D distance:4 bp13 bp18 bp
Excitation intensity 3.2 kW/cm2
G()
Correlation time (ms)
0,01 0,1 1 10 1001,0
1,5
2,0
1.0 kW/cm2
1.9 kW/cm2
3.2 kW/cm2
Acceptor 1st bp, Donor 14th bp
G()
Correlation time (ms)
0,0 0,5 1,0 1,5 2,0 2,5 3,0 3,5 4,00
5
10
15
20
25
30
35
40
45
50
bp
=4
bp=11
bp
=13
bp=18
bp
=22
k ISO
tot(
103 s-1
)
Excitation Intensity (kW/cm2)
k FRETk direct
E N E PISOtot
ISOtot
( )( )
( ) ( ) 2
2 4 6 8 10 12 14 16 18 20 22 24
0,0
0,2
0,4
0,6
0,8
1,0
E via kISOtot
E via cps/mol fit to model E via DA
Eff
icie
ncy
E
bp
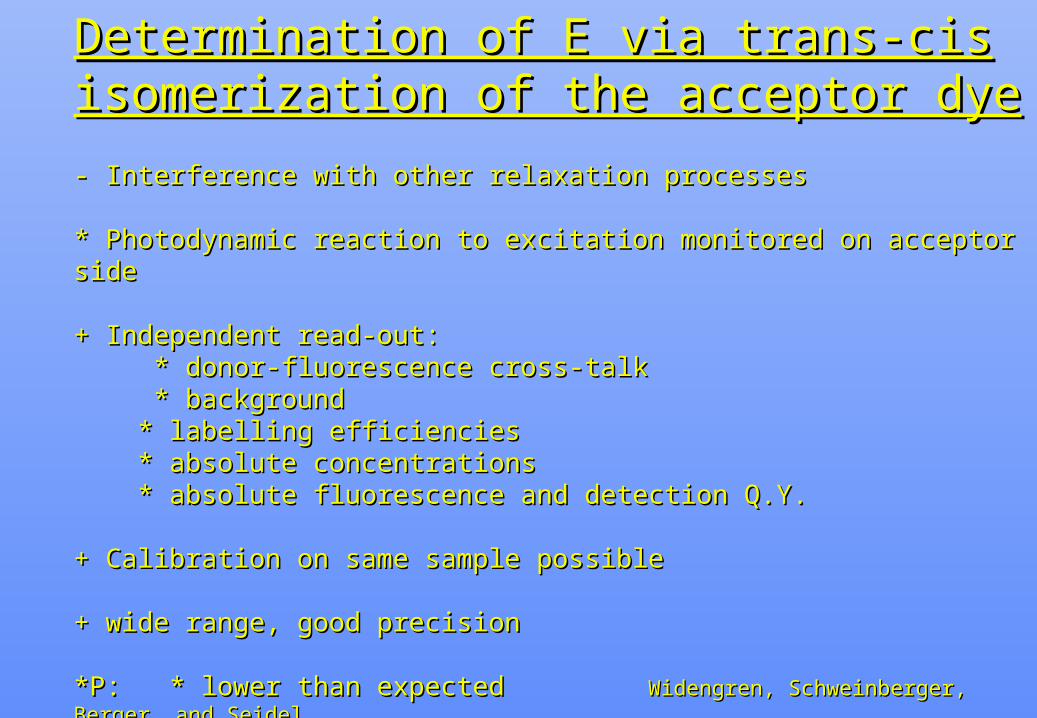
Determination of E via trans-cis isomerization of Determination of E via trans-cis isomerization of the acceptor dyethe acceptor dye
- Interference with other relaxation processes- Interference with other relaxation processes
* Photodynamic reaction to excitation monitored on acceptor side* Photodynamic reaction to excitation monitored on acceptor side
+ Independent read-out:+ Independent read-out: * donor-fluorescence cross-talk* donor-fluorescence cross-talk * background* background * labelling efficiencies* labelling efficiencies * absolute concentrations* absolute concentrations * absolute fluorescence and detection Q.Y.* absolute fluorescence and detection Q.Y.
+ Calibration on same sample possible+ Calibration on same sample possible
+ wide range, good precision+ wide range, good precision
**P:P: * lower than expected* lower than expected Widengren, Schweinberger, Berger, and SeidelWidengren, Schweinberger, Berger, and Seidel
* non-constant* non-constant J. Phys. Chem. AJ. Phys. Chem. A 105, 6851-6866, 2001 105, 6851-6866, 2001

0
100
0 2 4 6
g [ns]
freq
uen
cy
0 1500,1
1
10
100
Fg/F
r
frequency0 2 4 6
0,1
1
10
100
Mixture: bp
:5; 9; 13; 15 bp
Fg/F
r
g [ns]1E-4 1E-3 0,01 0,1 1 10
0
1
2
3
4
5
bp=18 bpbp=15 bpbp=13 bp
G(
)Correlation time (ms)
Selective FCS:Selective FCS:

Traditional fluorescence Traditional fluorescence parametersparameters
four dimensions:- excitation and fluorescence spectra: E, F
- quantum yield: F
- lifetime: - anisotropy: r
FluctuationFluctuationparametersparameters
Acknowledgements:Acknowledgements:
Dept. Med. Biophysics, MBB, KarolinskaDept. Med. Biophysics, MBB, KarolinskaInsitutet, StockholmInsitutet, Stockholm::Ylo Mets, Per Thyberg, Petra Schwille, Aladdin Pramanik, Rudolf RiglerMPI f. Biophys.MPI f. Biophys. Chem. Göttingen, Germany:Chem. Göttingen, Germany:Enno Schweinberger, Christian Eggeling, Jörg Schaffer, Sylvia Berger, Matthew Antonik, Claus Seidel, Martin Margittai, Reinhard Jahn
Financial Financial Support:Support:- Swedish Foundation for Cooperation in Higher Education and Research (STINT)- BMBF-Biofuture Program- VW-Stiftung- The Swedish Research Council (Medicine)- Magnus Bergwall Foundation- The Swedish Society of Medicine- Karolinska Intitutet Research Funds
Prospects for the future:Prospects for the future:
-Basic research: Reveal structures and dynamics of molecules Basic research: Reveal structures and dynamics of molecules beyond ensemble averagingbeyond ensemble averaging
-Ultrasensitve diagnostics: Detection and identification of sparse Ultrasensitve diagnostics: Detection and identification of sparse amounts of disease-specific molecules on/inside cells or in amounts of disease-specific molecules on/inside cells or in body fluids.body fluids.
-Ultrasensitive characterization of disease specific molecules or Ultrasensitive characterization of disease specific molecules or target molecules for drug therapiestarget molecules for drug therapies
-High-throughput-screening (small sample volumes, low High-throughput-screening (small sample volumes, low concentrations, fast read-out)concentrations, fast read-out)

The Experimental Biomolecular Physics groupThe Experimental Biomolecular Physics group
Senior researchers / post docs:Senior researchers / post docs:
Anders HedqvistAnders HedqvistPer ThybergPer Thybergvacantvacant
PhD students:PhD students:
Per-Åke LöfdahlPer-Åke Löfdahlvacantvacantvacantvacant