detection of a weak meddy-like anomaly from high ... · detection of a weak meddy-like anomaly from...
TRANSCRIPT
Detection of a weak meddy-like anomaly from high-resolution satellite SST maps
MIKHAIL EMELIANOV 1, MARIONA CLARET 1, EUGENIO FRAILE-NUEZ 2, MARIA PASTOR 1, IRENE LAIZ 3, JOAQUÍN SALVADOR 1, JOSEP L. PELEGRÍ 1
and ANTONIO TURIEL 1
1 Departament d’Oceanografia Física, Institut de Ciencies del Mar, CSIC, Passeig Marítim de la Barceloneta 37-49, 08003 Barcelona, Spain. E-mail: [email protected]
2 Instituto Español de Oceanografía, Centro Oceanográfico de Canarias, Santa Cruz de Tenerife, Spain.3 Instituto de Ciencias Marinas de Andalucía, CSIC, Campus Universitario Rio San Pedro s/n, Puerto Real,
11510 Cadiz, Spain.
SUMMARY: Despite the considerable impact of meddies on climate through the long-distance transport of properties, a consistent observation of meddy generation and propagation in the ocean is rather elusive. Meddies propagate at about 1000 m below the ocean surface, so satellite sensors are not able to detect them directly and finding them in the open ocean is more fortuitous than intentional. However, a consistent census of meddies and their paths is required in order to gain knowledge about their role in transporting properties such as heat and salt. In this paper we propose a new methodology for processing high-resolution sea surface temperature maps in order to detect meddy-like anomalies in the open ocean on a near-real-time basis. We present an example of detection, involving an atypical meddy-like anomaly that was confirmed as such by in situ measurements.
Keywords: meddy, satellite image, vorticity, thermohaline anomaly, observation in situ.
RESUMEN: Detección De una Débil anomalía tipo meDDy a partir De mapas sst De alta resolución. – A pesar de su impacto considerable al clima por el transporte de propiedades a larga distancia, no disponemos de una observación consistente de la generación de meddies y de su propagación en el océano. Los meddies se propagan a aproximadamente mil metros por debajo de la superficie del océano, por lo que los sensores de satélite no son capaces de descubrirlos directamente, y su detección en el océano abierto es más fortuita que intencionada. Sin embargo, necesitamos tener un censo consistente de los meddies y de sus trayectorias para entender el papel que desempeñan en el transporte de propiedades físicas, como el calor y la salinidad. En este artículo proponemos una nueva metodología para procesar imágenes de satélite de alta resolución de Temperatura de Superficie de Mar (SST) con el fin de detectar anomalías de tipo meddy en océano abierto, en el tiempo casi presente. Presentamos un ejemplo de dicha determinación, correspondiente a una anomalía atípica de tipo meddy, que fue confirmada con medidas in situ.
Palabras clave: meddy, imagen de satélite, vorticidad, anomalía termohalina, observación in situ.
Scientia Marina 76S1September 2012, 229-234, Barcelona (Spain)
ISSN: 0214-8358doi: 10.3989/scimar.03619.19I
ADVANCES IN SPANISH PHYSICALOCEANOGRAPHYM. Espino, J. Font, J.L. Pelegrí, A. Sánchez-Arcilla (eds.)
INTRODUCTION
The intrathermocline eddies of Mediterranean origin (meddies) were discovered by McDowell and Rossby (1978) and have been the subject of intense research. Several cruises have been carried out in order to track individual meddies, with considerable success. Armi et al. (1989) obtained a two-year series of observations for one individual meddy and Ambar et al. (2008) tracked
several meddies during short periods of time. However, cruises dedicated to detecting and tracking meddies are very expensive because of their elusiveness, especially as they move from their generation place. The only way to track a meddy is to follow it from its generation. Meddy formation takes place in a relatively small area of the continental slope west of the Strait of Gibraltar and has been investigated in depth (Ambar et al. 2008 and references therein). Shapiro and Meshchanov (1991)
230 • M. EMELIANOV et al.
SCI. MAR., 76S1, September 2012, 229-234. ISSN 0214-8358 doi: 10.3989/scimar.03619.19I
and Richardson and Tychensky (1998) characterized the tracks of meddies in the Atlantic statistically on the basis of a variety of measurements. Some specific dy-namic effects, such as the collision of a meddy with a sea mountain, have also been investigated (Shapiro et al. 1995, Bashmachnikov et al. 2009). Additional in-sight into the processes governing the lives of meddies has been gained by means of laboratory and numerical modelling of the collapse of mixed patches in a stratified fluid (Zatsepin et al. 1998, Fedorov 1986).
Locating and tracking meddies far from their place of generation, without prior in situ localization, is a hard task. Altimetry data have been employed to this end, in an attempt to detect sea-level anomalies generated by deep thermohaline anomalies (DTA) such as meddies (Shapiro et al. 1995). However, detecting such weak sea-level anomalies is difficult because of the rather poor temporal sampling (about ten days), low spatial resolution (about 30 km) and relatively low signal-to-noise ratio of altimetry maps. Yan et al. (2006) and Serra et al. (2010) argued that altimetry data needed to be combined with SST and some other data in order to detect the presence of meddies, although individual meddies cannot be tracked with these methods.
In this work we present the detection of a DTA through a singularity analysis technique applied to high-resolution satellite sea surface temperature (SST) maps. The main difference between our study and previous ones is that we
first identified the DTA from SST satellite data and then surveyed it, instead of using SST data to confirm the pres-ence of meddies identified using in situ measurements. Singularity analysis in the framework of microcanonical multifractal formalism (Turiel et al. 2008b) has proven to be a valuable tool for identifying streamlines and mesos-cale features from satellite SST maps (Turiel et al. 2005, Isern-Fontanet et al. 2007, Turiel et al. 2008a). The basic idea behind the application of this method is that through the straining created by sheared currents, any scalar ad-vected by the flow presents small-amplitude but relatively sharp transitions. These transitions may be characterized by an appropriate technique (singularity analysis), despite their very small amplitude, because of their large spatial coherence. For the method to work, the acquisition de-vice must be sufficiently sensitive to record gradients of very small amplitude; furthermore, vertical movements should be negligible, which is not the case, for instance, in upwelling regions. More details on the technique are explained in the following section.
MATERIALS AND METHODS
High-resolution SST maps
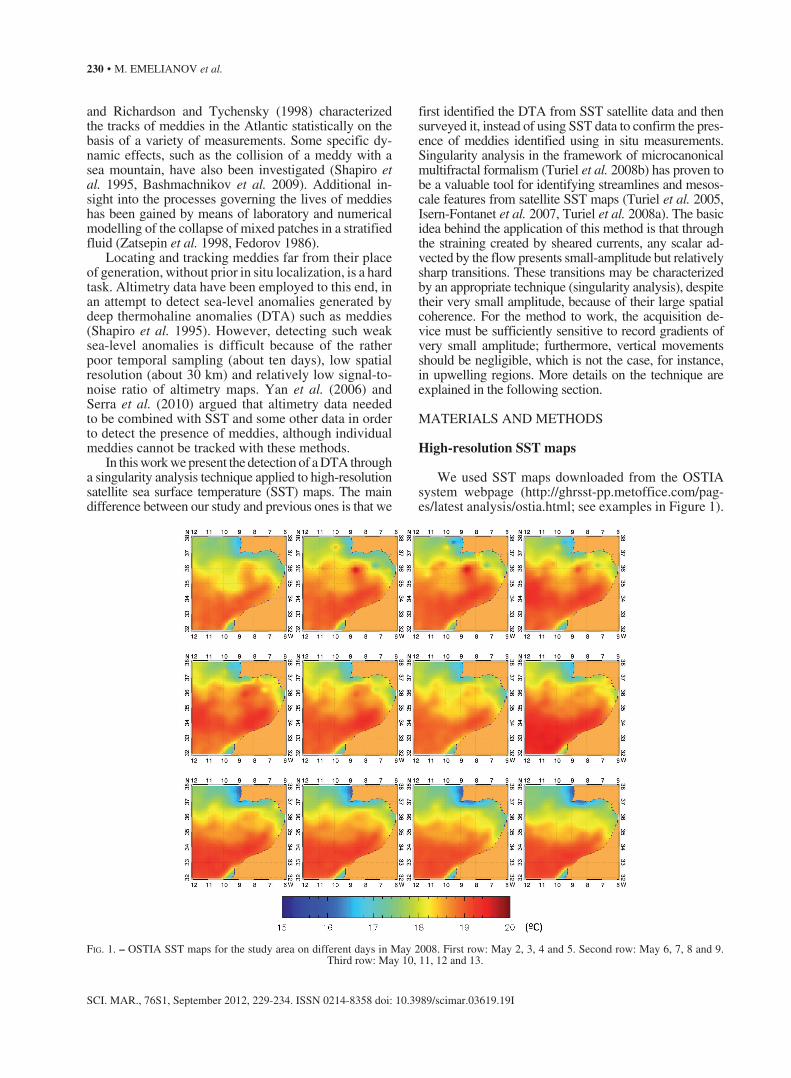
We used SST maps downloaded from the OSTIA system webpage (http://ghrsst-pp.metoffice.com/pag-es/latest analysis/ostia.html; see examples in Figure 1).
Fig. 1. – OSTIA SST maps for the study area on different days in May 2008. First row: May 2, 3, 4 and 5. Second row: May 6, 7, 8 and 9. Third row: May 10, 11, 12 and 13.
MEDDY-LIKE ANOMALY AS DETECTED FROM SST MAPS • 231
SCI. MAR., 76S1, September 2012, 229-234. ISSN 0214-8358 doi: 10.3989/scimar.03619.19I
The OSTIA system is led by the British MetOffice as a part of the MEDSPIRATION initiative (the European leg of the GHRSST project) to produce high-resolution SST maps. The OSTIA system combines satellite data with in situ observations to estimate SST. The analysis is performed using a variant of the optimal interpola-tion described by Bell et al. (2000). Daily maps with a nominal resolution of 1/20º are available (Stark et al. 2007), although we have reduced this resolution to 1/10º by simple pixel averaging in order to diminish possible artifacts caused by the interpolation scheme.
In situ measurements
The oceanographic cruise was carried out between 20 and 28 May 2008 on board the R/V Garcia del Cid (CSIC) in the area located between 34°30´ and 36°30´N and 8°30´ and 9°30´W (Fig. 3a). The water column measurements were taken with an SBE 911+ Conductivity-Temperature-Depth (CTD) system on a carousel SBE 33 system equipped with 12 Niskin bot-tles of 12-L capacity and a 300-kHz RDI Workhorse Lowered Acoustic Doppler Profiler (LADCP). The scattering of all CTD casts obtained in the area (see Table 1) is presented in Figure 3b.
The CTD were processed using the SBE Data Processing software (v. 7.17a). LADCP data were processed with the IFM-GEOMAR/LDEO Matlab LADCP Processing System (v. 10). Ocean Data View software was used to visualize the data in near-real time. The cruise ended prematurely due to very bad weather conditions, so additional measurements on the west side of the DTA could not be carried out.
In order to define the background thermohaline field, the vertical temperature and salinity profiles were obtained from the beginning of the cruise on the way to the study area. Within the study area a distance of 5 nm was maintained between consecutive CTD casts, and the location of each subsequent cast was defined by analysing the previous CTD cast. The Rossby radius of deformation at this latitude is about 30 km (Chelton et al. 1998). Taking into account that the typical radius of a meddy is about 100 km, the distance between CTD casts of 10 km (5 nm) was suitable for the size of the phenomenon studied and the sampling strategy.
Singularity analysis
The singularity exponent is a measure of the local regularity or irregularity of a function (in our case, SST) at a given point, disregarding the amplitude of the local gradients. Singularity exponents are computed by means of wavelet projections of the temperature Ө at different scales r, according to the following expression
T x r dx x
r
x x
r∇∇ ( , ) ' ( ')
1 '2∫θ θ[ ] = Ψ
−Ψ ( ) (1)
where the function Y is the wavelet on which the signal is projected. At a given point x the associated singu-
larity exponent h(x) is obtained using the following expression (Turiel et al. 2008b):
T x r x r o r( , ) ( ) h x h x( ) ( )θ α ( )[ ] = +Ψ ∇ (2)
The singularity exponent h(x) is a dimensionless measurement (no units) of the sharpness or smooth-ness of local changes around the point x, disregarding the size of these changes, which are controlled by the factor α(x). It has been shown that singularity fronts co-lineate well with the streamlines of the underlying flow (Turiel et al. 2005, Isern-Fontanet et al. 2007, Turiel et al. 2008a) and are a powerful tool for quality control of remote sensing maps, as demonstrated in the context of SMOS mission (Font et al., 2012).
To determine the singularity exponents we used as the wavelet an optimized numerical implementation of the Lagrange wavelet, as in Turiel et al. (2008b, b). The exponents h(x; t) are obtained by applying Equation (2) at different resolution scales r. For a set of scales r1, r2,...,rm a linear regression of logTY[⎜∇q⎜]xr vs log r is performed at each point x in the image; the slope of this regression being the singularity exponent h(x). For the application shown in this paper we used m=7 different scales which are uniformly sampled in a logarithmic axis, log ri+1 – log ri = constant. We fixed the constant so that r1=1 pixel and rm=0.1 × image size.
Criterion for identifying thermohaline extremes
Although the Mediterranean Water (MW) exiting the Strait of Gibraltar and moving at a depth of 1000-1200 m in the Atlantic progressively looses heat and salt (see references in Emelianov and Fedorov 1985), it remains saltier and warmer than surrounding waters. Therefore, the degree of transformation of thermoha-line extrema can be used to follow the DTA (Emeli-anov et al. 2006), as we did during the oceanographic
table 1. – CTD/LADCP dates and positions
Cast# month/date/year hh:mm (GMT) Lon (°W) Lat (°N)
1 5/20/2008 12:26 6.825 36.0262 5/20/2008 16:06 7.063 35.7973 5/20/2008 19:36 7.324 35.5594 5/20/2008 23:27 7.615 35.2855 5/21/2008 03:31 7.909 35.0166 5/21/2008 08:08 8.252 34.6997 5/21/2008 13:01 8.639 34.3488 5/21/2008 19:29 9.000 34.0029 5/21/2008 23:28 8.999 34.33410 5/22/2008 03:42 9.003 34.66811 5/22/2008 07:32 9.002 35.00112 5/22/2008 10:56 8.826 34.83613 5/22/2008 15:16 8.781 34.68214 5/22/2008 18:16 8.586 34.67415 5/22/2008 21:14 8.376 34.68216 5/23/2008 00:37 8.504 34.83117 5/23/2008 04:04 8.666 35.00218 5/23/2008 07:57 8.333 35.00119 5/23/2008 12:19 8.233 34.84020 5/23/2008 21:25 9.158 34.33421 5/24/2008 01:43 9.172 34.664

232 • M. EMELIANOV et al.
SCI. MAR., 76S1, September 2012, 229-234. ISSN 0214-8358 doi: 10.3989/scimar.03619.19I
survey. Each down cast T,S profile was processed during the up cast carried out in order to actualize the maps and cross-sections of the spatial distribution of T,S characteristics of MW. Thus, the location of the following CTD point to be sampled was defined before the current CTD cast had finished.
RESULTS
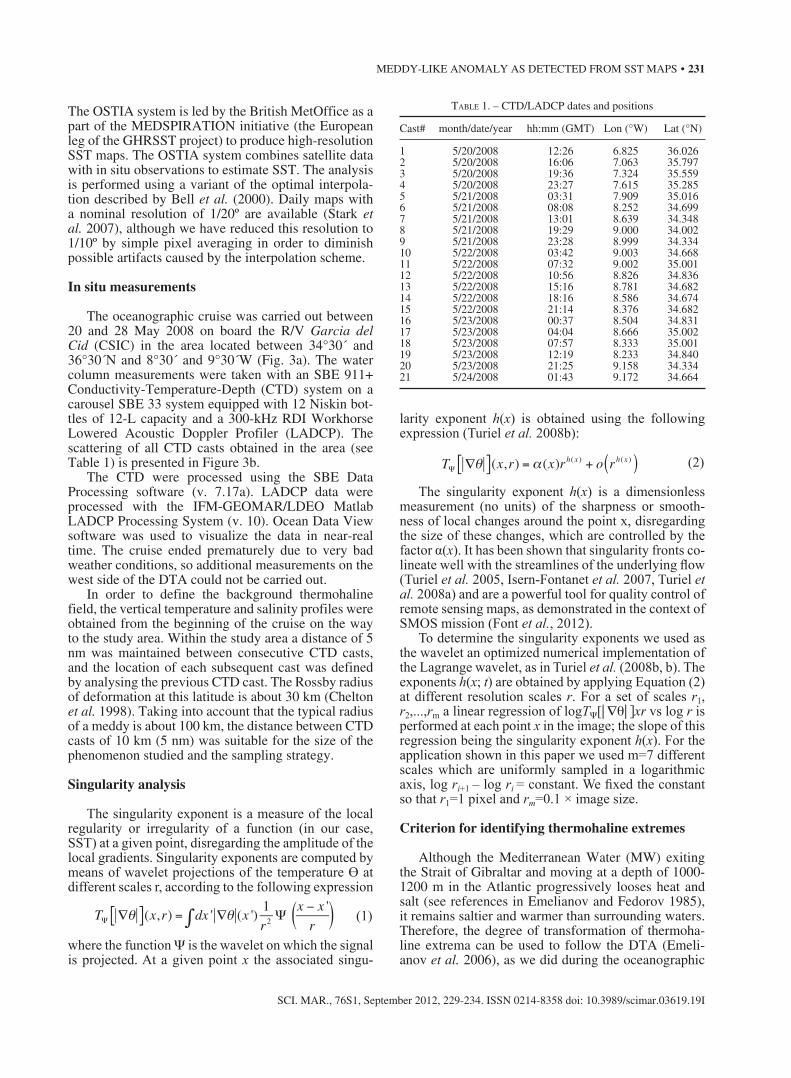
A short oceanographic cruise was planned for May 2008 in the Gulf of Cadiz area to detect and character-ize the structure of a meddy. Our plan was to identify a plausible location for the meddy using novel techniques for image analysis on new SST products produced by the OSTIA project (see Methods). The image analysis technique was applied to the new OSTIA SST prod-ucts. The images available during the week previous to the cruise are shown in Figure 1, and the correspond-ing singularity exponent maps are shown in Figure 2. It should be noted that we are trying to identify a subtle structure: as discussed in Yan et al. (2006), due to the deformation of the isopycnal surfaces induced by the presence of the meddy, there is a small current associ-ated with meddies at surface level (with a typical sur-
face deformation of 6 cm, see Stammer et al. (1991)), which is superimposed on the much stronger surface currents. On the majority of the images it will be im-possible to detect this current pattern because of the lack of sufficient bit depth (coding bits) in the study ar-eas; only occasionally could the small contrast in SST images associated with the current shear be detected using singularity analysis. This limitation is mainly due to restrictions in data coding aimed at reducing the total size of data files. For this reason we searched for ring-like structures appearing in singularity images that are not evident in SST ones. Notice that all de-tected currents typically have negative values, the most extreme of which are around –0.5 (indicating a sharp change in the temperature associated with a current shear, even if its amplitude may be small). As shown in Figure 1, some ring-like structures are visible in singu-larity maps in the area (see for instance the rings close to the Spanish coast on May 2 to 6); however, only a zonally elongated eddy-like shape with its centre at about 34°30´N, 9°W is visible in more than four con-secutive images without an evident signal in the SST maps, and it does not appear to be easily related to the regional circulation patterns. Notice that the values of
Fig. 2. – Singularity maps derived from OSTIA SST maps of Figure 1, arranged in the same order. The area where the possible DTA is detected is indicated with a red square.

MEDDY-LIKE ANOMALY AS DETECTED FROM SST MAPS • 233
SCI. MAR., 76S1, September 2012, 229-234. ISSN 0214-8358 doi: 10.3989/scimar.03619.19I
the singularity exponents over that ring are similar to the values observed in other currents (between –0.5 and –0.1; see Isern-Fontanet et al. [2007]); hence, de-tecting a meddy is not a problem of just establishing a threshold on the value of singularity exponents, but also of relating the suggested circulation pattern to the hydrographic structures evident in the image. A previ-ous cruise carried out in November 2007 indicated the presence of a meddy one degree to the northeast of that location. Given this limited evidence we decided that the structure was a good DTA candidate and a survey was conducted in this area.
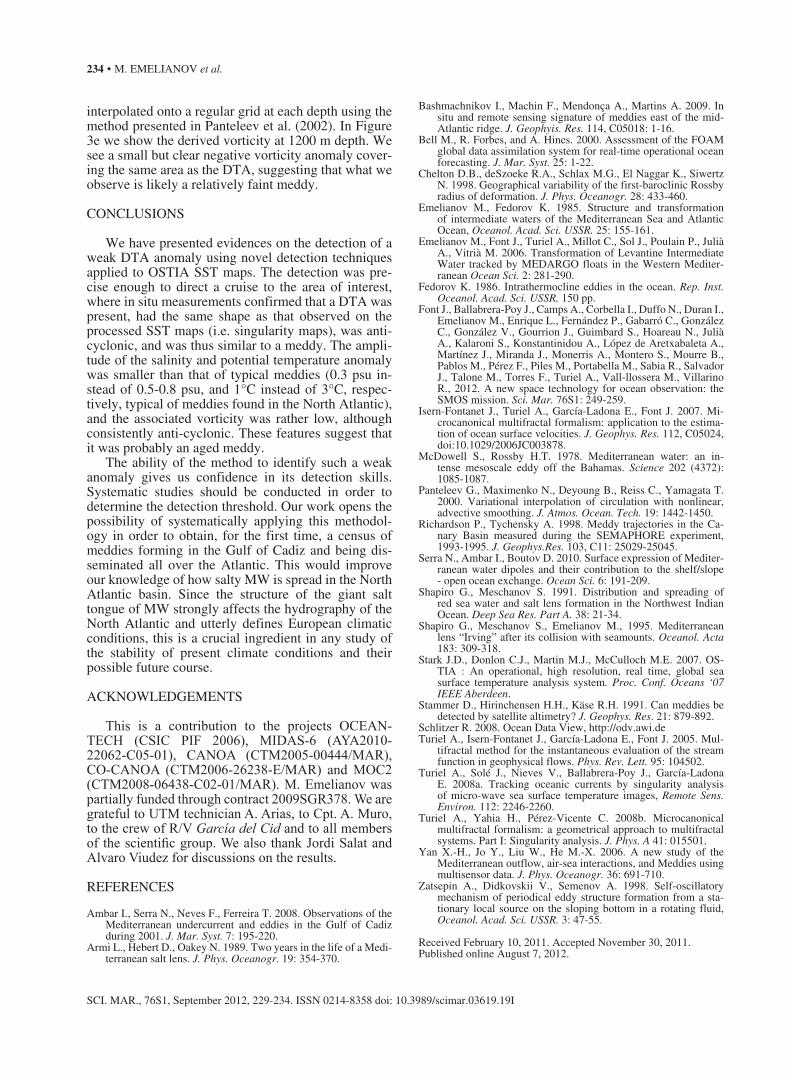
The DTA was located by in situ measurements in the area extending from 34º30´ to 35°N and from 8°30´ to 9°30´W, with a zonally elongated shape similar to the one observed on the singularity maps (see sampled area in Figure 3a). The main criterion for locating the
DTA was the lack of transformation of MW thermoha-line extrema (Emelianov and Fedorov 1985, Emelianov et al. 2006). The thermohaline MW positive anomaly (i.e. saltier and warmer waters) is well apparent in the spatial distribution of salinity and potential temperature at 1200 m depth (Fig. 3c,d) and in the splitting of CTD profiles obtained inside and outside the DTA (Fig. 3b).
To assess whether the DTA was a meddy we ex-amined current velocities obtained with the LADCP. To do this, a spectral vertical filter is applied to the velocity profiles in order to mask phenomena with a vertical wavelength lower than the vertical extension of the positive salinity anomaly, which is about 200 m. The cut-off vertical wave number is k=10k0, where k0 represents the minimum wave number of the cell with λ0=2040 m, that is, the height of the sampled water column. The filtered velocity profiles (Fig. 3d) are then
Fig. 3. – a) map of CTD stations; b) potential temperature distribution at 1200 m; c) salinity distribution at 1200 m; d) scattering of CTD data outside (blue) and inside (red) the DTA; e) interpolated velocities (m s–1) at 1200 m; f) vorticity (s–1) derived from the interpolated velocities
at 1200 m derived from LADCP data.
a) b)
c) d)
e) f)
234 • M. EMELIANOV et al.
SCI. MAR., 76S1, September 2012, 229-234. ISSN 0214-8358 doi: 10.3989/scimar.03619.19I
interpolated onto a regular grid at each depth using the method presented in Panteleev et al. (2002). In Figure 3e we show the derived vorticity at 1200 m depth. We see a small but clear negative vorticity anomaly cover-ing the same area as the DTA, suggesting that what we observe is likely a relatively faint meddy.
CONCLUSIONS
We have presented evidences on the detection of a weak DTA anomaly using novel detection techniques applied to OSTIA SST maps. The detection was pre-cise enough to direct a cruise to the area of interest, where in situ measurements confirmed that a DTA was present, had the same shape as that observed on the processed SST maps (i.e. singularity maps), was anti-cyclonic, and was thus similar to a meddy. The ampli-tude of the salinity and potential temperature anomaly was smaller than that of typical meddies (0.3 psu in-stead of 0.5-0.8 psu, and 1°C instead of 3°C, respec-tively, typical of meddies found in the North Atlantic), and the associated vorticity was rather low, although consistently anti-cyclonic. These features suggest that it was probably an aged meddy.
The ability of the method to identify such a weak anomaly gives us confidence in its detection skills. Systematic studies should be conducted in order to determine the detection threshold. Our work opens the possibility of systematically applying this methodol-ogy in order to obtain, for the first time, a census of meddies forming in the Gulf of Cadiz and being dis-seminated all over the Atlantic. This would improve our knowledge of how salty MW is spread in the North Atlantic basin. Since the structure of the giant salt tongue of MW strongly affects the hydrography of the North Atlantic and utterly defines European climatic conditions, this is a crucial ingredient in any study of the stability of present climate conditions and their possible future course.
ACKNOWLEDGEMENTS
This is a contribution to the projects OCEAN-TECH (CSIC PIF 2006), MIDAS-6 (AYA2010-22062-C05-01), CANOA (CTM2005-00444/MAR), CO-CANOA (CTM2006-26238-E/MAR) and MOC2 (CTM2008-06438-C02-01/MAR). M. Emelianov was partially funded through contract 2009SGR378. We are grateful to UTM technician A. Arias, to Cpt. A. Muro, to the crew of R/V García del Cid and to all members of the scientific group. We also thank Jordi Salat and Alvaro Viudez for discussions on the results.
REFERENCES
Ambar I., Serra N., Neves F., Ferreira T. 2008. Observations of the Mediterranean undercurrent and eddies in the Gulf of Cadiz during 2001. J. Mar. Syst. 7: 195-220.
Armi L., Hebert D., Oakey N. 1989. Two years in the life of a Medi-terranean salt lens. J. Phys. Oceanogr. 19: 354-370.
Bashmachnikov I., Machin F., Mendonça A., Martins A. 2009. In situ and remote sensing signature of meddies east of the mid-Atlantic ridge. J. Geophyis. Res. 114, C05018: 1-16.
Bell M., R. Forbes, and A. Hines. 2000. Assessment of the FOAM global data assimilation system for real-time operational ocean forecasting. J. Mar. Syst. 25: 1-22.
Chelton D.B., deSzoeke R.A., Schlax M.G., El Naggar K., Siwertz N. 1998. Geographical variability of the first-baroclinic Rossby radius of deformation. J. Phys. Oceanogr. 28: 433-460.
Emelianov M., Fedorov K. 1985. Structure and transformation of intermediate waters of the Mediterranean Sea and Atlantic Ocean, Oceanol. Acad. Sci. USSR. 25: 155-161.
Emelianov M., Font J., Turiel A., Millot C., Sol J., Poulain P., Julià A., Vitrià M. 2006. Transformation of Levantine Intermediate Water tracked by MEDARGO floats in the Western Mediter-ranean Ocean Sci. 2: 281-290.
Fedorov K. 1986. Intrathermocline eddies in the ocean. Rep. Inst. Oceanol. Acad. Sci. USSR, 150 pp.
Font J., Ballabrera-Poy J., Camps A., Corbella I., Duffo N., Duran I., Emelianov M., Enrique L., Fernández P., Gabarró C., González C., González V., Gourrion J., Guimbard S., Hoareau N., Julià A., Kalaroni S., Konstantinidou A., López de Aretxabaleta A., Martínez J., Miranda J., Monerris A., Montero S., Mourre B., Pablos M., Pérez F., Piles M., Portabella M., Sabia R., Salvador J., Talone M., Torres F., Turiel A., Vall-llossera M., Villarino R., 2012. A new space technology for ocean observation: the SMOS mission. Sci. Mar. 76S1: 249-259.
Isern-Fontanet J., Turiel A., García-Ladona E., Font J. 2007. Mi-crocanonical multifractal formalism: application to the estima-tion of ocean surface velocities. J. Geophys. Res. 112, C05024, doi:10.1029/2006JC003878.
McDowell S., Rossby H.T. 1978. Mediterranean water: an in-tense mesoscale eddy off the Bahamas. Science 202 (4372): 1085-1087.
Panteleev G., Maximenko N., Deyoung B., Reiss C., Yamagata T. 2000. Variational interpolation of circulation with nonlinear, advective smoothing. J. Atmos. Ocean. Tech. 19: 1442-1450.
Richardson P., Tychensky A. 1998. Meddy trajectories in the Ca-nary Basin measured during the SEMAPHORE experiment, 1993-1995. J. Geophys.Res. 103, C11: 25029-25045.
Serra N., Ambar I., Boutov D. 2010. Surface expression of Mediter-ranean water dipoles and their contribution to the shelf/slope - open ocean exchange. Ocean Sci. 6: 191-209.
Shapiro G., Meschanov S. 1991. Distribution and spreading of red sea water and salt lens formation in the Northwest Indian Ocean. Deep Sea Res. Part A. 38: 21-34.
Shapiro G., Meschanov S., Emelianov M., 1995. Mediterranean lens “Irving” after its collision with seamounts. Oceanol. Acta 183: 309-318.
Stark J.D., Donlon C.J., Martin M.J., McCulloch M.E. 2007. OS-TIA : An operational, high resolution, real time, global sea surface temperature analysis system. Proc. Conf. Oceans ‘07 IEEE Aberdeen.
Stammer D., Hirinchensen H.H., Käse R.H. 1991. Can meddies be detected by satellite altimetry? J. Geophys. Res. 21: 879-892.
Schlitzer R. 2008. Ocean Data View, http://odv.awi.deTuriel A., Isern-Fontanet J., García-Ladona E., Font J. 2005. Mul-
tifractal method for the instantaneous evaluation of the stream function in geophysical flows. Phys. Rev. Lett. 95: 104502.
Turiel A., Solé J., Nieves V., Ballabrera-Poy J., García-Ladona E. 2008a. Tracking oceanic currents by singularity analysis of micro-wave sea surface temperature images, Remote Sens. Environ. 112: 2246-2260.
Turiel A., Yahia H., Pérez-Vicente C. 2008b. Microcanonical multifractal formalism: a geometrical approach to multifractal systems. Part I: Singularity analysis. J. Phys. A 41: 015501.
Yan X.-H., Jo Y., Liu W., He M.-X. 2006. A new study of the Mediterranean outflow, air-sea interactions, and Meddies using multisensor data. J. Phys. Oceanogr. 36: 691-710.
Zatsepin A., Didkovskii V., Semenov A. 1998. Self-oscillatory mechanism of periodical eddy structure formation from a sta-tionary local source on the sloping bottom in a rotating fluid, Oceanol. Acad. Sci. USSR. 3: 47-55.
Received February 10, 2011. Accepted November 30, 2011.Published online August 7, 2012.